Abstract
The rising demand to efficiently acquire live production data has added more significance to automated monitoring and reporting within the industrial manufacturing sector. Real-time parts screening requiring repetitive human intervention for data input may not be a feasible solution to meet the demands of modern industrial automation. The objective of this study is to automatically classify and report on manufactured metal sheet parts. The metal components are mechanically suspended on an enamel paint-coating conveyor line in a household appliance manufacturing plant. At any given instant, the parts may not be in the exact coordinates within the desired area of interest and the classes of objects vary based on changing production requirements. To mitigate these challenges, this study proposes the use of a trained Mask R-CNN model to detect the objects and their associated class. Images are acquired in real-time using a video camera located next to the enamel coating line which are subsequently processed using the object detection algorithm for automated entry into the plant management information system. The highest achieved average precision obtained from the model was 98.27% with an overall accuracy of 98.24% using the proposed framework. The results surpassed the acceptable standard for the average precision of 97.5% as set by the plant production quality engineers.
1. Introduction
1.1. Background
Digital transformation within the industrial manufacturing sector has attracted significant attention due to the integration of Industry 4.0. However, this has posed several challenges within the manufacturing industry, especially where legacy systems are still being used. Challenges include organizational and technological structural requirements which are necessary to meet the demands of newer technologies. This has resulted in some industries not having reaped the full benefits of digitalization [1]. In the shift towards digital transformation within the manufacturing industry, data analytics and machine learning has become imperative to realize production process improvements. However, to utilize these methodologies to their full potential requires readily available data. The challenge of non-available data within the industrial process may be due to missing technological infrastructure or related software deployment costs needed for data extrapolation [2]. A conventional approach to acquire live plant data may include the use of paper-based instruments. However, these traditional techniques may lead to inaccuracies caused by human error [3,4]. Studies of human manual data capturing have indicated a 6.5% error rate, and for spreadsheet data entry it is expected to be in the range of 5% [5,6]. While this is relative to the amount of data and the complexity of the entered data, it was shown that the human error rate may even vary between 5% and 26.9% [7].
Object detection using computer vision within the manufacturing industry is being increasingly utilized to address the challenges previously mentioned. This is evident from the state of research surrounding object detection, which has increased rapidly over the last decade with several deep learning models being developed and adapted for industrial applications used in various industrial applications [8,9,10,11]. Notably, improved production rates were achieved when using a combination of computer vision and the robotics field [12,13,14]. Furthermore, an image processing technique that has received much attention in the literature is the Region-based Convolution Neural Network (Mask R-CNN), which was developed by the Facebook™ Artificial Intelligence Research (FAIR) group [15]. It has demonstrated remarkable results over existing single-model entries with the Common Object in Context (COCO) dataset being used as a benchmark. In this study, we propose its use for object detection of metal parts in a moving conveyor line.
1.2. Problem Definition
An enamel paint coating line within a household appliance manufacturing facility has relied heavily on human observation and feedback to determine the total number of parts produced in one production shift. This was achieved by manually counting and documenting the parts as they were taken off the conveyor line and stacked into a trolley to be transported to the desired assembly workstation. This study focuses on applying an object detection model to automatically recognize the total parts per group/class to achieve the required production information and improve efficiency. With a manufacturing process that has a changing number of classes and variations of the part’s physical orientation within the process line, the importance of investigating the use of an object detection model was identified. This study compared the computer vision models with average precision based on changes made to the learning rate and the intersection over union (IoU) thresholds. To the author’s knowledge, research on enamel paint-coated parts detection and classification has not been as prevalent in the literature, and this makes this application unique within similar industrial applications and the computer vision research community. Therefore, this research study proposes the Mask R-CNN model for metal parts detection and classification based on the results provided in the subsequent sections. During this case study, the industrial environment was controlled in terms of lighting, and a predetermined fixed distance between the objects of interest and the camera was maintained to achieve a high level of average precision. One of the main aims of this study was to achieve an average precision that was greater than 97.5% to be deemed as a viable solution to meet the industry standard for usable information within the business which was far superior to manual data entry.
The main contribution of this study is summarized as follows:
- We introduce a technique to automatically classify manufactured metal parts on an enamel paint-coating conveyor line, thus eliminating the need for repetitive human intervention.
- A trained Mask R-CNN model is proposed for object detection and classification tasks, which is a sophisticated deep learning technique known in the literature for its accuracy in detecting and segmenting objects in captured images.
- The study addresses the challenges of objects being outside the area of interest and shadows that distort the features of objects in an image.
- Based on production requirements, variability in different classes of objects is accounted for, meaning that the system can accurately adapt to changing production requirements.
- Finally, the proposed system achieves high average precision and overall accuracy to meet the stringent demands of quality requirements.
The article is organized as follows: Section 2 discusses the related works within the enamel coating process and the proposed Mask R-CNN object classification algorithm used for parts segmentation is discussed. Section 3 provides the methodology used in the specified industrial case study. Section 4 presents and discusses the findings of the experimental results. Section 5 provides recommendations for improvement and concludes the study.
2. Related Work
2.1. Traditional Methods for Object Detection on a Conveyor Line
For specific parts detection on a conveyor line, a common approach is to use Radio Frequency Identification (RFID) tags that are either attached to the product itself or the hanger on which the product is being conveyed. These tags are thermally armored to withstand the high temperature within the furnace after passing through the enamel coating process. This method does not apply to the industrial application in this paper, as an RFID tag would be required for each part which is not economically sustainable. In addition, due to workflow, quality, and company design standards, a single hanger was used to carry more than one product at any given instant; therefore, RFID tags were not a viable option. Alternatively, pattern recognition using light curtains may also be used to identify certain classes of objects as they pass through the light curtain. This is accomplished through target objects blocking the transmission of light to the receiving sensor. The different classes may be defined by the hardware or software configuration. This approach, however, resulted in very poor accuracy due to the parts being in very close proximity to each other. As a result, the use of human intervention for manual data was instated. This archaic approach introduced inaccuracies and significant delays which hindered the process.
2.2. Computer Vision Approaches for Object Detection in the Manufacturing Industry
Research reported in [16], proposed the use of an Artificial Neural Network (ANN) model developed for fault detection on specular painted surfaces of automobiles. The author proposes Histogram of Orientated Gradients (HoG) feature vectors of a 20 × 20 image patch to train the ANN model. This approach could provide a clear distinction between dirt, scratch and no defect classes. Superior results were obtained using images that had a higher contrast, namely images with a darker background and brighter defects. However, the author did note that the ANN model could not classify images of metallic surfaces with small irregular spots or blemishes in a reliable manner and further suggests that the algorithm could be improved for images that are noisy. In a similar application, ref. [17] proposed the use of deflectometry and vision-based technologies to overcome the problem of specular defects on vehicle body surfaces. They proposed a two-stage algorithm, in which the first was developed to enhance the image contrast between the image pixels with high-level and low-level intensity to distinguish between the presence of defects or lack thereof. For the second step, they present localized directional blurring to provide background exclusion. More recently, ref. [18] presented the results of an automatic surface defect inspection using machine vision methods. The proposed automatic inspection system extracts candidate defective regions which are classified according to dents, scratches and pseudo-defects with their relative shape, size and divergent features. A Support Vector Machine (SVM) was used in the classification of each class.
In [19], computer vision techniques were used to identify defective parts on an assembly line. The captured images were preprocessed to remove background artifacts, reduce noise, correct orientation, and provide scaling for further processing. Objects of interest were then extracted based on their unique contours and centroid distance computations. Lastly, the detection results were based on the objects’ similarity rating to other stored predefined model shapes and likeness matching.
In another industrial application, machine vision was used to provide robot guidance in a collaborative framework. The authors in [20] highlighted the importance of computer vision as an effective tool for developing autonomous systems that enable collaborative work between humans and industrial robots, thereby improving the robotic device positioning accuracy as tasks become increasingly complex.
2.3. Applications of Mask R-CNN-Based Vision Systems
The use of instance segmentation models within industry can vary in applications from quality control to counting and size estimation of an object and represents one of the classic tasks in computer vision. Essentially image segmentation can be considered as a clustering problem. A study focusing on detecting florae in aerial images showed that the Mask R-CNN model was not only effective in counting but was also able to determine the size of each vegetable based on the segmentation mask, achieving a detection accuracy of ~78% for potatoes and ~98% for lettuces [21]. In another study [22], a Mask R-CNN model was used to identify, and segment manufactured parts in an assembly line. The parts were recognized and segmented with an accuracy of 87.5%. Recently, in a study conducted by [23], the challenge of accurate instance segmentation to determine tree density within a forest was highlighted. While the paper does not consider the approach of utilizing a Mask R-CNN model, the challenge presented shows similarity within the manufacturing industry for determining the utilization of space on an assembly line or a hanger as in the case of this study.
In [24], the study involved counting livestock using the Mask R-CNN model. In all the defined categories, it resulted in an Average Precision (AP) of ~95% and an overall accuracy of ~93%. In comparison to other approaches, such as the You Only Look Once (YOLOv3), Faster R-CNN and Single Shot Multibox Detector (SSD), it was the superior model [24]. Further, in a research study based on counting bacterial growth within a petri dish whereby the illumination was controlled throughout the experiment, the highest scoring model was achieved using Mask R-CNN. Interestingly, it achieved an AP of 93.8% and a mean absolute percentage error of 2.3% [25].
In another unique study based on pest identification and counting, a modified version of the Mask R-CNN model was used. The model was able to increase AP to 80.2% from 79.6% and was the highest-scoring model when compared to Faster R-CNN, YOLO and SSD500 [26]. Finally, in a study conducted by [27], the application of Mask R-CNN for defect identification in printed circuit boards (PCBs) was evaluated. Two different datasets were used to test the efficacy of the model which included missing vias and electrical short-circuits of copper tracks on the PCB layers. An impressive high accuracy within the range of 95% and 99% was achieved. Hence, based on the diverse range of applications that the Mask R-CNN model has successfully been applied, we propose its use in this paper.
2.4. The Mask R-CNN Model
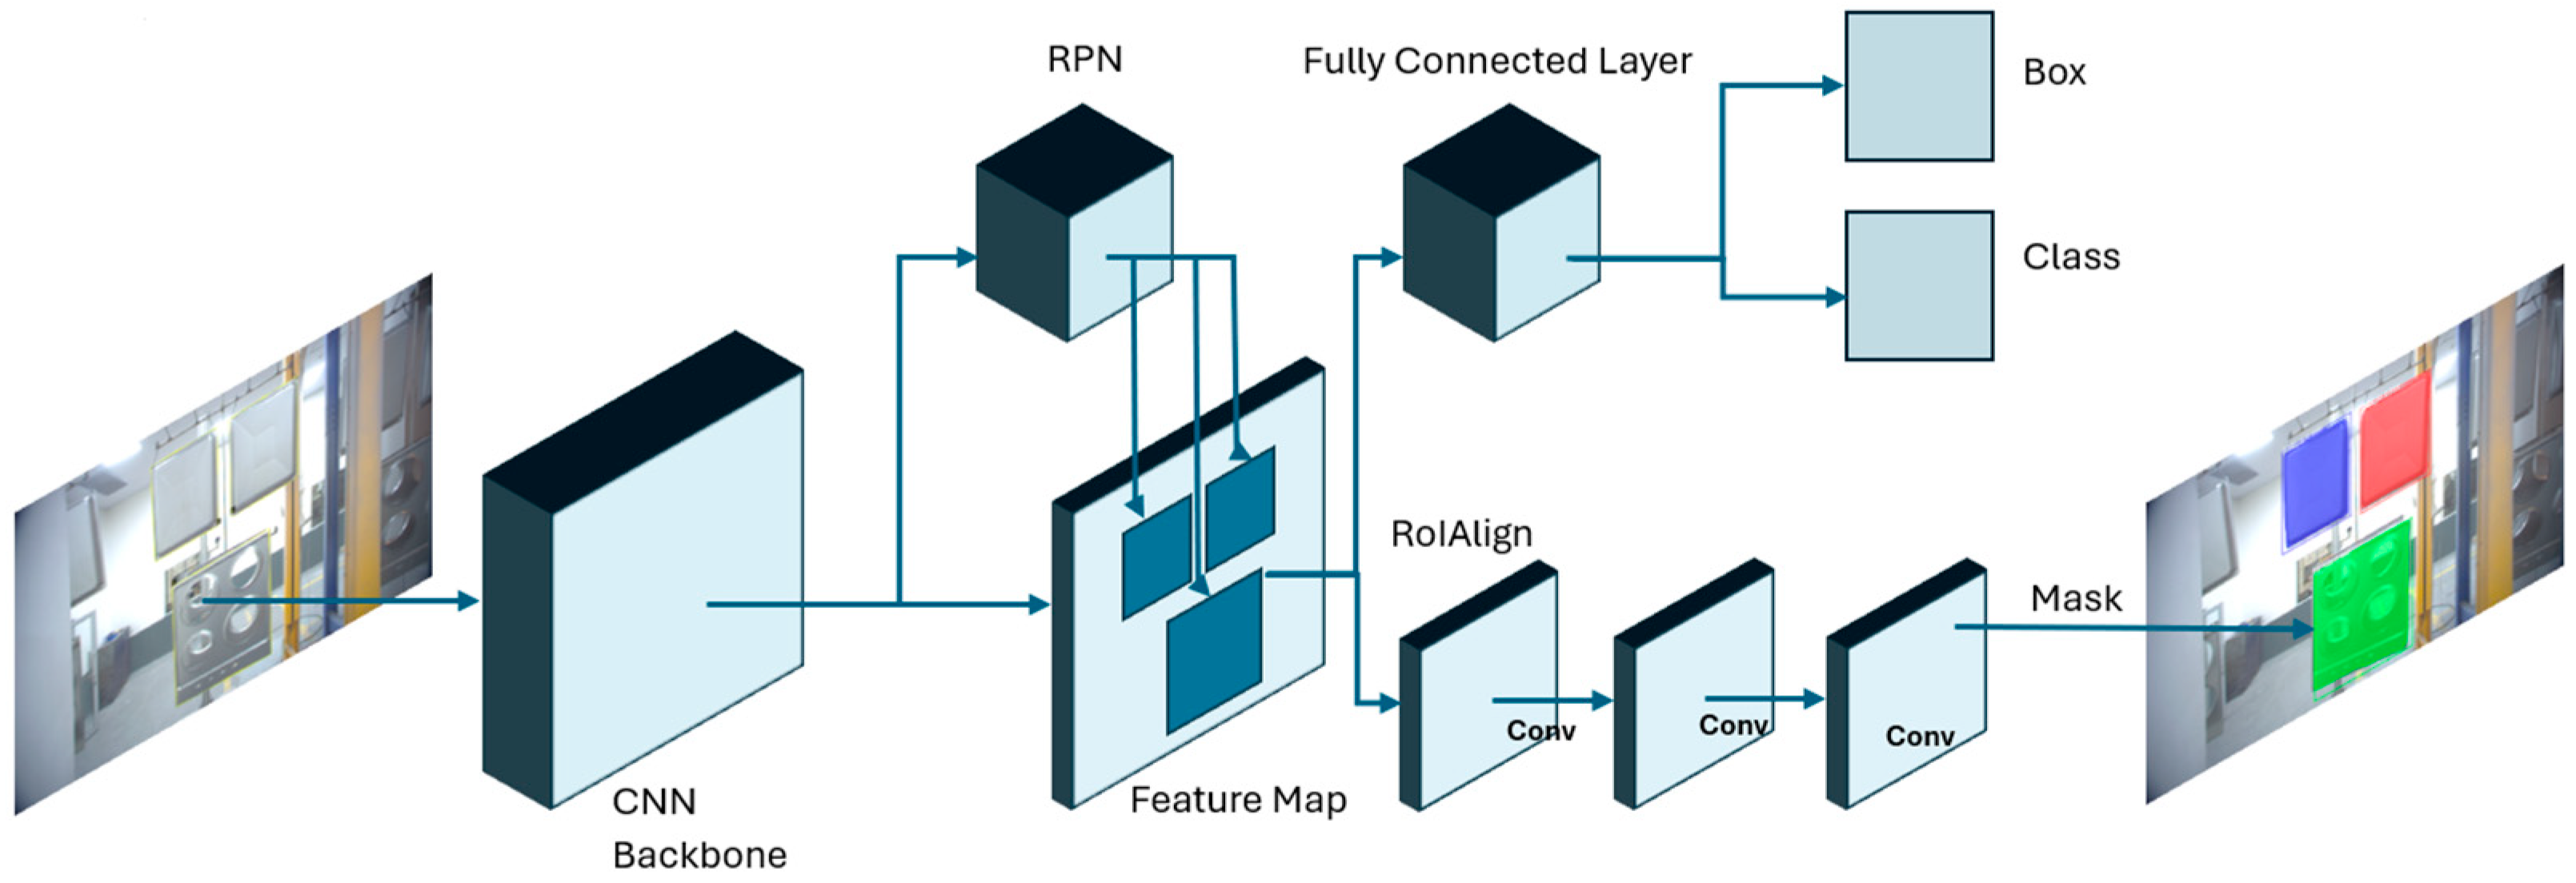
As shown in Figure 1, the Mask R-CNN is a deep learning model that can achieve pixel-wise instance segmentation through the combination of object detection and semantic segmentation [15]. This model is an extension of Faster R-CNN by the addition of the mask branch. The addition of this branch performs the task of predicting the segmentation mask of each Region of Interest (RoI). This task is executed in parallel with the existing branch from Faster R-CNN that performs the task of classification and bounding box regression. The backbone used for feature extraction is Residual Neural Networks (ResNet) with the addition of the Feature Pyramid Network (FPN). The Region Proposal Network (RPN) performs the task of generating region proposals that may possibly contain the object of interest [28]. Once the region proposals are generated, the Region of Interest Align (ROIAlign) layer performs the task of extracting features from the feature map. Mask R-CNN was chosen for this study’s application since it is capable of instance segmentation [29]. With instance segmentation, objects within an image can be split into their respective detected classes as a single object and not a part of a set of objects as one class [30]. This would enable the detection of individual parts from a production line. The notable change of Mask R-CNN in comparison with Faster R-CNN was the replacement of the ROI (Region of Interest) pool with ROI Align, which would handle the misalignment and data loss between the input image and feature maps [15].

Figure 1.
Mask R-CNN algorithm framework for parts detection.
2.4.1. Feature Pyramid Network
The FPN plays an important role in extracting features from an image that form part of the CNN backbone, as shown in Figure 1. The feature extractor performs the task of taking a single image of an unknown scale as the input image and outputs feature maps at multiple levels [31,32]. The low-level feature maps includes information such as edges, colour and textures while high-level feature maps includes information such as the object parts or the object itself. This multi-scaled feature map includes information from all the different levels forming a set that has rich semantic data [33]. The bottom-up pathway uses ResNet as its backbone which is used to structure the bottom-up pathway and is comprised of convolution modules. The ResNet module proposed in 2015 [34] has greatly improved the accuracy of image classification. The advantage of ResNet is the ability for a model to be trained at a deeper level within neural networks [35]. A degradation problem was exposed when deeper networks started to converge. With the network depth increase, accuracy was decreased due to saturation. ResNet was proposed to solve this issue leading to better accuracy with a deeper network [34].
2.4.2. ROI Align
In contrast to Faster R-CNN is ROI Pooling, which is an operation that is used to extract feature maps from a ROI. Faster R-CNN was not designed for pixel-to-pixel alignment using ROI Pooling, which performs stride quantization resulting in misalignment and loss of data. While ROI Pooling may not affect classification, it does have a negative impact with regard to predicting the masks generated for each pixel of the object [15]. With ROIAlign, there is no quantization that is applied. This eliminates misalignment and data loss between the extracted features with the inputs [15]. Bilinear interpolation is used to calculate the values at four locations within the bin location of each RoI. The final value is achieved by the maximum or average of those values [15].
2.5. Other Object Classification Models
Faster R-CNN is an object detection model that integrates object detection and region proposal into one network. Faster R-CNN builds on Fast R-CNN and the earlier R-CNN models by introducing the RPN that is used in Mask R-CNN. RPN performs the task of generating region proposals [28]. The regions are proposed using a sliding window approach. For each window, the RPN identifies ROIs. The proposal regions are then cropped from the feature maps and sent to a final detection network. This classifies each region and generates the bounding box coordinates.
In consideration of other approaches, the U-Net model is based on a modified Fully Convolution Network (FCN) such that it may work with limited training images with the outcome of higher precise segmentation within the image [36]. The model was designed for image segmentation with a specific focus on the biomedical field. The network architecture comprises a contracting path and an expansive path. The contracting path consists of repeated convolutions, each followed by a rectified linear unit (ReLu) and a max pooling operation used to increase feature complexity. The expanding path combines the features through upsampling [36]. YOLOv3 builds on previous models by introducing several enhancements and a new classification network [37]. YOLOv3 is a single-shot detector as compared to Mask R-CNN, which is accomplished by predicting bounding boxes using dimensional clusters as the anchor boxes in the model. The network can predict the coordinates of the bounding box by using logistic regression. Each class is predicted from the bounding box, which has shown improved performance compared to its predecessors [37]. You Only Look at Coefficients (YOLACT) is a real-time instance segmentation model that is used to detect and segment objects within an image. The instance segmentation task is achieved in two steps, namely, generating the prototype masks and predicting the per instance mask coefficients. The masks are generated by combining the prototypes with the mask coefficients [38]. The model leverages the FPN for robust feature extraction while FCN is used to produce the prototype masks [38].
3. Methodology
3.1. Proposed Framework
This research study followed the framework outlined in Figure 2. Image datasets were collected using the cameras that were mounted on either side of the monorail and an automated script that executed on a dedicated computer to capture the images with a pixel size of 1920 × 1200 once the object hanger passed a proximity sensor. These images were then split into their respective class folders following the training, validation, and testing ratio of 80:10:10. Each group of images was then manually annotated using VGG Image Annotator (VIA) [39]. This tool can create bounding boxes of the object which were subsequently used as the ground truth images during model training, validation, and testing. The Mask R-CNN model used during the training, testing and validation phases was downloaded from a GitHub repository, with the link provided in the Supplementary Materials section of this paper. Hyperparameters were adjusted for the model and prior to model training, the images were augmented using fixed values. The trained model was executed using the validation dataset to evaluate its performance. The efficacy of the model was calculated using the precision–recall curve and the confusion matrix to compute the average precision and the overall accuracy of each model at different thresholds. The outcome was analyzed followed by an iterative process of re-adjusting the hyperparameters until the optimal parameters were established.
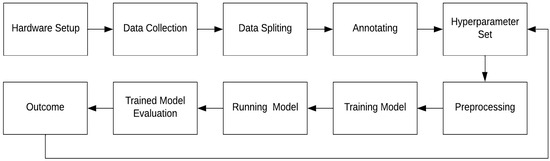
Figure 2.
Experimental object detection framework.
3.2. Image Dataset Manipulation
The required images were gathered using a simple Python-coded script to capture live images from a camera once the conveyor hanger activates an adjacent photoelectric sensor. A digital input signal was received by a Moxa® ioLogik E1200 I/O module once the hanger triggered the photoelectric sensor. The digital input module was connected to a network switch over ethernet communication protocol. The digital input signal was translated as a trigger signal using the Python script and was sent back to the camera through ethernet. The image was captured and stored on the computer’s hard drive, to be processed. The experimental setup executed for one production run to gather the required images which were subsequently used to train the Mask R-CNN model. Table 1 shows the number of data that was split into train, validation, and test datasets (ratio of 80:10:10, respectively). The model had varying amounts of data per class to monitor if there was a difference in identified parts as detailed by the resultant confusion matrix. It should be noted that the difference in percentage per class collected correlates to the percentage seen from the production line at a given production run. This was carried out intentionally to detect any issues if training images could be collected in one production run with no special requirements to perform data captures after the production run. This would also provide insight into having an unbalanced dataset and how it may affect results.

Table 1.
Dataset split.
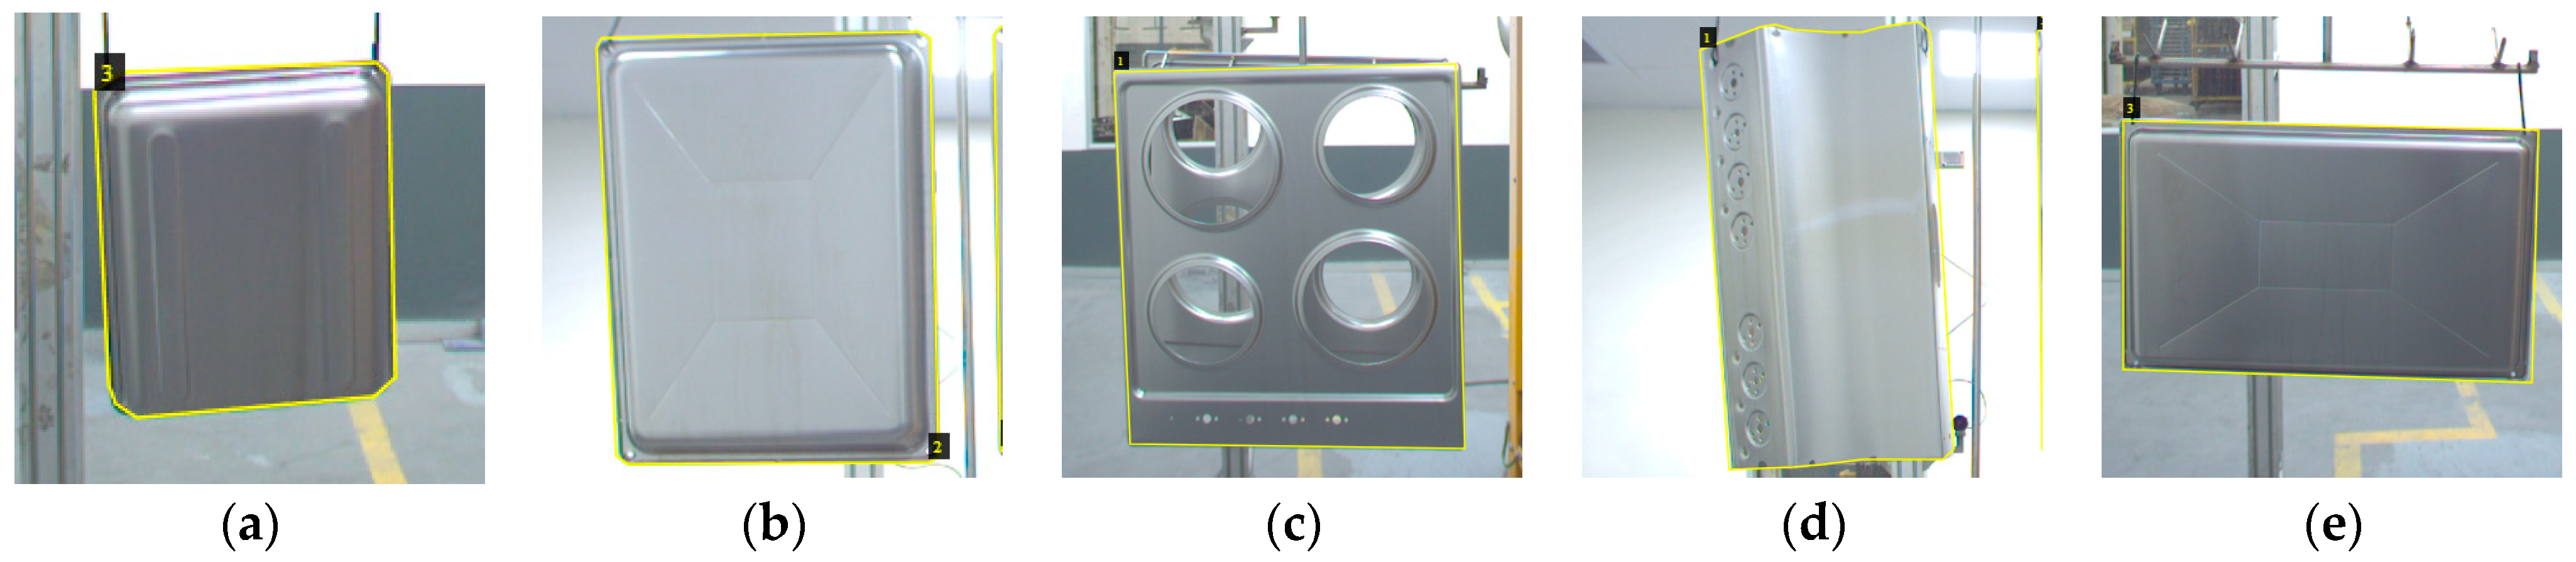
The VIA application used to annotate the objects from the images is a lightweight web-based application that can separate each object into its respective class and save the data as a ‘JSON’ file. Figure 3 shows acquired images of the manufactured target objects with their annotated lining around each object of interest.
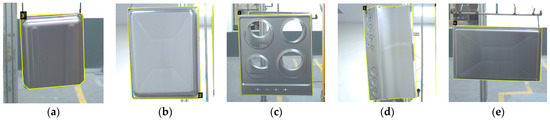
Figure 3.
(a) Class A object; (b) Class B object; (c) Class C object; (d) Class D object; (e) Class E object.
3.3. Image Preprocessing
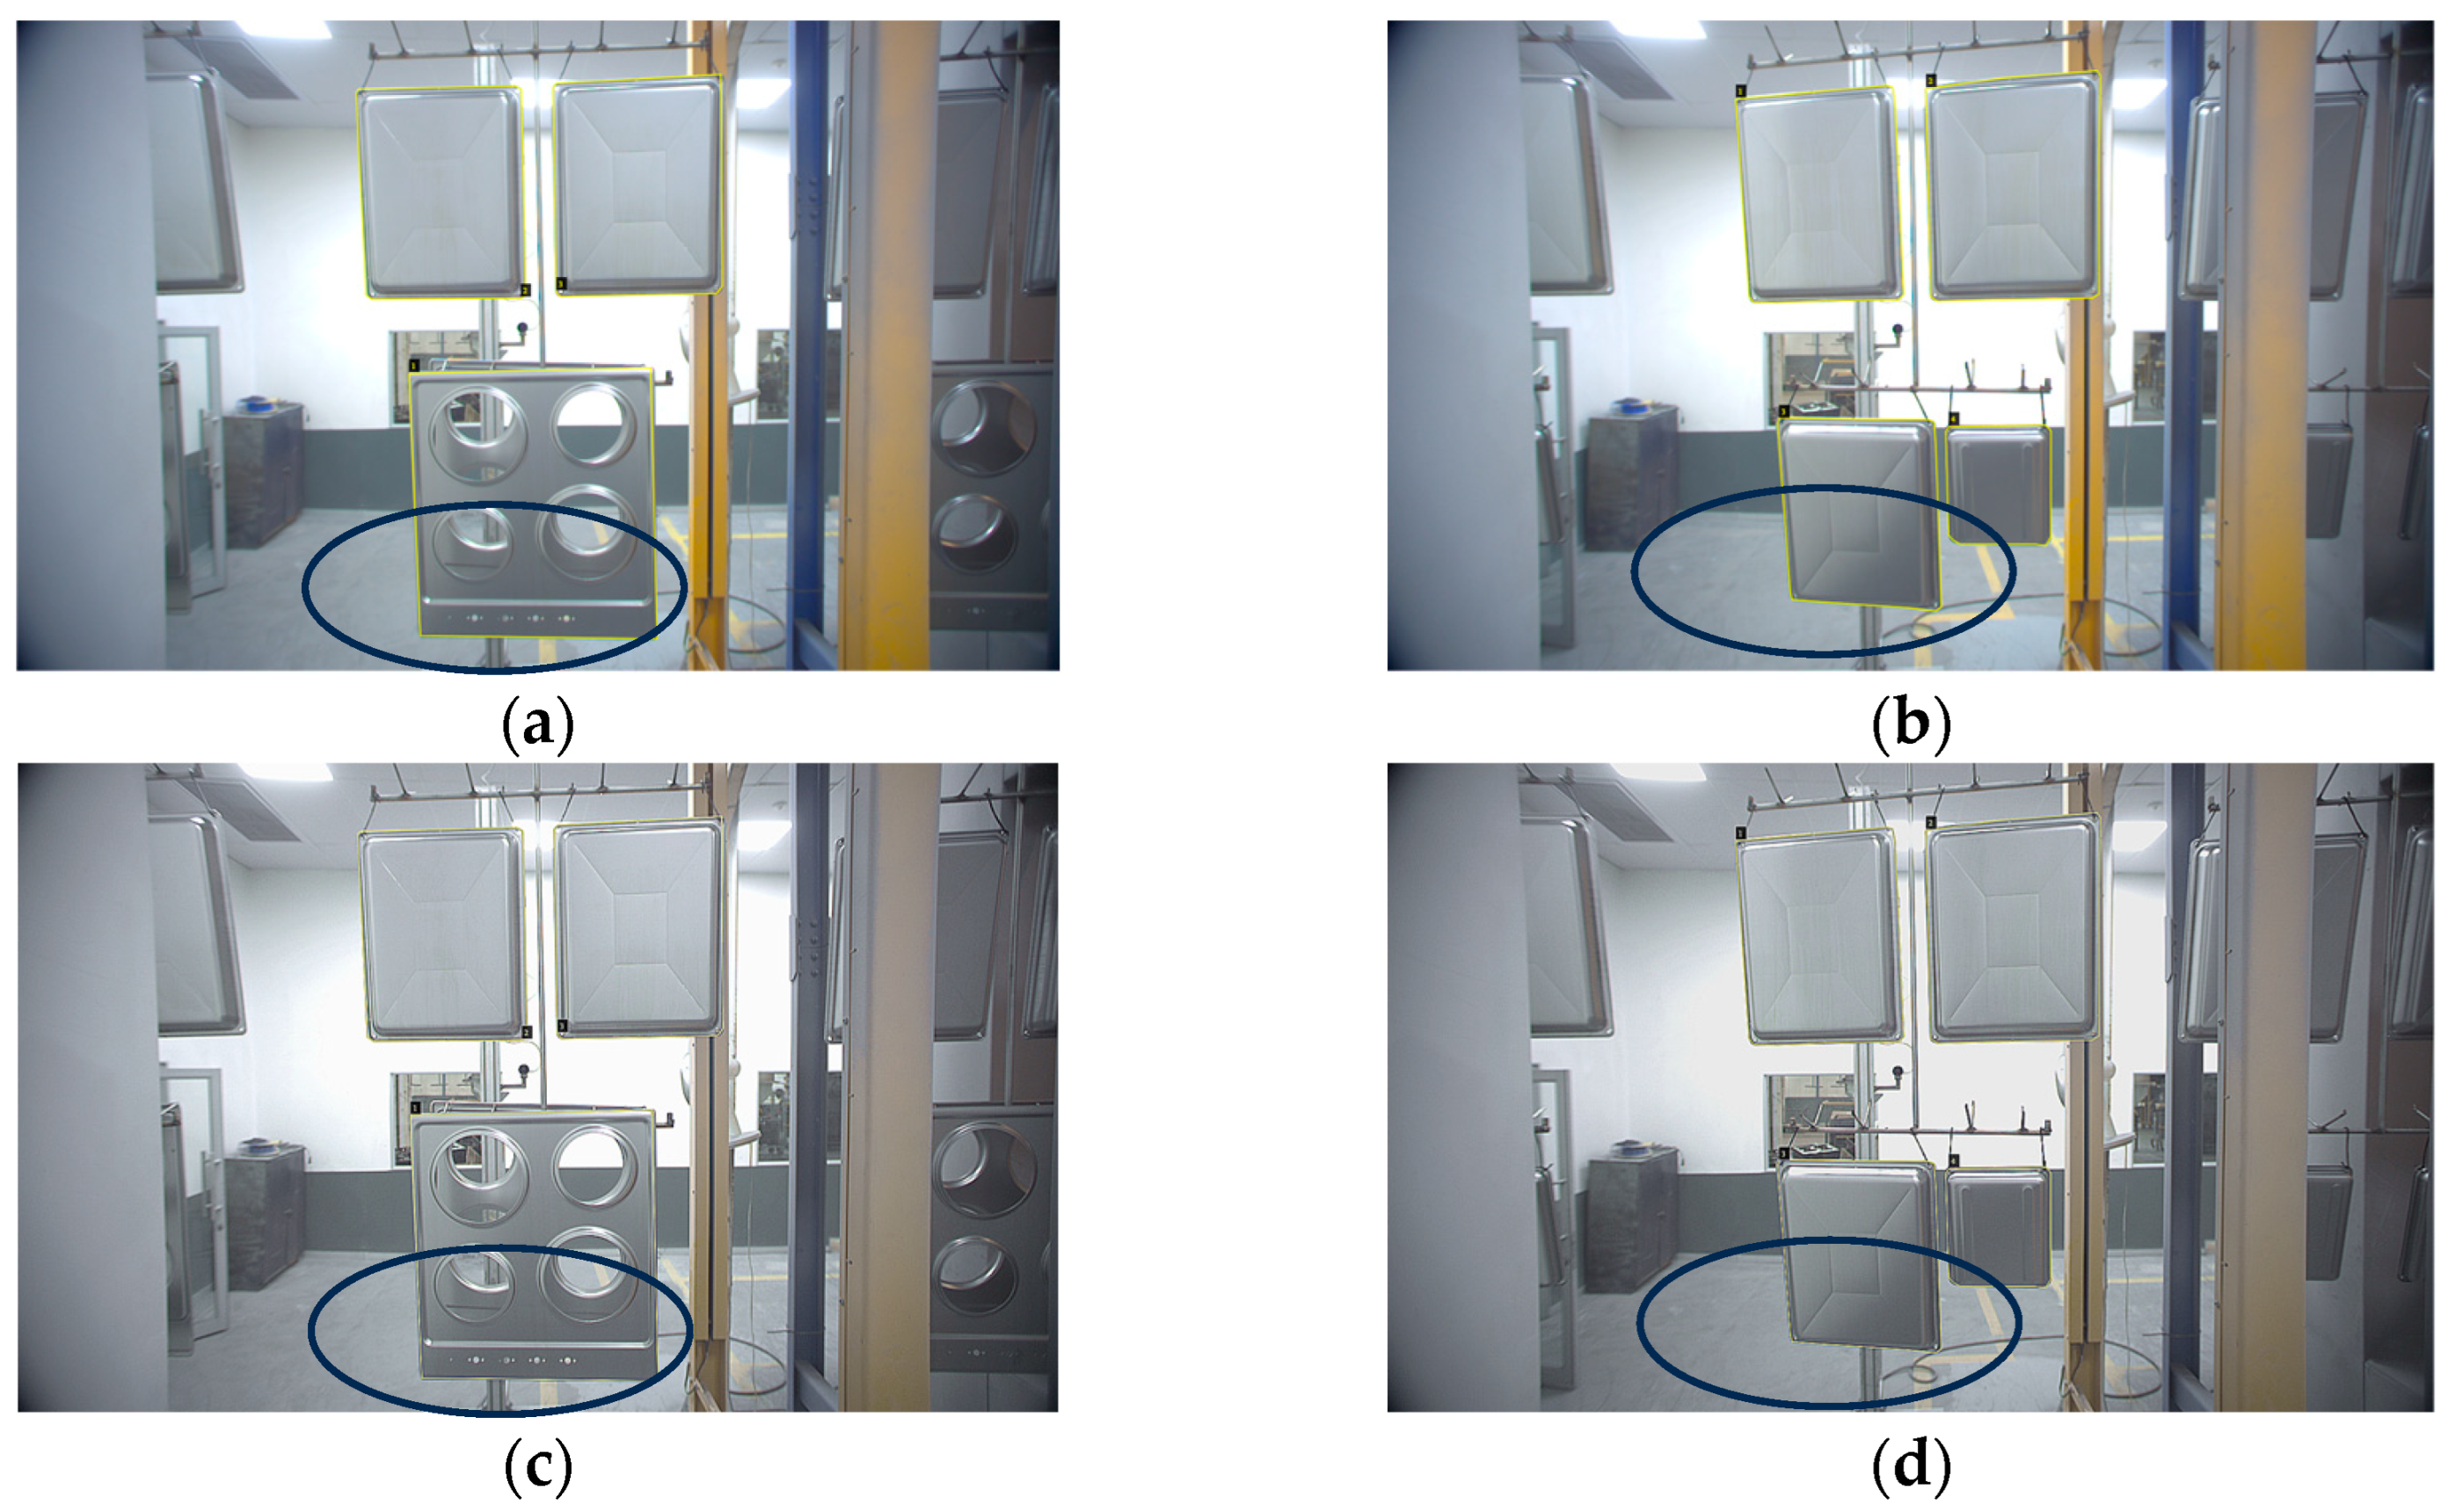
Images went through several preprocessing techniques, which included adding data augmentation parameters, as shown in Table 2. The preprocessing techniques were applied sequentially. It should be noted that the images were augmented in a fixed arrangement to ensure stability with results after testing. This defines the sequence of augmentation techniques that need to be applied to each image. The sequence of augmentation was applied according to Figure 4. The lighting conditions were controlled during the collection of training, validating and testing datasets; however, due to the slight angle formed as the object was suspended from the conveyor hanger, the brightness was increased to minimize the loss of detail due to this challenge. Saturation, grayscale and sharpness were increased until defined metal folds and edges from the objects of interest were noticeable. The final values from the experimental results are shown in Table 2.
Table 2.
Image preprocessing.

Figure 4.
(a,b) Raw images with shadows circled; (c,d) Augmented images with improved object details.
3.4. Mask R-CNN Model Selection
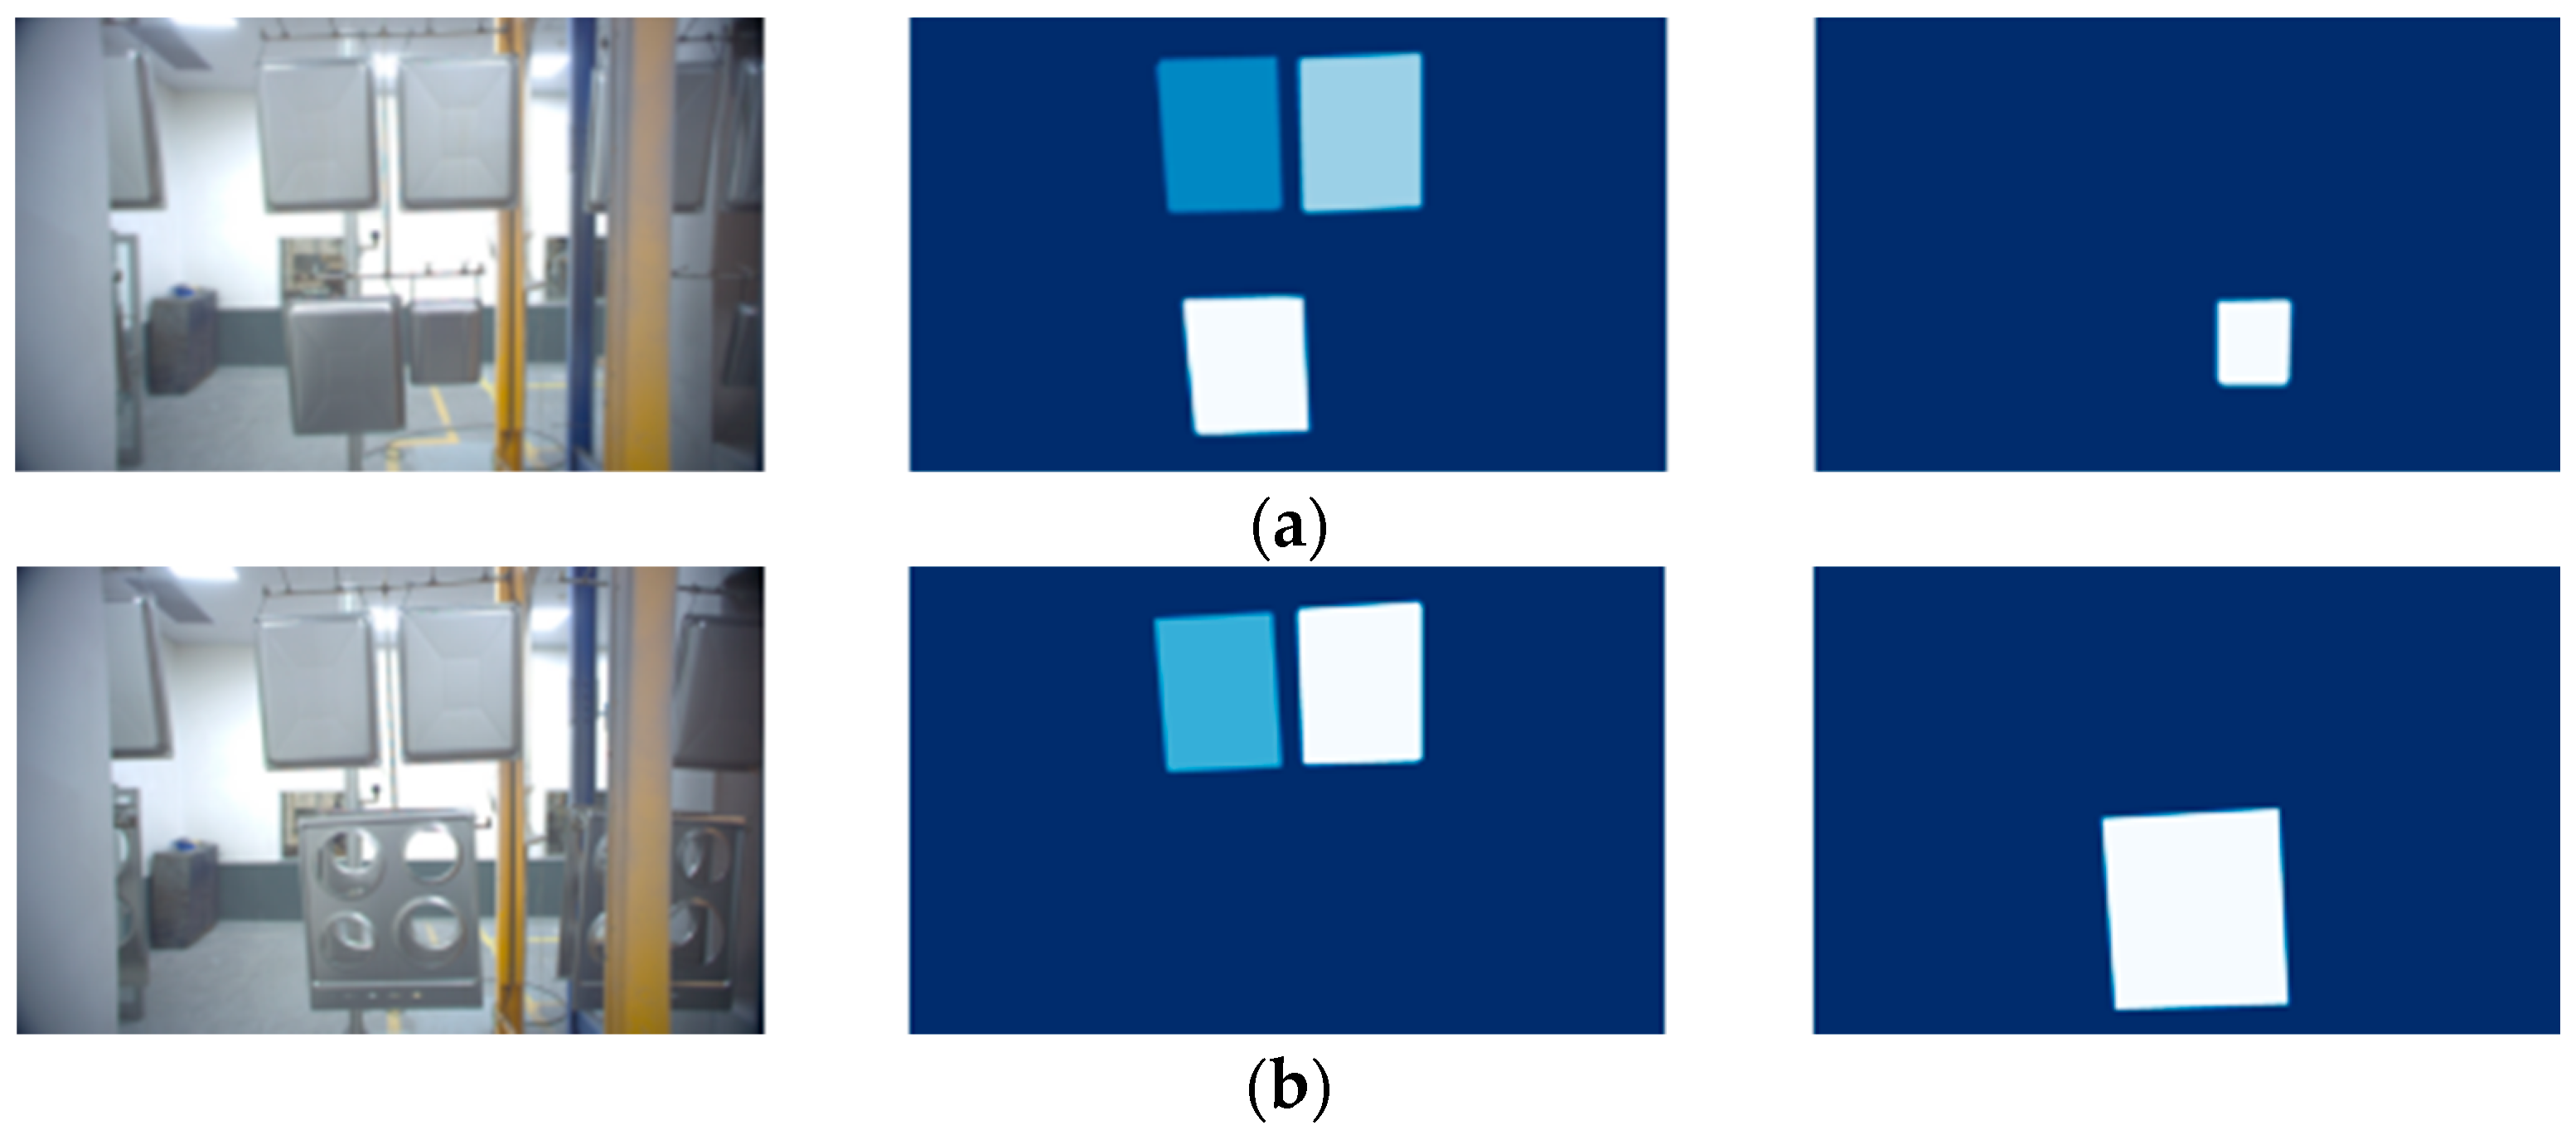
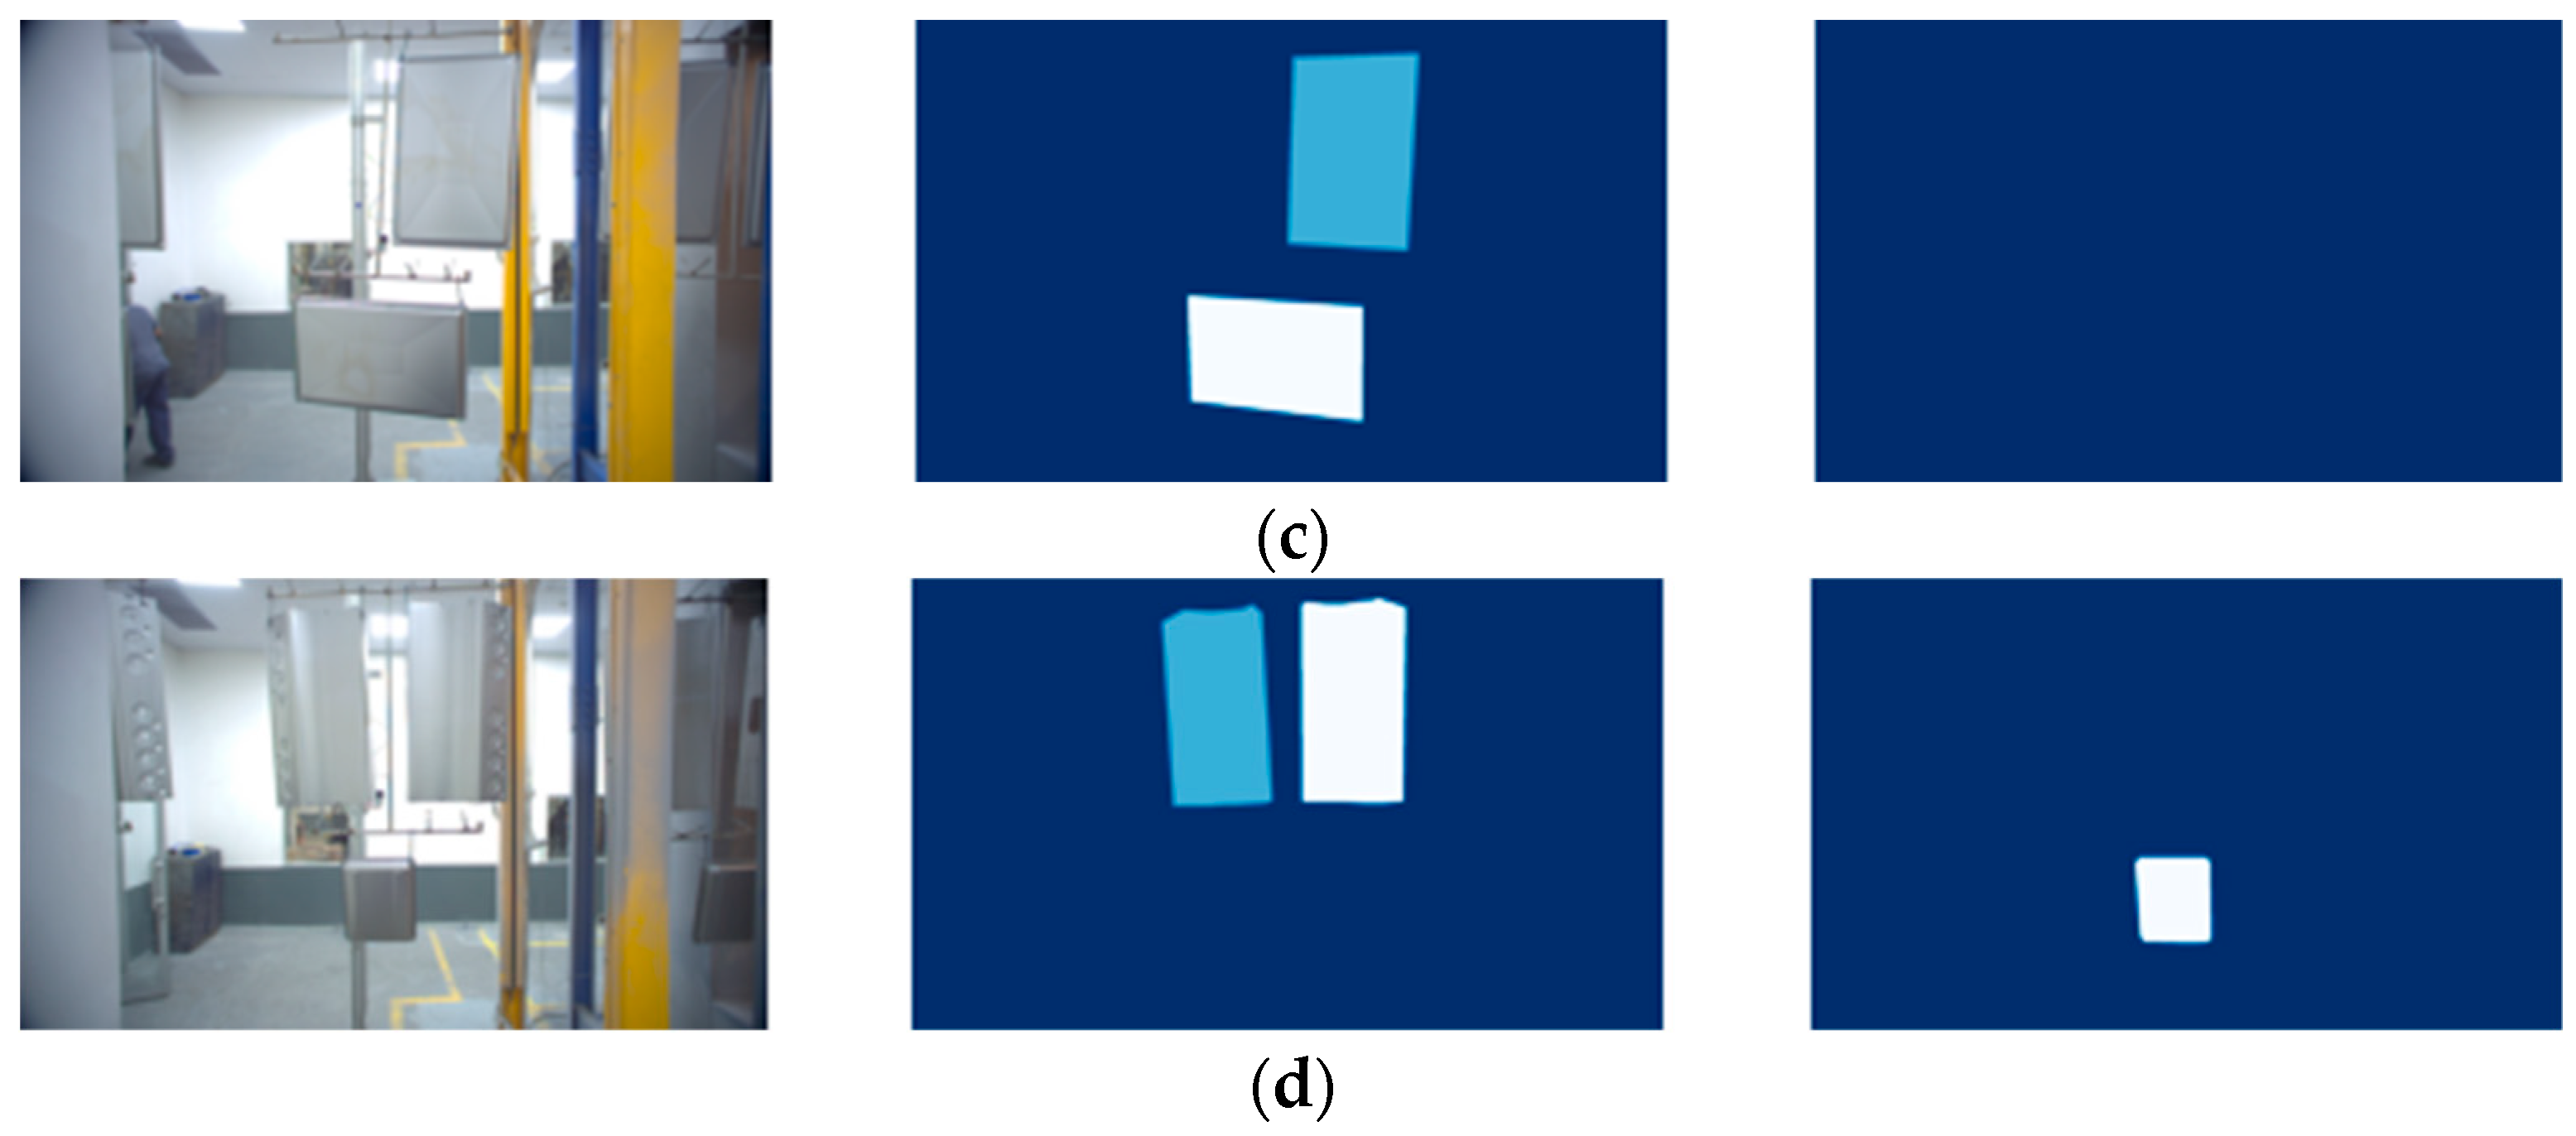
Figure 5 illustrates how the model segments an image into its class of objects with its corresponding mask as generated by VIA. Each class is grouped together separately from the other classes in a single pane that belongs to the same image. This is applied to every annotated image that is fed into the model during the training phase. With the isolation of each class, the model is able to learn the characteristics of each object class. Mask R-CNN combines all losses to calculate the total multi-task losses. Finally, the isolation in classes is used to calculate the mask losses for each class independently [15].
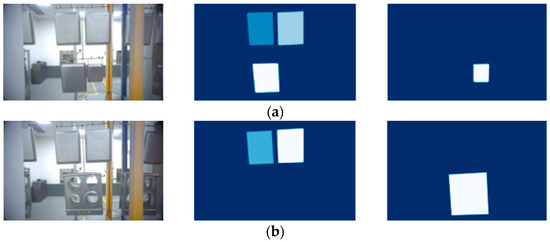

Figure 5.
(a) The second panel contains class B and the third panel contains class A; (b) the second panel contains class B and the third panel contains class C; (c) the second panel contains class E and the third panel contains no class; (d) the second panel contain class D and the third panel contains class A.
3.5. Default Hyperparameter Settings
Table 3 provides the default hyperparameters that were used in the model training. The number of epochs, which is a full pass over the entire training set, was set to 10. The steps per epoch were calculated by using the training dataset divided by the batch size which is the number of training images used in one training step. A weight decay of 0.0001 was used to reduce overfitting of the model by the addition of a penalty value allowing the model to generalize acceptably. The learning momentum accelerates the optimization of the model through increased stability of gradient descent.
Table 3.
ResNet101 hyperparameter settings.
4. Experimental Results and Analysis
4.1. Experimental Hardware Configuration
The hardware consisted of two cameras mounted on each side of the conveyor monorail facing the objects of interest as illustrated with a block diagram in Figure 6. A Basler™ ACE acA1600-40gc CMOS camera (Basler™, TANDM Technologies (Pty) Ltd., Cape Town, South Africa) was chosen for image acquisition due to it delivering 2 MP resolution images at 60 frames per second. The computer used to perform the training and testing with the Mask R-CNN model was equipped with an Nvidia® GTX 1650 4 GB with 32 GB of RAM running an AMD® Ryzen 5 3600 6-Core processor. There was a generic retroreflective sensor used as a trigger to capture the images whenever the hanger passed a fixed point. The sensor was connected to a Moxa® ioLogik E1200 I/O module that was connected to the computer. Figure 7 illustrates the hardware setup in the field.
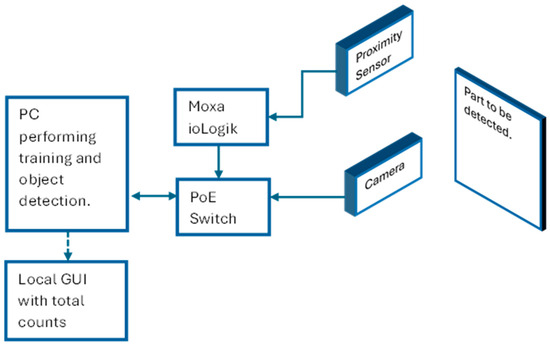
Figure 6.
Hardware configuration of the field devices.
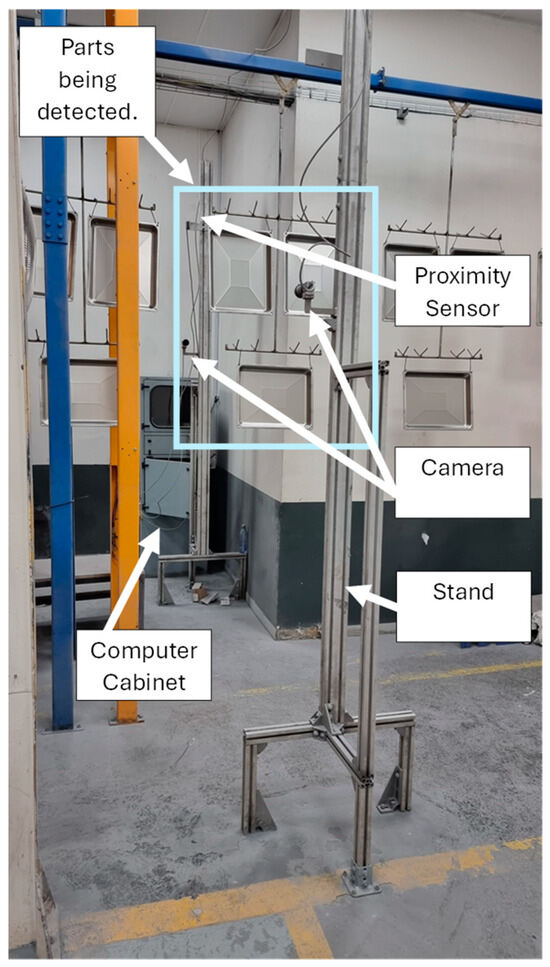
Figure 7.
Experimental setup of the image capturing system.
4.2. Ambient Light Conditions
It was noted that ambient lighting plays a significant role in identifying the edges of an object of interest [40,41,42,43,44,45]. Too intense lighting may overexpose an image and introduce blur, while inadequate lighting may not allow for adequate detail to be captured by the camera [44,45]. For these reasons, the cameras were installed in a controlled environment where illuminating conditions were maintained within an enclosed room with 8000 lumens per 20 square meters and a colour temperature of 4000 K.
4.3. Evaluation Criteria
In this study, Average Precision (AP) was the metric used to determine the efficacy of the model. To calculate this metric, the precision and recall values were needed to generate a precision versus recall comparison. The area under this curve shows the AP percentage per trained model. The AP calculated in this study is the average over all classes as mentioned in the COCO metrics description [46] and would thus traditionally be referred to as the Mean Average Precision (mAP).
The model precision is calculated as:
where True Positive (TP) represents the objects that were detected by the model and are the correctly detected class. False Positive (FP) represents objects that were incorrectly classified.
The recall of the model is given by:
where False Negative (FN) are objects with a positive class that were present in the image but were not detected by the model.
The area under the precision–recall curve represents the AP of the model, where p and r represent the precision and recall, respectively:
The results focus on the average precision of all trained models with a comparison to variations in the learning rate. The thresholds selected for the Intersection Over Union (IOU) were set to AP50, AP75, and AP90. The Mask R-CNN was able to produce the required results at an average precision percentage of 98.27% after fine-tuning the model, which is illustrated in Figure 8.
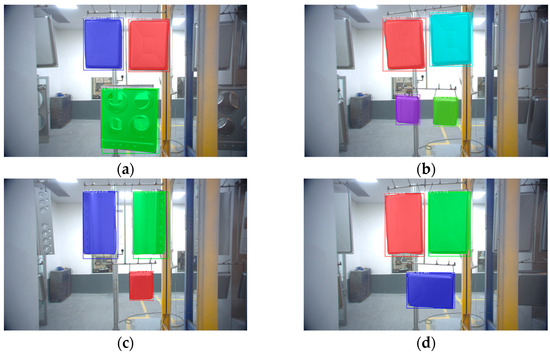
Figure 8.
(a) Positive detection of class B and C; (b) positive detection of class A and B; (c) positive detection of class A and D; (d) positive detection of class B and E.
4.4. Average Precision of the Model at Different Thresholds
The average precision metric is the most generic form method to determine its efficacy. Table 4 shows the average precision of the model at different IOU (intersection over union) thresholds. The learning algorithm would ignore the predicted objects at an IOU that is less than the threshold that was selected. The learning rate was selected at three setpoints and affects how quickly the model can adapt to the problem. A learning rate that is too high may cause learning to jump over the minimum while a learning rate that is too low might cause it not to converge or become ‘trapped’ at a local minimum relating to loss function.
Table 4.
Average Precision at varying learning rates.
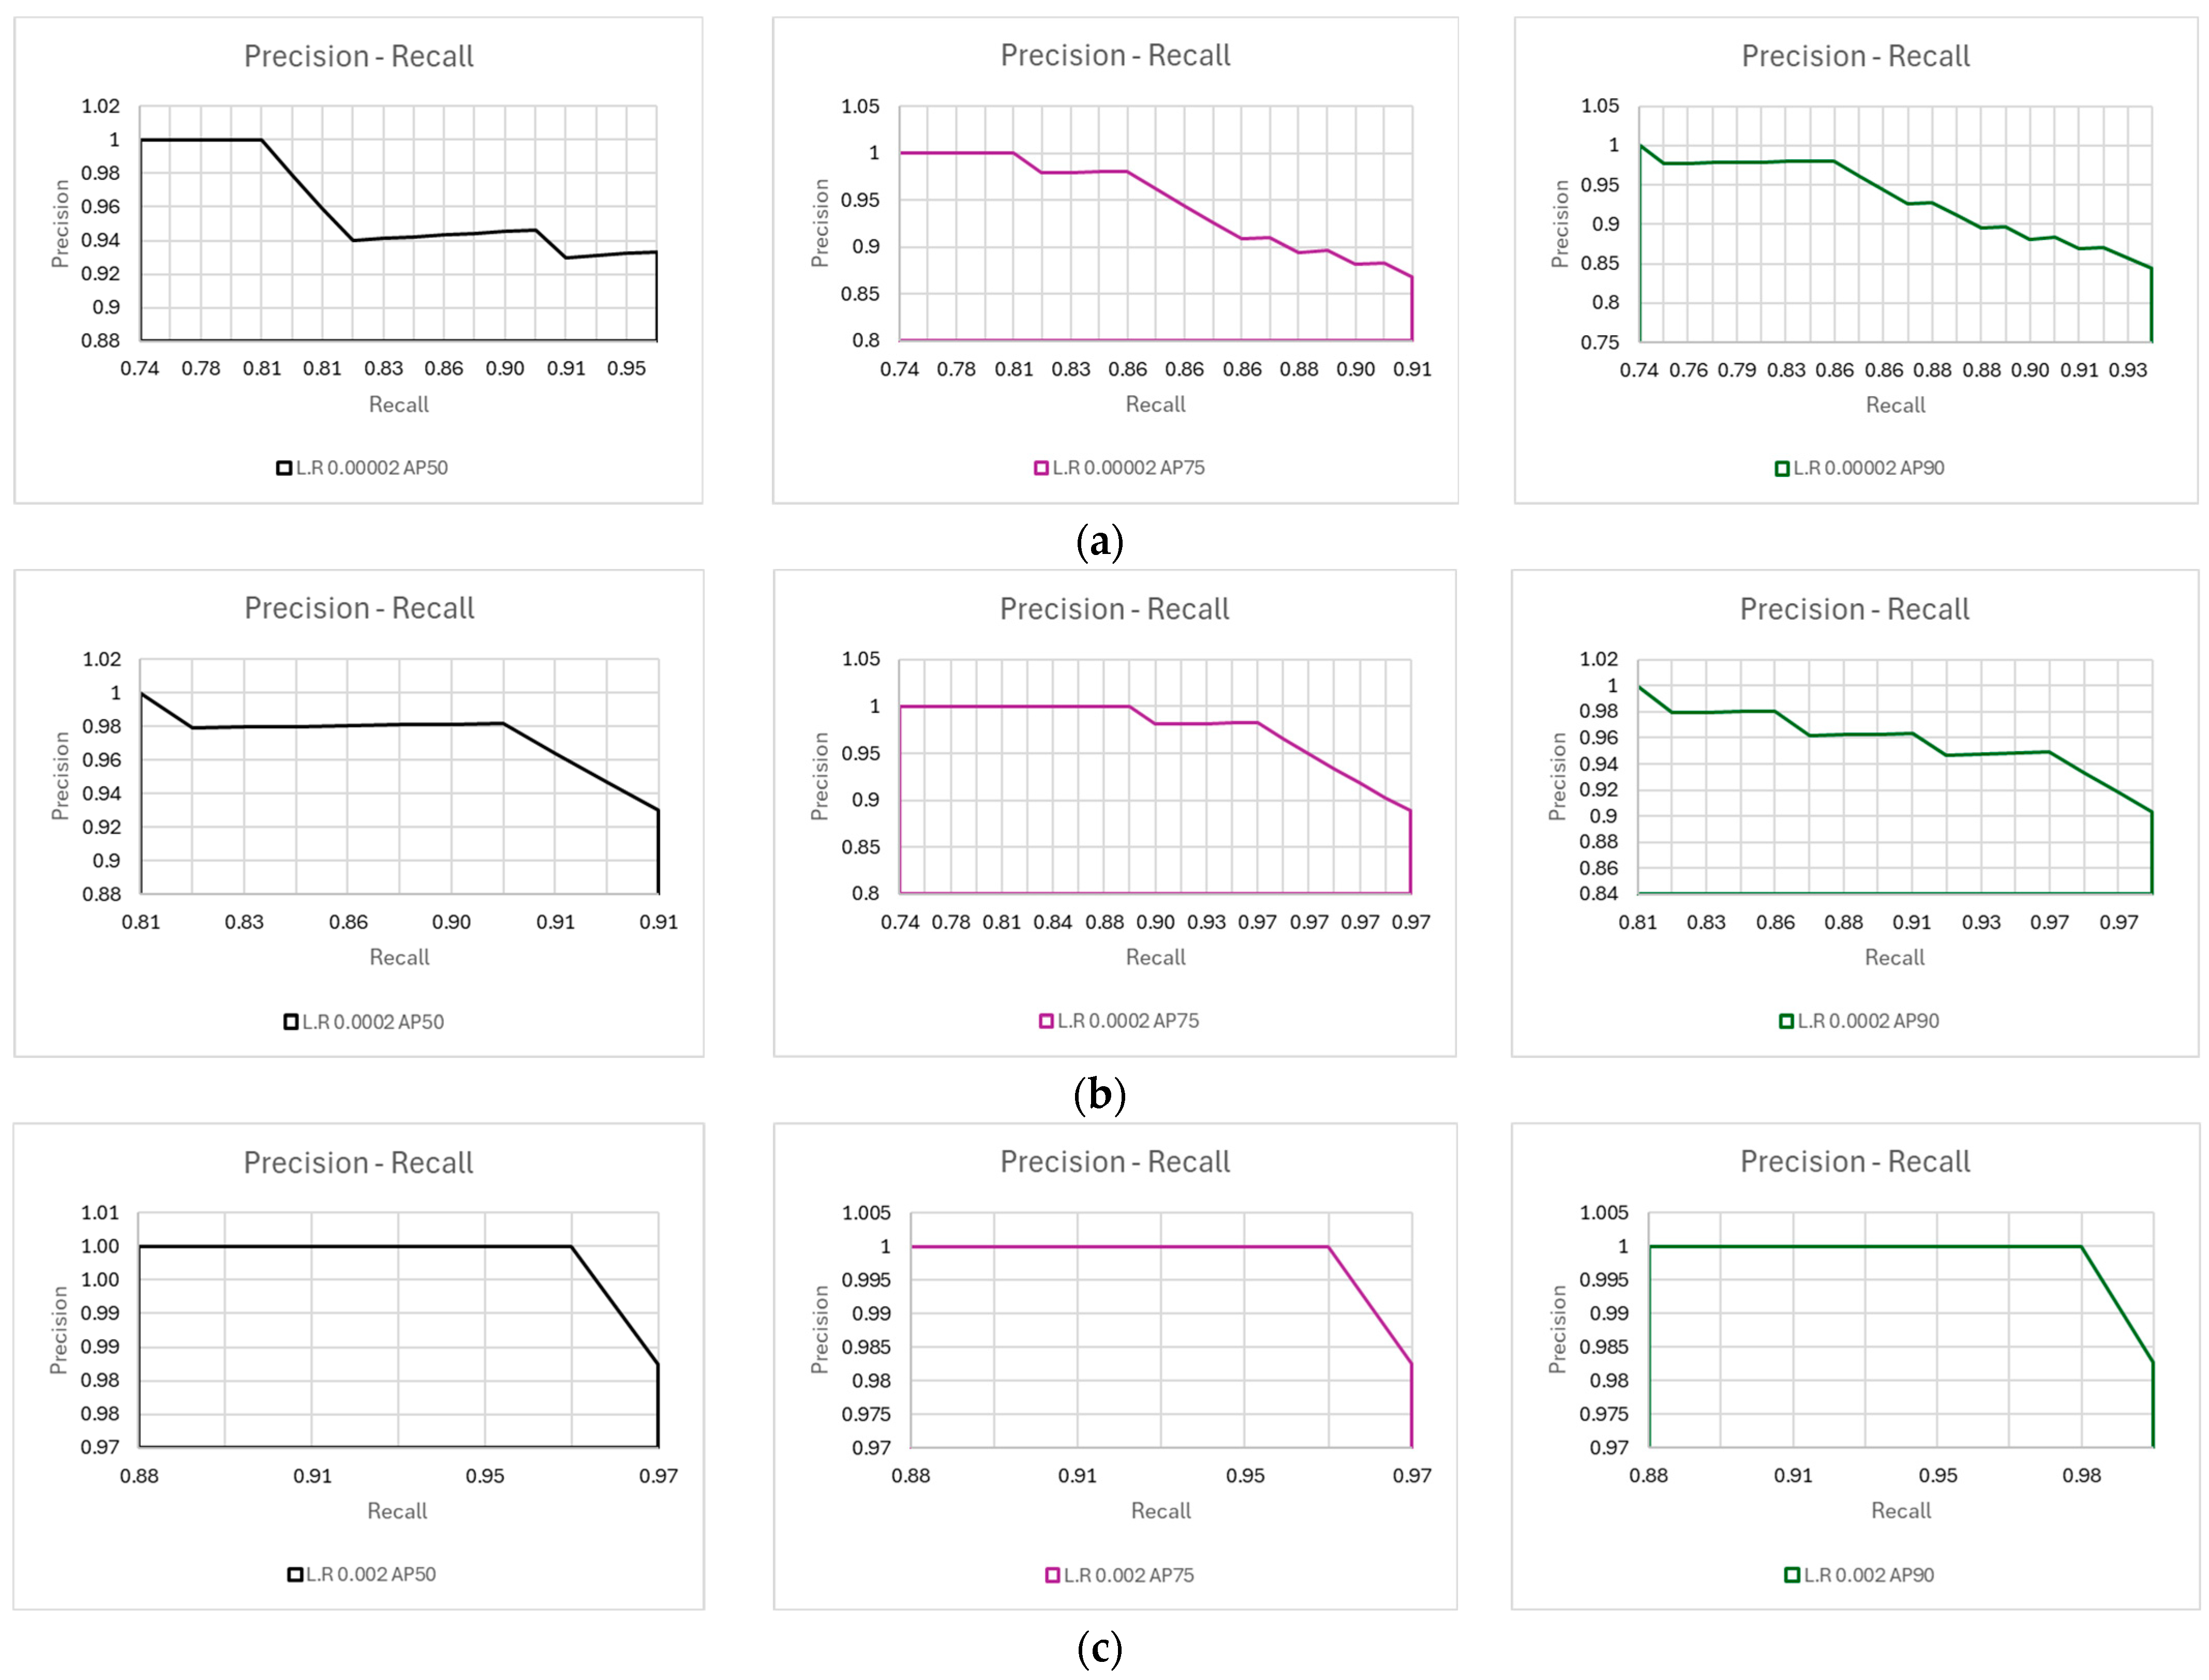
4.5. The Precision–Recall Curve of the Model at Different Thresholds
To determine the average precision of a model, the precision–recall curve needs to be created and the area below it would determine the average precision. This is illustrated in Figure 9 for the different AP learning rates.
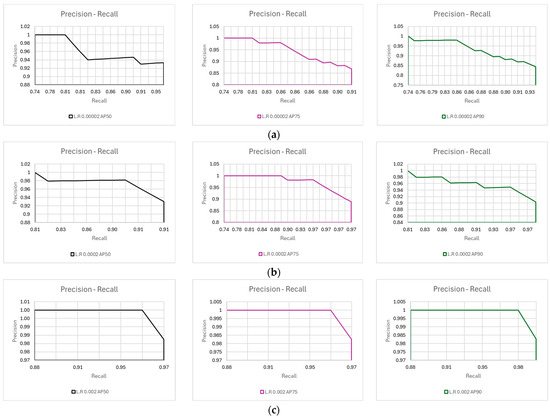
Figure 9.
(a) Precision versus recall curve of the model with a learning rate of 0.00002 at AP50, AP75, and AP90; (b) precision versus recall curve of the model with a learning rate of 0.0002 at AP50, AP75, and AP90; (c) precision versus recall curve of the model with a learning rate of 0.002 at AP50, AP75, and AP90.
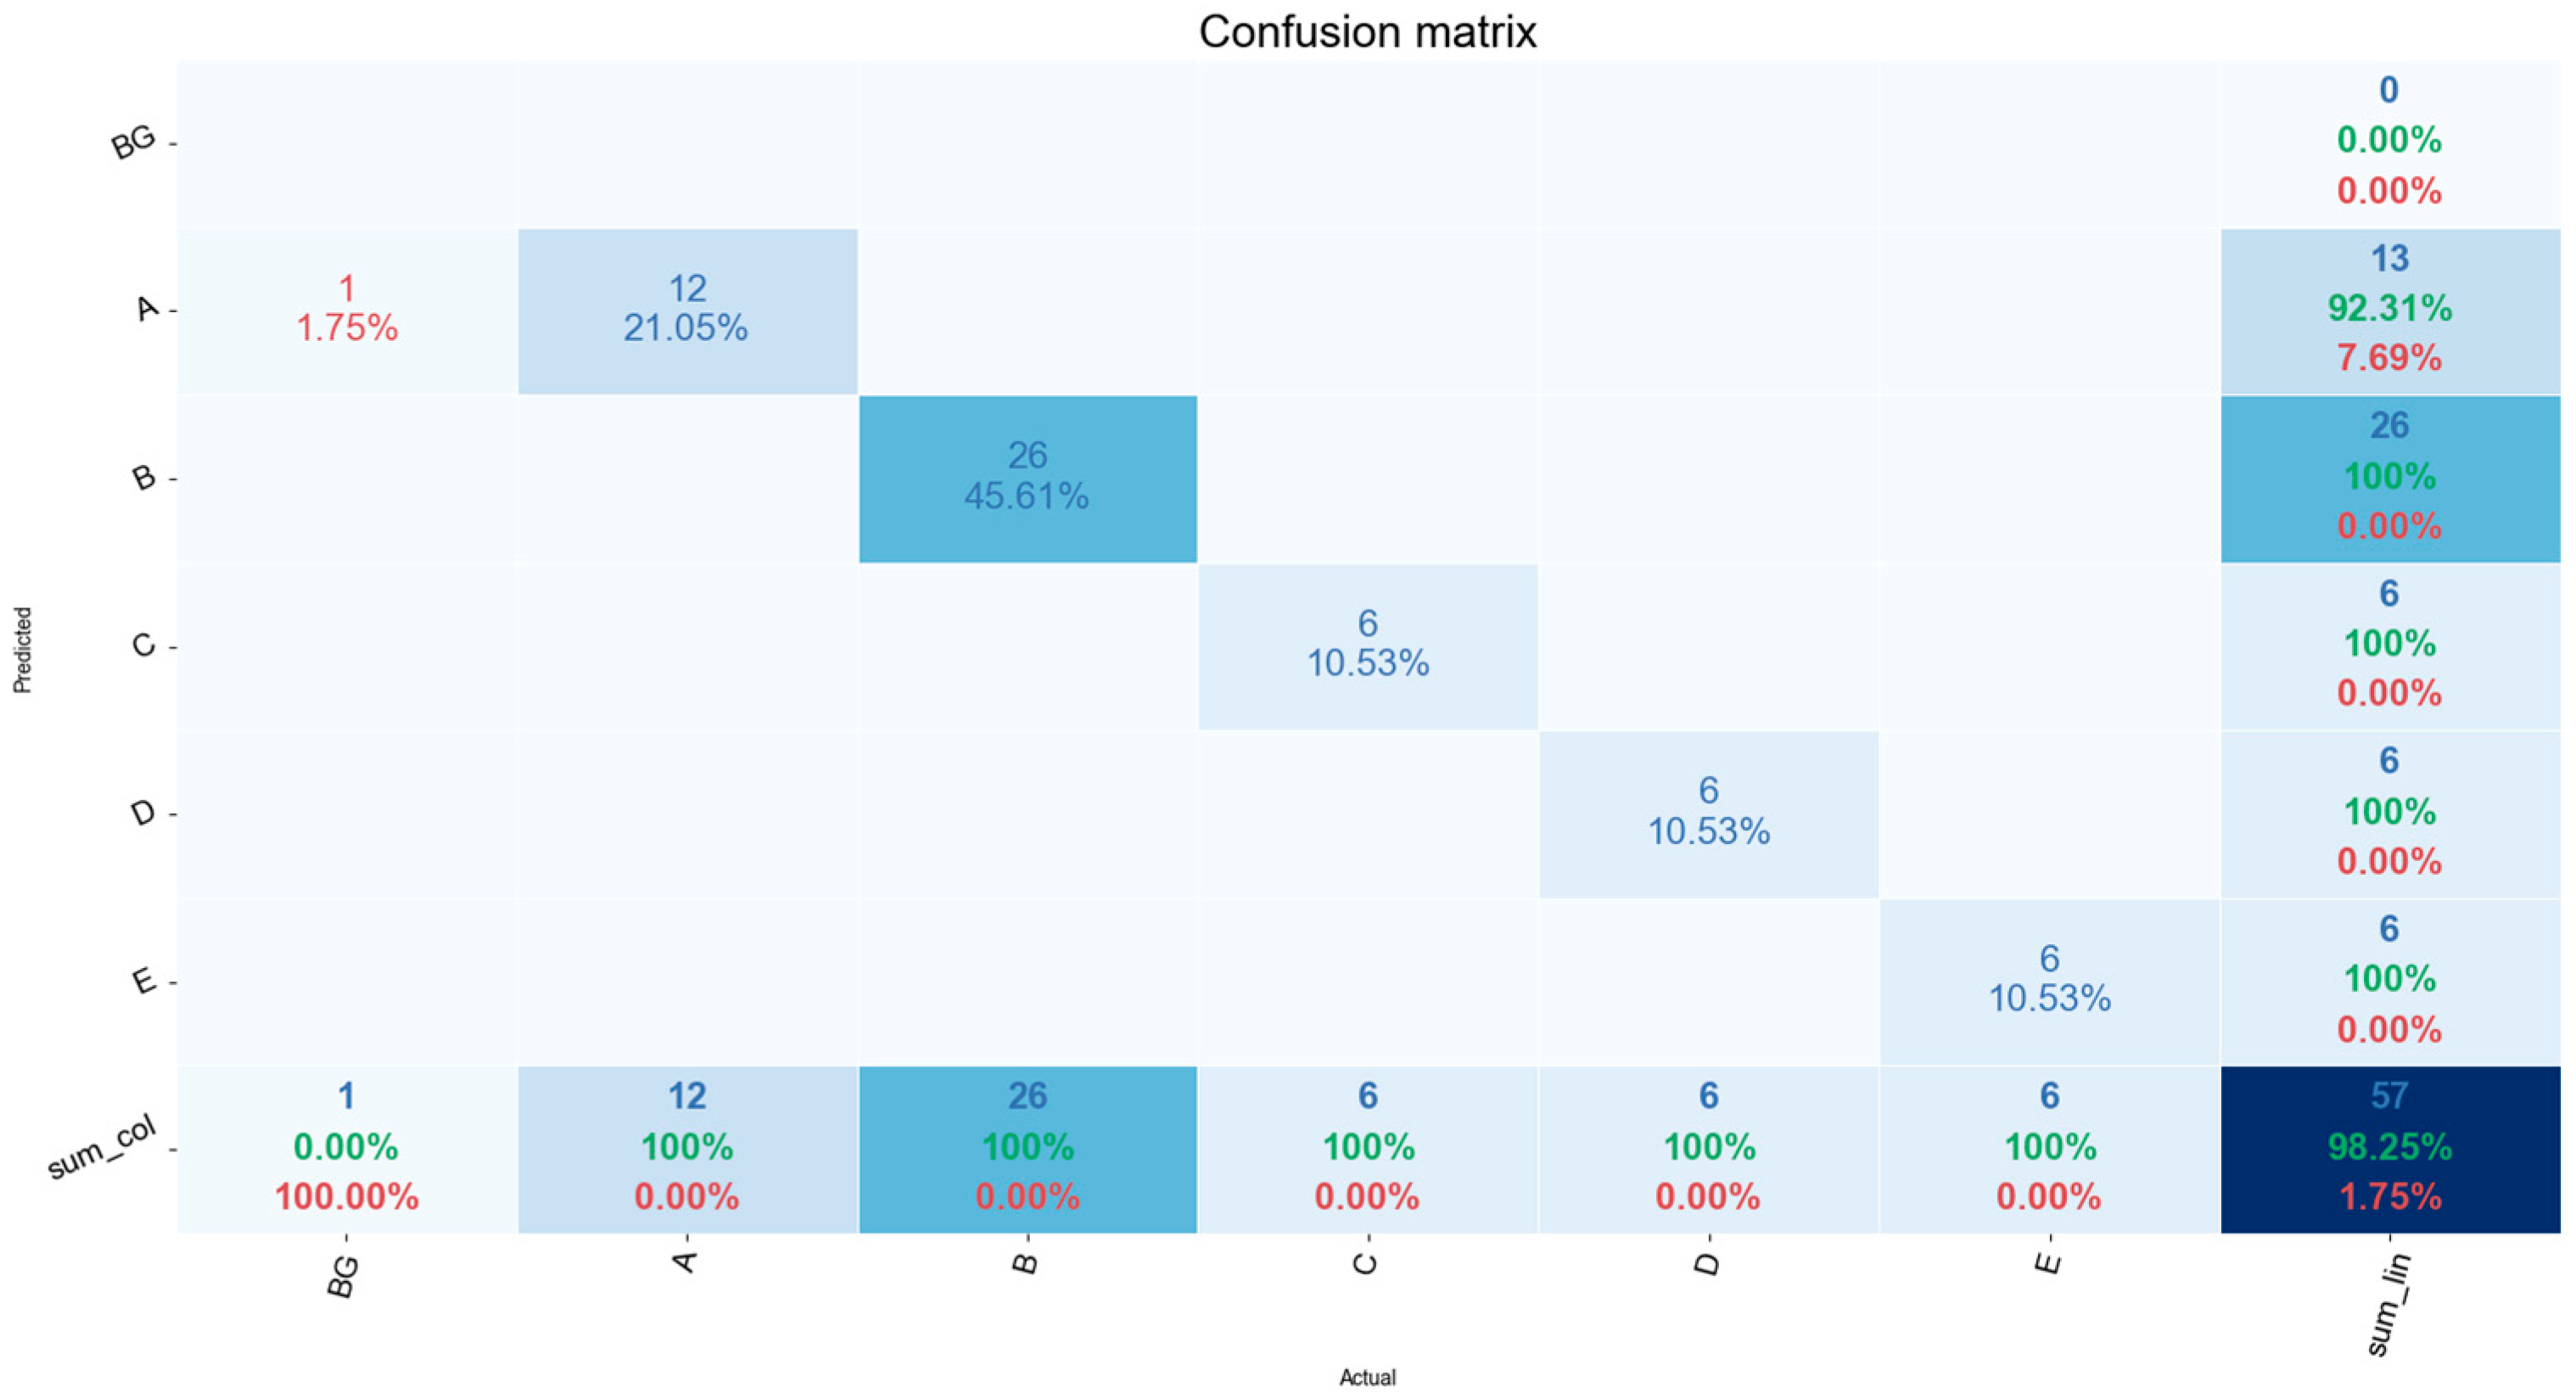
4.6. Confusion Matrix
The confusion matrix was used to determine the overall accuracy of the model after the model with the highest average precision was attained as illustrated in Figure 10. The columns represent the actual objects per class present in the image while the rows characterize the predicted objects per class.
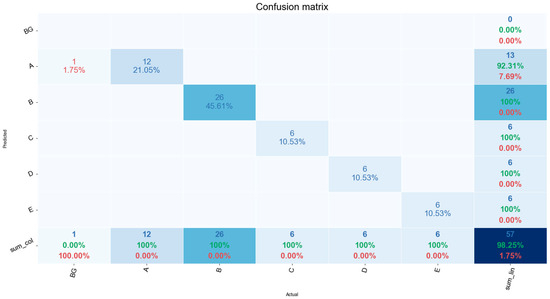
Figure 10.
Confusion matrix using a model with the highest average precision (98.27%).
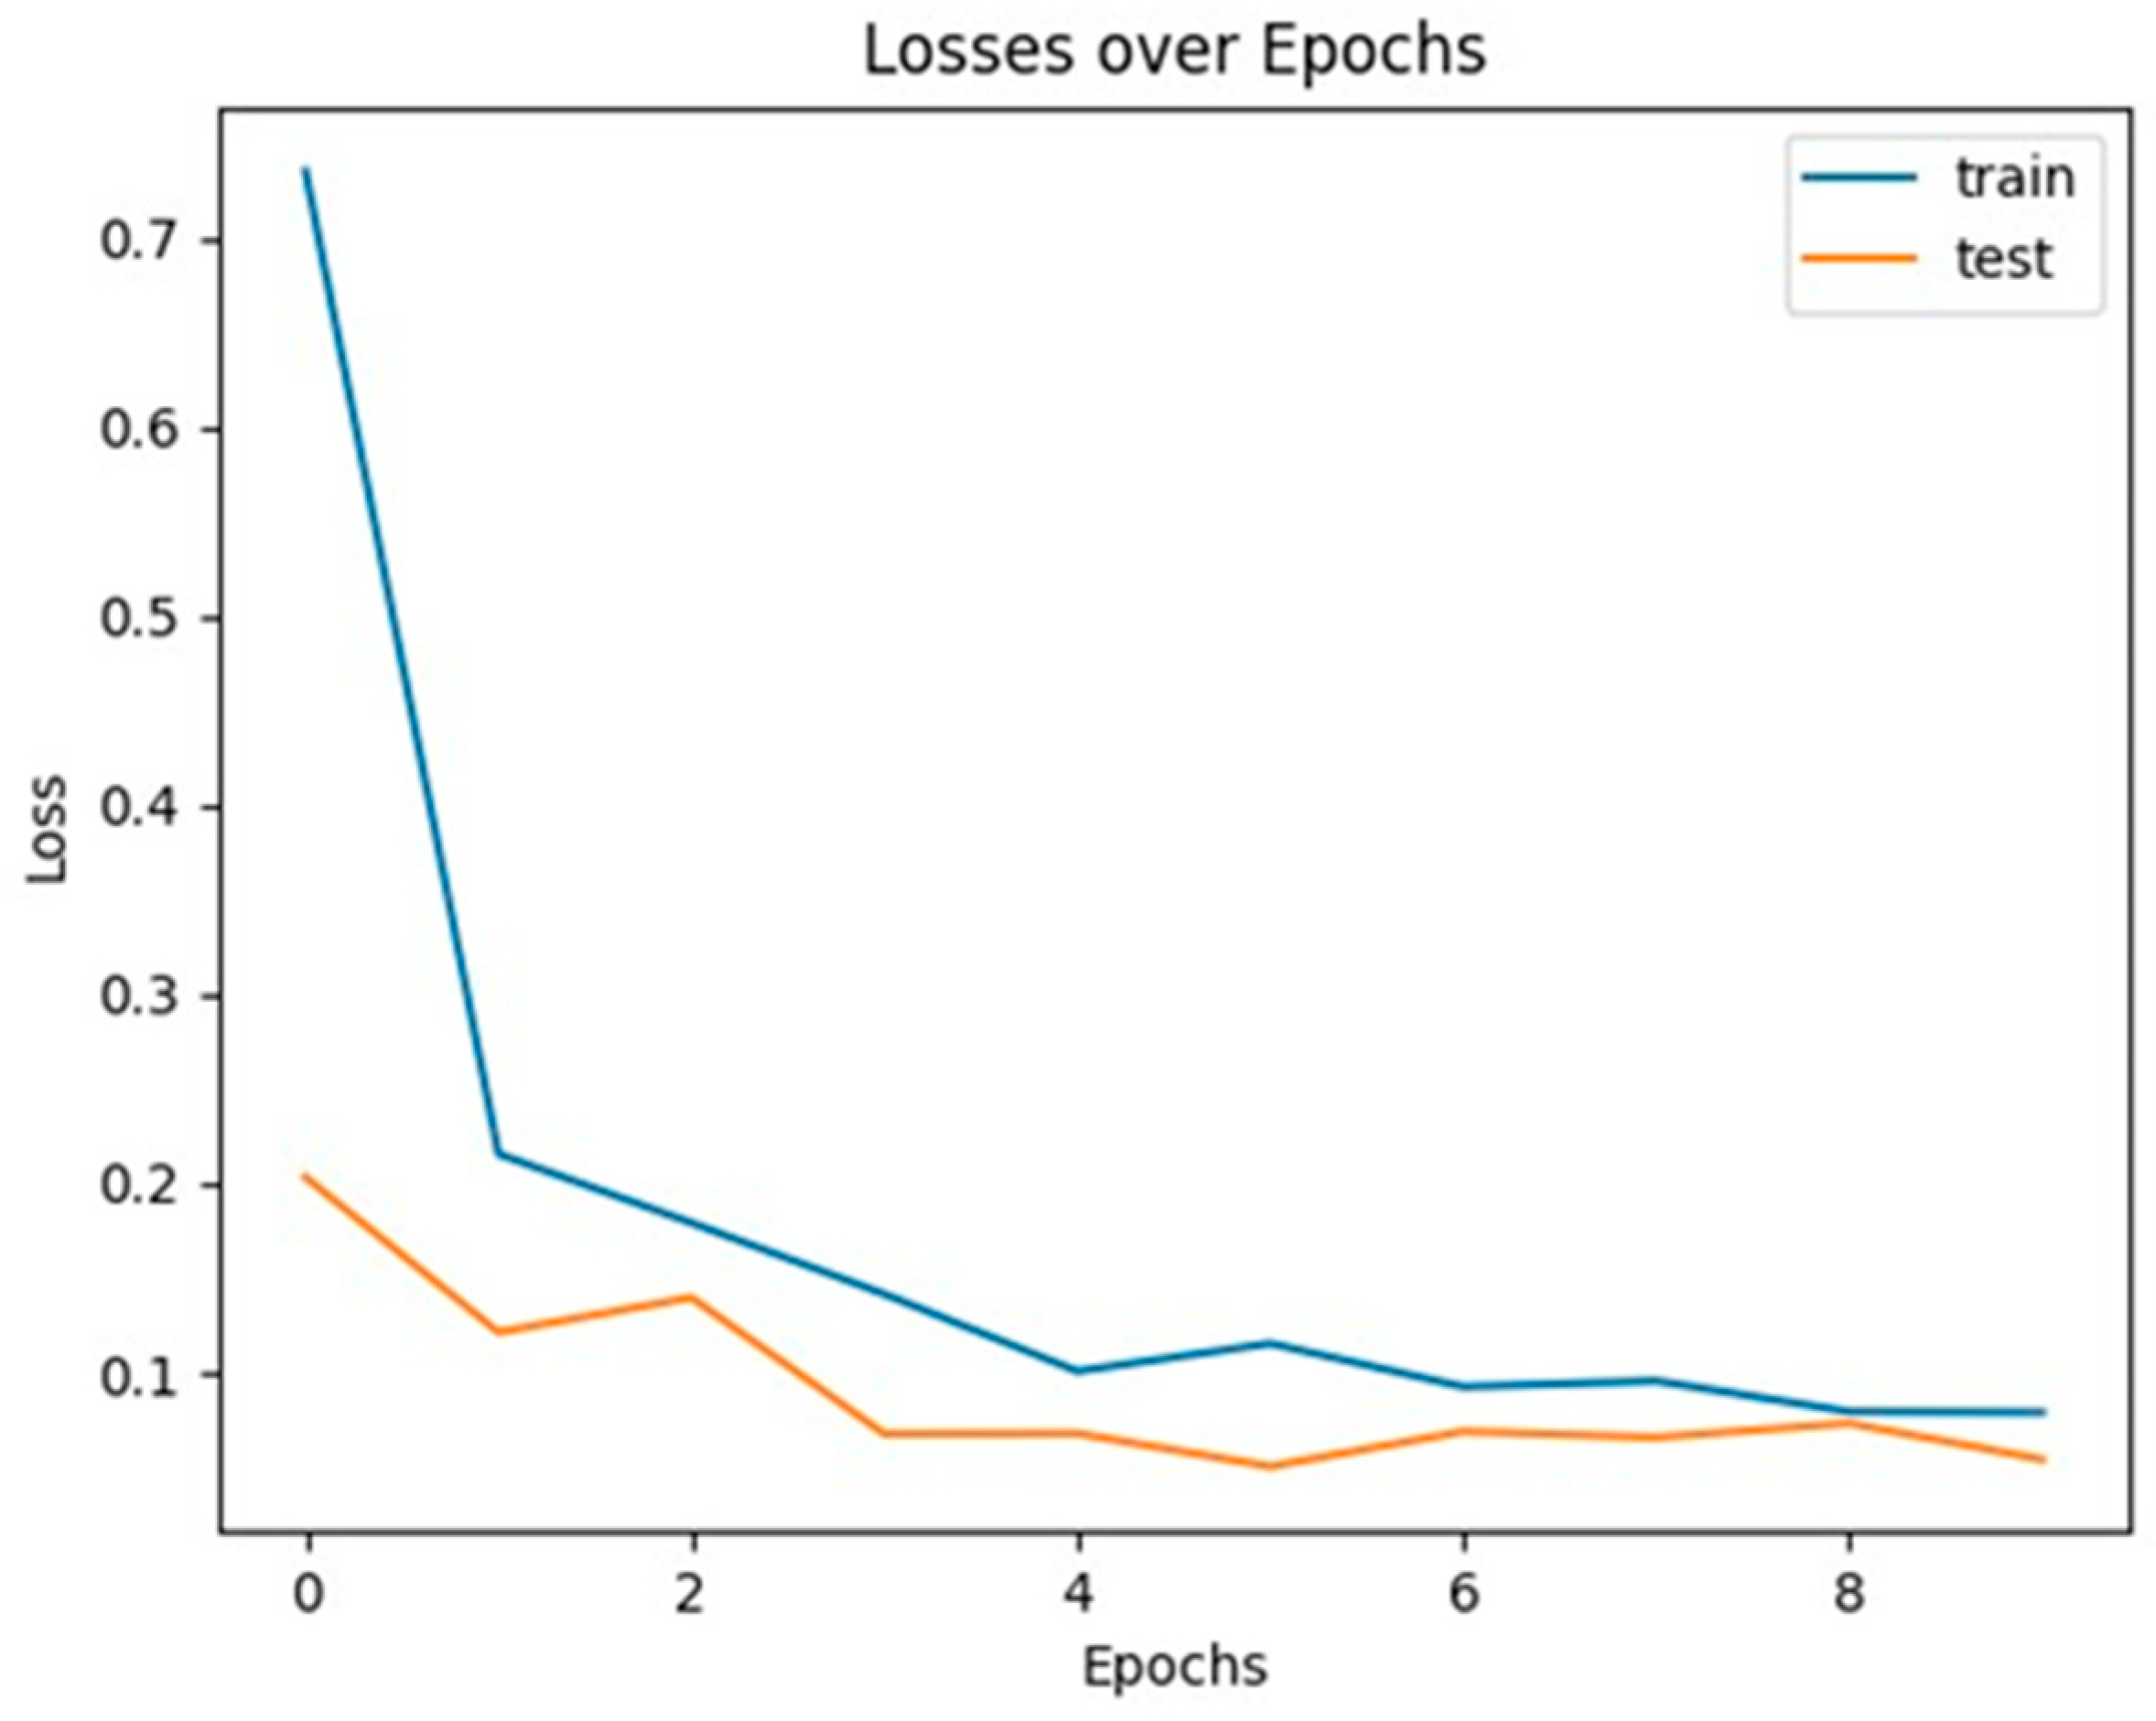
4.7. Losses over Epochs Graph
Figure 11 shows the losses as the model is trained over 10 epochs. This graph provides insight to model overfitting or underfitting. In this case, both the train and test losses are converging and the gaps between each are not diverging from each other, indicating that the model is generalizing satisfactorily given the custom dataset.
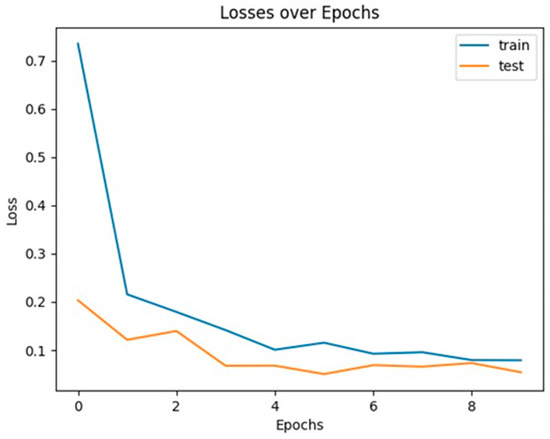
Figure 11.
Losses over epochs.
4.8. Metric Evaluation Criteria
The kappa (K) coefficient was used to determine the overall accuracy of the model, and the following metrics required in the equation were calculated. Po denotes the correctly observed agreements and Pe denotes the expected agreements.
The overall accuracy is calculated by taking the sum of all the correctly classified objects and dividing them by the total number (‘57’, as denoted in the bottom right corner of Figure 10). The error of commission is calculated by the fraction of objects that were predicted to be in a specific class that they do not belong to. These results are tabulated in Table 5. The inference time for the proposed Mask R-CNN was documented at ~200 ms per frame on a GPU using the COCO dataset [15]. In this study, given the proposed hardware configuration, we were able to achieve an inference time of ~400 ms per frame.
Table 5.
Overall accuracy of the model.
4.9. Analysis of Results
The overall accuracy and average precision over the predetermined IoU thresholds of the trained models have shown improved results as the learning rate value was increased. However, it must be noted that the model was unable to be trained when the learning rate was set to 0.02 and 0.2, leading to unstable convergence of the model. The inference time of ~400 ms per frame made this a viable approach as the production line speed of 0.1 m/s. Using a capture window of 10 frames after the conveyor hanger passed the proximity sensor equated to a time frame of approximately 4 s. Ten frames were used to average the objects detected to reduce the amount of false positive detections. This made for a travel distance of 0.4 m, which was subsequently within the capture window period. Using this approach a model with an average precision of 98.27% and an overall accuracy of 98.25% was achieved. An error of commission of 7.69% was noted in ‘class A’ only. In the experimental phase, all objects were positively detected in all defined classes. However, there was an instance where a false positive of ‘class A’ was detected in the background, due to it being very similar in shape to ‘class A’ thus adding to the error of commission. It should be noted that ‘class B’ and ‘class E’ share similar features and differ mainly in their dimensions. The Mask R-CNN model was able to successfully detect and differentiate between both classes, even with them being in close proximity to each other.
5. Conclusions
In this research, a Mask R-CNN was applied to detect parts on an enamel coating production line. These identified parts would be counted, and the data would be used to assess overall production throughput and performance. The lighting and environmental conditions were maintained throughout all data captures used for experimental training and testing of the model. From the results of the proposed methodology, the Mask R-CNN may be deemed as a reliable model to be used within an industrial environment of this nature, producing an average precision of 98.27% and an overall accuracy of 98.25% using real-world image datasets captured from the industrial facility. Notably, all objects were reliably detected for each class. Future improvements that could be considered would include isolating the area within the images with a bounding box where the objects of interest are located. This would eliminate false positive detections from background objects and noise. Further enhancements to the approach would include the use of pixel-wise segmentation that is revealed from the mask branch of the model to determine the exact location of the parts suspended on the hanger. This would reduce the wastage of enamel powder coating as used in the spray-painting process and improve the overall quality of the manufactured parts. Furthermore, the segmentation mask would be useful in determining optimal parts positioning on the conveyor line, which would aid in efficient robotic spray-painting systems.
Supplementary Materials
The following supporting Mask R-CNN GitHub repository can be downloaded at: https://github.com/matterport/Mask_RCNN (Accessed on 2 September 2022).
Author Contributions
Conceptualization, T.C. and N.P.; methodology, T.C. and N.P.; software, T.C.; validation, T.C.; formal analysis, T.C. and N.P.; investigation, T.C.; resources, T.C.; data curation, T.C.; writing—original draft preparation, T.C.; writing—review and editing, N.P.; visualization, T.C.; supervision, N.P. All authors have read and agreed to the published version of the manuscript.
Funding
This research received no external funding.
Data Availability Statement
The data presented in this study are available on request from the corresponding author due to privacy restrictions.
Conflicts of Interest
The authors declare no conflicts of interest.
References
- Fremont, V. The Digital Transformation of the Manufacturing Industry: Metamorphic Changes and Value Creation in the Industrial Network. Ph.D. Thesis, University of Gävle, Gävle, Sweden, 2021. [Google Scholar]
- Libes, D.; Shin, S.-J.; Woo, J. Considerations and Recommendations for Data Availability for Data Analytics for Manufacturing. In Proceedings of the 2015 IEEE International Conference on Big Data (Big Data), Santa Clara, CA, USA, 29 October–1 November 2015. [Google Scholar] [CrossRef]
- Weber, B.; Yarandi, H.; Rowe, M.; Weber, J. A Comparison Study: Paper-Based versus Web-Based Data Collection and Man-agement. Appl. Nurs. Res. 2005, 18, 182–185. [Google Scholar] [CrossRef]
- Wang, J.; Zhang, W.; Shi, Y.; Duan, S.; Liu, J. Industrial Big Data Analytics: Challenges, Methodologies, and Applications. arXiv 2018, arXiv:1807.01016. [Google Scholar]
- Wahi, M.M.; Parks, D.V.; Skeate, R.C.; Goldin, S.B. Reducing Errors from the Electronic Transcription of Data Collected on Paper Forms: A Research Data Case Study. J. Am. Med. Inform. Assoc. 2008, 15, 386–389. [Google Scholar] [CrossRef] [PubMed]
- Panko, R. Thinking Is Bad: Implications of Human Error Research for Spreadsheet Research and Practice. arXiv 2008, arXiv:0801.3114. [Google Scholar]
- Atkinson, I. Accuracy of Data Transfer: Double Data Entry and Estimating Levels of Error. J. Clin. Nurs. 2012, 21, 2730–2735. [Google Scholar] [CrossRef]
- Haffner, O.; Kučera, E.; Rosinová, D. Applications of Machine Learning and Computer Vision in Industry 4.0. Appl. Sci. 2024, 14, 2431. [Google Scholar] [CrossRef]
- Escamilla, L.D.V.; Gómez-Espinosa, A.; Cabello, J.A.E.; Cantoral-Ceballos, J.A. Maturity Recognition and Fruit Counting for Sweet Peppers in Greenhouses Using Deep Learning Neural Networks. Agriculture 2024, 14, 331. [Google Scholar] [CrossRef]
- Makris, S.; Alexopoulos, K.; Michalos, G.; Arkouli, Z.; Papacharalampopoulos, A.; Stavropoulos, P.; Fernández Martínez, A.; Muiños-Landin, S.; Gadeyne, K.; Meyers, B.; et al. Artificial Intelligence in Manufacturing White paper Prepared by the Artificial Intelligence in Manufacturing Network -AIM-NET. Available online: https://www.researchgate.net/publication/371805255_ARTIFICIAL_INTELLIGENCE_IN_MANUFACTURING_White_paper_Prepared_by_the_Artificial_Intelligence_in_Manufacturing_Network_-AIM-NET#fullTextFileContent (accessed on 1 April 2024).
- Balasubramanian, S. Integration of Artificial Intelligence in the Manufacturing Sector: A Systematic Review of Applications and Implications. 2023. Available online: https://osf.io/3xpwn/ (accessed on 1 April 2024).
- Buongiorno, D.; Caramia, D.; Di Ruscio, L.; Longo, N.; Panicucci, S.; Di Stefano, G.; Bevilacqua, V.; Brunetti, A. Object Detection for Industrial Applications: Training Strategies for AI-Based Depalletizer. Appl. Sci. 2022, 12, 11581. [Google Scholar] [CrossRef]
- Martínez, E.; del Pobil, A.P. Object Detection and Recognition for Assistive Robots: Experimentation and Implementation. IEEE Robot. Autom. Mag. 2017, 24, 123–138. [Google Scholar] [CrossRef]
- Hu, Y.; Liu, G.; Chen, Z.; Guo, J. Object Detection Algorithm for Wheeled Mobile Robot Based on an Improved YOLOv4. Appl. Sci. 2022, 12, 4769. [Google Scholar] [CrossRef]
- He, K.; Gkioxari, G.; Dollár, P.; Girshick, R. Mask R-CNN. In Proceedings of the 2017 IEEE International Conference on Computer Vision (ICCV), Venice, Italy, 22–29 October 2017; pp. 2961–2969. [Google Scholar] [CrossRef]
- Augustian, M. Neural Network Based Fault Detection on Painted Surface. Master’s Thesis, Umeå University, Umeå, Sweden, 2017. [Google Scholar]
- Molina, J.; Solanes, J.E.; Arnal, L.; Tornero, J. On the detection of defects on specular car body surfaces. Robot. Comput. Manuf. 2017, 48, 263–278. [Google Scholar] [CrossRef]
- Zhou, Q.; Chen, R.; Huang, B.; Liu, C.; Yu, J.; Yu, X. An Automatic Surface Defect Inspection System for Automobiles Using Machine Vision Methods. Sensors 2019, 19, 644. [Google Scholar] [CrossRef] [PubMed]
- Arjun, P.; Mirnalinee, T.T. Machine parts recognition and defect detection in automated assembly systems using computer vision techniques. Rev. Téc. Ing. Univ. Zulia 2016, 39, 71–80. [Google Scholar]
- Pérez, L.; Rodríguez, Í.; Rodríguez, N.; Usamentiaga, R.; García, D.F. Robot guidance using machine vision techniques in industrial environments: A comparative review. Sensors 2016, 16, 335. [Google Scholar] [CrossRef] [PubMed]
- Machefer, M. Mask R-CNN Refitting Strategy for Plant Counting and Sizing in UAV Imagery. Remote Sens. 2020, 12, 3015. [Google Scholar] [CrossRef]
- Huang, H.; Wei, Z.; Yao, L. A Novel Approach to Component Assembly Inspection Based on Mask R-CNN and Support Vector Machines. Information 2019, 10, 282. [Google Scholar] [CrossRef]
- Puliti, S.; Pearse, G.; Surovy, P.; Wallace, L.; Hollaus, M.; Wielgosz, M.; Astrup, R. FOR-Instance: A UAV Laser Scanning Benchmark Dataset for Semantic and Instance Segmentation of Individual Trees. arXiv 2023, arXiv:2309.01279. [Google Scholar]
- Xu, B.; Wang, W.; Falzon, G.; Kwan, P.; Guo, L.; Chen, G.; Tait, A.; Schneider, D. Automated Cattle Counting Using Mask R-CNN in Quadcopter Vision System. Comput. Electron. Agric. 2020, 171, 105300. [Google Scholar] [CrossRef]
- Naets, T.; Huijsmans, M.; Smyth, P.; Sorber, L.; Lannoy, G. A Mask R-CNN Approach to Counting Bacterial Colony Forming Units in Pharmaceutical Development. arXiv 2021, arXiv:2103.05337. [Google Scholar]
- Rong, M.; Wang, Z.; Ban, B.; Guo, X. Pest Identification and Counting of Yellow Plate in Field Based on Improved Mask R-CNN. Discret. Dyn. Nat. Soc. 2022, 2022, 1–9. [Google Scholar] [CrossRef]
- Calabrese, M.; Agnusdei, L.; Fontana, G.; Papadia, G.; Prete, A.D. Application of Mask R-CNN for Defect Detection in Printed Circuit Board Manufacturing. Res. Sq. 2023; preprint. [Google Scholar] [CrossRef]
- Ren, S.; He, K.; Girshick, R.; Sun, J. Faster R-CNN: Towards Real-Time Object Detection with Region Proposal Networks. arXiv 2016, arXiv:1506.01497. [Google Scholar] [CrossRef] [PubMed]
- Mohanapriya, S.; Natesan, P.; Mohana Saranya, S.; Sumithra, P.; Swathi, M.; Yoga Priya, P. Instance Segmentation Using Mask RCNN for Surveillance. In Proceedings of the 2022 6th International Conference on Computing Methodologies and Communication (ICCMC), Erode, India, 29–31 March 2022; pp. 235–241. [Google Scholar] [CrossRef]
- Hafiz, A.M.; Bhat, G.M. A Survey on Instance Segmentation: State of the Art. Int. J. Multimed. Inf. Retr. 2020, 9, 171–189. [Google Scholar] [CrossRef]
- Liu, J.; Yang, B.; Li, M.; Xu, D. Assessing Forest-Change-Induced Carbon Storage Dynamics by Integrating GF-1 Image and Localized Allometric Growth Equations in Jiangning District, Nanjing, Eastern China (2017–2020). Forests 2024, 15, 506. [Google Scholar] [CrossRef]
- Chen, Q.; Kang, Z.; Cao, Z.; Xie, X.; Guan, B.; Pan, Y.; Chang, J. Combining Cylindrical Voxel and Mask R-CNN for Automatic Detection of Water Leakages in Shield Tunnel Point Clouds. Remote Sens. 2024, 16, 896. [Google Scholar] [CrossRef]
- Lin, T.-Y.; Dollár, P.; Girshick, R.; He, K.; Hariharan, B.; Belongie, S. Feature Pyramid Networks for Object Detection. arXiv 2017, arXiv:1612.03144. [Google Scholar] [CrossRef]
- He, K.; Zhang, X.; Ren, S.; Sun, J. Deep Residual Learning for Image Recognition. arXiv 2015, arXiv:1512.03385. [Google Scholar] [CrossRef]
- Li, Y.; Song, B.; Kang, X.; Du, X.; Guizani, M. Vehicle-Type Detection Based on Compressed Sensing and Deep Learning in Vehicular Networks. Sensors 2018, 18, 4500. [Google Scholar] [CrossRef] [PubMed]
- Ronneberger, O.; Fischer, P.; Brox, T. U-Net: Convolutional Networks for Biomedical Image Segmentation. arXiv 2015, arXiv:1505.04597. [Google Scholar] [CrossRef]
- Redmon, J.; Farhadi, A. YOLOv3: An Incremental Improvement. arXiv 2018. [Google Scholar] [CrossRef]
- Bolya, D.; Zhou, C.; Xiao, F.; Lee, Y.J. YOLACT: Real-Time Instance Segmentation. arXiv 2019, arXiv:1904.02689. [Google Scholar] [CrossRef]
- Dutta, A.; Zisserman, A. The VIA Annotation Software for Images, Audio and Video. In Proceedings of the 27th ACM International Conference on Multimedia, Nice, France, 21–25 October 2019; Association for Computing Machinery: New York, NY, USA, 2019; pp. 2276–2279. [Google Scholar] [CrossRef]
- Zorcolo, A.; Escobar-Palafox, G.; Gault, R.; Scott, R.; Ridgway, K. Study of Lighting Solutions in Machine Vision Applications for Automated Assembly Operations. IOP Conf. Ser. Mater. Sci. Eng. 2011, 26, 012019. [Google Scholar] [CrossRef]
- Sivasubramanian, A.; Prakash, J.A.; Kumar, K.D.; Prashanth, V.R.; Sowmya, V.; Variyar, V.S. Object Detection Under Low-Lighting Conditions Using Deep Learning Architectures: A Comparative Study. In International Conference on Advances in Data Science and Computing Technologies; Springer Nature: Singapore, 2023; pp. 269–276. [Google Scholar] [CrossRef]
- Chen, W.; Shah, T. Exploring Low-Light Object Detection Techniques. arXiv 2021, arXiv:2107.14382. [Google Scholar] [CrossRef]
- Loh, Y.P.; Chan, C.S. Getting to Know Low-Light Images with The Exclusively Dark Dataset. arXiv 2018, arXiv:1805.11227. [Google Scholar] [CrossRef]
- Patel, O.; Maravi, Y.P.S.; Sharma, S. A Comparative Study of Histogram Equalization Based Image Enhancement Techniques for Brightness Preservation and Contrast Enhancement. Signal Image Process. Int. J. 2013, 4, 11–25. [Google Scholar] [CrossRef]
- Chen, C.; Chen, Q.; Xu, J.; Koltun, V. Learning to See in the Dark. arXiv 2018, arXiv:1805.01934. [Google Scholar] [CrossRef]
- COCO—Common Objects in Context. Available online: https://cocodataset.org/#detection-eval (accessed on 1 June 2024).


Disclaimer/Publisher’s Note: The statements, opinions and data contained in all publications are solely those of the individual author(s) and contributor(s) and not of MDPI and/or the editor(s). MDPI and/or the editor(s) disclaim responsibility for any injury to people or property resulting from any ideas, methods, instructions or products referred to in the content. |
© 2024 by the authors. Licensee MDPI, Basel, Switzerland. This article is an open access article distributed under the terms and conditions of the Creative Commons Attribution (CC BY) license (https://creativecommons.org/licenses/by/4.0/).