Abstract
Continuous flight auger piles (CFAPs) are highly versatile and productive deep foundation elements. Known for their execution speed, low noise, and minimal vibration, they are extensively used in Brazil, particularly for urban projects or environmentally sensitive areas. Technologically, they employ a Real-Time Operation System (RTOS) to control the execution energy for each drilled pile. When used effectively, this energy-based monitoring system can provide information that replaces or correlates with other challenging-to-measure variables, accommodating the impact of various exogenous variables on a pile’s execution and performance. Foundation designers often define one or more characteristic lengths for different pile groups, considered representative for each group despite uncertainties and morphological changes along the terrain. Hence, considering an energy-based control, which enables an individual assessment for each pile, is beneficial given soil’s complexity, which can vary significantly even within a small area. By determining the optimal execution energy, individualized stopping criteria for piles can be established, directly influencing costs and productivity and enhancing reliability. The present paper proposes a methodological workflow to automate the necessary calculations for execution energies, correlate them with bearing capacities measured by load tests or estimated from standard soil surveys, and predict the execution energy and corresponding stopping criteria for the drilling depth of each pile. This study presents a case study to illustrate the methodology proposed, accounting for a real construction site with multiple piles. It shows that considering fixed-length piles may not favor safety, as the energy-based analysis revealed that some piles needed longer shafts. This study also shows that for the 316 CFAPs analyzed with depths ranging from 8 to 14 m, a total of 564 m of pile shafts was unnecessary (which accounted for more than 110 m3 of concrete), indicating that cost optimization is possible. Overall, these analyses improve design safety and reliability while reducing execution costs. The results demonstrate that execution energy can serve as a proxy for subsurface resistance, correlating well with NSPT values and bearing capacity estimations. The methodology enables the individualized assessment of pile performance and reveal the potential for improving the reliability and cost-effectiveness of the geotechnical design process.
1. Introduction
Over the last few decades, safety analyses exclusively based on deterministic factors of safety have been increasingly conducted regarding probabilistic methods. This change shows that it is impossible to deal only with absolute truths and that risks exist and need to be defined and evaluated. One example is the new concepts incorporated into NBR 6122 [1]: Design and Execution of Foundations, the Brazilian standard for foundation analyses.
Even though normative advancements have been made, foundation designs are usually limited to local calculations in specific terrain regions. Due to the spatial variability of the soil massif, this can often lead to over- or under-sizing foundation piles. In other words, what is safe in one section may not be suitable for the overall project.
Due to their execution speed, low noise, and minimal vibration, designers consider continuous flight auger piles (CFAPs) as a go-to foundation element in urban and environmentally sensitive areas. The use of CFAPs originated in the United States in the 1950s, later becoming widespread throughout Europe and Japan in the 1980s, with the first execution in Brazil in 1987 [2]. The continuous evolution of its equipment and technology has made it one of Brazil’s most widely adopted deep foundation solutions, offering various options in terms of diameter and depth. In technological terms, this has allowed for electronic monitoring throughout all execution phases.
When considering the use of CFAPs, the electronic monitoring and execution control of the energy used to drill each pile can be part of more reliable stopping criteria for foundation execution when compared to pre-determined pile lengths. The literature has shown that the execution energy can be related to the results of field tests, such as load tests and soil surveys, indicating that it is a good proxy for deformability and shear strength parameters, as well as bearing capacities [3,4,5,6]. Since the procedure controls the energy used to drill each pile, this control can represent a tool to assist designers and engineers in adapting projects to field realities, individualizing the bearing capacity estimations for each pile drilled.
This research proposes a methodological framework to study the geotechnical behavior of CFAPs from an energetic point of view, particularly concerning their bearing capacities and total lengths. A study case was carried out for a design located in Brasilia, DF, Brazil, to illustrate the applicability of such a framework.
It is of interest to explore pile drilling control through execution energy. A control report provides detailed information about the drilling process for each pile during the execution of drilled piles. These data, derived from reports generated by the drilling rig, allow the energy applied to each pile to be linked to its geotechnical behavior, thereby enabling precise control of the foundation execution in a project. Consequently, one can use the execution energy to build an energy control technique to achieve the foundation’s design-bearing capacity during construction. Recent studies have highlighted the potential of energy-based measurements to assess subsurface variability and pile behavior during installation. For instance, Sun et al. [7] presented an integrity monitoring methodology of CFAPs using a thermal approach. In the general topic of execution monitoring, Prauzek et al. [8] identified opportunities for the future development and deployment of IoT sensors applied to geothermal energy installations, including piles. Similarly, Wang et al. used piezoresistive sensors to monitor pore and earth pressures during pile installation.
Silva et al. [9] mentioned that quantifying the execution energy of CFAPs will depend primarily on understanding the drilling system. A scalar quantity represents the total work done by external forces. From the torque applied to the drilling helix and the angular and drilling speed of the auger, one can determine the work of the tangential force. Finally, the other forces acting are the gravitational and downward forces, which are the mechanical energy applied to the helix.
Silva et al. [9] and Ferrari de Campos [5] mentioned that the use of an energy-based execution methodology contributes to reducing the risk of the design implementation by reducing the probability of the failure of the system. Thus, considering that CFAPs employ a Real-Time Operation System (RTOS) to control the execution energy for each drilled pile, this energy-based monitoring system can provide information that replaces or correlates with other challenging-to-measure variables, accommodating the impact of various exogenous variables into the pile’s execution and performance.
The bearing capacity or ultimate allowable load of a pile is the sum of the maximum loads that will be supported by friction along the pile shaft and by the tip and can be determined through theoretical (analytical) methods, semi-empirical methods, and practical field testing methods, such as load test and soil surveys (e.g., Standard Penetration Tests—SPTs) [10]. When performing load tests, it is often necessary to extrapolate the measured values of load displacement to obtain the value of the ultimate bearing capacity of a given pile. Several methods are available, but this research used the technique of Van der Veen [11] to analyze the results of slow-loading static load tests.
On the other hand, bearing capacities can be estimated from indirect measurements of soil’s strength. Kumar et al. [12], for example, explored the use of soft computing techniques to design energy piles. Semi-empirical methods, on the other hand, are also interesting alternatives and can relate the results of SPTs to the bearing capacity of foundation elements. The present paper considers the methods of Aoki & Velloso [13], Decourt [14], and Antunes & Cabral [15]. This work omits the details of the methods once their formulations are well-known.
The literature shows that load tests are the most effective way to estimate piles’ bearing capacity. However, evaluating the entirety of piles becomes unfeasible due to financial and time constraints, thus limiting the representativeness of the pile set concerning those not tested. Therefore, establishing relationships between the execution energy of each pile and the bearing capacity measured by load tests and estimated based on penetration tests seeks to minimize this issue.
During the drilling process, disturbances occur at the soil–pile interface, and elastic, permanent, and residual deformations are imposed on the pile’s surroundings, making understanding and modeling difficult. Thus, unique characteristics are created for that interface, indicating that estimating bearing capacities from tests or surveys executed elsewhere in the terrain may severely impair the capacity and risk assessment, reinforcing the need for an individualized approach to the problem.
Risk analysis involves understanding the mechanisms through which risks may occur and estimating their extent, scope, and probability. On the other hand, risk management equates to explicitly planning a specific situation to obtain control at an acceptable level within engineering [16]. Thus, these concepts infer the probability of the success or failure of a structure and its consequences, expressing its safety in terms of its probability of failure. According to Assis [17], risk analyses encompass a wide range of applications, covering all project development phases.
There is no standard procedure for assessing and identifying risk applicable to all types of projects. Choosing the method will depend on the approach that is most acceptable for the problem, the available data, the degree to which there is dependence on subjective judgment, and the criteria used to judge whether the risk is acceptable. In the context of foundation design, soil variability is an important issue that needs consideration during risk analysis. In particular, variability is even more pronounced for deeply weathered soils such as those in Brasilia, Federal District, Brazil, pushing researchers to look for alternatives to mitigate such spatial changes by proposing techniques that individually assess the bearing capacity of foundation elements.
Soils in the Federal District exhibit significant spatial variability in type and properties. They are porous and collapsible, with thicknesses exceeding 10 m, consisting of layers of lateritic concretions resulting from weathering processes. Several studies have characterized the behavior of Brasilia’s soil [18].
Camapum de Carvalho et al. [19] and Santana et al. [20] mentioned that climate is one of the most critical agents in determining soil properties and formation. Specifically, climatic variability due to rainfall events results in soil wetting fronts, which can reduce suction and loss of mass strength, causing stability problems in the soil to varying degrees. On the other hand, two factors represent geotechnical uncertainties: the natural variability of the materials composing the soil and errors in measurements during tests.
Due to the tight deadlines for construction projects and their occasional execution delays associated with inadequate planning, complete control over construction procedures to adapt them to current standards and enable real-time executive monitoring for potential adjustments is not fully realized. Thus, it is typical to neglect the peculiarities of each project since dealing with a wide geological–geotechnical and even geomorphological variability in a soil–foundation system is challenging.
2. Methodology of Analysis
The workflow diagram in Figure 1 illustrates the steps for understanding the proposed methodology.
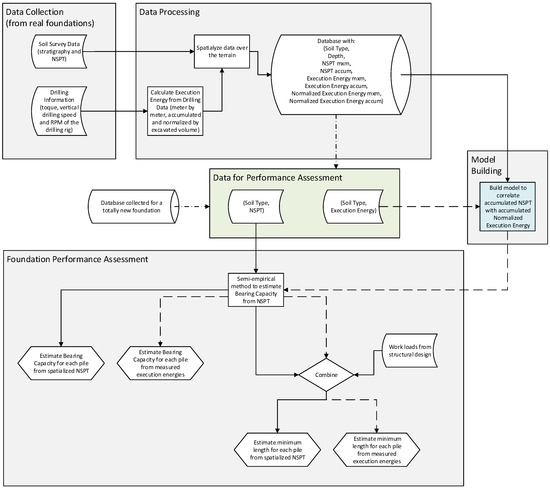
Figure 1.
Workflow of the methodological proposal. There were four major steps, represented in gray, which accounted for data collection, data processing, model building, and performance assessment. The green step represents inputting data to perform data assessment. It is worth highlighting that the blue box represents one of the main contributions of the present paper, which is building a model correlating the accumulated NSPT with accumulated normalized execution energy.
The general methodological workflow presented in Figure 1 was computationally implemented using the Mathematica® software [21] and accounted for the following steps:
- Data Collection: Data were collected from soil surveys, standard penetration tests, and drilling machines used to excavate real CFAPs. This dataset included the soil types in the area, their NSPT blow count as well as the toque, vertical drilling speed, and RPM of the drilling rig. To ensure the reliability of data collected from the drilling rig, a verification protocol was followed at the start of each new project. Specifically, after the initial setup, 4 to 6 piles were used as test piles to validate both the mechanical behavior of the rig and the accuracy of the embedded sensors. During this phase, execution parameters such as torque, RPM, and penetration speed were monitored and cross-checked against expected patterns and site conditions to confirm proper sensor functionality and operational consistency. Furthermore, each drilling machine must undergo mandatory maintenance stops every six months. During these stops, all sensors should be inspected and recalibrated if necessary, following the manufacturer’s calibration procedures. These routine checks help prevent systematic errors and maintain the integrity of long-term monitoring campaigns. This two-tiered approach—site-specific verification and periodic sensor maintenance—ensured that the execution energy data used in this study reflected real operating conditions with a high degree of confidence.
- Data Processing: The execution energy (meter by meter and accumulated with respect to depth) as well as its normalized version (with respect to the excavated volume) were calculated using the data collected from the drilling rig. Then, by using the RockWorks® software, the execution energies and the data from soil surveys and tests were spatialized over the terrain (we considered Inverse-Distance Anisotropic interpolation with a Smooth Grid filter using the defalut parameters of Rockworks [22]). Finally, a database matching all the spatialized data was built.
- Model Building: By using the database built during the “Data Processing” step, a model was created to correlate NSPT and execution energies. In the present study, we chose to correlate accumulated NSPT blow count with accumulated normalized execution energy.
- Data for Performance Assessment: The input data were selected for the performance assessment of the foundation. In general, it is possible to consider a database collected from any CFAPs and work site. To build the database, the steps in the “Data Collection” and “Data Processing” steps also needed to be considered. On the other hand, for simplicity and to illustrate our methodology, we considered the database created in the “Data Processing” step. It is possible to see that we represented these two possible cases by viewing dot-dashed arrows in Figure 1.
- Foundation Performance Assessment: Considering that the input dataset was chosen, there were two possible ways to perform the foundation assessment. If stratigraphy and NSPT data were available, the full-line arrows present the path to be taken. On the other hand, if only stratigraphy and execution energies were available, the dashed arrows indicate the path to follow. We should highlight that the dashed path was made possible because of the model created during the “Model Building” step. Either way, the methodology used estimated NSPT data (either from spatialization of real soil surveys or by estimating NSPT from execution energies) to estimate the bearing capacities of the CFAPs. This was achieved by using semi-empirical methods for bearing capacity estimation. The performance assessment could be carried out considering the exact lengths prescribed for each pile (from the original design) or by calculating the estimated bearing capacity for increasing pile lengths up to reaching the loads indicated in the structural design. We acknowledge, however, that the applicability of semi-empirical methods may be limited when used outside the soil types and calibration domains for which they were originally developed. As such, we emphasize that the use of semi-empirical methods must be carefully assessed in each new geotechnical context, ideally supported by local calibration or validation against load test data. Thus, in other words, after using the semi-empirical method for each pile, the bearing capacity could be estimated and compared to the working loads previously established by the structural design, enabling the calculation of each pile’s factor of safety (FS). Finally, finding the length that produced the FS indicated the design standards that were possible since one could change the pile lengths and re-do the calculations. One could use these changes to assess the maximum potential savings concerning the project’s initial cost.
Mathematica® v.11 was selected for its symbolic computation environment and automation of parameter optimization, which allowed for the efficient analysis and automation of parameter adjustment routines. RockWorks® v.17, on the other hand, was used for its robust tools in borehole data interpolation and 3D stratigraphic visualization.
The assessment of pile performance in this study was based on estimated bearing capacity. As described, this estimation was obtained either from semi-empirical formulas using NSPT values or from regression models based on execution energy data. The predicted capacities were then compared to design requirements or, when available, validated against load test results.
Overall, the relationship between execution energy and NSPT is fundamentally rooted in the mechanical resistance mobilized during pile drilling and soil penetration. Since both are energetic measurements, the theoretical basis of the correlation is not inherently site-specific. That said, small variations can arise in different geological contexts due to changes in energy transfer mechanisms—such as drilling efficiency or soil fabric effects—especially in highly plastic or collapsible soils. To address this, it was important to collect diverse soil profiles during the calibration phase to enhance the robustness of the model across stratigraphic settings. Furthermore, the inclusion of confidence intervals in the energy–NSPT regression allowed for conservative interpretations of the results. Even in cases where the model was not perfectly calibrated for a specific soil, the lower-bound estimations derived from confidence bands could be used to maintain a safety margin. This flexibility supports the practical deployment of the methodology across a range of geotechnical conditions without requiring full recalibration for each new site.
This study considered a construction site in Brasilia, DF, to illustrate the methodology’s application. At this site, the same machine–operator set fully controlled the entire executive procedure of the CFAPs. Load tests and soil surveys were carried out, providing the necessary information for the development of this study. Finally, all geotechnical and structural designs were gathered. The following section presents the results and analyses.
3. Results
As indicated, the application of the methodological framework used data gathered during the execution of the foundations of a residential building in Brasilia, DF, Brazil. This project involved the installation of 316 CFAPs, three load tests, and four SPTs. All the piles had the same top topographic level and were all 50 cm in diameter, with depths varying between 8 and 14 m. In the context of this study, no laboratory tests beyond NSPT were available for the investigated piles. Therefore, parameters such as natural moisture content, specific gravity, and Atterberg limits could not be precisely reported. Nonetheless, the site was located in Brasilia, DF, where the subsurface was predominantly composed of a well-documented, deeply weathered clayey material. This residual soil, known for its lateritic behavior, has been extensively studied in the literature. As described in Camapum de Carvalho et al. [18], these soils typically exhibit high plasticity, low permeability, and suction-dependent behavior due to the advanced weathering of the underlying rock mass.
3.1. Data Collection and Spatialization of the Stratigraphic Profile and NSPT
Figure 2A illustrates the spatial distribution of the soil layers based on the interpolation of the results from the borehole surveys, while Figure 2B presents a strategic cross-section aligned with the actual surveys performed, facilitating the visualization and understanding of the soil layers near each test. Similarly, the SPT blow values from the borehole surveys were spatialized and are presented in Figure 3.
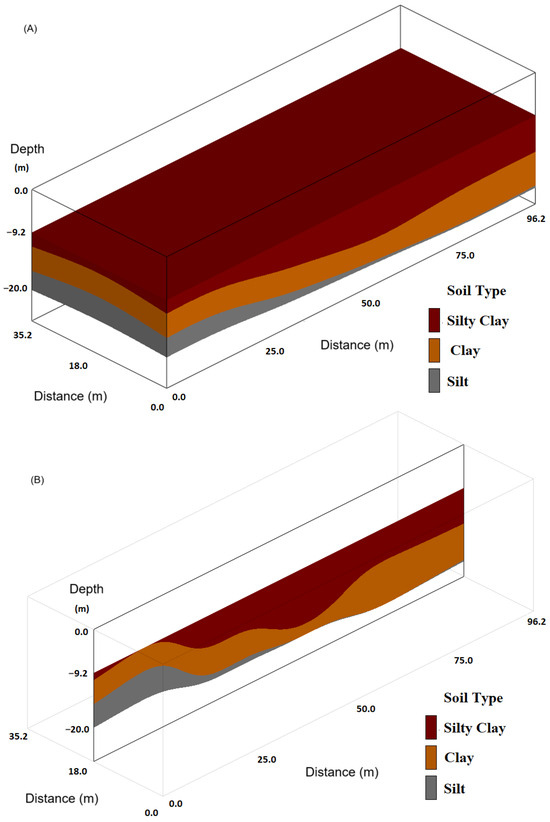
Figure 2.
(A) The 3D spatialization based on soil types revealed during surveys. (B) Cross-section of the stratigraphic profile aligned with the soil surveys.
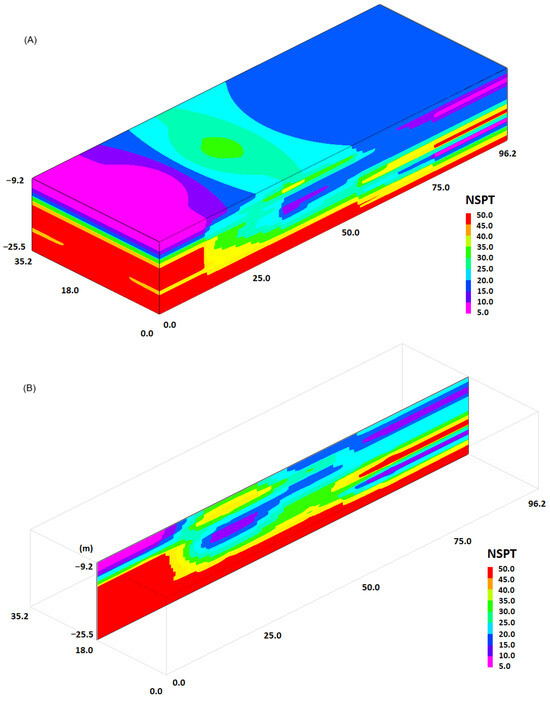
Figure 3.
(A) The 3D spatialization based on NSPT. (B) Cross-section of the NSPT profile aligned with the soil surveys.
Load Tests
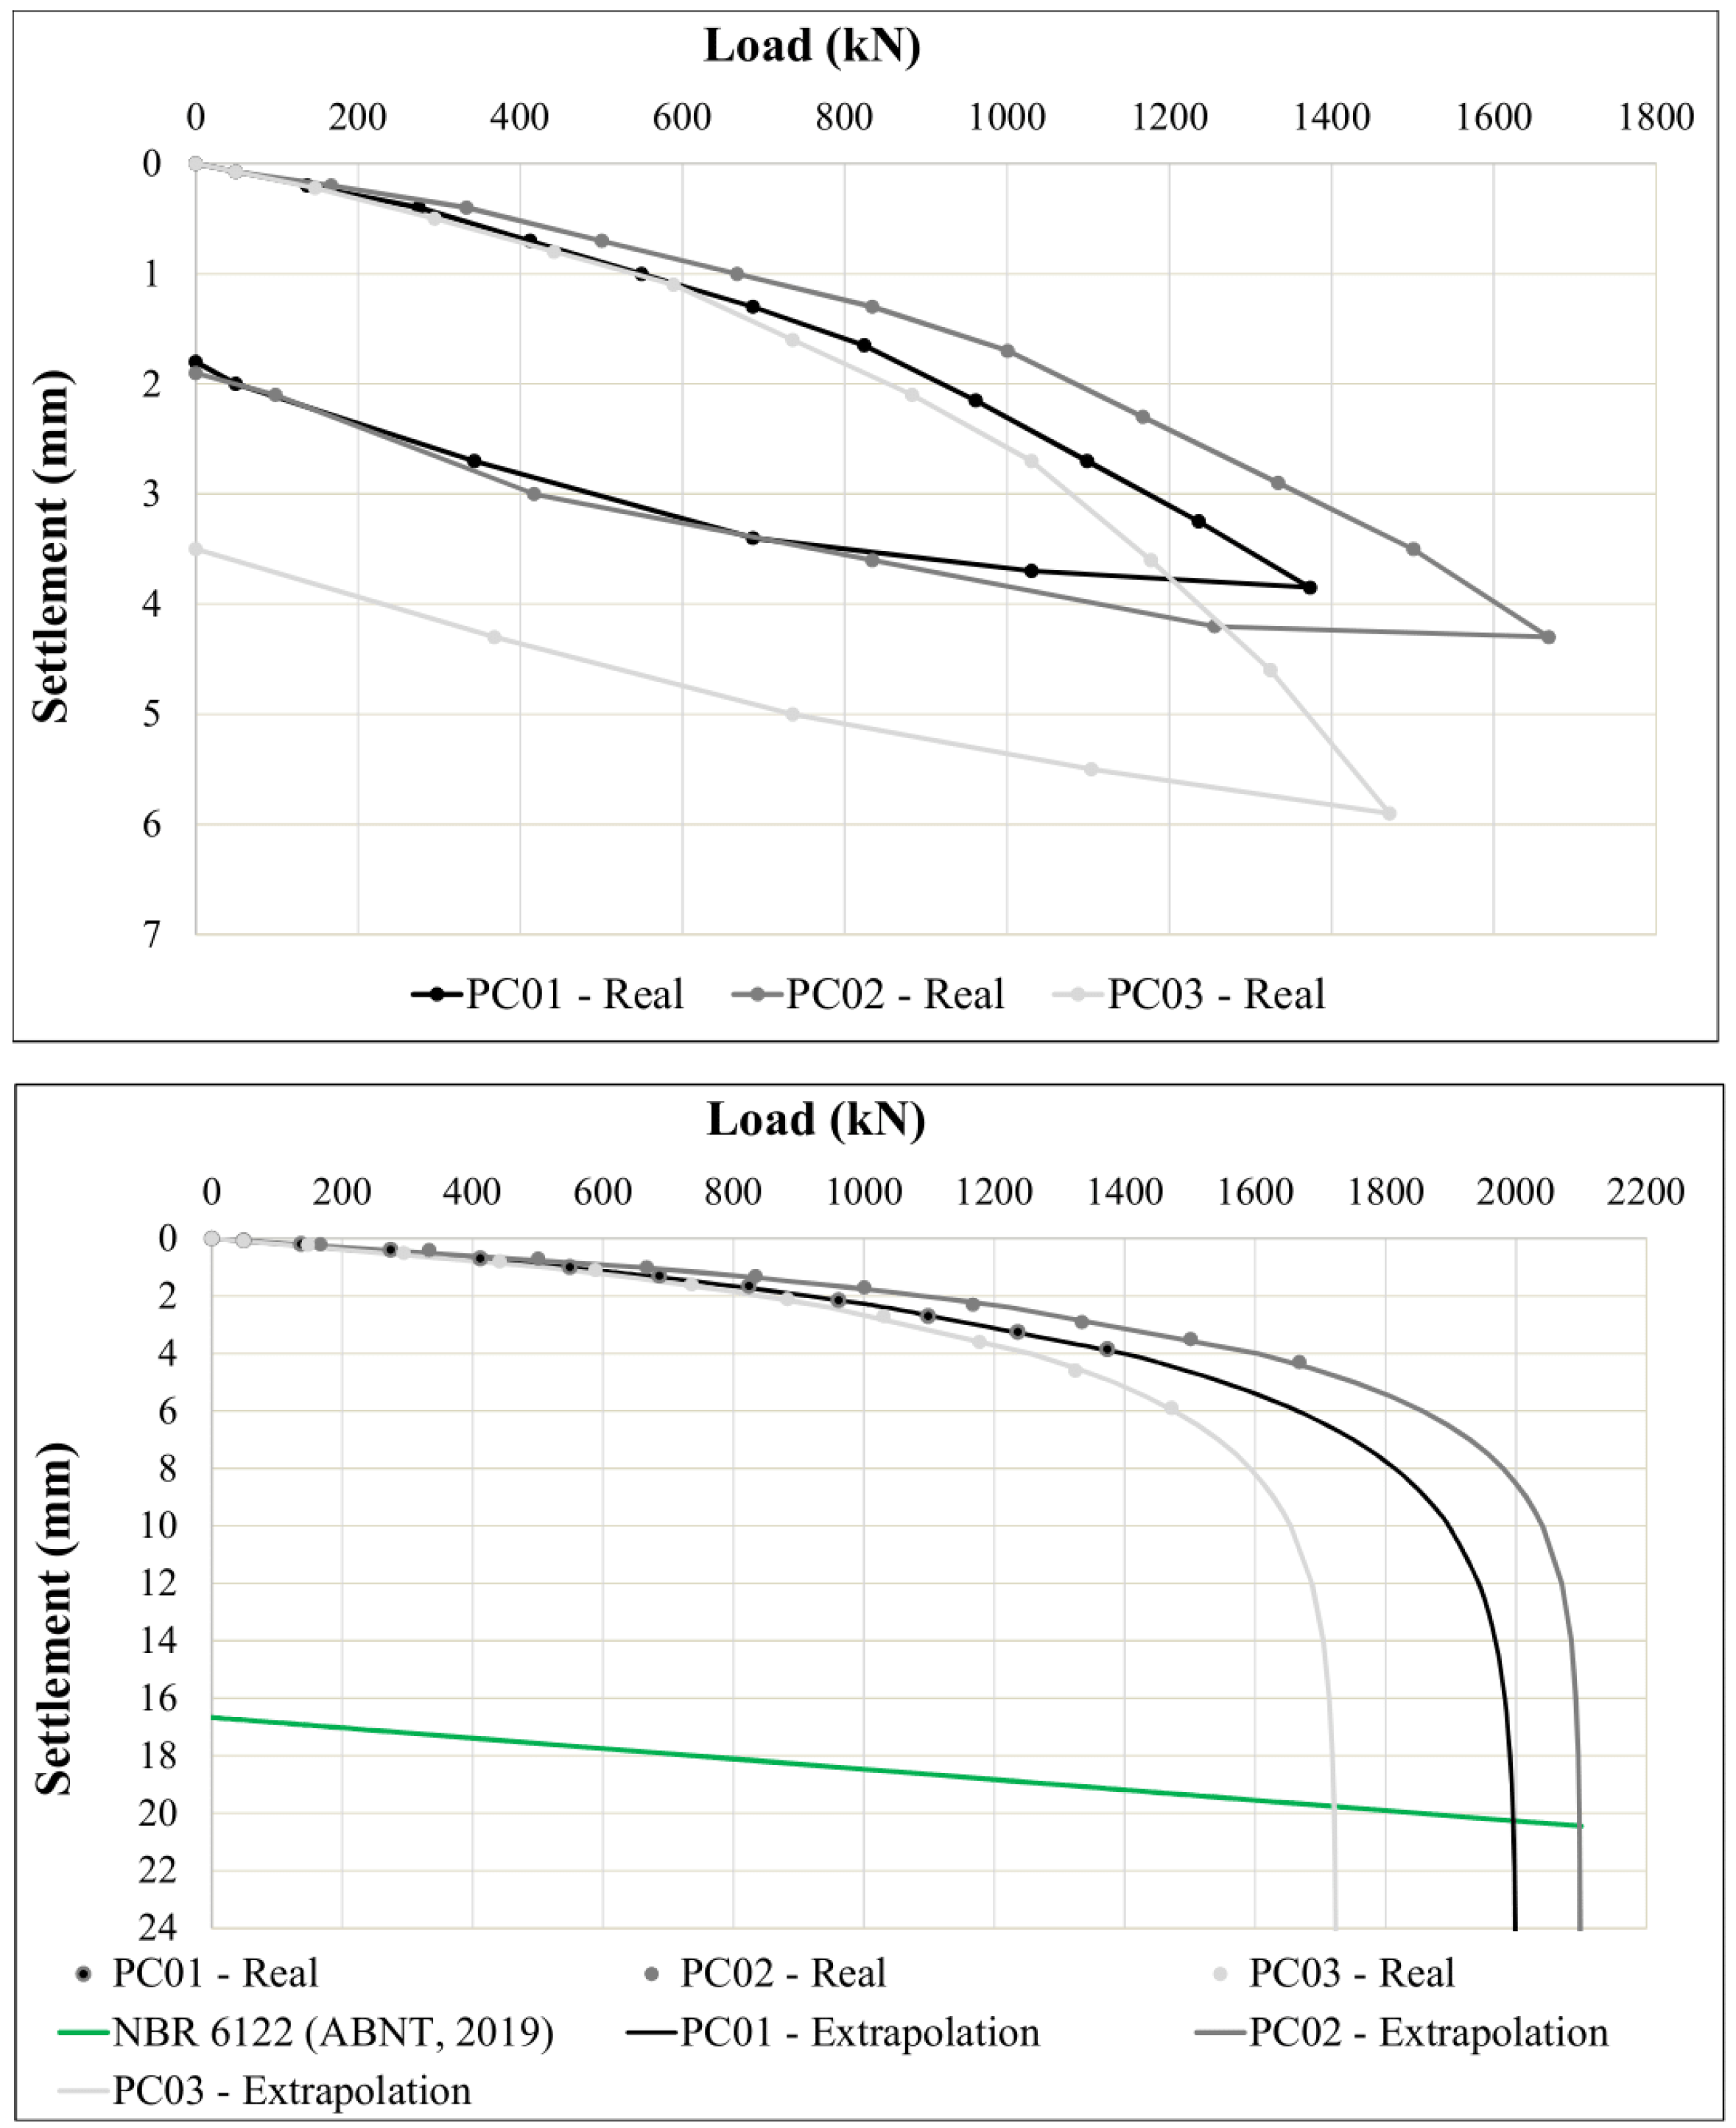
Figure 4 displays the load versus settlement curves on an arithmetic scale for the tested piles. Extrapolations for estimating the ultimate settlements and loads could be performed by using Van der Veen’s [11] method, which is also presented in Figure 4.
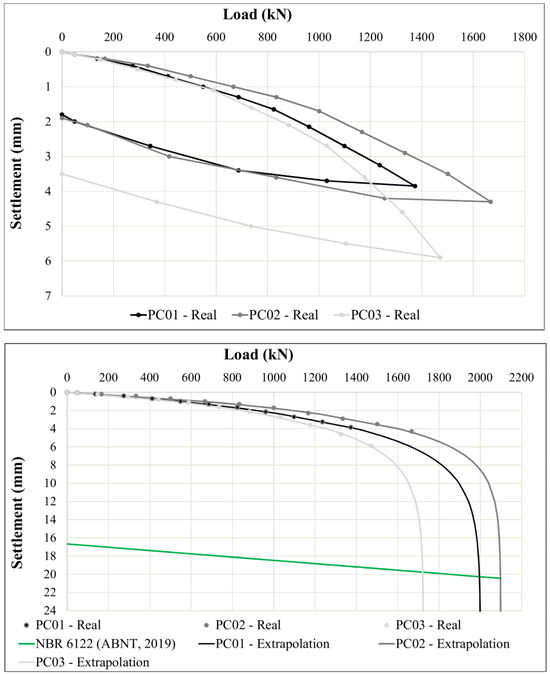
Figure 4.
(Top): Load versus settlement curves. (Bottom): Extrapolation of load versus settlement curves.
The rupture criterion of NBR 6122 [1] was considered (meeting point between a linear extrapolation—following elastic behavior—starting from a percentage of the pile’s diameter and the extrapolation of the measured load vs. the displacement curves). The curves were extrapolated using the method of Van der Veen [11]. For PC01, the rupture load was estimated at 204tf, resulting in an FS of 2.34. For PC02, the estimation of the rupture was 214 tf with an FS of 2.10. PC03 resulted in a rupture load of 175.8 tf and an FS of 1.91.
3.2. Data Collection for Execution Energy Calculation and Spatialization
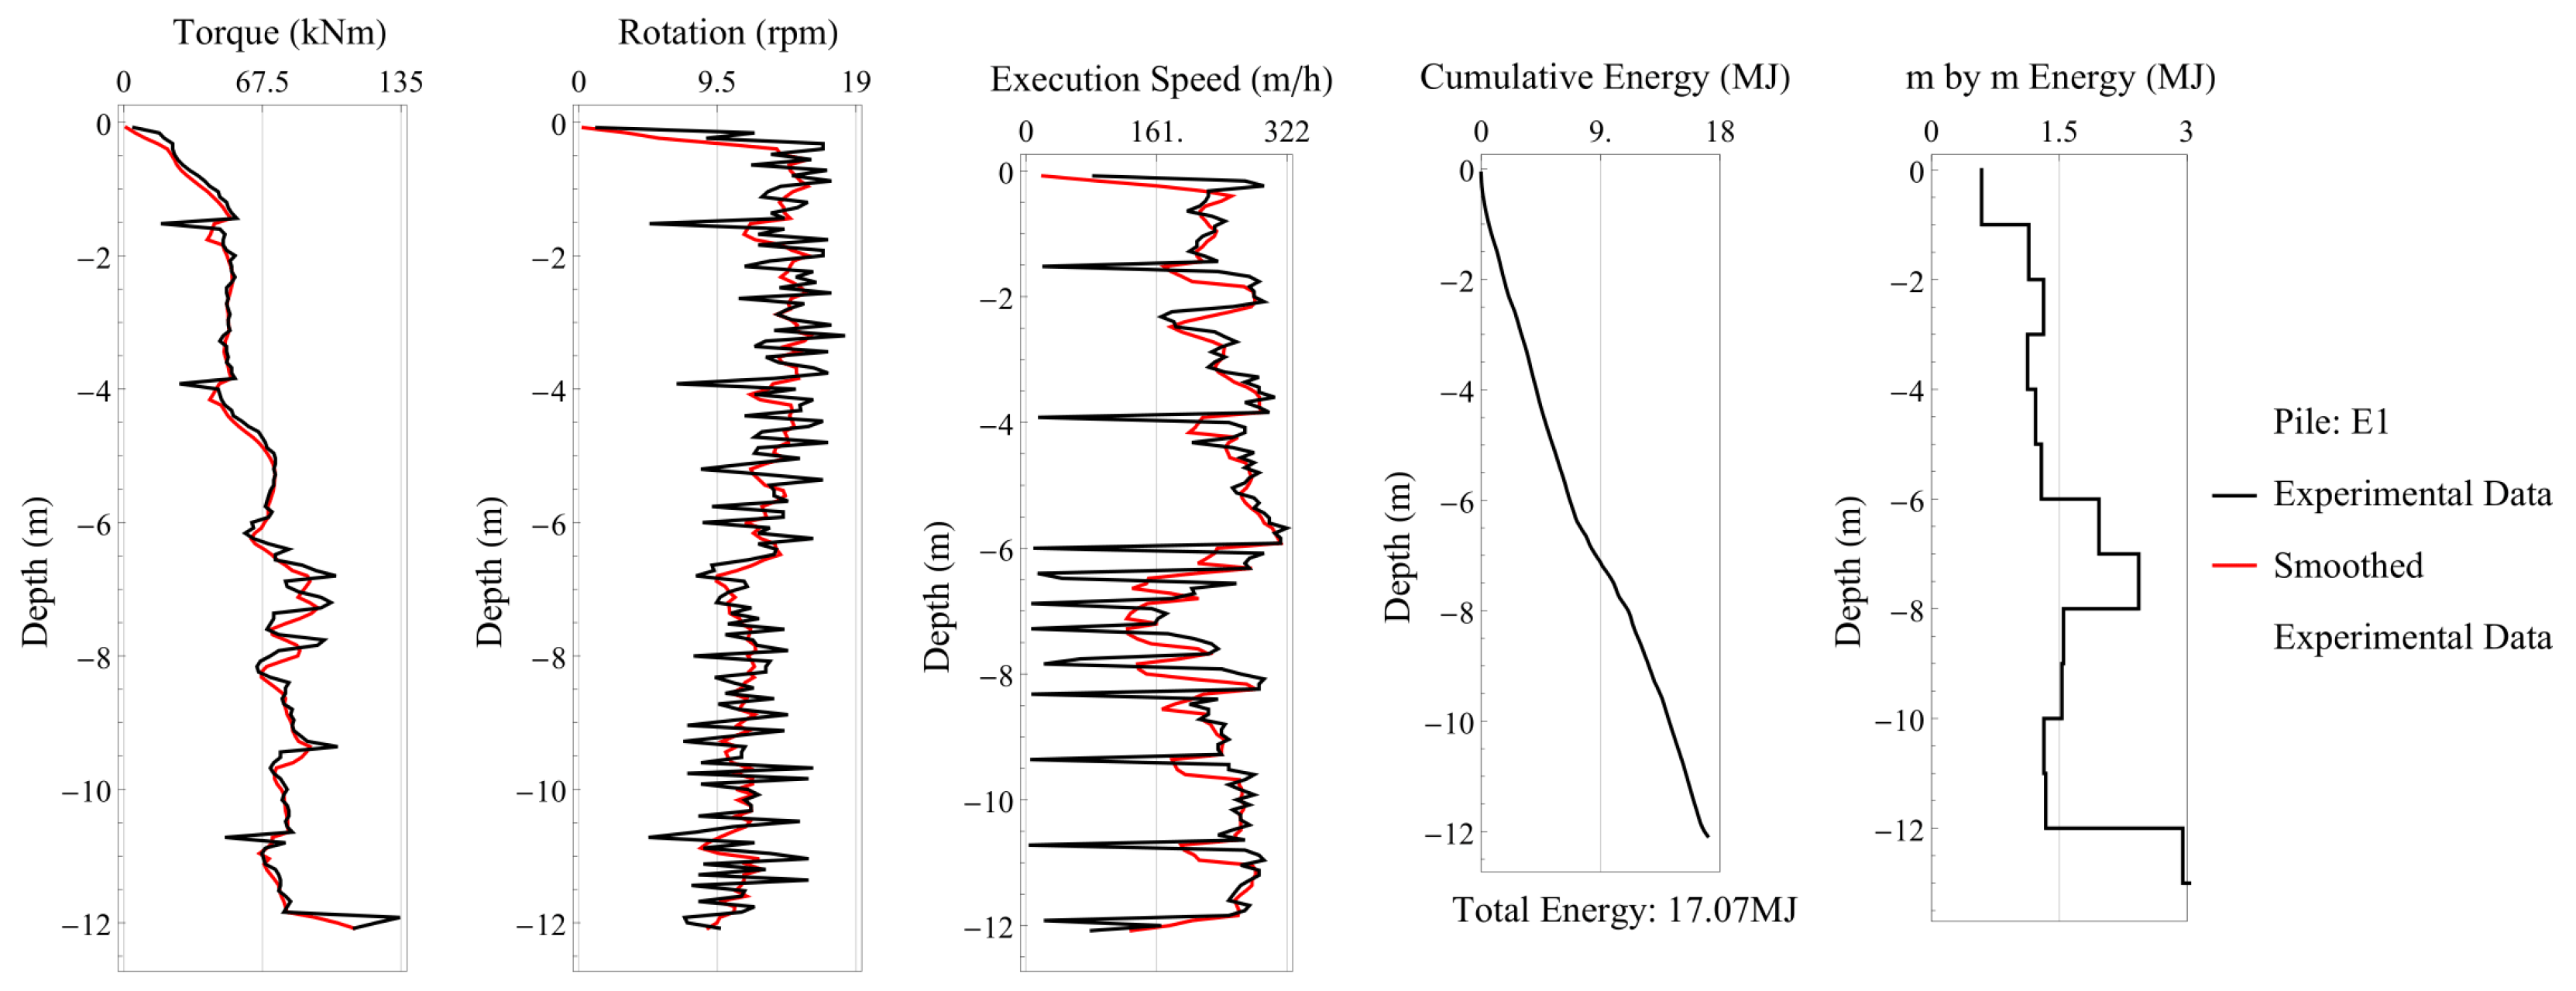
An automated code was created using Mathematica® software to calculate the cumulative execution energy meter by meter. The idea behind calculating the accumulated energy was to obtain the total execution energy and understand the behavior of the stratigraphic profile in terms of energy expenditure, as the quantity of piles significantly covered the entire building site. Through the graphs plotted in Figure 5, as an example, it can be seen how the procedure generated the energies of the foundation piles. To obtain the smoothed version of the plots (in red), a 2-neighbor moving average was used.
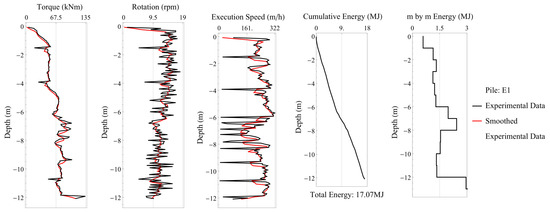
Figure 5.
Calculated execution energy: foundation pile.
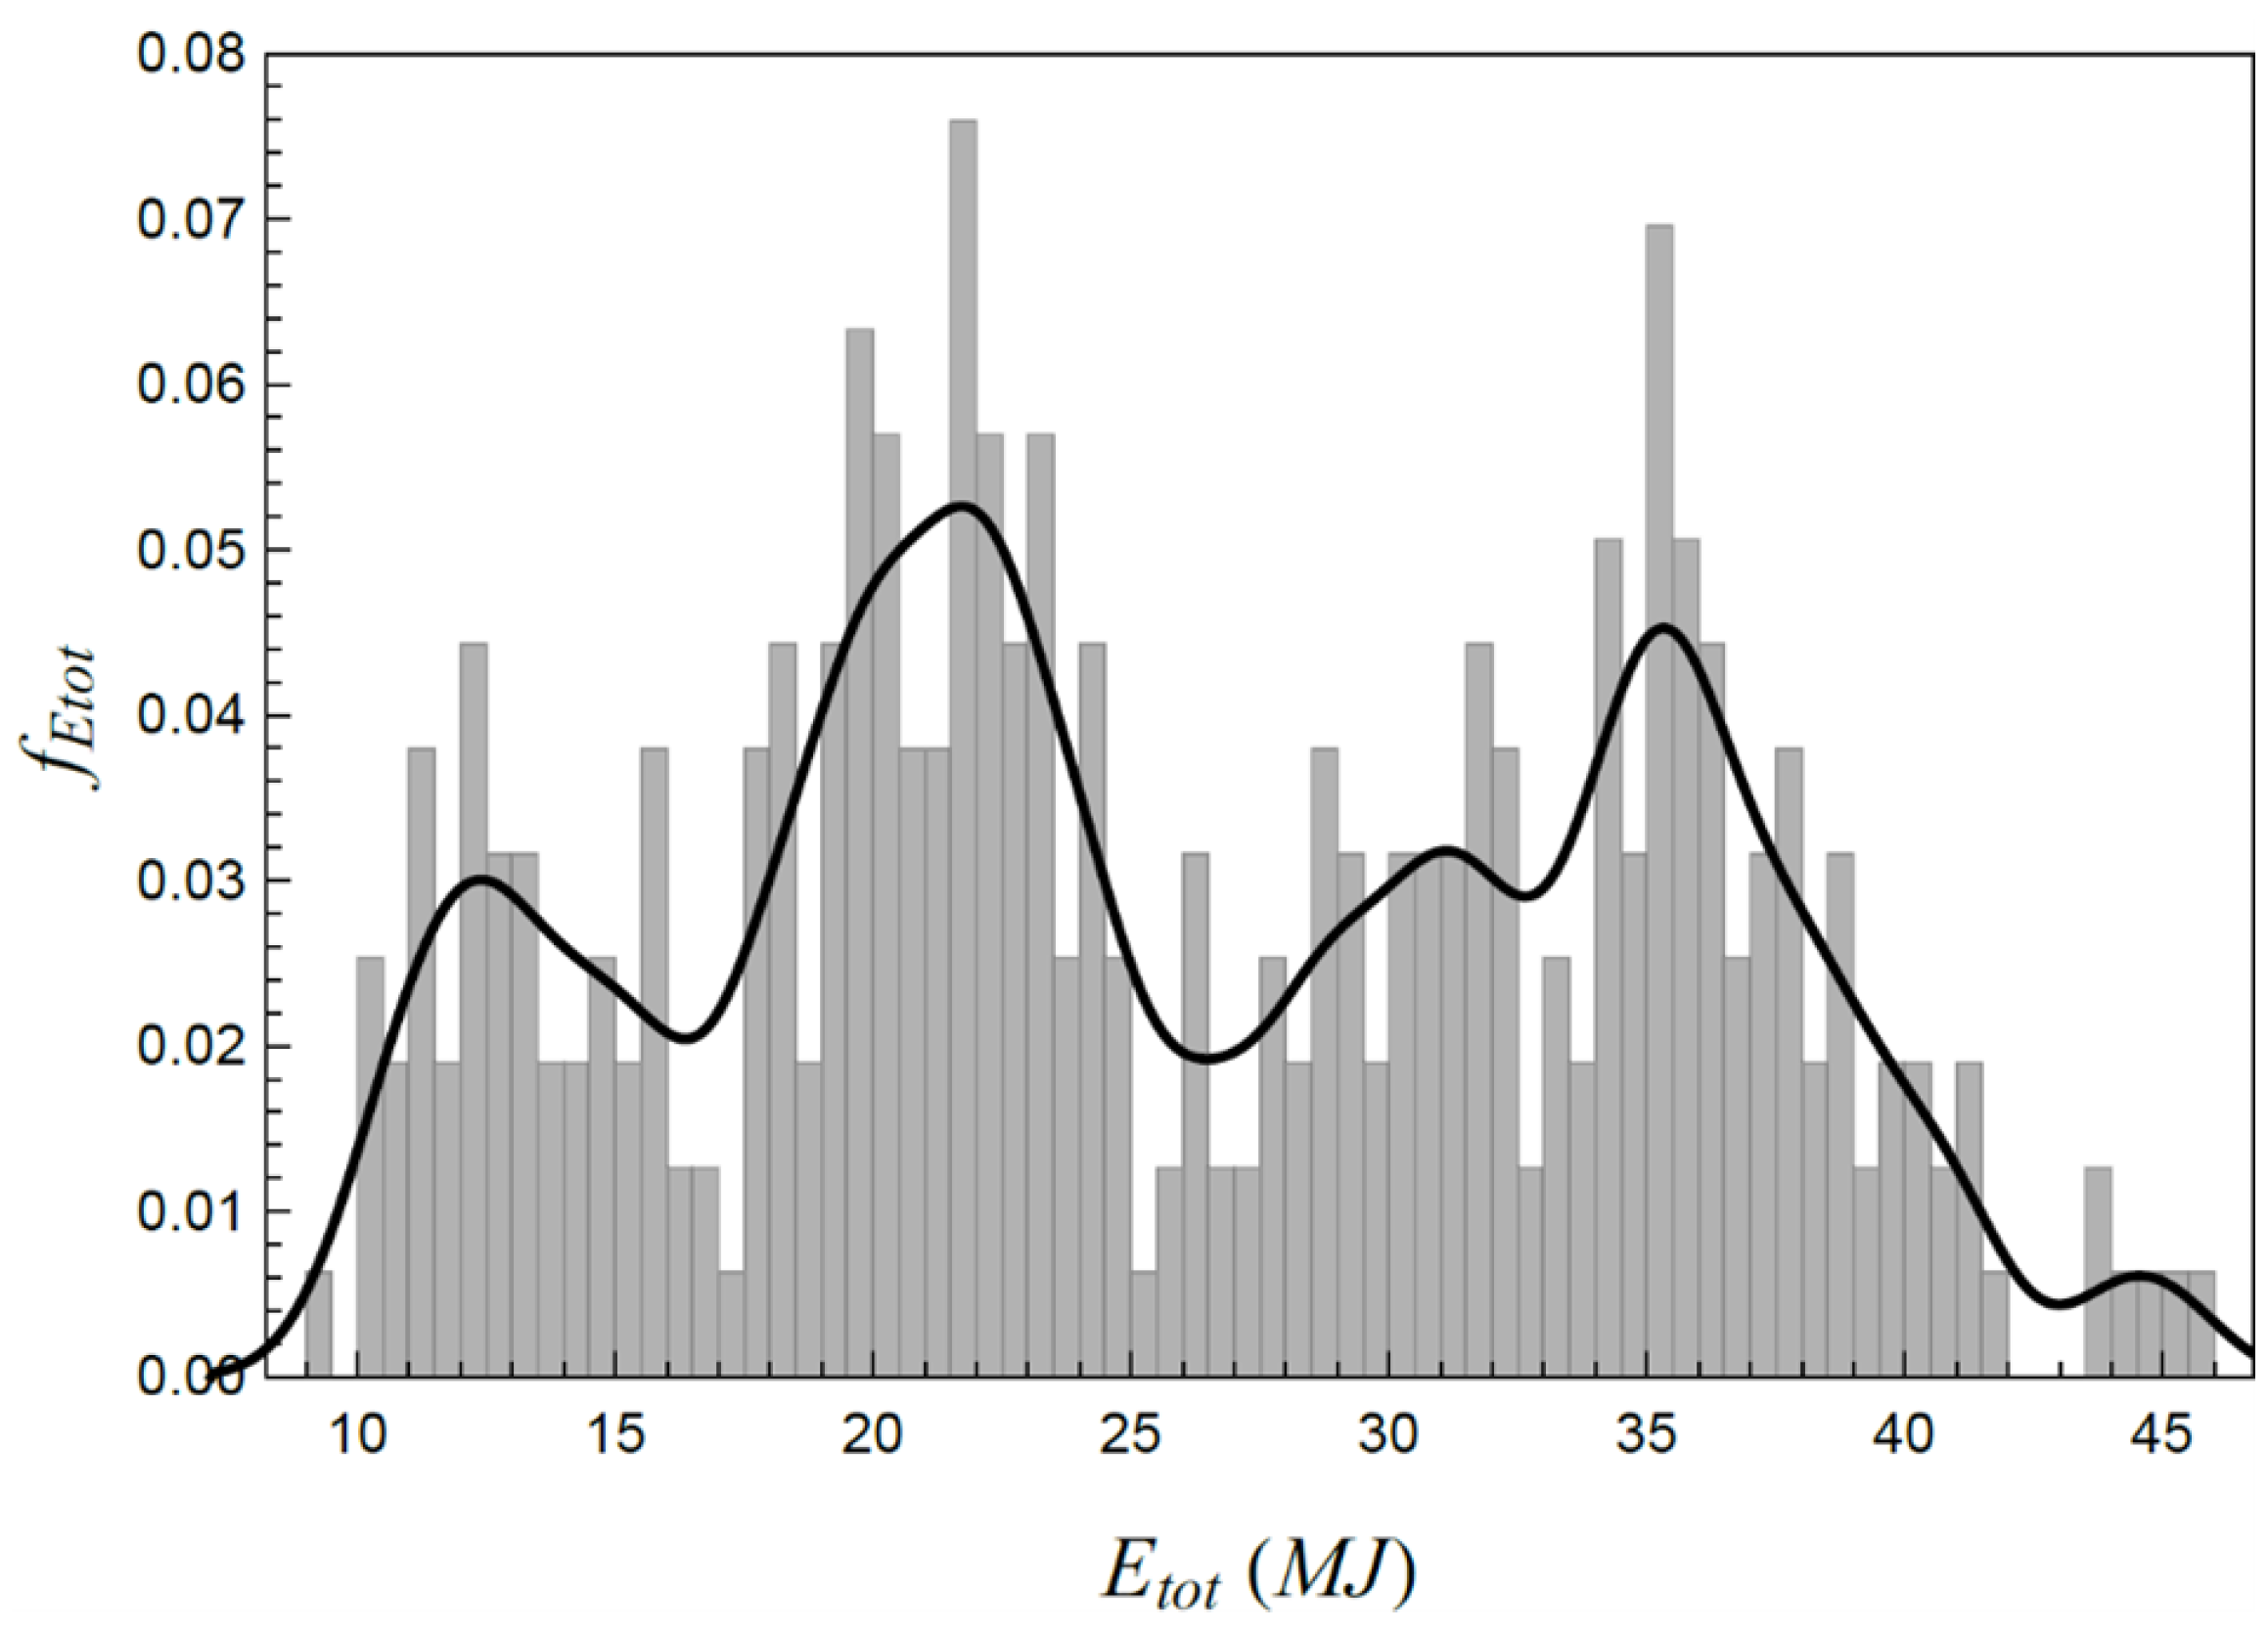
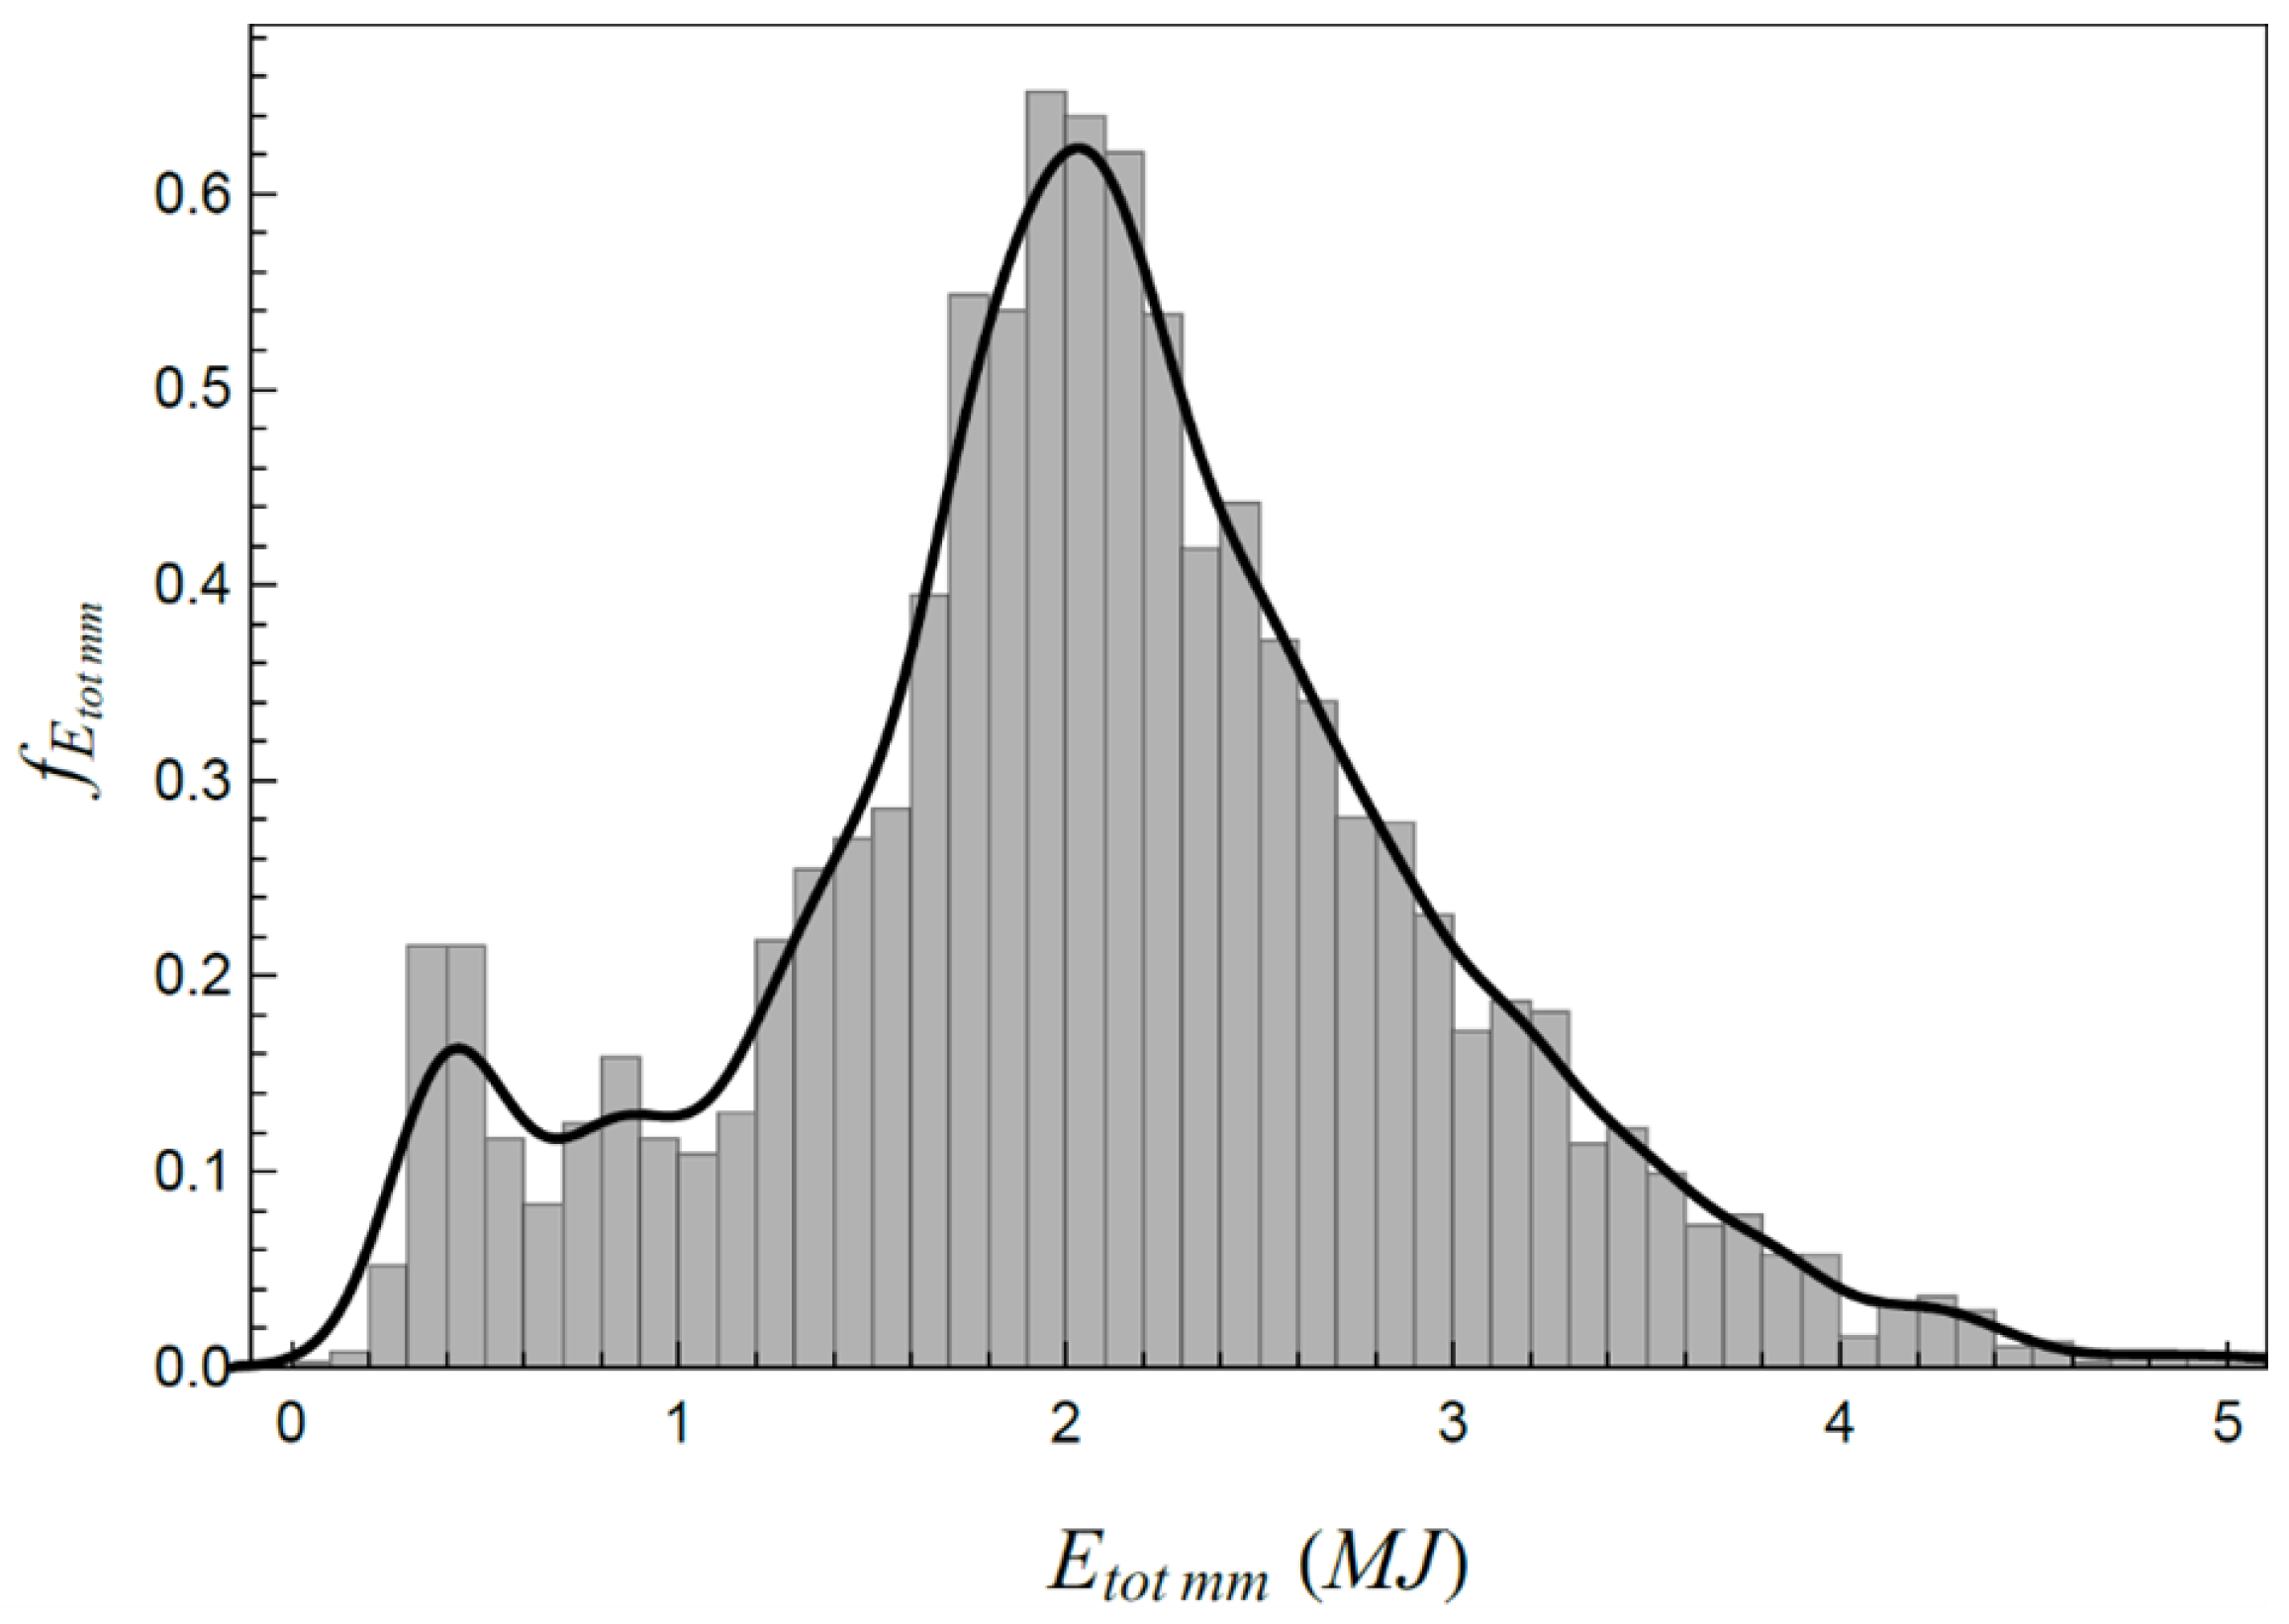
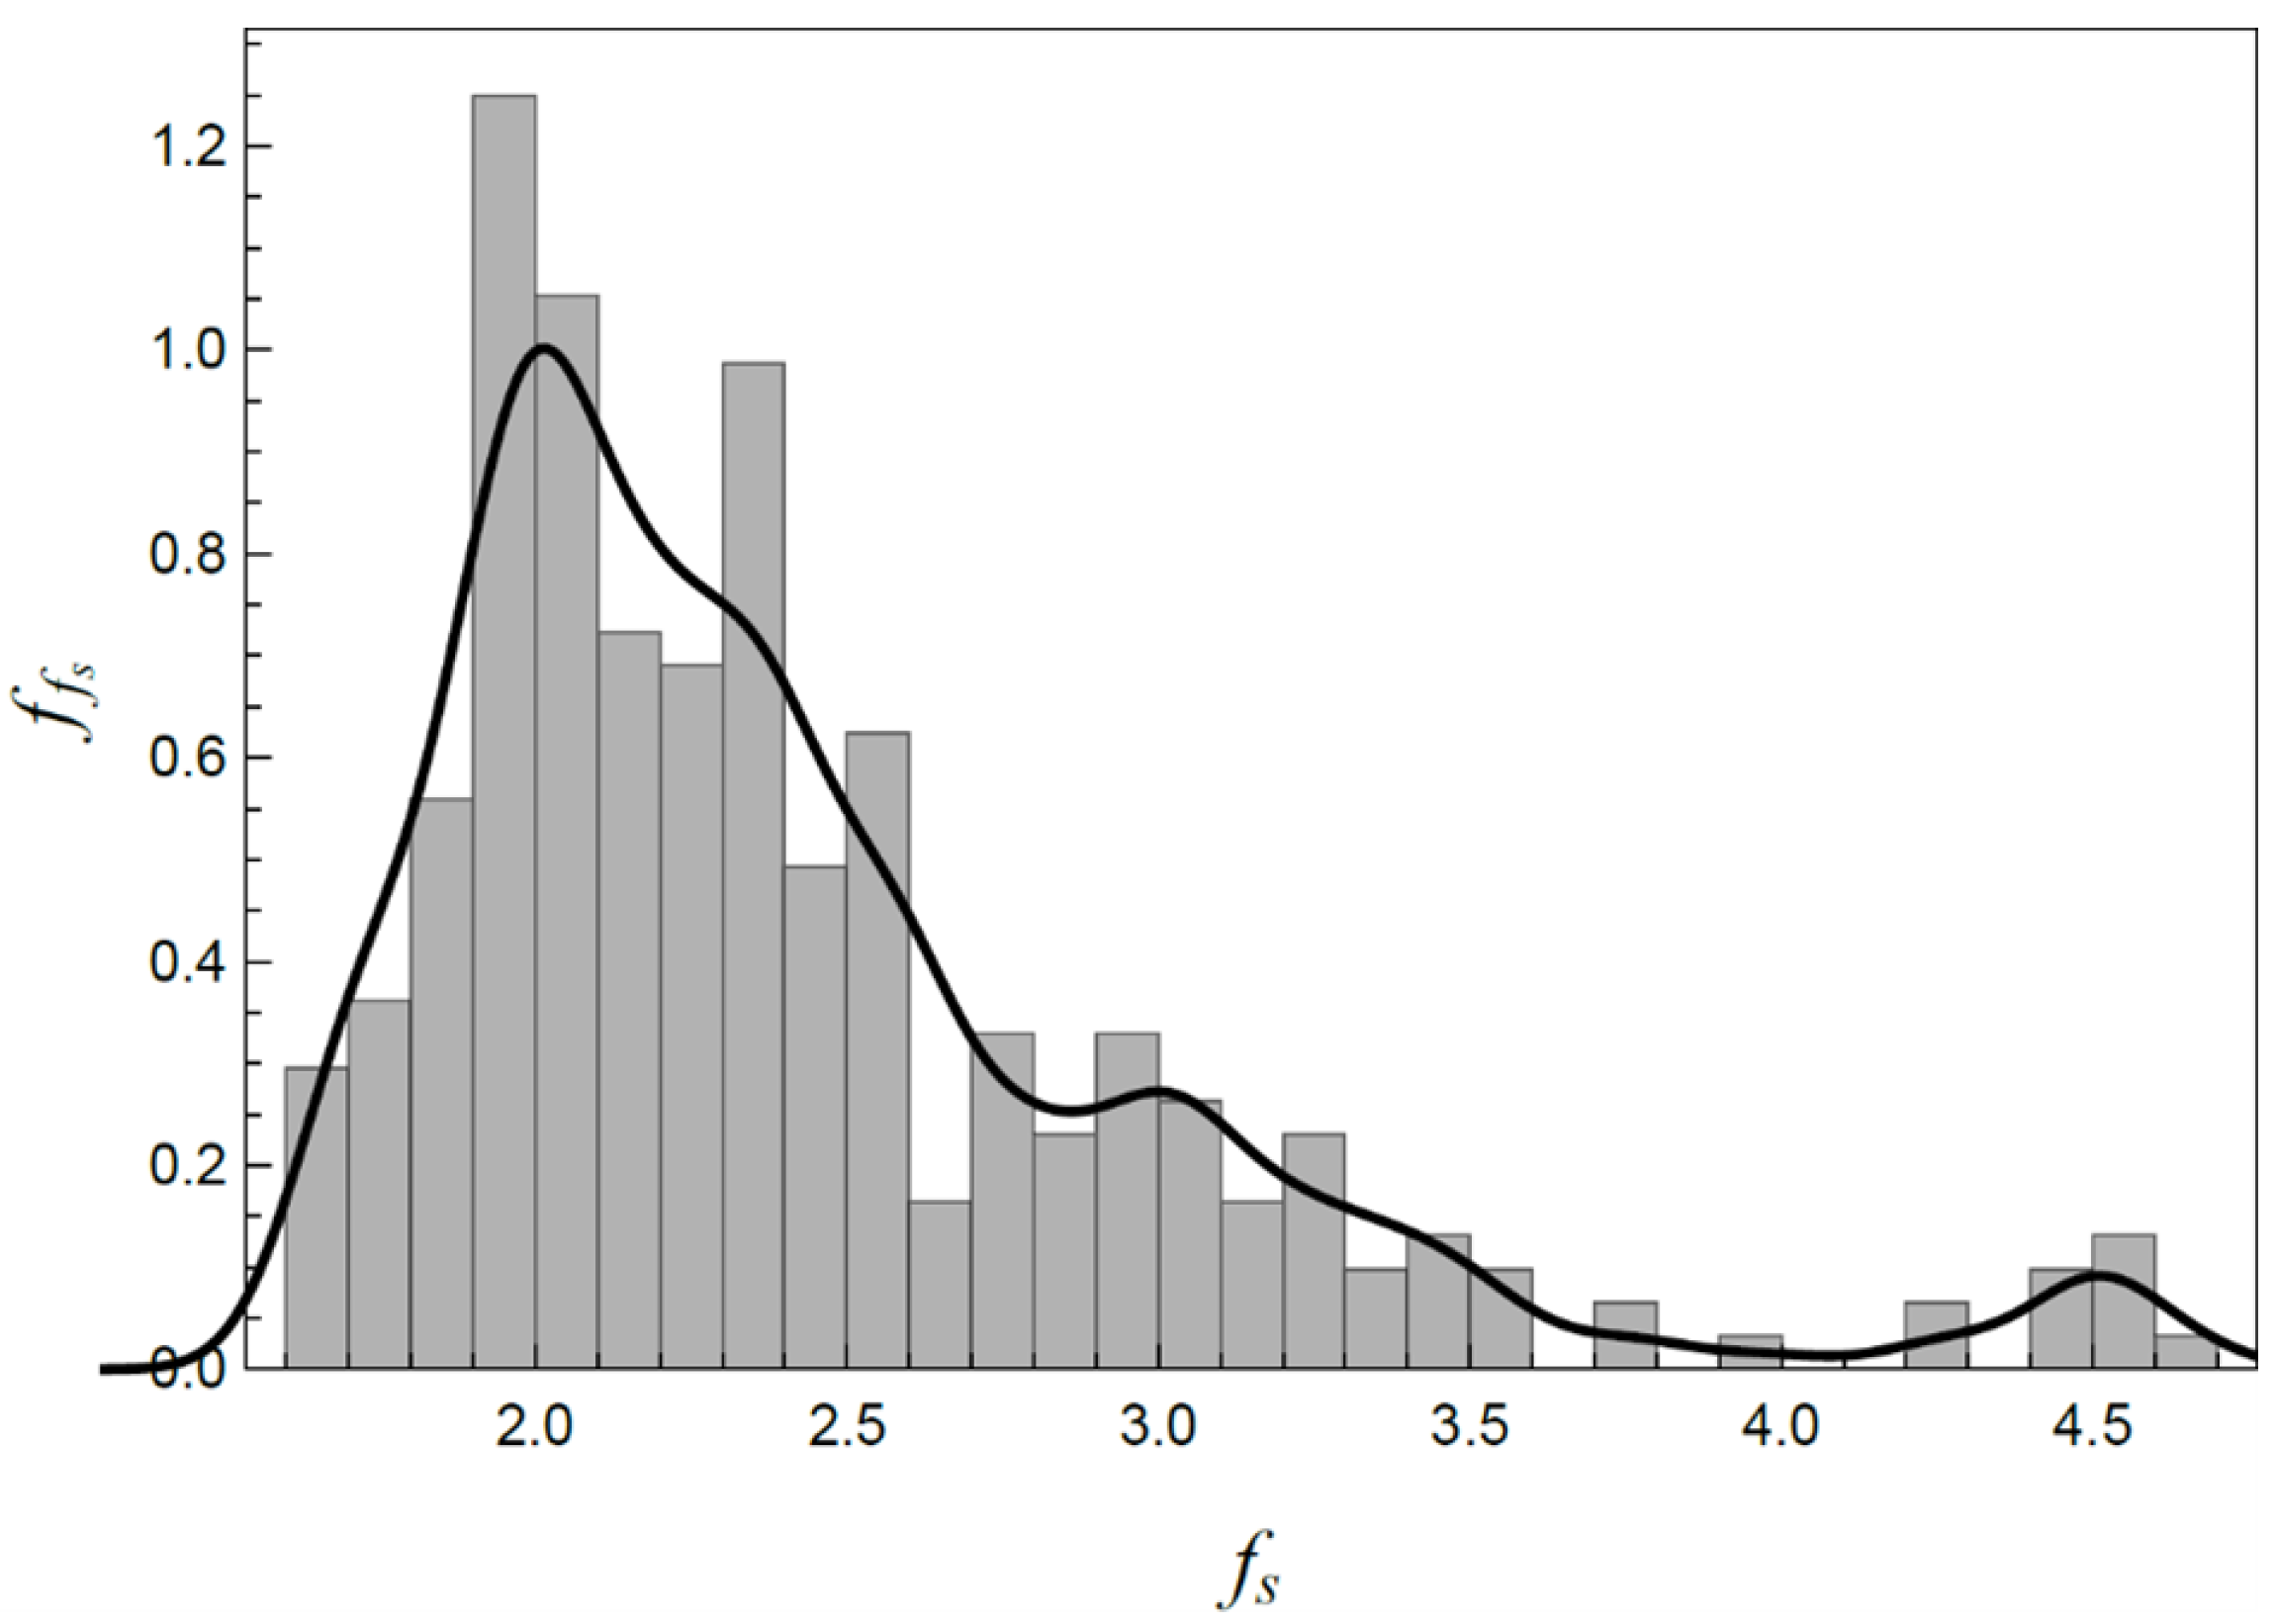
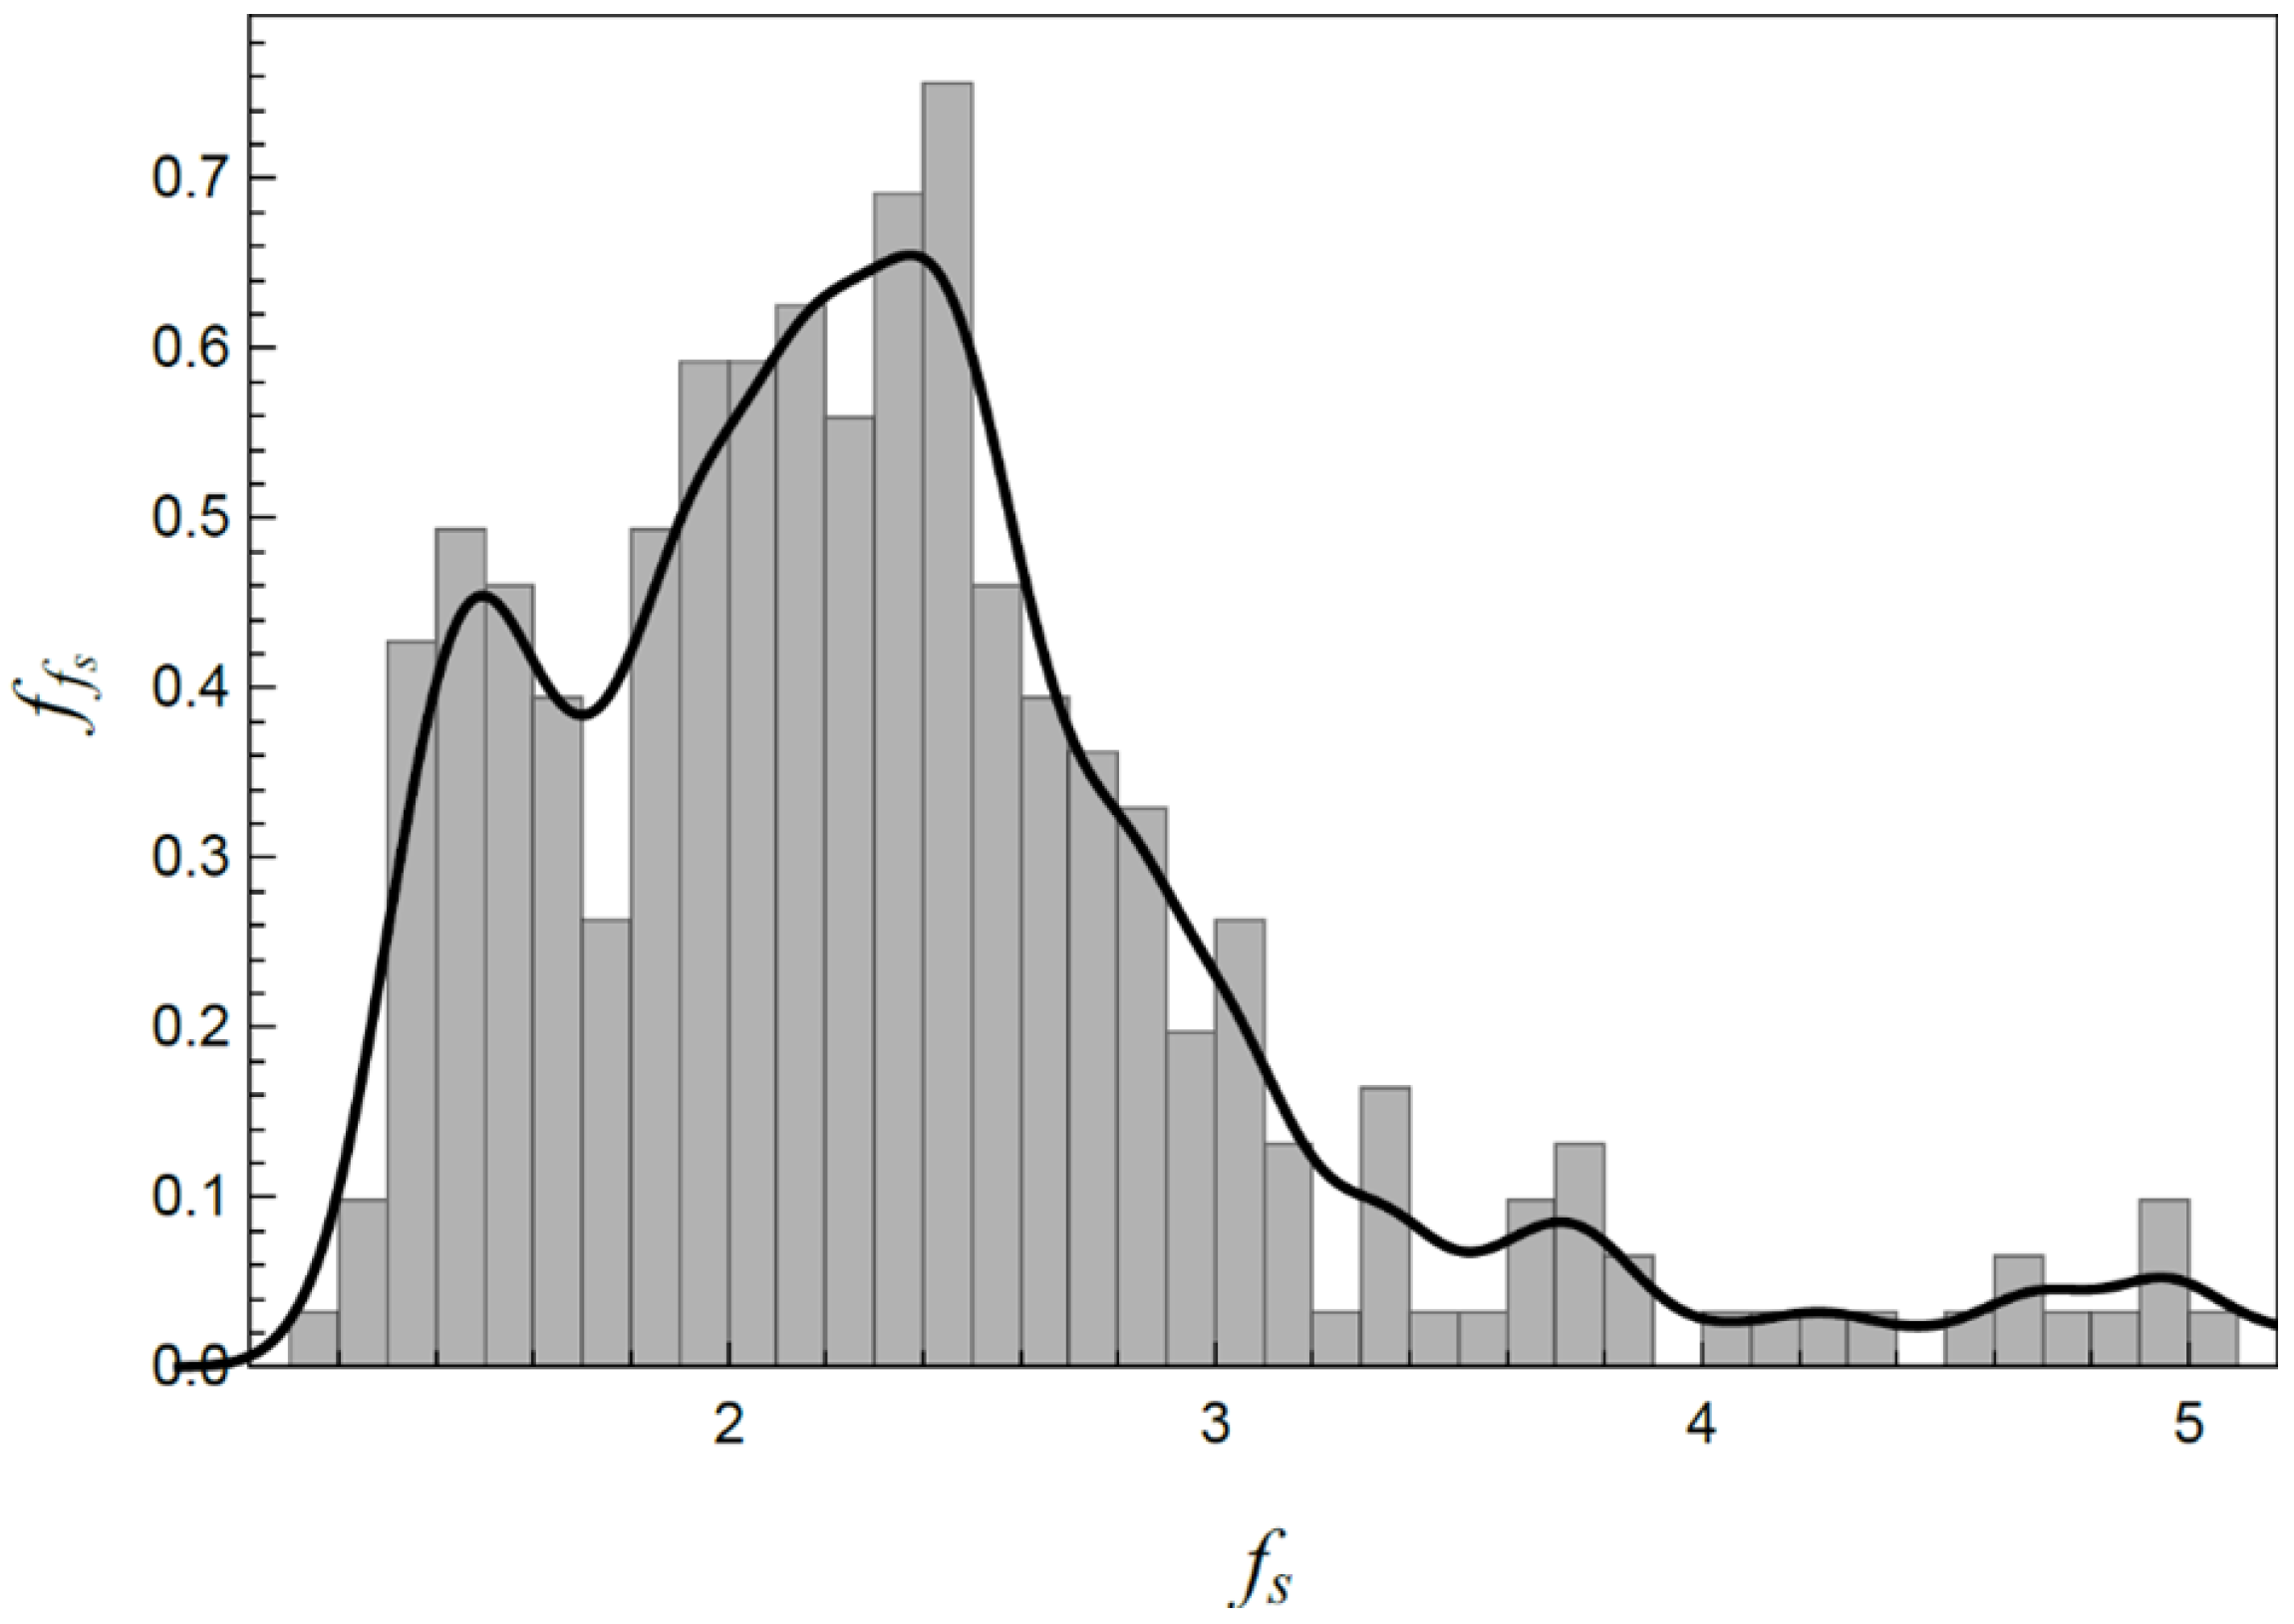
Figure 6 (bin size 0.5 MJ) and Figure 7 (bin size 0.1 MJ) depict histograms representing the frequency curve of total execution energy and meter by meter for the foundation piles, respectively.
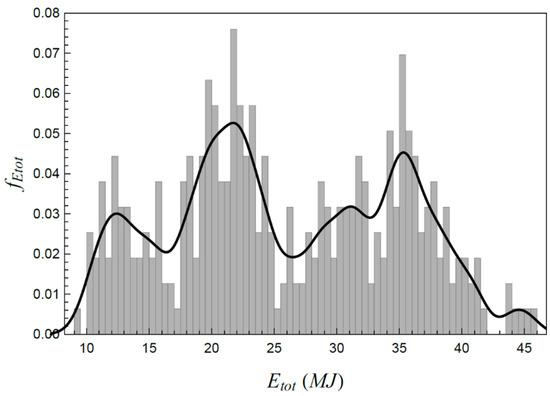
Figure 6.
Frequency curve of the total energy of the foundation piles.
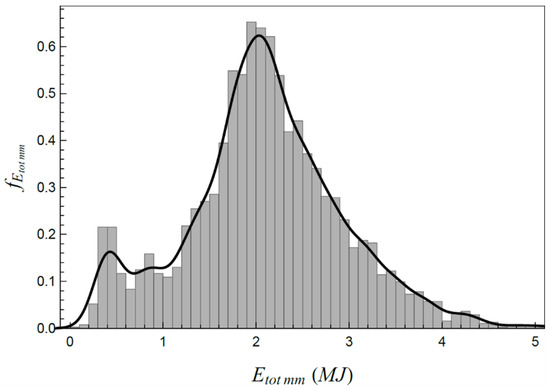
Figure 7.
Frequency curve of the meter by meter energy of the foundation piles.
Considering the first histogram, representing the total energies of the foundation piles, a roughly trimodal (three peaks) histogram was identified, with three well-defined peaks. In physical terms, this meant that in the ground where the piles were seated, there were three families of resistance within the mass. These variations, even considering the effect of stresses, pile lengths, and soil types in the ground’s stratigraphy, indicated three distinct energy levels requiring attention regarding spatial analyses of bearing capacity.
Energy was calculated meter by meter to verify how it varied and behaved in the various soil layers. The initial step in the design and execution analysis of a building is to determine the resistance along the profile of the ground in question.
Like the statistical interpretation of total energy frequency, multimodality (multiple peaks) represented both curves. In this case, as the analyses were per meter, the quantity of energy data proved to be significantly higher. Nevertheless, two to three pronounced peaks could still be noticed, albeit more discreetly. Physically, three peaks for the foundation piles were expected, as this would have correlated with the number of layers characteristic of each soil type within the stratigraphy.
The fact that we observed fewer peaks than physically expected may have been due to the effect of the confining stress differing for the same soil layers depending on the pile’s location. For example, a slice of 1 m of silty clay soil could be at different depths under different confining stresses. The execution energy could have been affected by this confinement, as described by Ozelim et al. [6], due to the growing difficulty to excavate materials subjected to higher confining stress.
3.2.1. Total Energy Spatialization
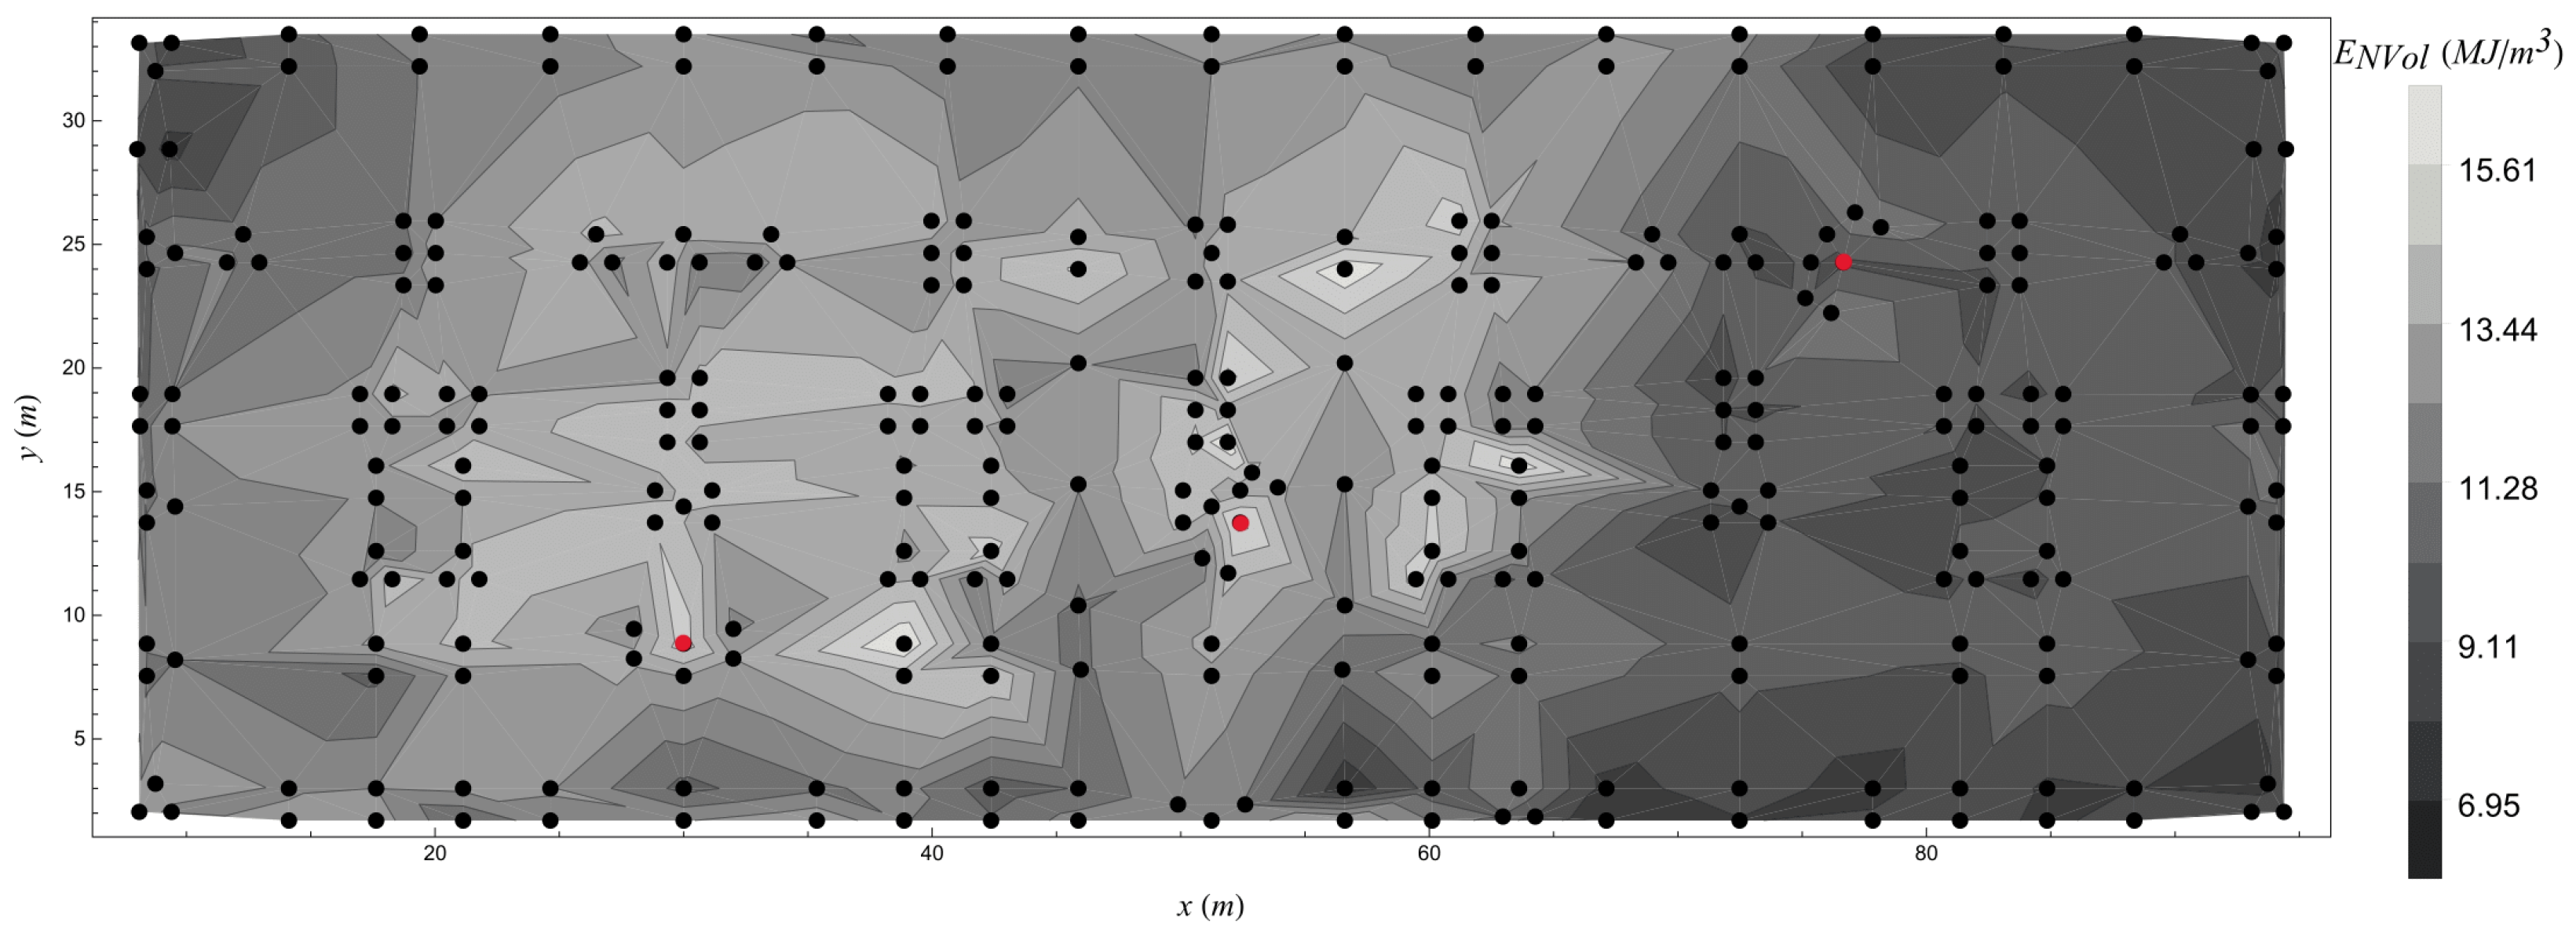
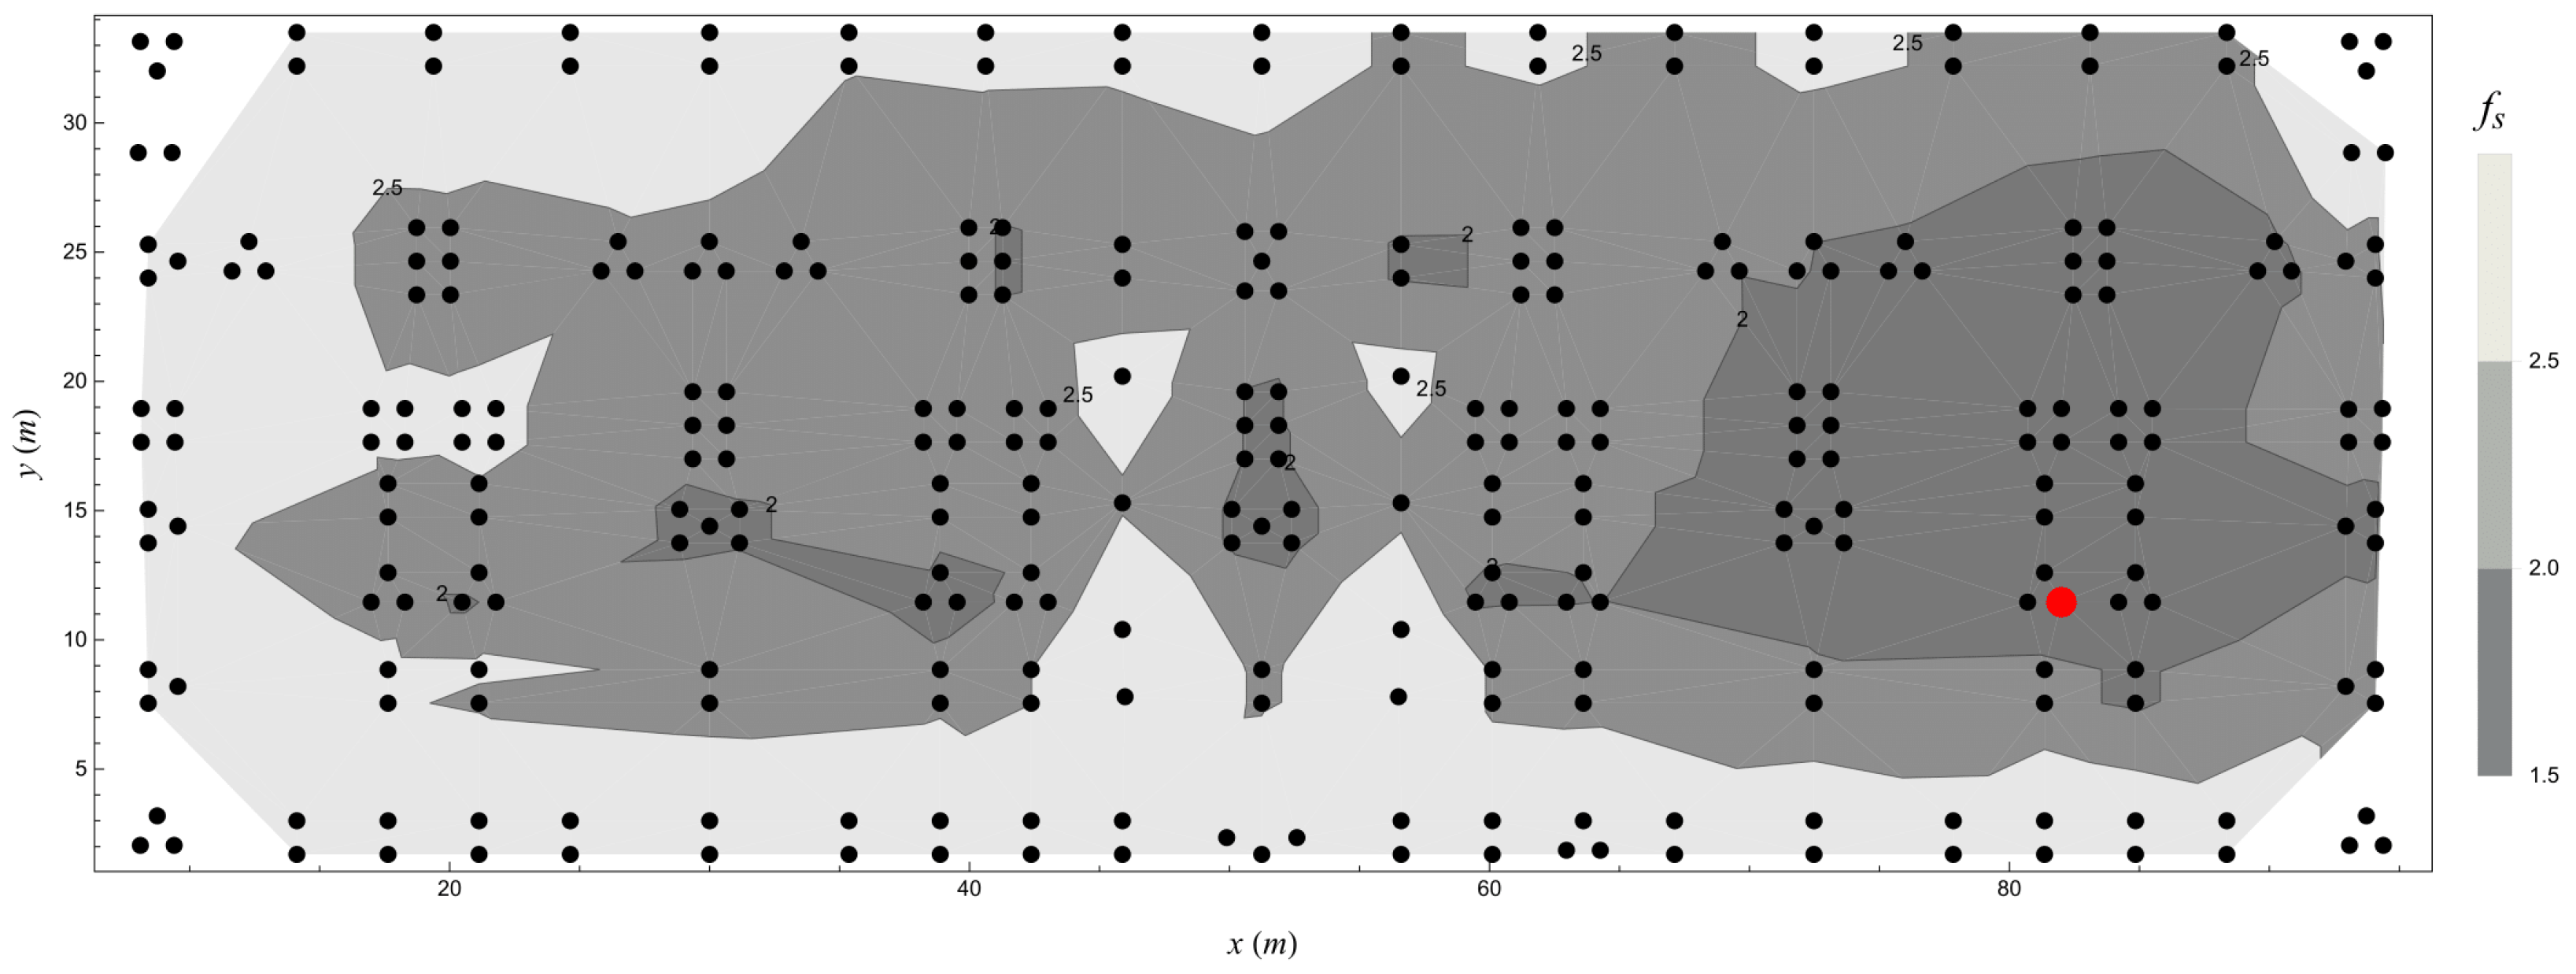
The total energy values were obtained after calculating the accumulated energies of all piles. For a better understanding of how this energy would behave, a spatial heat map was created from the interpolated total energy values in the area of the terrain. Individually, each pile had a certain volume, given by the excavated depth and the geometry of the helices. The total energy of the foundation piles was normalized by its volume, neutralizing the length and diameter effects. These results are presented in Figure 8 together with the positioning of the piles relative to the load tests, highlighted in red.
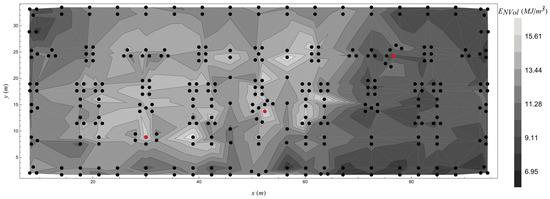
Figure 8.
Spatialization of the density of the energy execution of the foundation piles. Red dots indicate the positioning of the piles which were load tested.
Figure 8 presents an interesting visualization of how each region of the terrain had different energetic expenditures. Since we were dealing with normalized energy values, this figure is a proxy of the distribution of possible bearing capabilities of the terrain. It accounts for a concatenated effect of different soil layers and confining stresses to which the piles were subjected.
3.2.2. Meter by Meter Energy Spatialization
In Figure 9, the normalized meter by meter execution energies are plotted (now normalized by the volume of each 1 m cylindrical slice). When comparing the meter by meter spatial analysis in Figure 9 with Figure 8, where normalization was considered for the whole pile instead of a meter by meter slice, an agreement is observed. Thus, it is evident that the right/lower right portion of the terrain required less energy to be drilled, indicating a lower bearing capacity for piles of the same length when compared to the left portion of the terrain.
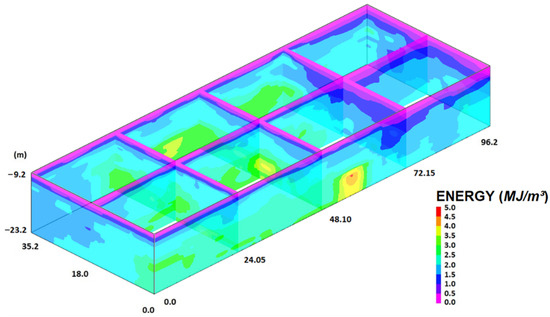
Figure 9.
Spatialization of the energy execution density (MJ/m³) of the foundation piles.
3.3. Model Building
The execution energy, regardless of the failure criterion, is correlated to the bearing capacity of the pile, whether predicted by design methods or measured through load tests [3,4,5]. The aim of the present paper was to validate and quantify this relationship based on the research data, generating analyses of geotechnical behavior that were closer to the actual performance of the piles.
Relationship Between SPT Blows and Execution Energy
For the relationship between SPT blows and execution energy, accumulated data were used, which were the accumulated energy values up to a given depth of excavation (as multiples of 1 m). To represent this relationship, the following steps were required: (1) From the spatialization of the SPT blow model (Figure 3), the one-dimensional profile (extracted from the three-dimensional model) for each pile was obtained by positioning them in their respective place. (2) In the calculation of the execution energy density, the values for each pile were obtained. (3) With the individual values generated from SPT blows and execution energy density, the curve relating SPT blows and accumulated execution energy density was determined.
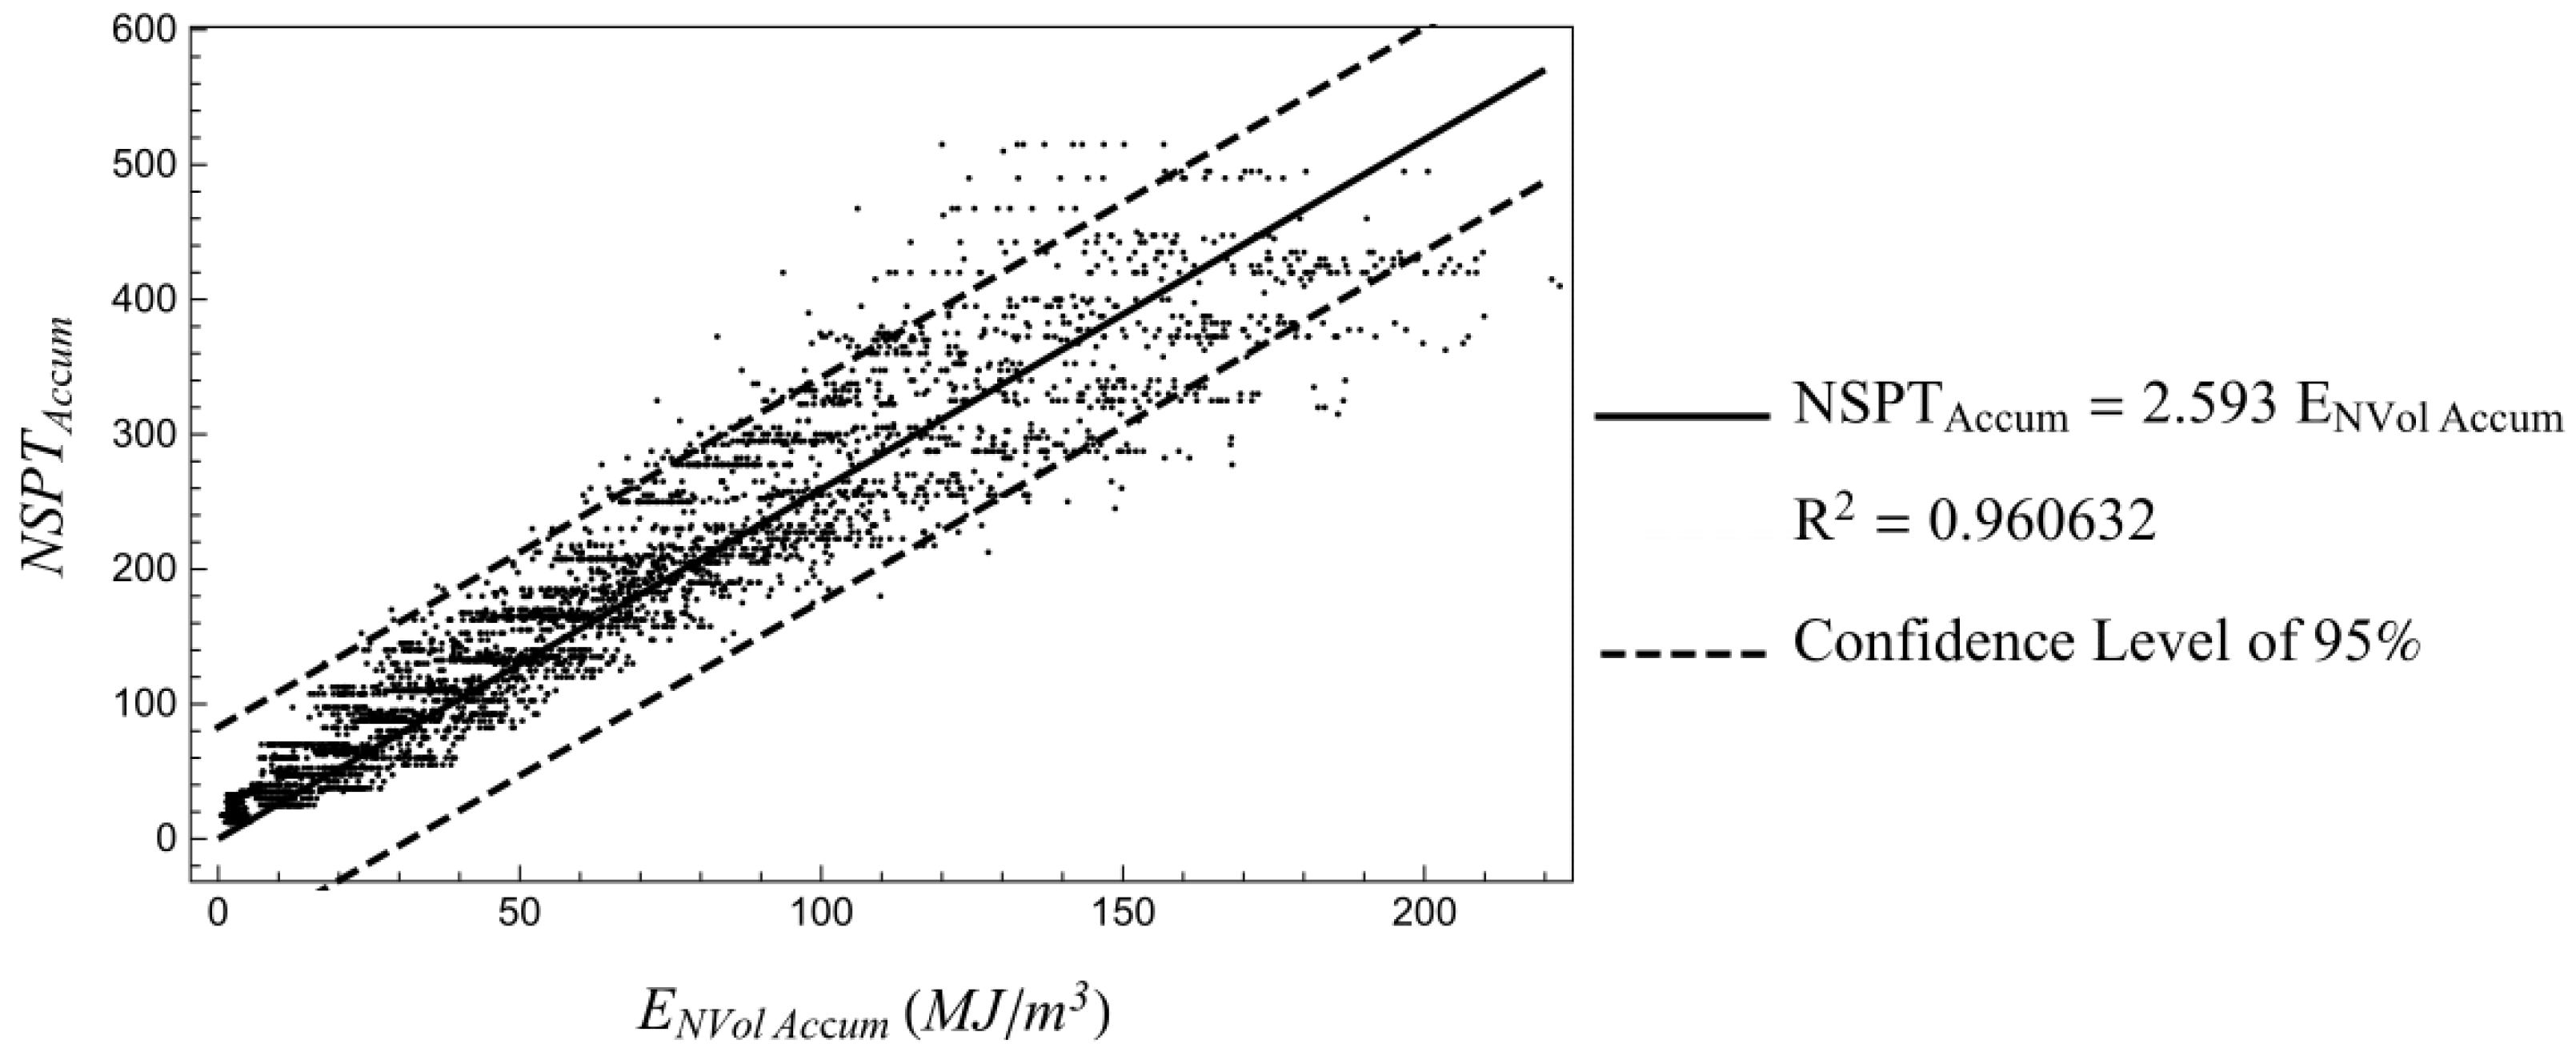
The curve of the average fit was used, with , demonstrated with the 95% confidence level (Figure 10).
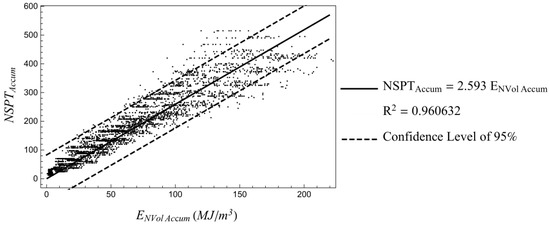
Figure 10.
Accumulated NSPT versus accumulated energy density with a 95% confidence level. The confidence interval indicated presents the region that contained 95% of the data and was bounded by lines parallel to the best-fit one.
It can be seen that the linear fit was representative of the relationship, as the was close to 1. Figure 10 includes 95% confidence bands for the linear relationship between accumulated execution energy and NSPT values. These bands were constructed under the assumption of a fixed slope, allowing only the intercept to vary, which isolated the uncertainty related to the offset between energy and NSPT while preserving the sensitivity of the energy metric.
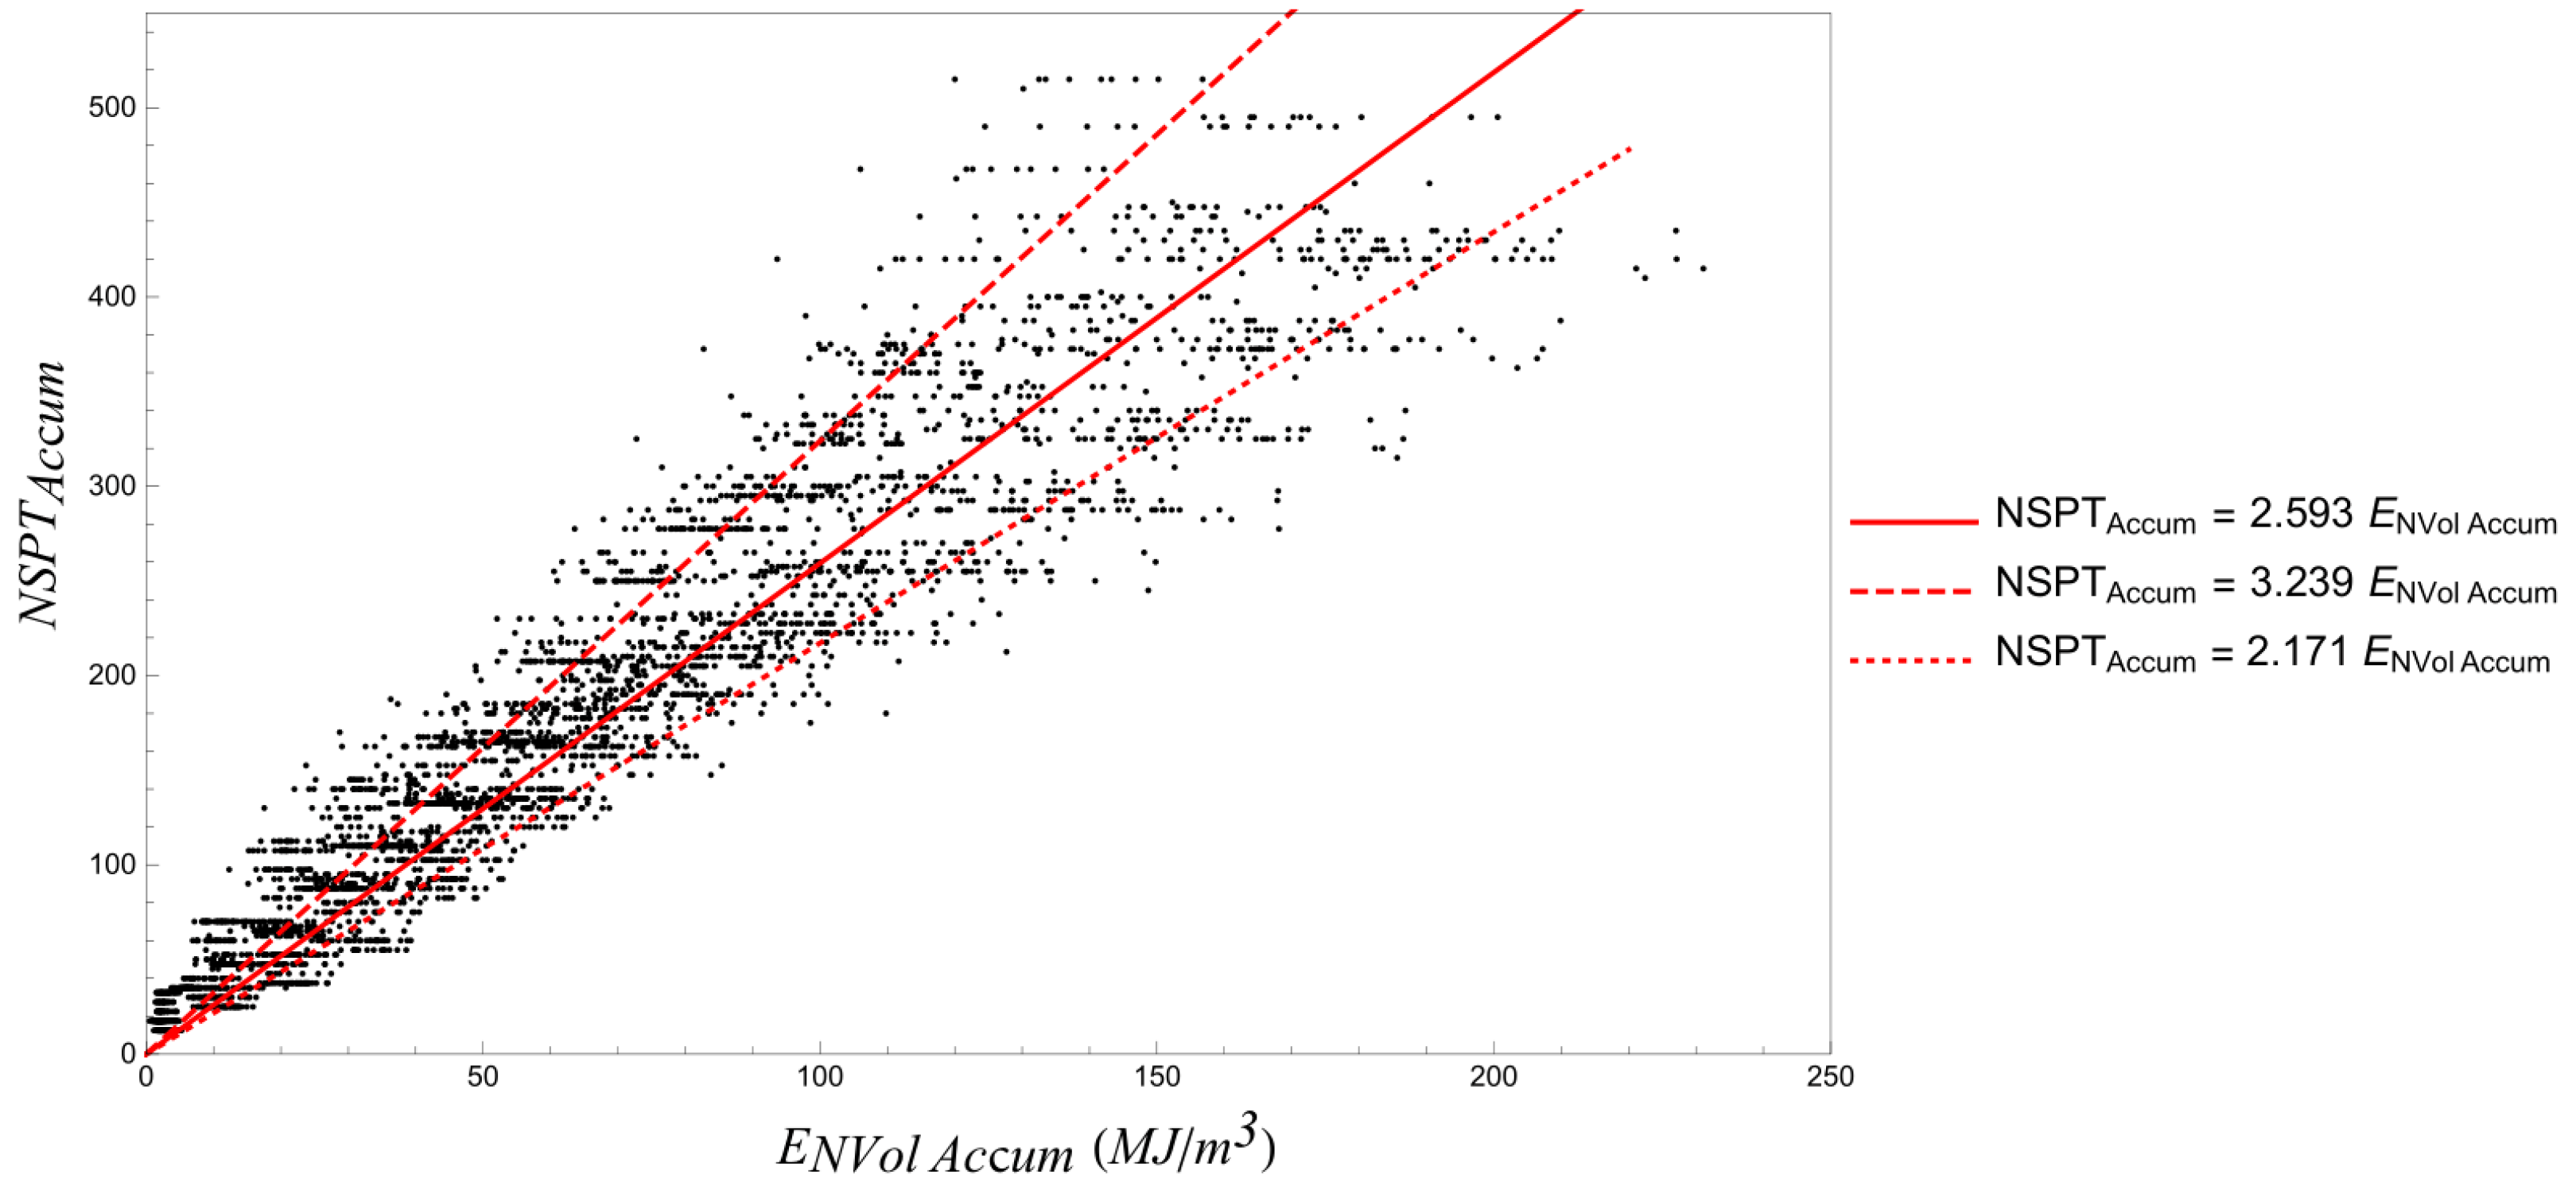
From a practical standpoint, this approach provides a conservative yet informative view for engineering applications. The relatively narrow vertical spread of the bands demonstrates that execution energy is a stable predictor of NSPT over a wide range of values, supporting its use as a proxy for subsurface resistance in design scenarios. The confidence interval allows practitioners to estimate the expected variability in predicted NSPT values and thus integrate this uncertainty into safety factors, performance assessments, or probabilistic design frameworks. This contributes to more reliable application of energy-based monitoring in heterogeneous soil conditions. On the other hand, fitted curves for maximum and minimum values at each abscissa can be plotted. These curves can be visualized in Figure 11.
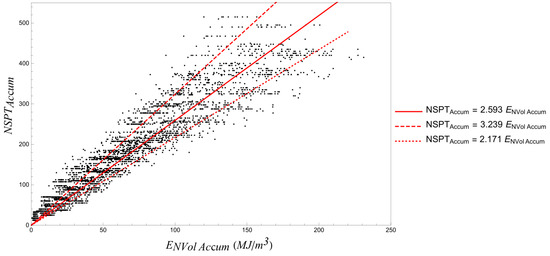
Figure 11.
Relationship between accumulated NSPT and accumulated energy density.
The three curves on the graph exhibited linear behavior when fitting the data of the NSPT and energy density relationship. The variation from the smallest value to the central value was 16.2% and that from the central value to the largest value was 19.9%. Depending on how conservative one intends to be, one may pick one of the three linear relations to estimate the accumulated NSPT values from the accumulated normalized energy.
4. Foundation Performance Assessment: Analysis of Results and Discussions
In this section, we will consider the database obtained for the particular foundation site in Brasilia, DF, in order to illustrate the methodology proposed.
4.1. Calculation of Bearing Capacity Using Semi-Empirical Methods
Based on the spatialized values for the number of blows (NSPT) of the three piles tested in the field through load tests, the bearing capacity prediction was calculated using semi-empirical methods, comparing them with the values generated by the load tests. Although semi-empirical methods are accepted in the technical literature and design practice, their applicability and efficiency may vary according to the local soil [23]. The estimated bearing capacities using different methods are shown in Table 1.

Table 1.
Results of the different semi-empirical methods used to estimate the ultimate load of the piles subjected to static load tests.
Comparing the results of the ultimate loads obtained from the three load tests conducted with the results generated by the semi-empirical methods, it is noteworthy that the method proposed by Antunes & Cabral [15] showed the closest approximation to the experimental final result (mean percentage error of only 11,55%), hence the reason for its selection.
This semi-empirical approach was developed specifically for Brazilian residual soils, which exhibit complex behavior due to their partial saturation, structure, and mineralogy, often deviating from assumptions in classical saturated-soil mechanics.
The Antunes & Cabral method implicitly captures some of these regional characteristics by calibrating against a large local dataset of load tests and NSPT values. As a result, it tends to perform better than more generic international methods when applied to similar conditions. This explains its good performance in the case study, where the site geology aligned well with the assumptions embedded in their formulation.
Also, the method’s coefficients were adjusted using a least-squares fitting procedure based on the load test results, with coefficient ranges restricted to literature-supported values. This improved site-specific accuracy, while confidence intervals preserved interpretive reliability. Thus, coefficients and of the method by Antunes & Cabral [15] were further adjusted. For the layers of silty clay and clayey silt, and were determined; for the silty layer, and were determined. These values were within the recommended ranged for each soil type considered.
4.2. Calculation of Bearing Capacity Through Execution Energy
By combining the relationship depicted in Figure 7 with the adjusted method for the actual bearing capacity of the tested piles, it became possible to calculate the bearing capacity through the execution energy for all foundation piles. The spatialized profiles and adjusted coefficients were utilized for each calculation. To facilitate the visualization of the values, the rupture loads were spatialized on the terrain, as shown in Figure 12.
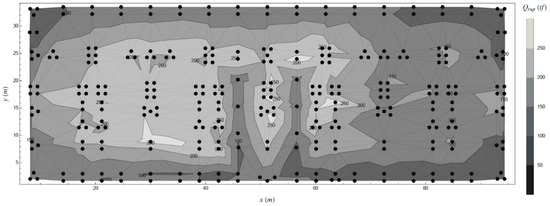
Figure 12.
Heat map of rupture loads through execution energy density.
In the present case study, all piles were executed on a platform with uniform elevation, which simplified spatial referencing. However, the methodology could readily accommodate varying topographic conditions by referencing all measurements—including execution depth and stratigraphy—to a common geodetic or project-specific benchmark (e.g., sea level or a reference elevation). This allowed for consistent geospatial analysis and interpolation, even when pile heads were at different elevations. Also, local stress conditions around the piles could vary depending on the pile’s relative position in the foundation, for example, its proximity to retaining walls or load concentrations. These variations could influence drilling resistance and, consequently, the execution energy profile and calculated bearing capacity. To mitigate these effects, our methodology incorporated confidence intervals around predicted values, which functioned similarly to artificially diminishing the resistances. These intervals provided a conservative buffer that accommodated local variability and helped ensure safe interpretation even when stress fields were not uniform.
4.3. Prediction of Factor of Safety and Risk Analysis Through Execution Energy
There are two scenarios in which stresses and strengths are defined deterministically: safety and ruin. If a foundation design or execution itself is created and controlled based on its statistical characteristics, represented by mean values and their respective variances, scenarios transitioning between safety and ruin states can be identified. In the present study, risk assessment was based on execution energy, bringing greater reliability to the execution process and decision-making regarding the safety of the construction site.
Factors of safety refer to the strength calculated by the indirect method compared to the working loads established by the structural design. Thus, for the foundation blocks, the final working load for each pile was divided by its estimated bearing capacity, generating a histogram with the frequencies of the FS found and their respective spatialization in the terrain.
It is important to note that the analyses for the calculation of FS were carried out in two different ways: (1) The prediction of FS from the bearing capacity generated through spatialized NSPT values. (2) The prediction of FS from the bearing capacity generated through the normalized execution energy of the piles.
In this way, our understanding was facilitated by comparing them. The first prediction is observed in Figure 13 and Figure 14, highlighting the pile with the lowest value in red. The histogram for the FS values has bins equal to 0.1.
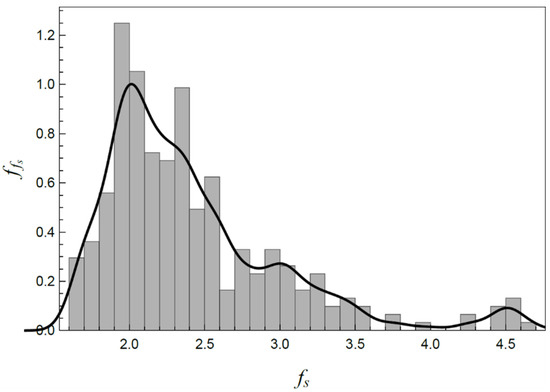
Figure 13.
Frequency of factors of safety (NSPT).
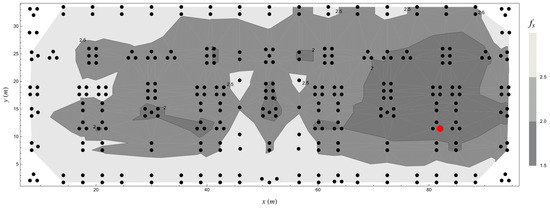
Figure 14.
Heat map of factors of safety determined from NSPT. The pile with the lowest factor of safety calculated from NSPT data is marked in red.
The results showed that all factor of safety values exceeded the minimum required value of 1.6. Values ranging between 1.7 and 2.5 were frequent in the central region of the site, while elevated values were observed at the extremities, justified by the lower demands around the retaining walls.
For bearing capacities estimated based on the execution energy, analogously to the first prediction and aiming for comparison with practical data, the second prediction was carried out as presented in Figure 15 and Figure 16. Similarly to the graph of the FS frequency from the NSPT values, Figure 15 shows it in bins of size 0.1.
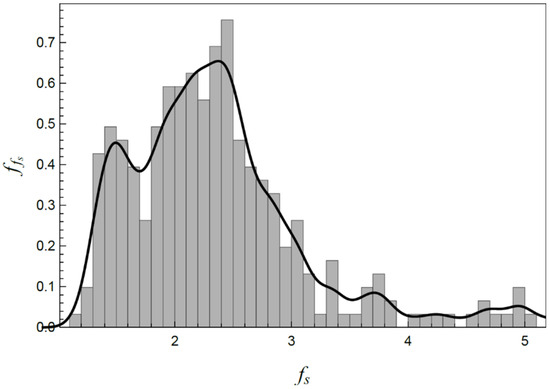
Figure 15.
Frequency of factors of safety based on the density of the execution energy.
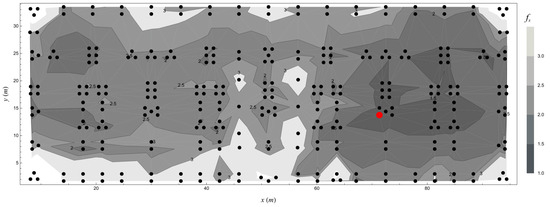
Figure 16.
Heat map of factors of safety based on the density of the execution energy. The pile with the lowest factor of safety calculated from density of the execution energy data is marked in red.
An expected similarity was noticed upon immediate comparison, as a good relationship between SPT blow data and execution energy was previously obtained. Subsequently, the second forecast resulted in a broader distribution of FS values, which could be attributed to having its values calculated based on real data collected from the drilling system throughout the entire terrain. Thus, the predictions provided results with greater reliability for analysis, as the system’s capacity met the demands acting upon it. This was because the first forecast relied on NSPT values spatialized from the borehole campaigns conducted, unlike the second, where each pile had its initial energy value derived from the excavation of each foundation element.
It is noted that the lower FS values calculated in this case were below the minimum allowed but above 1. This difference was justifiable due to the data dispersion between the relationship in accumulated NSPT versus the energy density of execution. The general condition for avoiding failure requires a clear correlation between the factor of safety and the probability of failure, the minimum factor of safety of the standard, and the cost of the consequences related to the risk of failure.
4.4. Economy of Foundations and FS Adaptation
Safety, reliability, and cost must be parameters of joint study and require careful attention. As mentioned in the previous section, the recurring practice of using the factor of safety alone does not guarantee proper analysis and effectiveness in relation to the risks associated with the project and the execution of the work. When it comes to a construction project, particularly in the foundation phase, the aim is to have a structure that offers maximum safety or minimum risk possible and maximum cost savings.
Regarding costs, when adopting safety measures for each pile executed in the foundation, it was observed that a plausible economy could be achieved by applying criteria for stopping and correcting the piles’ length based on the individually required energy. Thus, the quantitatively relevant values were determined by reducing the length of the piles based on the statistical distribution with acceptable FS values and according to the adopted bearing capacity criteria.
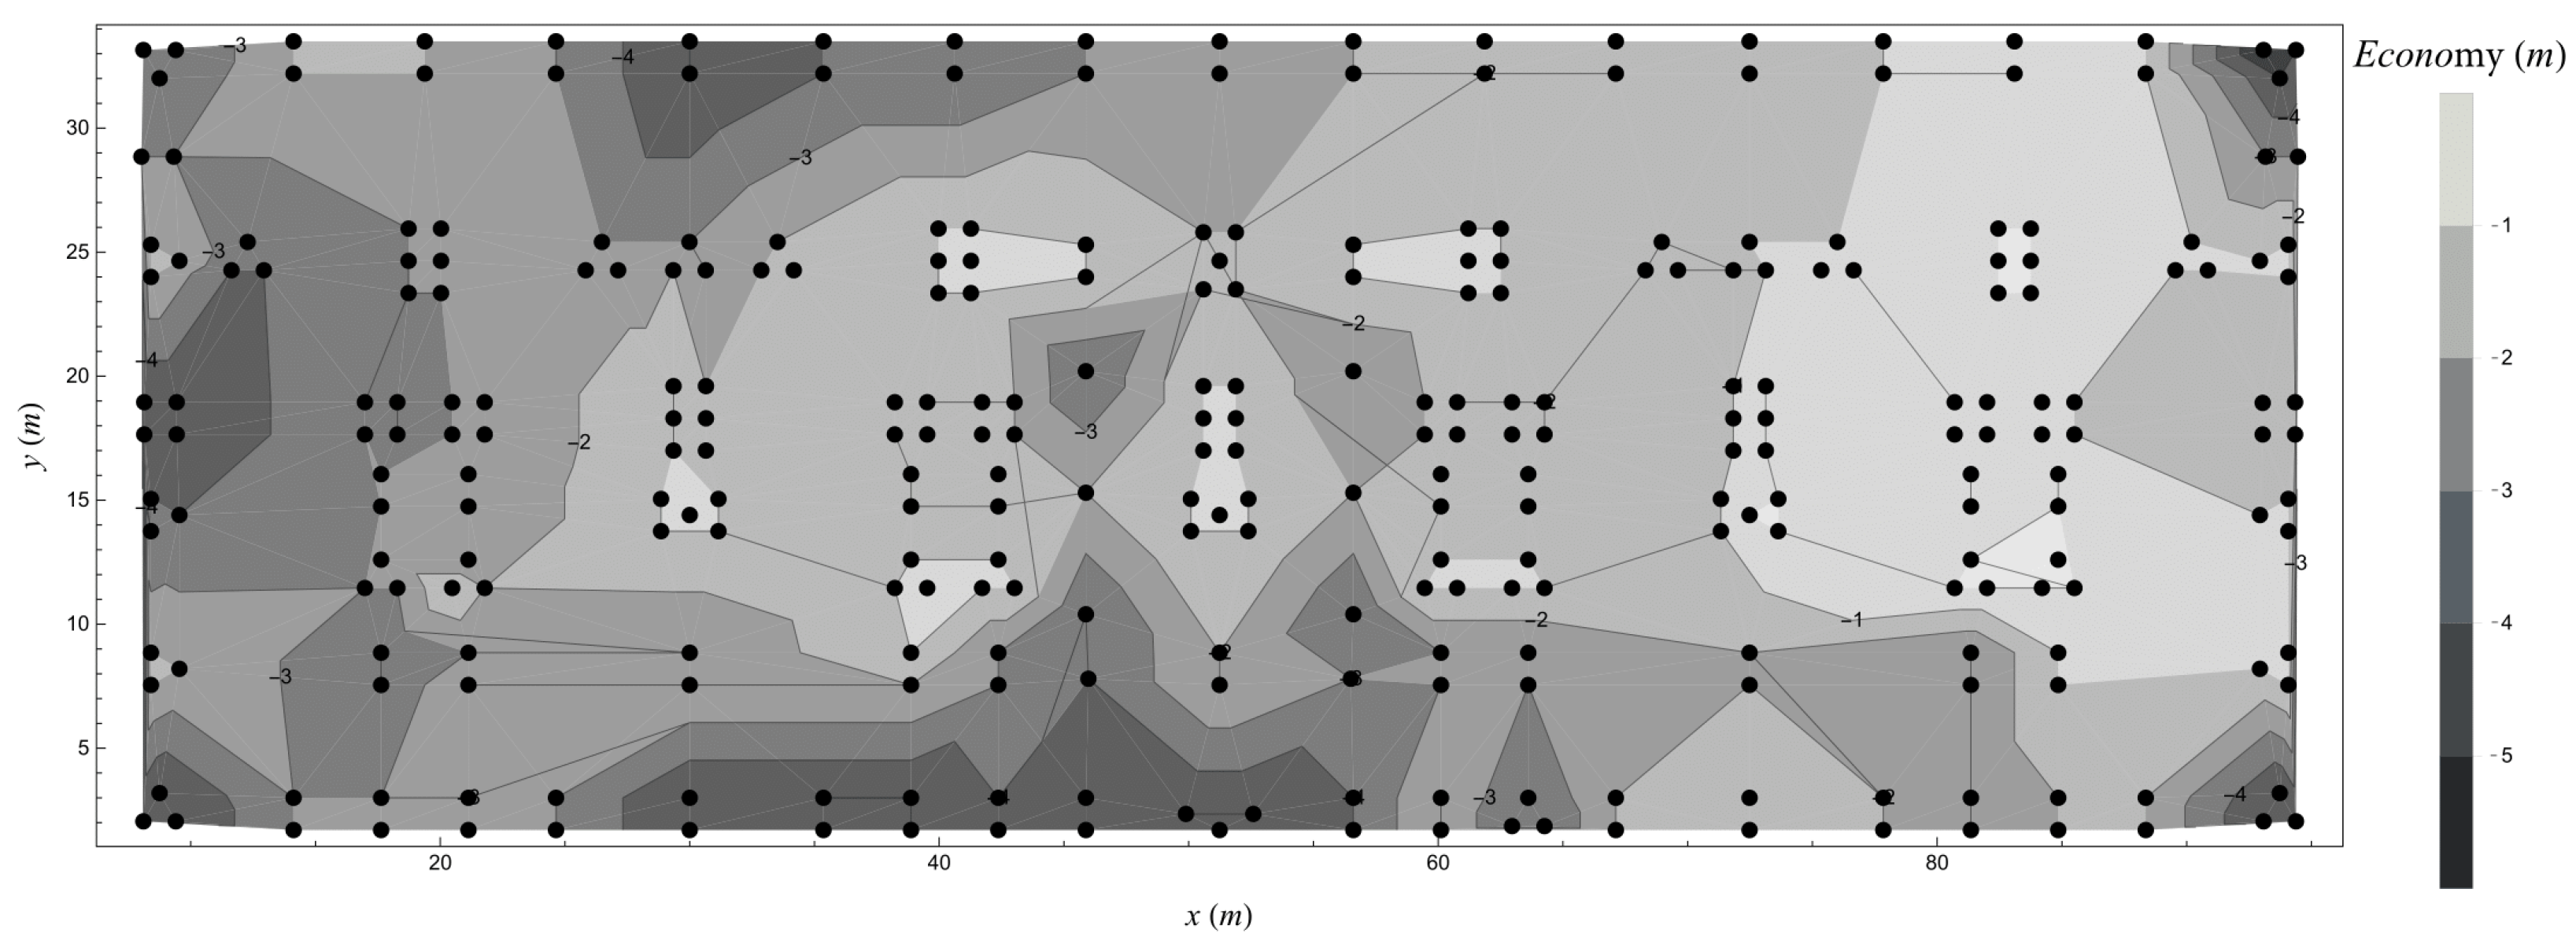
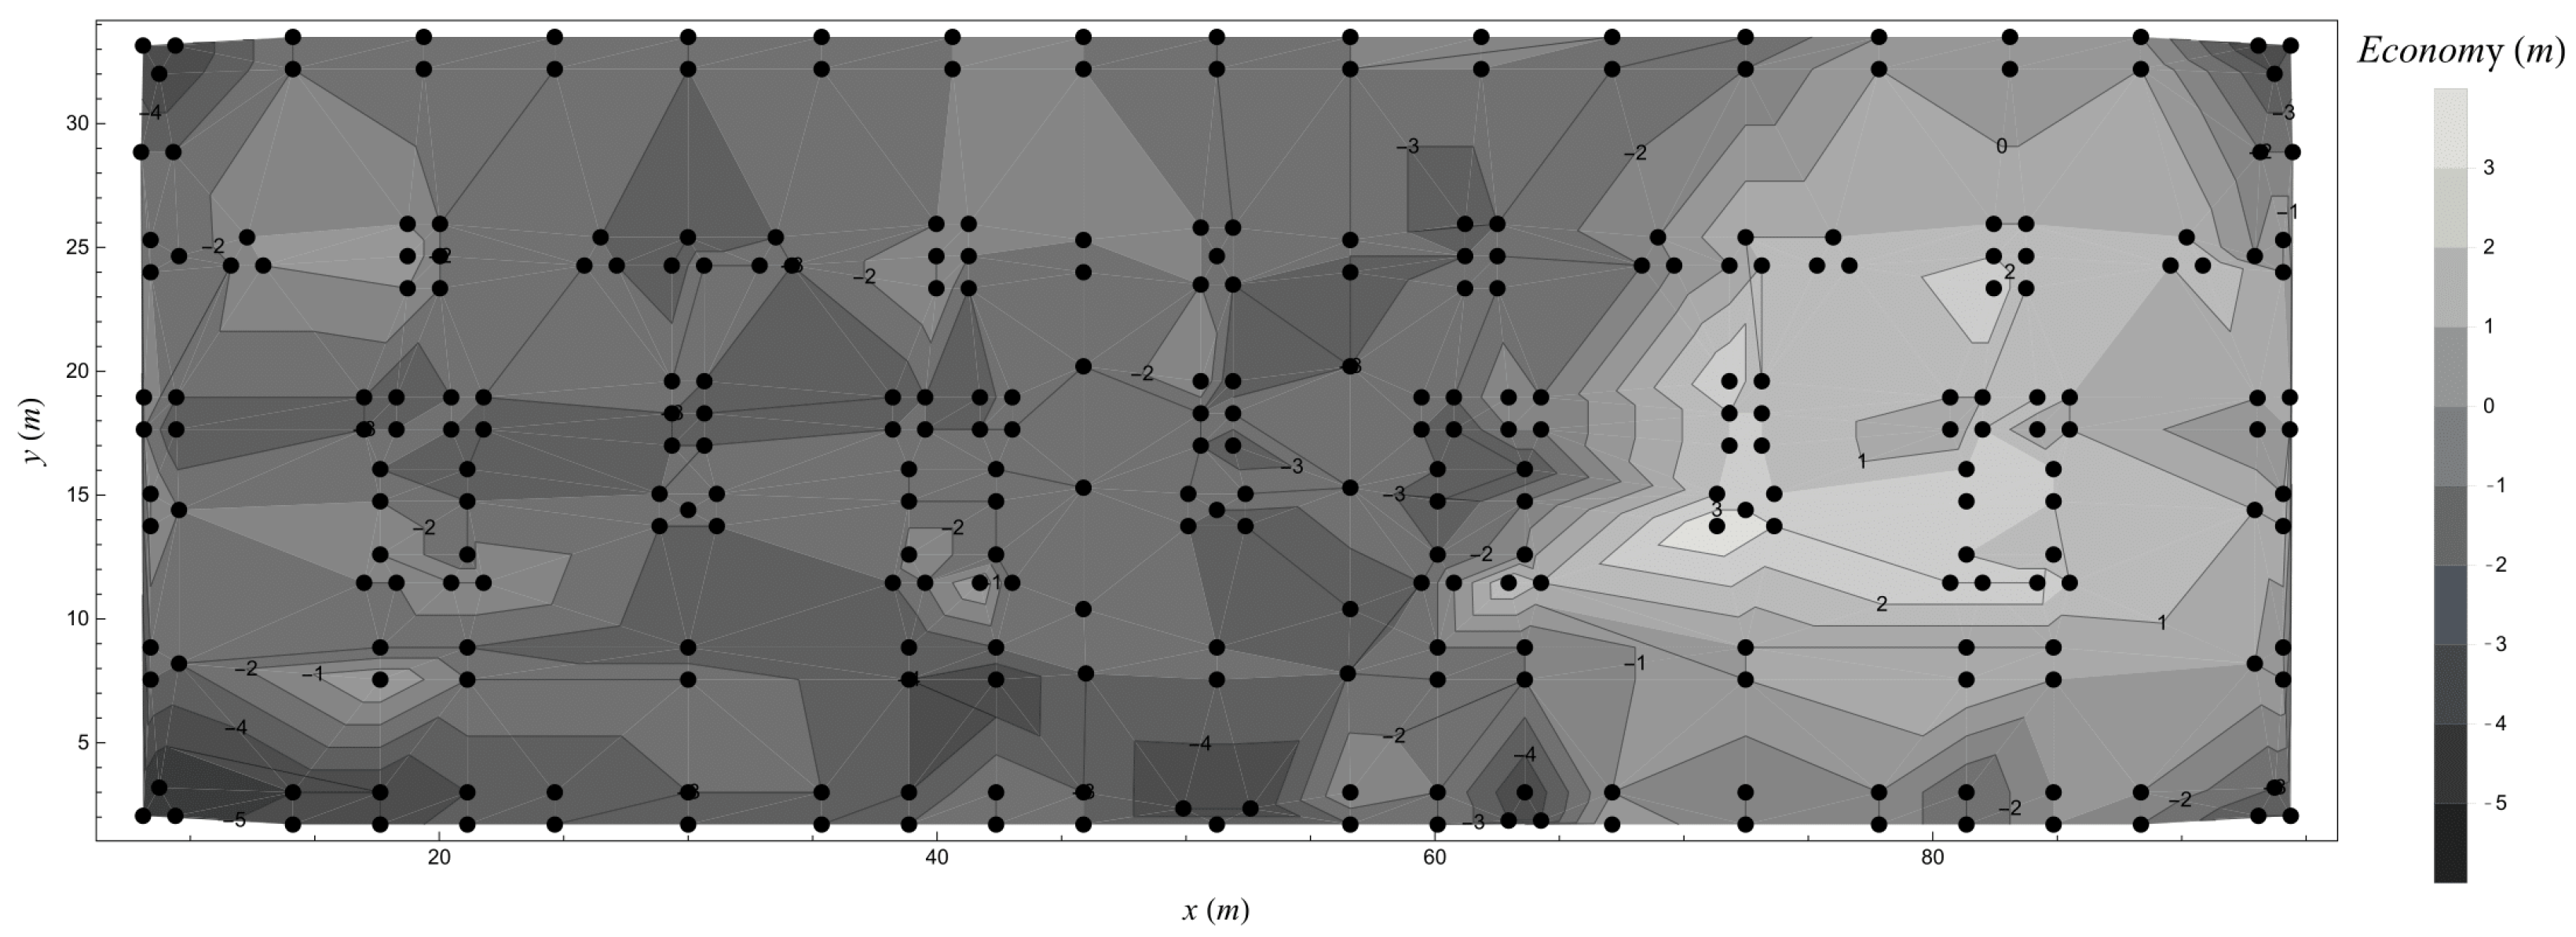
Following the same sequence of predictions, the economy was first calculated for the predicted FS values based on the bearing capacity generated by the NSPT values. Figure 17 illustrates the result.

Figure 17.
Economy generated by foundation pile correction criteria (NSPT).
In economic terms, according to this NSPT analysis, a total of 669 m of piles would be reduced, and calculating the volume required for concreting, this reduction would result in a saving of 131.36 m3 of concrete. Now, considering the bearing capacity data based on execution energy, the difference is illustrated in Figure 18.
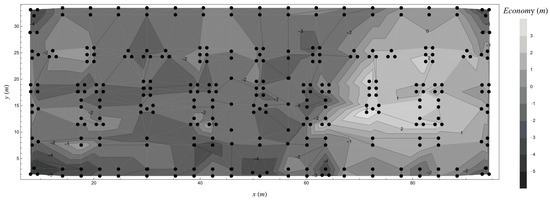
Figure 18.
Economy generated by foundation pile correction criteria (execution energy).
In this case, the length of certain piles was reduced and the increase in those with FS values below the norm was addressed, meeting safety and failure criteria. Thus, by measuring the values according to both criteria, the risk as a consequence of a pile failure had a probability of 0% occurrence (empirical probability).
For the mentioned factors, the reduction proved to be lower for the analysis based on execution energy, but still with a significant amount (564 m) of pile execution and 110.74 m3 of concrete. The most relevant aspect, however, seems to be that the analyses based on NSPT did not point to the need for adjustments, while the more realistic analyses in terms of energy showed their necessity. This economy also implies several additional savings in practice, mainly by reducing the number of visits for concrete mixer trucks responsible for transporting concrete to the site, reducing the foundation execution time and the initial budget estimation. It is worth highlighting the necessary attention to logistics based on energy-based stopping criteria and planning training sessions with operating teams.
In practice, these savings can be computed and integrated into project budgets during the design or even execution phase, especially when energy monitoring is available in real time. For large-scale projects, small reductions in average pile length can translate into substantial savings in material, labor, and equipment time. This enhances not only the economic efficiency but also the sustainability of the foundation design.
The cost–savings analysis presented focused on quantifiable direct reductions, such as pile length and concrete volume, which are among the most significant contributors to foundation costs. However, other factors, such as the cost of implementing the execution energy monitoring system, should be considered in a comprehensive cost–benefit evaluation. In our case, the monitoring system was part of an existing infrastructure developed and deployed by the company conducting the fieldwork, with marginal operational costs since the data was collected automatically during pile execution. Once installed, the system requires minimal intervention and integrates seamlessly into daily operations.
5. Methodology Application
In civil construction, the majority of designs conduct only a few SPT tests, resulting in a limited amount of NSPT data. In contrast, the execution energy is available for all piles along their entire depth, covering virtually the entire construction area and generating a larger quantity of data. Thus, converting energy into NSPT is justified to base the accuracy on more detailed data. By applying all the steps of the methodology mentioned in Figure 1, the intention is to use it in foundation designs and practical implementations.
In the present research, the correlations between energy and NSPT were obtained after the piles were installed, precisely to understand the behavior and the gain, which was proven with the presented results. But how can we use these data to decide upon the pile depth before execution?
It was proven that there is a proportional and physical relationship, which is a first step toward understanding its application. That said, before starting any foundation design, SPT campaigns and “test bores” using CFAPs equipment are conducted. Strategically, these “test bores” should be spread across the area of interest (both near and far from the SPT boreholes), collecting the necessary drilling data to adjust the foundation design to the bearing capacity of the soil for each pile. In other words, after the execution of these “test bores” and the energy–NSPT correlation, it will be possible to design the piles and individually plan the bearing capacity, meeting the design guidelines. This planned bearing capacity will be sufficient to correct the pile depth, impacting foundation costs.
As a simplified application example, a sample average of energy values (in terms of bearing capacity) can be adopted as the limit for the execution of the next pile. If the latter does not reach the pre-established limit, the pile’s design depth is corrected until it reaches the execution energy limit. If the pile reaches this limit before achieving the design depth, the execution depth can be reduced, as shown in Figure 17 and Figure 18. Silva et al. [9], who initially proposed the SCCAP methodology, showed an example of applying the correction criterion, when necessary, for the design depth of each pile based on statistical parameters of monitored energy values from previously executed piles in the same soil.
Moreover, the execution energy monitoring system used in this study is fully online and provides real-time data, which can be accessed directly from a notebook installed inside the drilling machine. This enables seamless integration between data acquisition and decision-making. The developed codes can be run in real-time during the drilling process to flag abnormal pile behavior based on predefined thresholds. In such cases, the system could alert the machine operator to pause execution for further evaluation, enhancing on-site quality control and safety.
Future Works
The formulation used in this study for calculating execution energy focused on the most influential and consistently measured variables available from the drilling rig: torque, rotation speed (RPM), and vertical penetration rate. These parameters directly represent the mechanical interaction between the auger and the soil. We acknowledge, however, that other factors could also influence the measured energy, such as auger geometry (e.g., blade pitch or diameter), wear conditions of the drilling tools, drilling fluid presence, or operator behavior. To overcome these limitations, in this study’s monitored campaigns, the rigs were standardized, and tool conditions were maintained across the project. Operator influence was also minimized by automating the recording process and maintaining constant drilling protocols. While these secondary factors were not explicitly modeled in this study, they may be considered in future extensions to improve accuracy, especially when comparing across projects with varying equipment or operational procedures.
Also, a probabilistic extension could involve assigning distributions to strength and stress parameters, possibly derived from field data or the literature, and propagating those uncertainties through the performance calculations. This would allow for the estimation of reliability indices or failure probabilities instead of fixed safety factors. Execution energy could then be used not only as a direct predictor but also as a constraint or prior in a Bayesian or Monte Carlo framework.
The proposed methodology is fundamentally based on the analysis of execution energy data and, therefore, requires that piles be monitored during installation. In the absence of energy data—for example, if piles are not instrumented—the methodology cannot be applied directly, as the key input is missing. However, in cases where execution energy is partially missing due to sensor failure or data acquisition issues, certain strategies could be explored. For instance, geospatial interpolation could be used to suggest expected energy profiles based on nearby monitored piles. Additionally, the system could identify the closest instrumented pile in space and suggest a representative depth or behavior profile. More advanced solutions, such as machine learning models trained on complete pile records, could be developed in future work to estimate missing energy signals based on site characteristics or partial sensor data. These ideas were not implemented in the current study but represent promising avenues for enhancing the robustness of the methodology under real-world constraints.
Considering the gold standard for pile capacity validation, static load tests may be costly and logistically demanding, which limits their widespread use. In this study, we used them selectively to calibrate and evaluate the performance of the proposed methodology. Exploring alternative validation methods could be of interest in future works. These could include dynamic load testing, which is faster and less expensive; comparison with other in situ test results such as cone penetration tests (CPT); or statistical validation through large-scale monitoring databases. Furthermore, as digital monitoring systems become more common, long-term performance data from instrumented foundations could be used to indirectly validate energy-based predictions.
In the current study, pile volume was used as the primary normalization factor to derive a consistent metric across piles of varying lengths. This was chosen due to its direct relationship with the material being displaced and the work performed by the rig. However, other normalization strategies could be explored to refine the energy–bearing capacity relationship. For instance, normalizing by pile cross-sectional area, effective depth, or even estimated shaft surface area could provide alternative perspectives on energy distribution, particularly in cases where frictional resistance dominates. Additionally, site-specific energy transfer efficiency coefficients could be introduced in future work to adjust for rig-specific or soil-specific drilling behavior.
While the methodology was developed for CFAPs, its core concept—using installation energy as a proxy for subsurface resistance—can also be applied to other pile types, such as driven piles, provided appropriate monitoring systems are available. For driven piles, the methodology would require adaptation to incorporate parameters such as hammer energy, stroke, blow count, and set per blow. These are already used in dynamic formulas and could be reinterpreted within the same energy-based framework. Although normalization factors and energy transfer mechanisms differ from CFAP systems, the principle of relating energy input to soil resistance remains valid and could form the basis for real-time performance assessment in driven pile installations. This adaptation could be further explored in future works.
6. Conclusions
The analysis methodology presented in this research represents an advancement in the computerized control of execution energy and the performance evaluation of CFAPs. It proposes a reliability mechanism complementary to foundation designs that can add value to cost, safety, and failure analyses. The methodology can also contribute to rationalizing construction, leading to savings without increasing risks.
The spatializations of the ground stratigraphy, NSPT values, and execution energies proved to be of great value for the preliminary understanding of the soil massif behaviors, being fundamental for specific analyses regarding the bearing capacity of CFAPs. A good correlation was found between the accumulated normalized execution energy and the accumulated NSPT values, making it possible to assess the bearing capacity based on such correlations. Furthermore, it is highlighted that in energy-based analyses, the calculated factors of safety were adequate regarding minimum safety requirements and the probability of failure. However, some piles resulted in values below expectations, consistent with the actual performance of the foundations estimated from the energy analyses. The predictions also served as a basis for cost analysis, where maximum cost reduction was observed through the reduction of pile lengths.
The proposed analyses incorporating the concept of pile execution energy do not replace the judgment of the geotechnical engineer but can be a highly relevant element in aiding the identification and mitigation of inherent risks in any type of piling, especially in controlling excavated piles.
Overall, the key assumptions that impact the application of the proposed methodology include the following:
- Execution energy must be reliably acquired during installation;
- Drilling protocols should remain reasonably consistent to ensure comparability;
- Execution energy is assumed to correlate meaningfully with subsurface resistance.
A strong point of the methodology is that it does not require homogeneous pile geometry, as energy values are normalized to account for differences in volume or depth. Likewise, while site-specific calibration can enhance accuracy, it is not mandatory if the model is trained on a broad dataset representative of multiple soil types, enabling knowledge transfer across projects.
The limitations of the methodology include the following:
- The methodology requires instrumented piles with execution energy data;
- Site-specific anomalies (e.g., equipment wear, stress concentrations) may affect local interpretation;
- Spatial interpolation used during calibration introduces modeling uncertainty, particularly where pile coverage is sparse.
In order to mitigate such limitations, the use of confidence intervals and conservative interpretation strategies supports robust application in practical settings.
Author Contributions
Conceptualization, D.J.F.d.C., V.R.D. and L.C.S.M.O.; methodology, D.J.F.d.C., J.C.d.C. and L.C.S.M.O.; software, D.J.F.d.C. and L.C.S.M.O.; validation, P.I.B.d.Q., J.A.S. and D.B.R.; formal analysis, D.J.F.d.C., J.C.d.C., L.C.S.M.O., V.R.D. and D.B.R.; investigation, D.J.F.d.C. and J.C.d.C.; data curation, D.J.F.d.C.; writing—original draft preparation, D.J.F.d.C. and L.C.S.M.O.; writing—review and editing, P.I.B.d.Q., J.A.S. and D.B.R.; supervision, J.C.d.C. and P.I.B.d.Q. All authors have read and agreed to the published version of the manuscript.
Funding
This research received no external funding.
Institutional Review Board Statement
Not applicable.
Informed Consent Statement
Not applicable.
Data Availability Statement
The dataset used is confidential in nature and may only be provided as an anonymized dataset. The models and code generated during this study are available from the corresponding author upon reasonable request.
Acknowledgments
All the authors acknowledge the support of the postgraduate program in aeronautical infrastructure engineering at the Aeronautics Institute of Technology (ITA) for hosting DJFC (2023-2024), LCSMO (2022-2023), and VRD (2022-2023) as postdoctoral researchers.
Conflicts of Interest
Author Vinicius Resende Domingues was employed by the company “Vale S.A.”. The remaining authors declare that the research was conducted in the absence of any commercial or financial relationships that could be construed as a potential conflict of interest.
References
- ABNT. NBR 6122: Design and execution of foundations; ABNT: Rio de Janeiro, RJ, Brazil, 2019. (In Portuguese) [Google Scholar]
- Antunes, W.R.; Tarozzo, H. Foundations: Theory and Practice, 2nd ed.; PINI Ltda: São Paulo, SP, Brazil, 1996; pp. 40–91. (In Portuguese) [Google Scholar]
- Ferrari de Campos, D.J.; Camapum de Carvalho, J.; Gitirana, G.F.N.; Cavalcante, A.L.B.; Ozelim, L.C.S.M. Analysis of the bearing capacity of continuous flight auger piles in terms of their excavation energy and of rainfall data. Matec Web Conf. 2021, 337, 03010. [Google Scholar] [CrossRef]
- Ozelim, L.C.d.S.M.; Ferrari de Campos, D.J.; Cavalcante, A.L.B.; Camapum de Carvalho, J.; Silva, C.M. Estimating Shear Strength Properties of the Surrounding Soils Based on the Execution Energies of Piles. Geotechnics 2022, 2, 457–466. [Google Scholar] [CrossRef]
- Ferrari de Campos, D.; Ozelim, L.; Cavalcante, A.L.; Silva, C.; Camapum de Carvalho, J. Execution energy of continuous flight auger piles as an assessment tool to evaluate the mechanical response of the soil mass. Soils Rocks 2022, 45, 1–17. [Google Scholar] [CrossRef]
- Ozelim, L.C.d.S.M.; Ferrari de Campos, D.J.; Cavalcante, A.L.B.; Camapum de Carvalho, J. An Energy-Based Big Data Framework to Estimate the Young’s Moduli of the Soils Drilled during the Execution of Continuous Flight Auger Piles. Axioms 2023, 12, 340. [Google Scholar] [CrossRef]
- Sun, Q.; Elshafie, M.Z.; Barker, C.; Fisher, A.; Schooling, J.; Rui, Y. Integrity monitoring of cast in-situ piles using thermal approach: A field case study. Eng. Struct. 2022, 272, 114586. [Google Scholar] [CrossRef]
- Prauzek, M.; Kucova, T.; Konecny, J.; Adamikova, M.; Gaiova, K.; Mikus, M.; Pospisil, P.; Andriukaitis, D.; Zilys, M.; Martinkauppi, B.; et al. IoT Sensor Challenges for Geothermal Energy Installations Monitoring: A Survey. Sensors 2023, 23, 5577. [Google Scholar] [CrossRef] [PubMed]
- Silva, C.M.; Camapum de Carvalho, J.; Cavalcante, A.L.B. Energy and Reliability Applied to Continuous Flight Auger Pilings—The SCCAP Methodology. In Proceedings of the 18th International Conference on Soil Mechanics and Geotechnical Engineering; Presses Des Ponts: Paris, France, 2013; pp. 2807–2810. [Google Scholar]
- Poulos, H.; Davis, E. Pile Foundation Analysis and Design; Series in Geotechnical Engineering; Wiley: Hoboken, NJ, USA, 1980. [Google Scholar]
- Van der Veen, C. The ultimate bearing capacity of foundations. Géotechnique 1953, 3, 250–255. [Google Scholar]
- Kumar, P.; Samui, P. Design of an Energy Pile Based on CPT Data Using Soft Computing Techniques. Infrastructures 2022, 7, 169. [Google Scholar] [CrossRef]
- Aoki, N.; Velloso, D.A. Estimating stresses and settlements due to deep foundations by the Theory of Elasticity. In Proceedings of the Proc., Panamerican Congress on Soils Mechanics and Foundation Engineering, Buenos Aires, Argentina, 17–22 November 1975; pp. 377–386. [Google Scholar]
- Decourt, L. Prediction of the bearing capacity of piles based exclusively on N values of the SPT. In Proceeding of the 2nd European Symposium on Penetration Testing, Amsterdam, The Netherlands, 24–27 May 1982; Routhledge: London, UK, 1978; pp. 45–53. [Google Scholar]
- Antunes, W.R.; Cabral, D.A. Bearing Capacity of Continuous Flight Auger Piles. In Proceedings of the Proc., Special Foundations and Geotechnics Engineering Seminar, São Paulo, Brazil; 1996; pp. 105–109. (In Portuguese). [Google Scholar]
- Rowe, W.D. Alternative risk evaluation paradigms. In Risk Analysis and Management of Natural and Man-Made Hazards; Haimes, Y.Y., Stakhiv, E.Z., Eds.; American Society of Civil Engineers: New York, NY, USA, 1987; pp. 1–21. [Google Scholar]
- Assis, A.P. Risk management for geotechnical structures: Consolidating theory into practice. Soils Rocks 2020, 43, 311–336. [Google Scholar] [CrossRef]
- Camapum, J.; Gitirana, G. Unsaturated soils in the context of tropical soils. Soils Rocks 2021, 44, 1–25. [Google Scholar] [CrossRef]
- Camapum de Carvalho, J.; de Rezende, L.R.; Cardoso, F.B.F.; Lucena, L.C.F.L.; Guimaraes, R.C.; Valencia, Y.G. Tropical soils for highway construction: Peculiarities and considerations. Transp. Geotech. 2015, 5, 3–19. [Google Scholar] [CrossRef]
- Santana, N.C.; Junior, O.A.C.; Gomes, R.A.T.; Guimaraes, R.F. Comparison of Post-fire patterns in Brazilian Savanna and tropical forest from remote sensing time series. Isprs Int. J. -Geo-Inf. 2020, 9, 659. [Google Scholar] [CrossRef]
- Wolfram Research International. Mathematica, Version 11; Wolfram Research International: Champaign, IL, USA, 2018. Available online: https://www.wolfram.com/mathematica/ (accessed on 6 June 2025).
- RockWare. RockWorks, RockWare: Golden, CO, USA, 2018. Available online: https://www.rockware.com/product/rockworks/ (accessed on 6 June 2025).
- Fellenius, B.H. The analysis of results from routine pile load tests. Ground Eng. 1980, 13, 19–31. [Google Scholar]


Disclaimer/Publisher’s Note: The statements, opinions and data contained in all publications are solely those of the individual author(s) and contributor(s) and not of MDPI and/or the editor(s). MDPI and/or the editor(s) disclaim responsibility for any injury to people or property resulting from any ideas, methods, instructions or products referred to in the content. |
© 2025 by the authors. Licensee MDPI, Basel, Switzerland. This article is an open access article distributed under the terms and conditions of the Creative Commons Attribution (CC BY) license (https://creativecommons.org/licenses/by/4.0/).