Article

Effect of Na Doping on the Electrochemical Performance of Li1.2Ni0.13Co0.13Mn0.54O2 Cathode for Lithium-Ion Batteries

by
Ahmed M. Hashem
1,
Ashraf E. Abdel-Ghany
1,
Rasha S. El-Tawil
1,
Alain Mauger
2 and
Christian M. Julien
2,*
1
Inorganic Chemistry Department, National Research Centre, 33 El-Bihouth Street, Dokki, Giza 12622, Egypt
2
Institut de Minéralogie, de Physique des Matériaux et Cosmologie (IMPMC), Sorbonne Université, CNRS-UMR 7590, 4 Place Jussieu, 75252 Paris, France
*
Author to whom correspondence should be addressed.
Sustain. Chem. 2022, 3(2), 131-148; https://doi.org/10.3390/suschem3020010
Submission received: 31 January 2022 / Revised: 28 February 2022 / Accepted: 23 March 2022 / Published: 25 March 2022

Abstract

:
This study aims to investigate the effect of Na doping on the structure, electrical, and electrochemical properties of lithium-rich cathode material. Pristine Li1.2Ni0.13Mn0.54Co0.13O2 (LNMC) and Na-doped Li1.17Na0.03Ni0.13Mn0.54Co0.13O2 (Na-LNMC) layered lithium-rich/manganese-rich compounds are prepared by the sol-gel method. The structural and morphological characterization reveals that the Na doping leads to an ordered structure with regular cubic morphology and enlarged Li layer spacing. This enlargement facilitates the diffusion of lithium ion inside the bulk lattice. Electrochemical impedance spectroscopy (EIS) shows that doping by a small amount of Na (3 mol%) decreases the impedance by more than three orders of magnitude and enhances the diffusion of lithium ions in the same proportion. This remarkable improvement in the conductivity and diffusion coefficient of lithium ions of Na-LNMC improves its capacity retention. In addition, this structure and mode of preparation results in “U-shaped” capacity vs. cycle curves, similar to the curves observed for transition metal oxide electrodes, resulting in an exceptional cycle life, tested for up to 400 cycles at 2C.

1. Introduction

The increasing demand for electricity requires the development of high-energy density batteries. In this context, lithium-ion batteries (LIBs) provide power not only for various portable devices, e.g., laptops, smart phones, and digital cameras, but also for electric (EVs) and hybrid (HEVs) vehicles. Layered oxides LiCoO2 (LCO) and LiNi1−y−zCoyMnzO2 (NCM) are the most common cathode materials used in commercial LIBs as they exhibit a high operating voltage (~4 V vs. Li+/Li) and relatively high specific capacity of 140–180 mAhg−1 (150–200 Wh kg−1 energy density) [1]. However, powering EVs requires cathode materials with a higher energy density (>200 mAhg−1). Lithium-rich manganese-rich layered oxides, xLi2MnO3∙(1 − x)LiNi1−y−zCoyMnzO2 (LNCM), which are considered to be the best alternative to the traditional layered oxides, are gaining attention because of their low cost (low Co content), high safety, high energy density, and high capacity (~260 mAhg−1), which is almost twice that of the commercial LiCoO2 or LiFePO4 cathodes [2]. They are composed of two different layered phases: the monoclinic Li2MnO3 (C/2m) and the rhombohedral LiNi1−y−zCoyMnzO2 (R 3 ¯ m) phase. However, Li-rich oxide materials have several disadvantages [3]. The first one is an irreversible loss of capacity when charged up to 4.6 V, and hence a low Coulombic efficiency in the initial cycle. This is attributed to the formation of Li2O by the simultaneous extraction of Li and O from the inactive Li2MnO3 phase [4]. An additional phenomenon is the manganese dissolution, which may occur when the electrode is in contact with the electrolyte. Another drawback involves the poor cycling performance and severe voltage decay, as the formation of Li2O leads to the rearrangement of the transition-metal ions in the crystal lattice. This new arrangement leads to a structural instability, i.e., a gradual transformation process from layered to spinel phase, and hence capacity fading [5]. Several effective strategies have been carried out to enhance the electrochemical performance of LNCM cathodes: (i) surface coating prevents direct contact of active particles with electrolyte [6]; (ii) optimized synthesis methods are efficient means to enhance materials kinetic properties by triggering the particle size to nanoscale level [7]; and (iii) bulk doping improves the structure stability, increases the electronic conductivity, changes the parameters of the lattice, and further enhances the Li+ diffusivity [8].
Doping with a divalent metal cation, such as Mg2+ [9], Zn2+ [10], or Mo6+ [11], stabilizes the structure of the Li-rich oxide and improves its electrochemical performance. Such an improvement was also obtained by doping with other alien elements, such as Fe [12] and Al [13]. The efficiency of these alien elements is due to their substitution for Ni or Mn in the transition metal layers. On the other hand, fluorine is the common doping anion. Replacing oxygen with fluorine can reduce the extracted amount of Li2O from Li2MnO3 in the first cycle as reported by Li et al. [14]. The doping method also has an effect. For example, Si-doping Li-rich layered oxides lowers the discharge capacity and the rate performance when the samples are synthesized via a solid-state reaction, but it improves the electrochemical properties when the samples are synthesized by a sol-gel process [15]. Currently, however, a different strategy consists in doping with an alkaline element, such as Na [16] or K [17]. These elements substitute neither for the transition-metal elements, nor for the oxygen anion. Instead, they substitute for Li, since the monovalent ions, Na+ and K+, can substitute for Li+ without perturbation of the Coulombic interaction, which facilitates their insertion in the Li-slab. This insertion expands the Li+ diffusion channels and while stabilizing the host layered structure by prohibiting the undesired spinel structure formation upon cycling, which enhances both the cycling life and the rate capability of these cathode elements.
The present work focuses attention on reducing the above-mentioned deficiencies of lithium-rich layered oxides by partially replacing the mobile Li+ with Na+ ions. The idea is to take the benefit of the larger radius of the Na+ cation (1.02 Å) compared to Li+ (0.76 Å) and M2+ (M = Ni, Mn, Co) metals to increase the segregation between the alkali and the transition metal ions. The substitution of Li for Na occurs in the LiMO2 portion of the structure. This replacement enhances the bonding force with oxygen, which inhibits the escape of the oxygen lattice. Moreover, the spacing of the Li layer is wider, which accelerates the diffusion of Li+ ions in the crystal lattice and improves the rate capability [18]. Qiu et al. [19] and He et al. [20] synthesized Na-doped Li1.2Ni0.13Co0.13Mn0.54O2 using a solid-state reaction and a polymer-pyrolysis method, respectively, while Lim et al. [16] investigated the properties of Li1.167Ni0.18Mn0.548Co0.105O2 spherical particles prepared by spray pyrolysis.
As recalled above, we know from prior works that the best electrochemical properties induced by Si-doping, for example, are observed when the synthesis is performed following a sol-gel method. On another hand, Na-doped LNCM has been investigated in the last ten years by various synthesis methods, but for unknown reason never by the sol-gel method. Since the other synthesis methods already showed positive effects of Na-doping, we were eager to study whether the synergetic effect of Na-doping and sol-gel synthesis would boost the electrochemical properties of LNCM. In the present work, the undoped Li-rich oxide (pristine) Li1.2Ni0.13Mn0.54Co0.13O2 and Na-doped Li-rich Li1.17Na0.03Ni0.13Mn0.54Co0.13O2 are prepared by a citric acid-assisted sol-gel method. The main objective is the evaluation of the electrochemical behavior of the Na-doped electrode for long-life cycling (at least 400 cycles) at a relatively high current density (2C rate), an unprecedented result for Li-rich materials. Such electrochemical tests were not reported before. The samples are characterized by X-ray diffraction (XRD) and transmission electron microscopy (TEM). Electrochemical impedance spectroscopy (EIS) was used to characterize the improvement of the electrical properties after doping with Na+. This improvement in electrical properties improved the electrochemical performance of Na-doped Li-rich Li1.17Na0.03Ni0.13Mn0.54Co0.13O2 in comparison with the pristine one.

2. Materials and Methods

Li1.2Ni0.13Mn0.54Co0.13O2 and Li1.17Na0.03Ni0.13Mn0.54Co0.13O2 powders were synthesized via the citrate–gel method using acetate salts and citric acid as a chelating agent. Required quantities of Li(CH3COO)∙2H2O, Mn(CH3COO)2∙4H2O, Co(CH3COO)2∙4H2O, Ni(CH3COO)2∙4H2O, and Na(CH3COO) were dissolved in an aqueous solution of citric acid with an excess amount of 7% lithium salt under continuous stirring for 6 h. After adjusting the pH value to 7–8 with ammonium hydroxide, the solution was evaporated at 80 °C until a viscous transparent gel was obtained before a complete evaporation until xerogel, then dried in oven at 120 °C for 12 h. The precursor powders were calcined at 450 °C for 5 h, then reground and calcined again at 800 °C for 10 h in air to obtain the final products. Li1.2Ni0.13Mn0.54Co0.13O2 and Li1.17Na0.03Ni0.13Mn0.54Co0.13O2 are named hereafter as (LNCM) and (Na-LNCM), respectively.
The crystal structure of the final product was determined by XRD using a Philips X’Pert apparatus (Philips, Eindhoven, The Netherland) equipped with a CuKα X-ray source (λ = 1.54056 Å) in the 2θ range of 10–80°. The morphology of the as-prepared materials was studied by scanning electron microscopy (SEM, JSM-7800F, JEOL, Tokyo, Japan) and by transmission electron microscopy (TEM, JEM-2100 microscope, JEOL, Tokyo, Japan) including a selected area electron diffraction (SAED) mode. The elemental composition was investigated by an energy dispersive X-ray (EDX) spectrometer attached in the TEM column. The Brunauer–Emmett–Teller (BET) specific surface area was measured by nitrogen adsorption/desorption at 77 K in a relative pressure P/P0 = 0.0–1.0 with P and P0 being the equilibrium and saturation pressure, respectively, using a Quantachrome NOVA Automated Gas Sorption analyzer (Anton Paar GmbH, Seelze-Letter, Germany). The pore size distribution and pore volume were estimated using the Barrett–Joyner–Halenda (BJH) method.
Electrodes for electrochemical testing were prepared by casting a slurry composed with 85 wt.% active material, 10 wt.% conductive carbon C65 (TIMCAL), and 5 wt.% polyvinylidene fluoride (PVdF) onto an Al foil (current collector). N-methyl-2-pyrrolidone (NMP) was used as the processing solvent. The dried sheet was punched into ∅ 12 mm discs, and the mass loading of active material was 1.2–1.3 mg cm−2. These positive electrodes were assembled inside 2016 coin cells with Li metal foil as the counter electrode and 1 mol L−1 LiPF6 in ethylene carbonate: dimethyl carbonate (EC:DMC, 1:1 in vol.) as electrolyte. Cyclic voltammetry measurements were carried out at scan rate of 0.1 mV s−1 using a coin-cell with a 2-electrode configuration, which implied the cumulative electrochemical response of both electrodes. The cycling and rate performance were obtained by galvanostatically discharging and charging cells on a Maccor series 4000 battery tester (Maccor Inc., Tulsa, OK, USA) between 2.5 and 4.8 V at 25 °C under different current densities.

3. Results

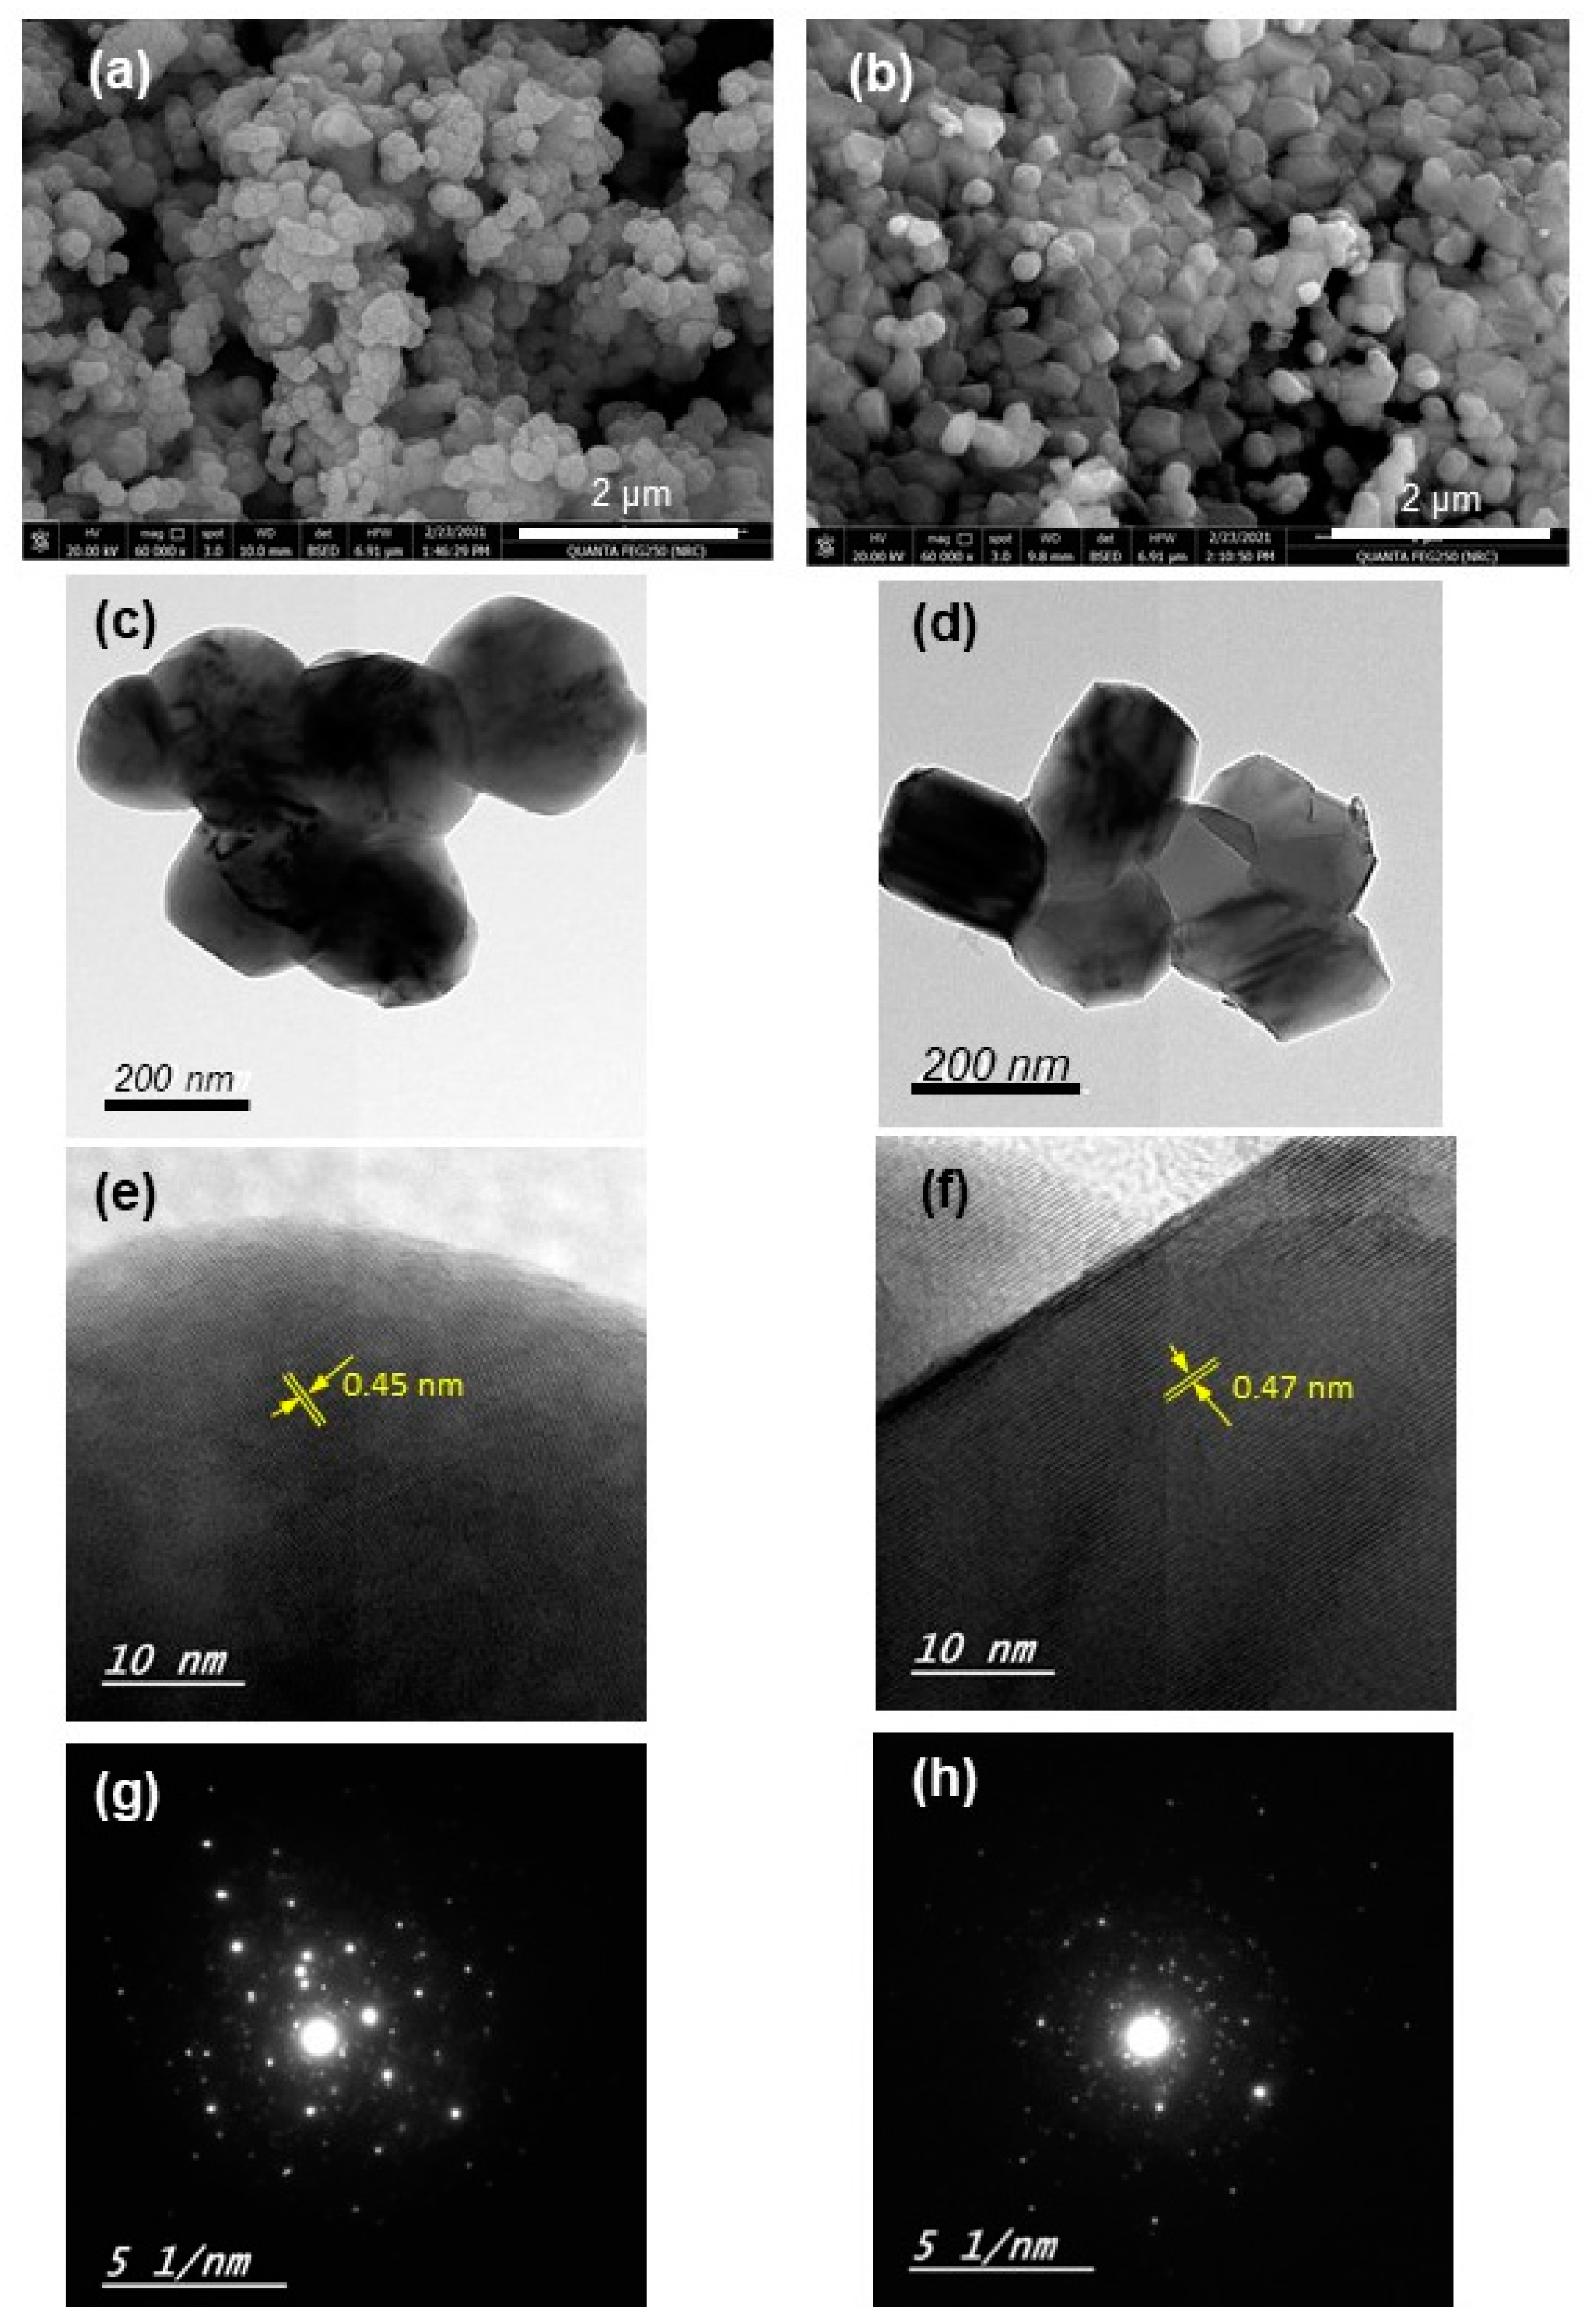
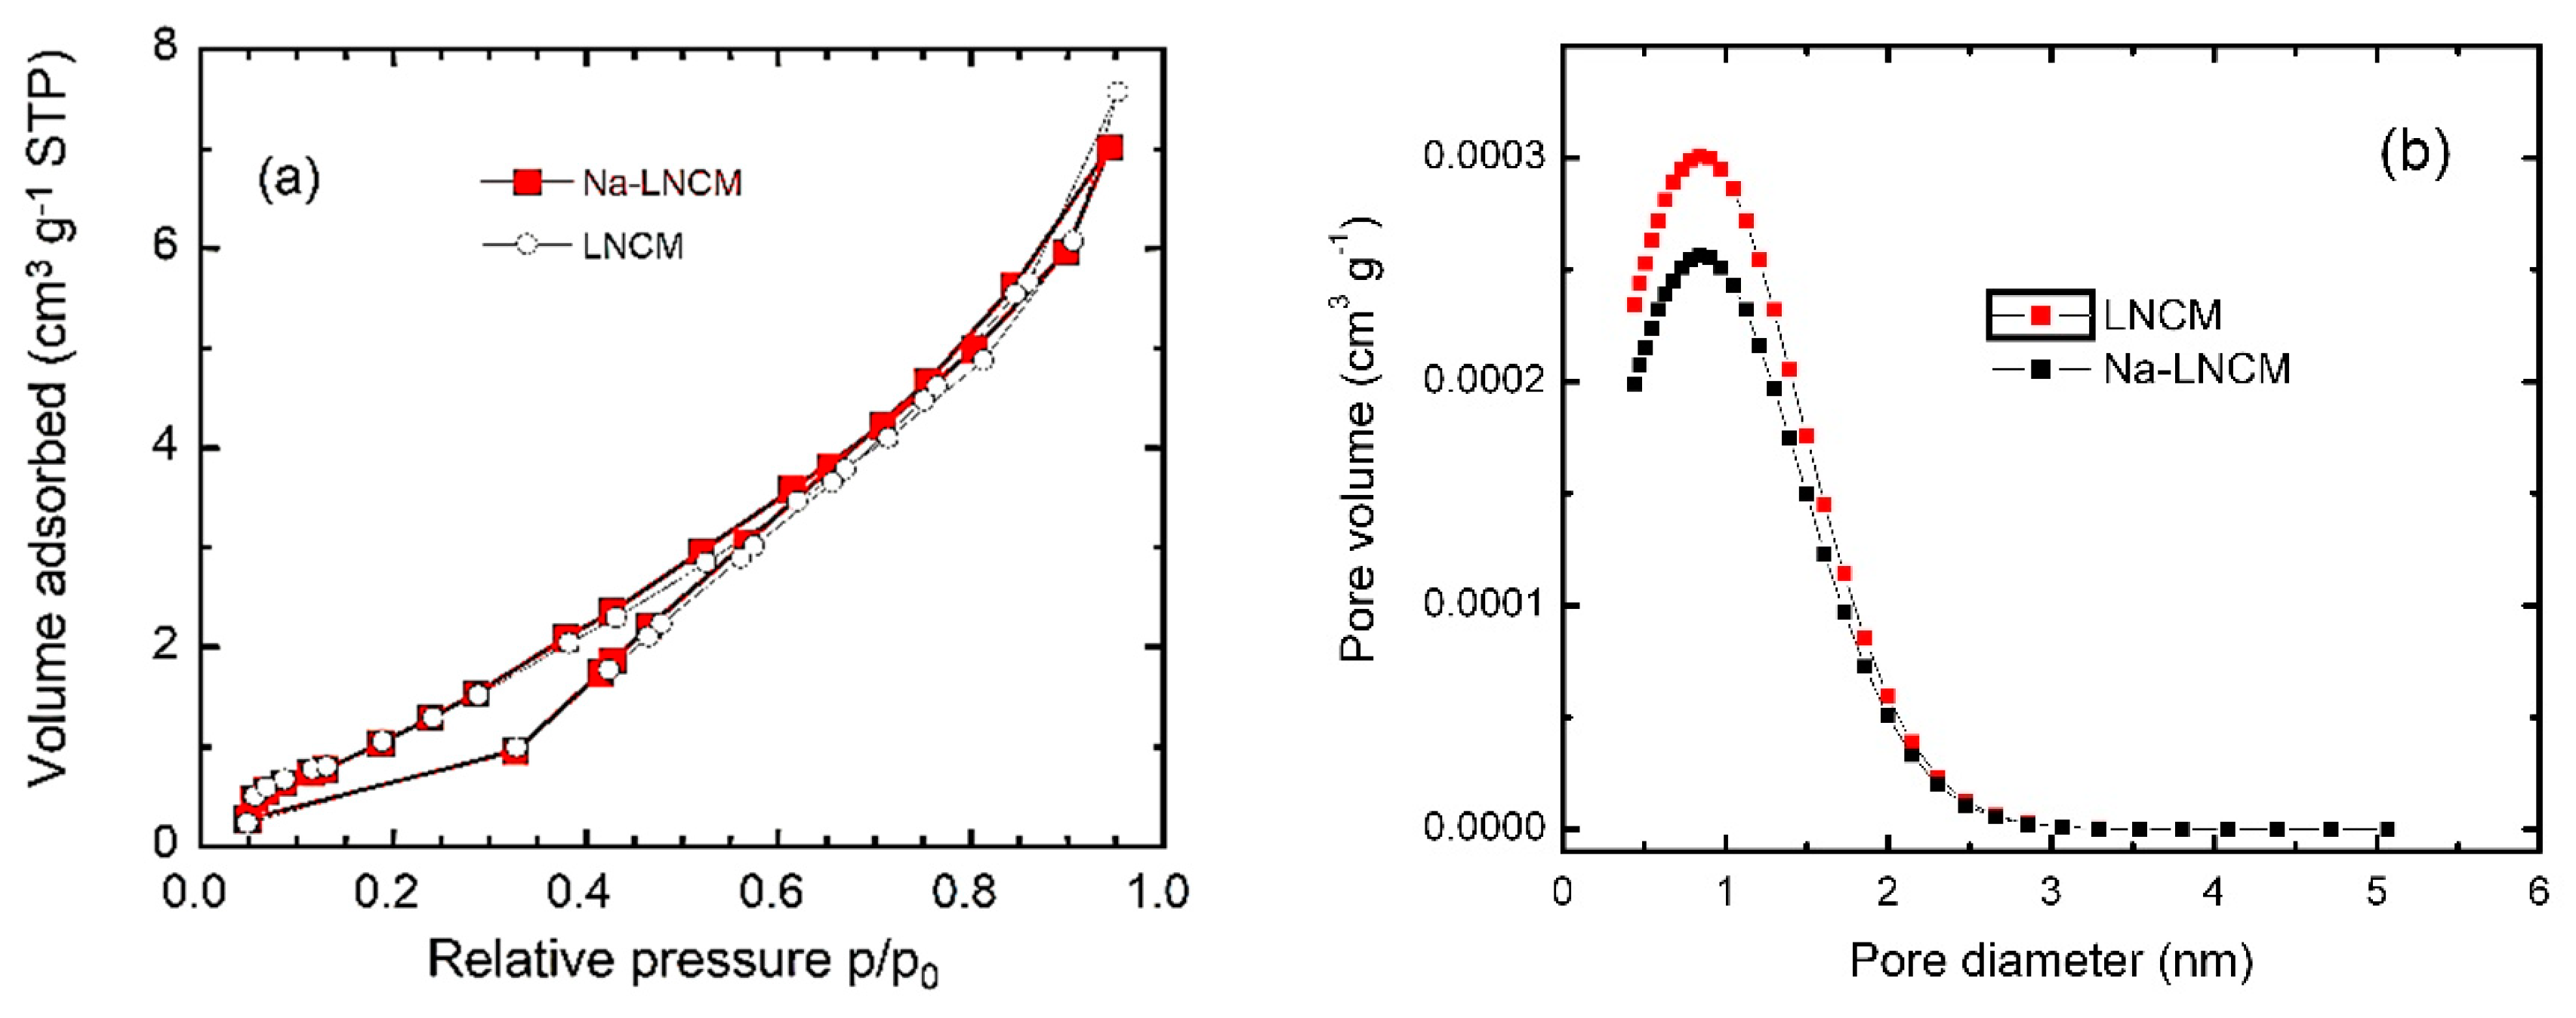
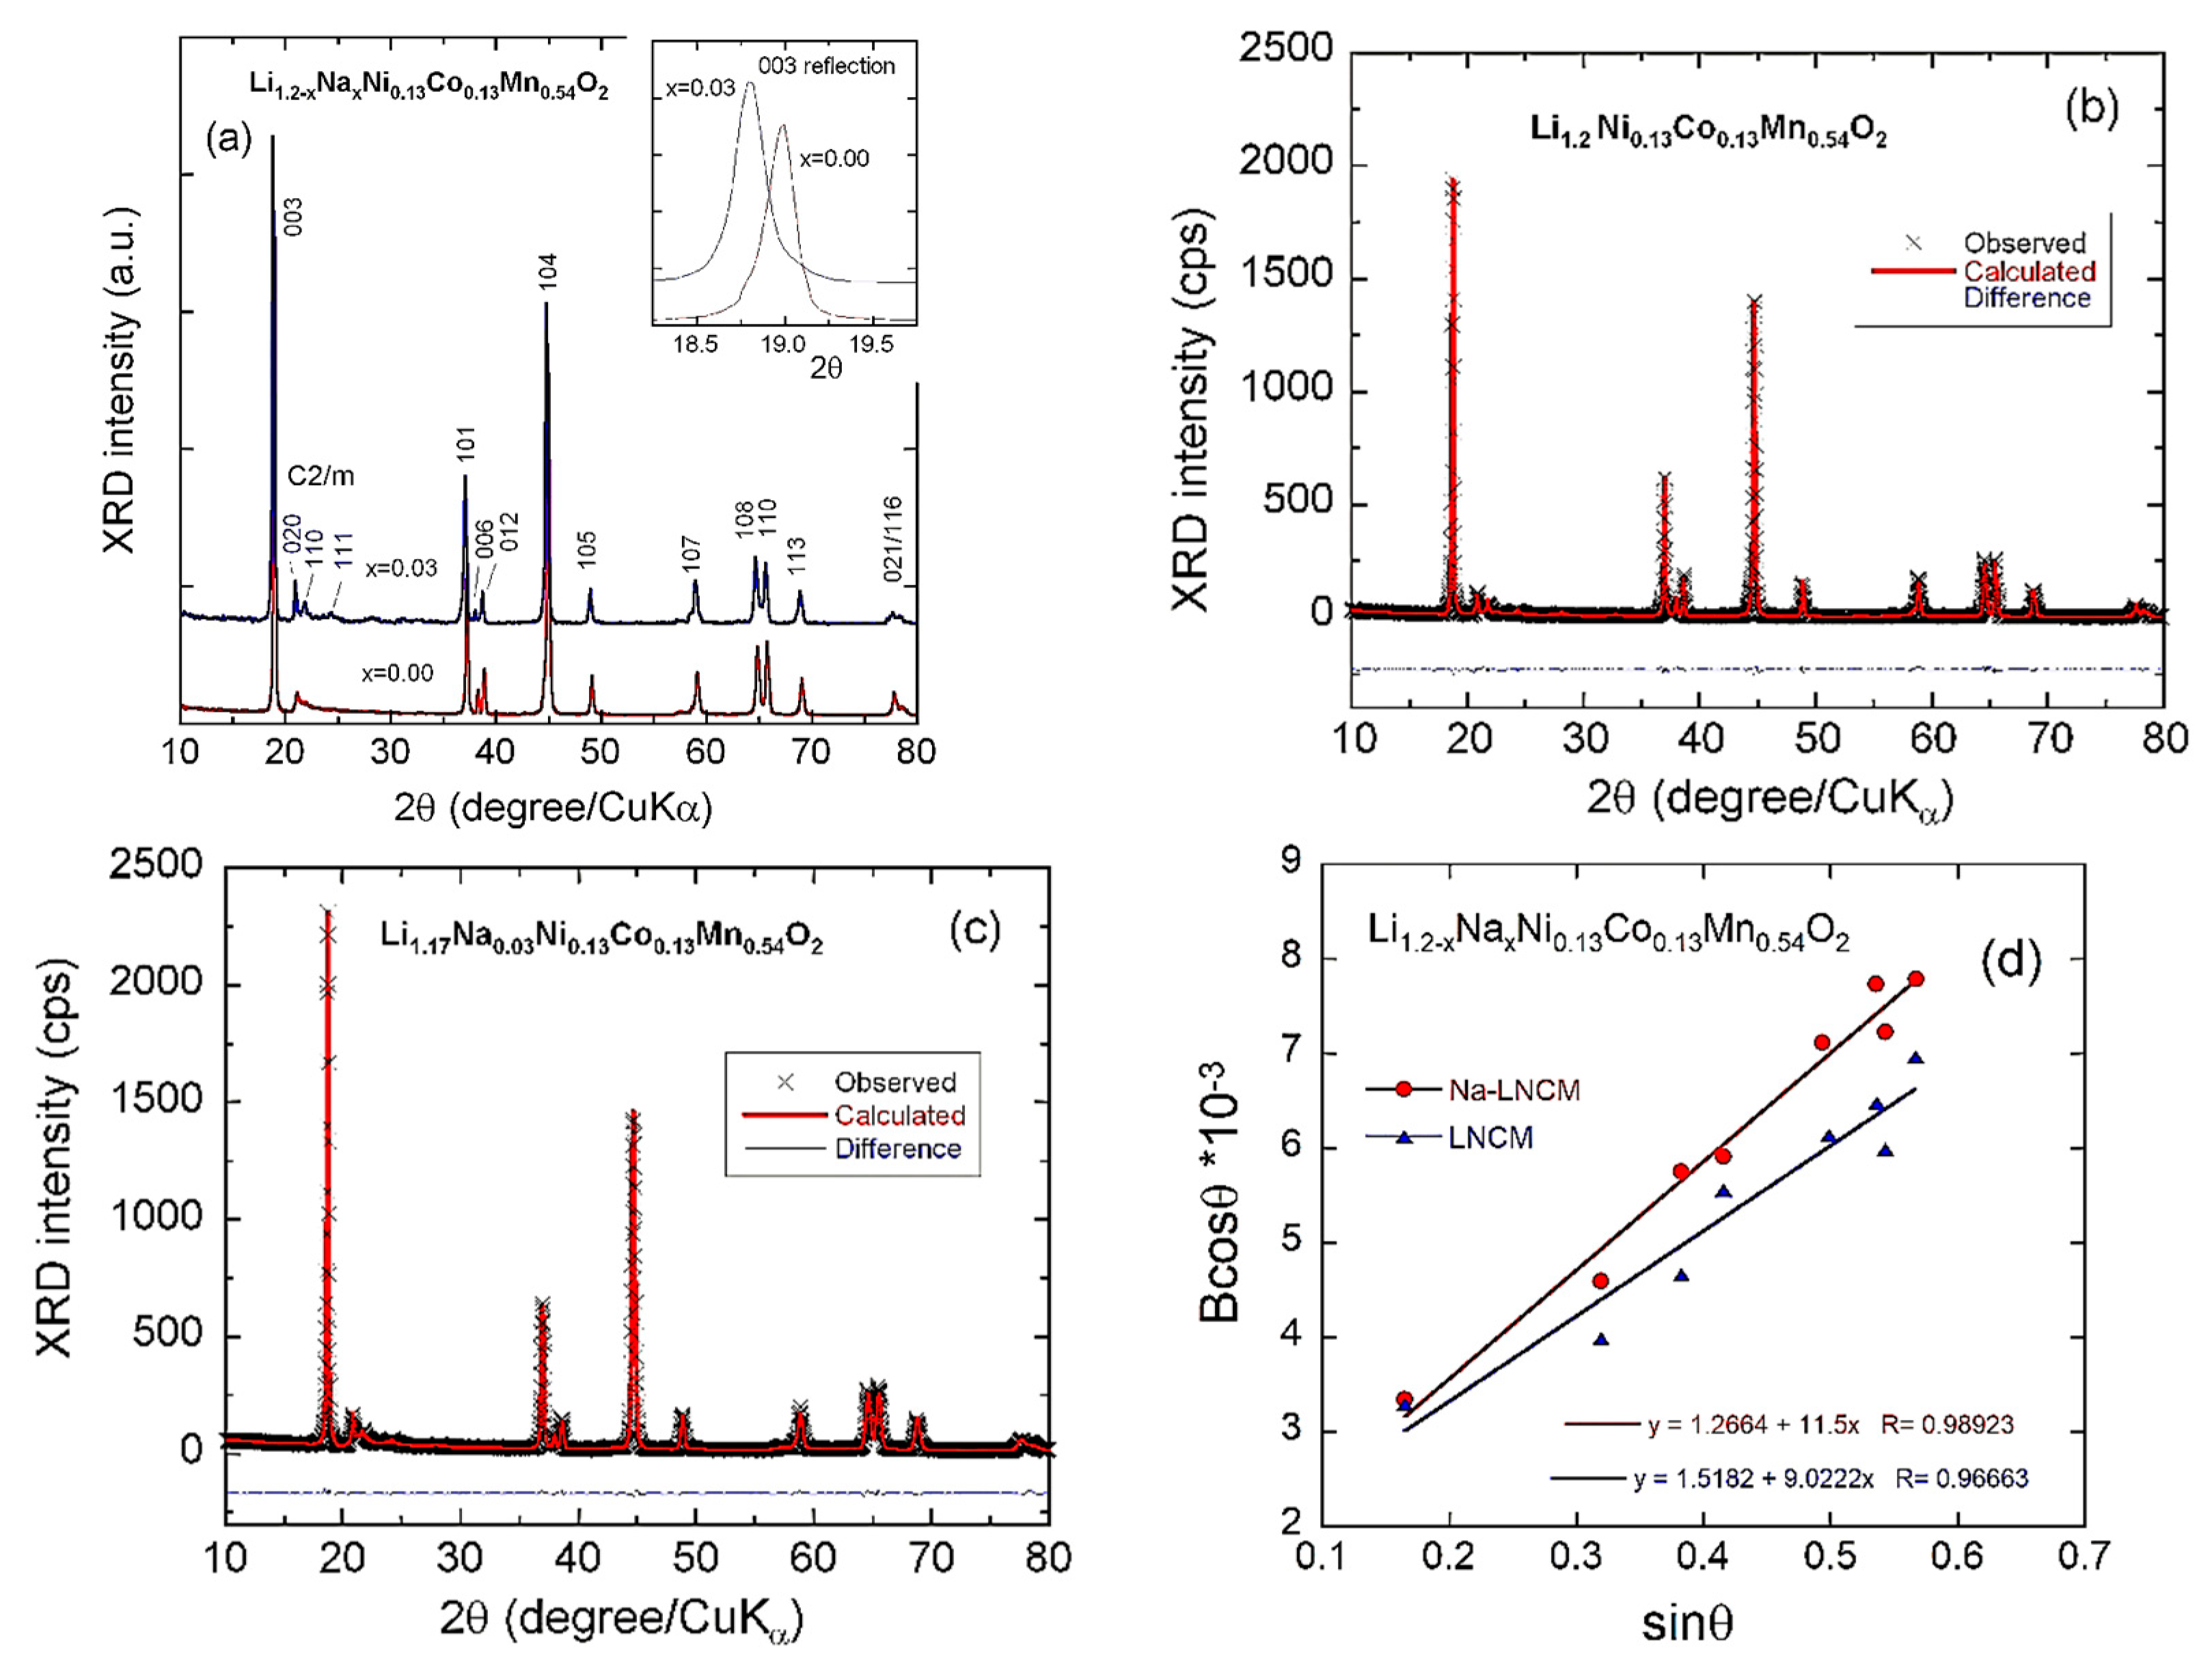
3.1. Structural Properties

The structural properties of sample are presented in Figure 1. Figure 1a shows the XRD patterns of the as-prepared pristine Li1.2Ni0.13Co0.13Mn0.54O2 and Na-doped Li1.17Na0.03Ni0.13Co0.13Mn0.54O2 samples. All the strong peaks in both samples adopt the layered structure with the R 3 ¯ m space group of the rhombohedral α-NaFeO2, with additional reflection peaks between 20° and 25° (2θ), indexed to (020), (110), and (111) planes of Li2MnO3 with a monoclinic structure (C2/m space group) [17]. Since Na was introduced at a small doping level, no Na peaks could be observed in XRD pattern of the Na–LNCM sample (Figure 1a), which implies that Na+ was successfully introduced homogeneously into the crystal lattice. Because of the large ionic radii difference between transition metal (TM) ions (ionic radius of Ni2+, Co3+ and Mn4+ are 0.69, 0.545 and 0.53 Å, respectively) and Na+ (rNa = 1.02 Å), a stronger driving force is generated to separate the Na+ ions from the TM layer. As a consequence, the Na-doping results in an increase of the space between Li slabs, evidenced by a shift of the (003) peak of the XRD spectrum of the Na-LNCM sample toward the lower angle region (see Figure 1a). Moreover, the larger ionic radius of Na+ prevents the formation of substitution defects (Na+ ions on TM sites).
The crystal structure of Li-rich layered oxides has been the subject of intense debate. It has been discussed assuming either the existence of a “solid solution” according to the substitution of M in LiMO2 as earlier stated by Jarvis et al. [21] or the formation of a “composite” (or “mixture”) of LiMO2 and Li2MnO3 as reported by several authors [22]. More recently, Cui et al. showed that incorporating over-stoichiometric Li into the layered structure can generate Li2MnO3-like domains [23]. In the present work, the XRD analysis clearly pleads for the second model as the XRD spectra show the existence of two sets of reflection peaks: monoclinic Li2MnO3 phase and rhombohedral Li(Ni, Co, Mn)O2 phase. This hypothesis is also confirmed by Raman spectroscopy, which is efficient in probing the short-range order (local structure) of materials. Usually, the diffraction peaks of Li-rich materials are indexed to the layered α-NaFeO2-type structure (R 3 ¯ m space group). The remnant weak peaks around 2ϴ = 21° could be attributed to the LiMn6 superlattice ordering in transition metal layers. These results suggested the co-existence of structurally compatible Li2MnO3 (C2/m) and LiNi0.33Mn0.33Co0.33O2 (R 3 ¯ m) components [24].
The refined X-ray diffraction patterns of LNCM and Na–LNCM are shown in Figure 1b,c, respectively, and structural data are listed in Table 1. The small values of the residual and reliability parameters (Rp, Rw, and χ2) of the Rietveld refinement indicate the successful identification of the rhombohedral phases. The volume of the cell of the Na–LNCM sample is larger than that of LNCM sample, due to the presence of 3% sodium, which enlarges the lattice c-parameter, while the lattice a-parameter does not change significantly. This result is in agreement with previous data reported for Na-doped Li-rich materials [25]. According to refinement data in Table 1, the interslab spacing distance of LiO2 (ILiO2) is enlarged for Na–LNCM. This provides more evidence for the presence of Na+ in the Li layer rather than TM layer. Previous investigations revealed that the larger ILiO2 reduces the activation barrier of Li hopping and facilities lithium diffusion [26]. The ratio of intensities I(003)/I(104) and c/a ratio constitute a direct indication of the cation mixing. The Na–LNCM sample exhibits higher c/a and I(003)/I(104) values than the LNCM sample, supporting the observation that the Na+ doping into the pristine LNCM suppresses the cation mixing and produces a well-defined layered structure [27]. The NiLi antisite defect (Ni on Li site) is known to be the main native defect that alters the electrochemical properties of the lamellar compounds, since the ionic radii of Li+ and Ni2+ are almost the same [28]. The Ni content in the Li layer given in Table 1 is reduced from 2.85% in LNCM to 1.68% by the Na-doping, supporting that the Na-doping enhances the structural stability of the lattice. In addition, the NiLi concentration in Na-LNCM is the limit below which the antisite defect has negligible effect on the electrochemical properties [28]. This is another reason why Na+ doping into the pristine LNCM will improve the electrochemical performance. Using the Debye–Scherrer formula (Lc = /βcosϴ) from the full-width of diffraction peaks (β), the average crystalline size, Lc, was found to be ≈38.4 and 49.2 nm for LNCM and Na-LNCM, respectively.
Further information on the structural properties can be obtained from the broadening of diffraction peaks that is considered an indicator not only of the crystallinity of samples, but also of the homogeneous distribution of cations over the structure. The micro-strain (ε) of the particles was determined using the Williamson–Hall equation [8]:
Bhkl cos θhkl = (/Lc) + 4ε sin θhkl,
where Bhkl is the line broadening of a Bragg reflection (hkl), K is the shape factor, Lc is the effective crystallite size, and λ is the X-ray wavelength. The micro-strain is estimated from the slope of the plot (Bhkl cos θhkl) vs. (sin θhkl) and the intersection with the vertical axis provides the crystallite size. The Bhkl value used here was the instrumentally corrected one. From Figure 1d, the micro-strain was determined to be 2.26 × 10⁻³ and 2.86 × 10⁻³ rd for LNCM and Na-LNCM, respectively, showing a slight difference in the crystallinity of the samples, as the micro-strain was slightly affected by sodium doping.
The chemical composition of LNMC and Na-doped LNMC samples was characterized by EDX analysis as depicted in Figure 2. The EDX spectra indicate that Ni, Co, and Mn are uniformly distributed in both samples. The observed atomic percentages of Ni, Co, and Mn elements are in agreement with the nominal formula (see results in Table 2). In the Na-doped LNMC sample, the sodium content is 0.032, which matches well with the nominal composition.
Figure 3 illustrates the morphology and detailed crystal structures of the as-prepared samples. SEM, TEM, HRTEM, and SAED images are presented. As can be seen from SEM (Figure 3a,b) and TEM (Figure 3c,d) images, both samples appear as homogeneous faceted-like particles with a uniformly distributed size ~150–200 nm. These grains exhibit a smooth surface with significant edges and corners. Note that the exchange of Na ions and Li ions does not alter the morphology. This is attributed to the improvement of structural stability mentioned above, owing to the introduction of Na ions into the Li slab, so that the growth of the crystal tends to follow the direction of the layer. These results also show that the use of the sol-gel method assisted by citric acid as chelate can effectively control the aggregation of particles. The HRTEM images (Figure 3e,f) display the magnified crystallites, which exhibit the well-ordered structures of the particles with a lattice distance of 0.47 and 0.45 nm for the pristine and Na-doped sample, respectively, corresponding to the (001)M/(003)R planes of the layered structure. The SAED patterns (Figure 3g,h) are characteristic of the hexagonal structure and indicate that the individual particles of both samples are single-crystallites with high crystallinity. These results are consistent with the results of XRD shown in Figure 1.
Figure 4a,b shows the nitrogen adsorption–desorption isotherms and pore size distributions (PSD) for the LNCM and Na-LNCM samples, respectively. These isotherms were used to determine the pore volumes and PSD using Brunauer–Emmett–Teller (BET) equation and Barrett–Joyner–Halenda (BJH) method [27]. It can be seen from Figure 4a that the two samples exhibit similarly shaped isotherms that can be described as type V and a H3 hysteresis loop under the IUPAC-classification. This implies the presence of a porous structure, which is characteristic of microporous materials [28]. According to the BET experiments, the surface area of Na-LNCM is 6.67 m2 g−1, which is comparable to that of LNCM (7.28 m2 g−1) as shown in Table 3. Therefore, the Na-doping did not bring any significant difference in terms of the surface area. In addition, as can be seen from the corresponding BJH plots recorded from the nitrogen isotherms of the pristine and Na-doped sample, the average pore size is below 2 nm, which confirms the microporous nature of both samples. The equivalent particle size of these samples can also be calculated from the BET data to be compared with that obtained from TEM images. The average diameter (in nm) of particles is expressed by the relation [29]:
L BET = 6000 S BET   d ,
where SBET is the specific surface area (in m2 g−1) measured by BET experiments and d the gravimetric density. The BET surface area and the average particle size results reported in Table 3 show a good agreement between particle sizes LBET and LTEM deduced from BET and TEM experiments, respectively.

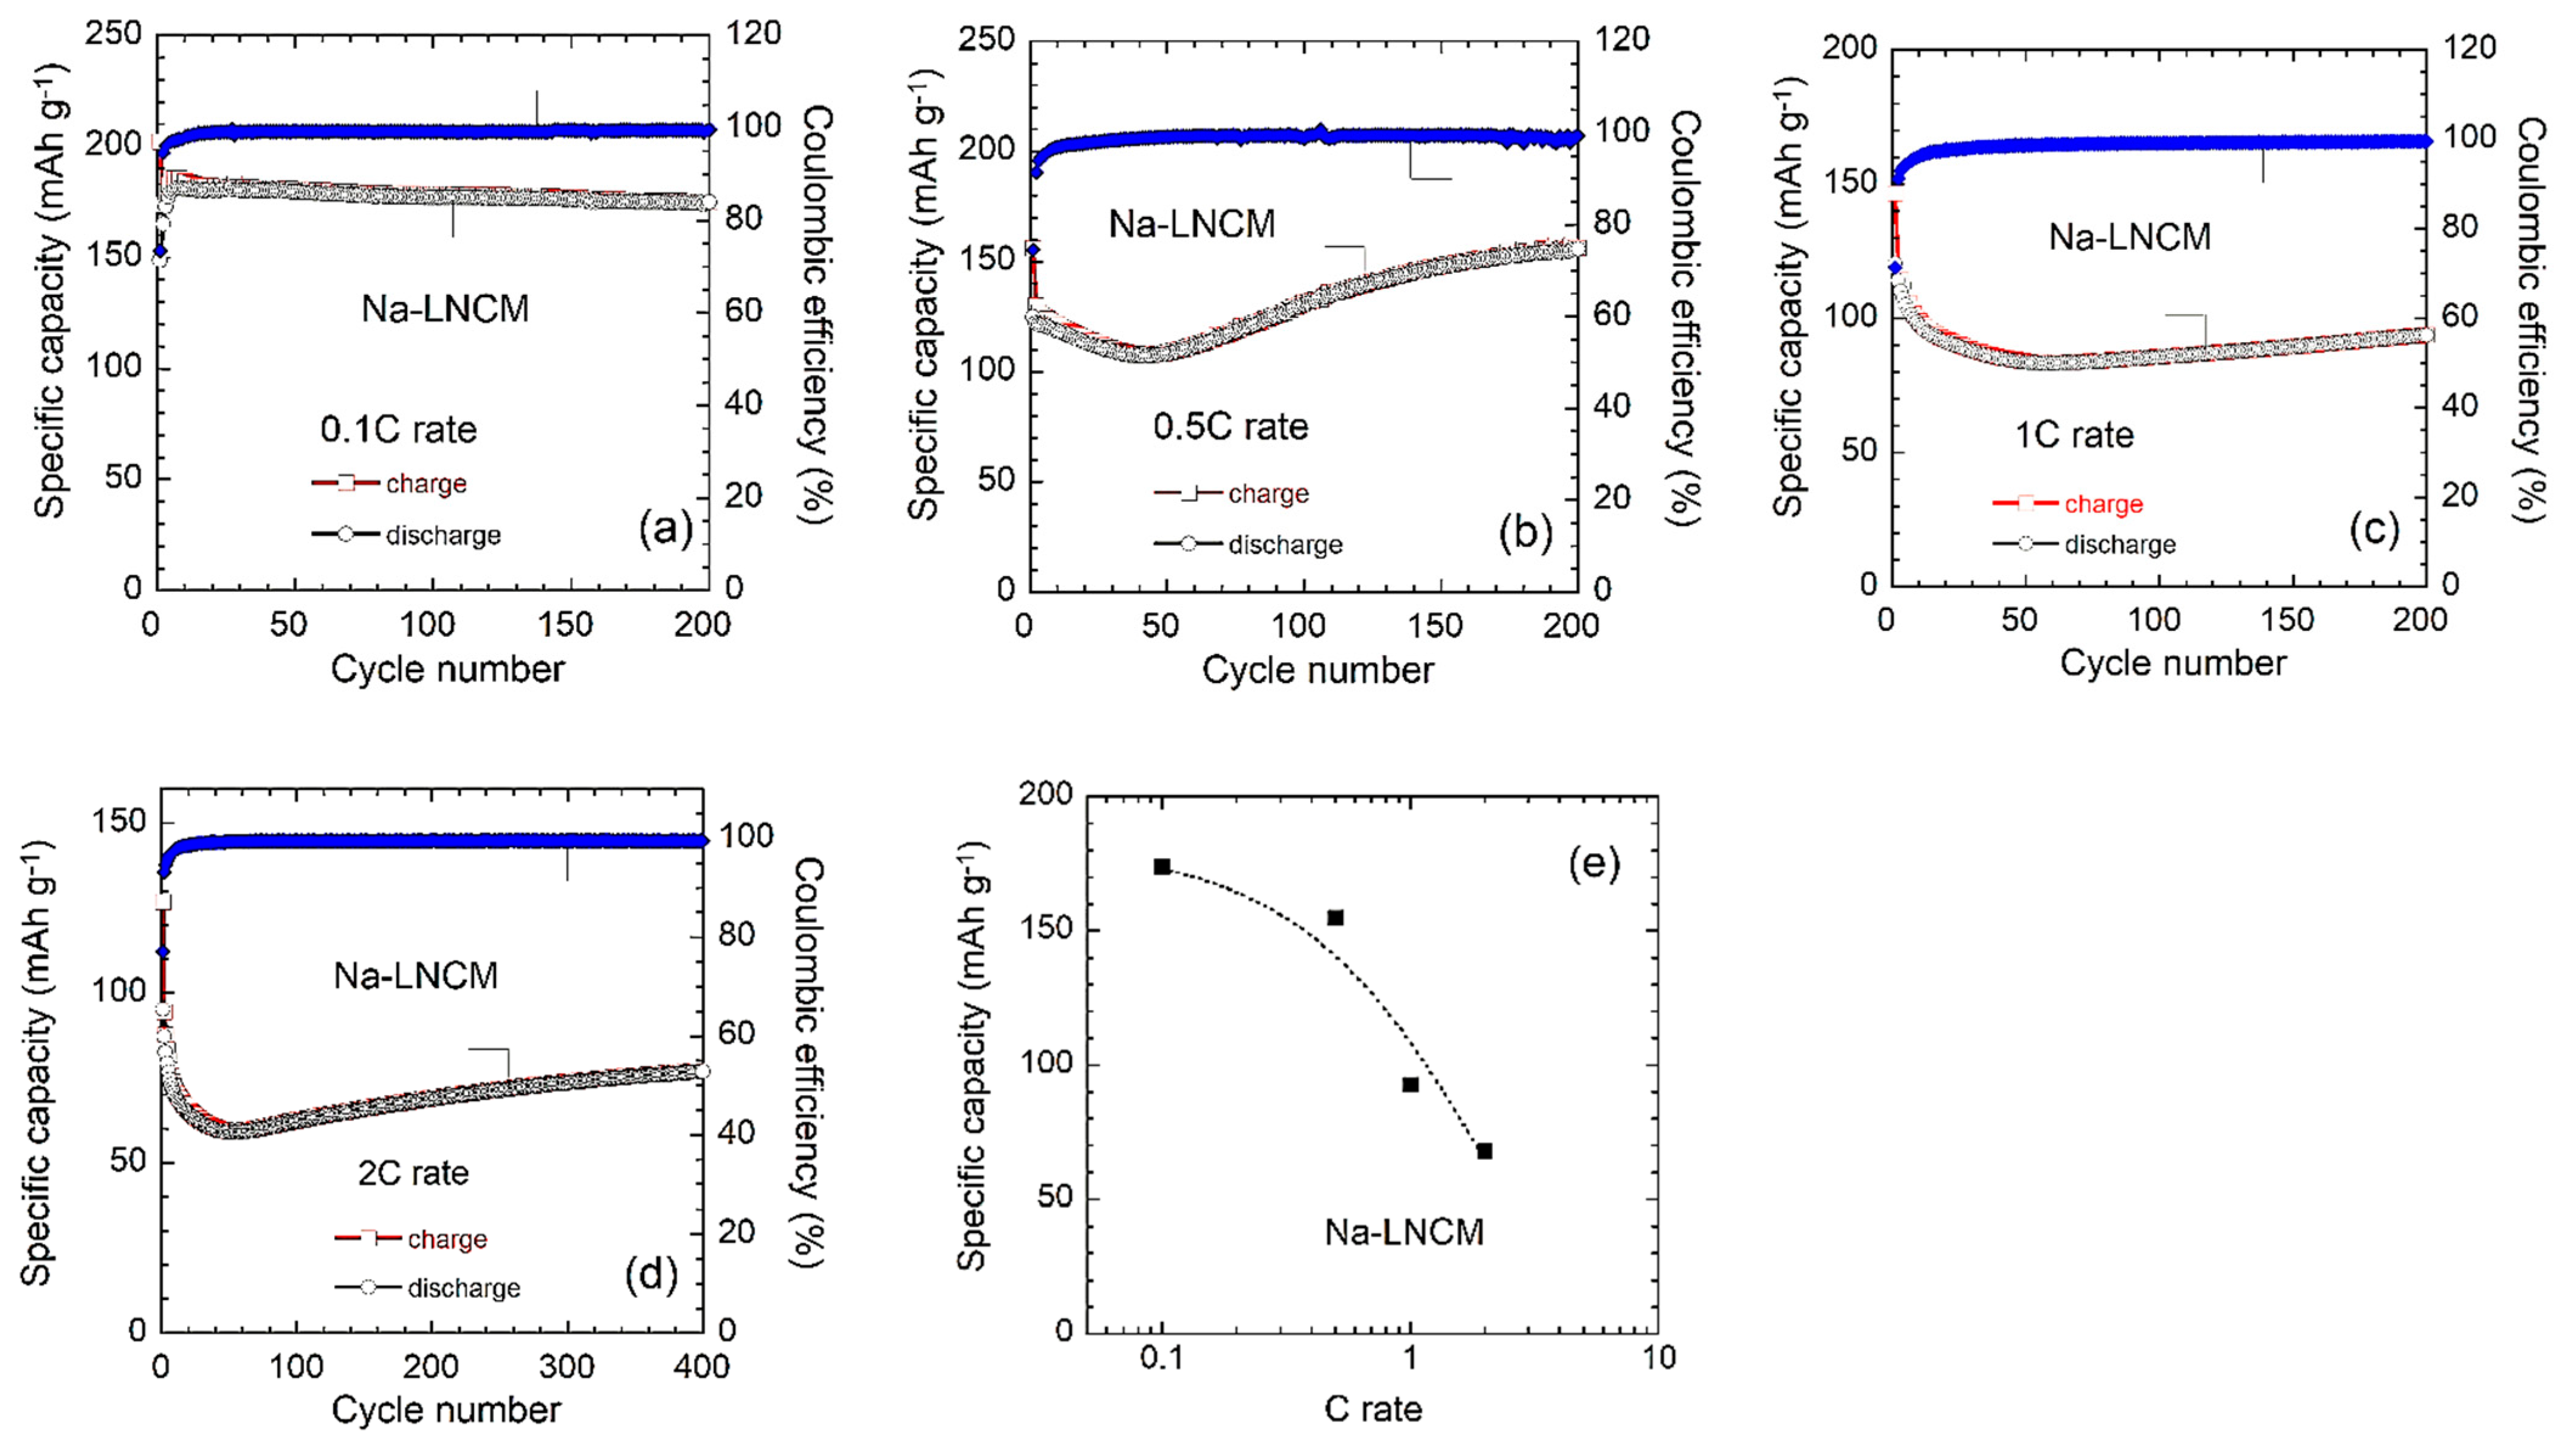
3.2. Electrochemical Properties

To evaluate the electrochemical performance, the electrode materials were tested on assembled coin-type half-cells within the voltage range of 2.0–4.8 V vs. Li+/Li using cyclic voltammetry (CV) at a scan rate of 0.1 mV s−1 and the galvanostatic charge discharge (GCD) method at various current densities. Figure 5 displays the CV curves of the pristine and Na-doped LNCM electrodes. For the pristine LNCM, in the first cycle, two oxidation peaks are observed at ~4.0 and 4.6 V. The 4.0-V peak is attributed to the reversible extraction of lithium from the layered Li(Ni,C,Mn)O2 phase accompanied by the oxidation of Ni2+ to Ni4+ and Co3+ to Co4+. The second peak at 4.6 V is related to electrochemical activation reaction (de-lithiation) of the Li2MnO3 layered phase along with the release of oxygen and the formation of Li2O (Li2MnO3 → 2Li+ + 2e + 0.5O2 + MnO2) [30]. After the end of the initial charge, two distinguishable reduction peaks at ~3.75 and 2.45 V are observed during the discharge process. These two successive peaks are attributed to the reduction of Ni4+/Co4+ and reduction of Mn ions (Mn4+→ Mn(4−x)+ (0 < x < 1)), respectively, to balance the electric charge resulting from the release of O2 in first charge [31]. The same result was observed for Na-doped LNCM, as it displayed almost the same redox peaks with slight shifts in their positions. The second and third cycles in both samples are quite different from the first one as the oxidation peak at high potential did not disappear completely as reported before [32]. During the second charge, a third peak appeared, probably due to the oxidation of reduced (lithiated) MnO2 (from Mn3+ to~Mn4+) created in the first discharge. We note that the peak strength of the Ni4+/2+ and Co4+/3+ pairs is gradually increased and slightly shifted to a lower potential with increasing cycle number. The peak observed in the vicinity of 3.3 V during discharge is associated with Mn redox related to Li occupation within octahedral sites [33]. Therefore, it can be selected to reveal the transformation of a bulk layered structure. A large shift of this peak by 0.45 V is observed between the second and the third cycle for the LNCM sample. On the other hand, the shift is reduced to 0.1 V for the Na-LNCM, which indicates a more stable structure for the Na-doped sample. Note that the peak intensity is also increased from the second to third cycle, which indicates an increase of the electrochemical properties upon cycling. Such a result will be better evidenced by measurements of the capacity.
The small peak at 2.8 V during the first charge process is recognized as a signal of surface spinel formation [34]. However, it is not observed in the next cycles, which may be explained by TM migration and induced lattice rearrangement as a result of the interaction between surface regions and inner particles during cycling [35], so that the increased discharge capacity of the Na-doped sample with respect to the undoped sample cannot be explained by the phase transformation from Li2MnO3-active to corresponding spinel-active component. This increase of the capacity at any C-rate is attributable to the increase of the diffusivity of the lithium and enhancement of the conductivity induced by the doping.
Figure 6a,b shows the charge–discharge curves of pristine LNCM and Na doped LNCM, respectively, recorded in the range of 2.5–4.8 V at C/10 rate. Both of the samples exhibit two plateau regions in the first charge profile. The first plateau starts below 4 V in both samples and the second voltage plateau for both samples is at ca. ~4.5 V in agreement with the positions of the peaks in Figure 5a,b. The first plateau region below 4.5 V is attributed to the de-lithiation process accompanied by the oxidation of Ni2+/Ni4+ and Co3+/Co4+ respectively. The extraction of Li+ and removal of O2− from Li2MnO3 take place in the plateau region above 4.5 V. The irreversible loss in capacity observed in the first cycle is an intrinsic feature of the Li-rich materials. It is related to the extraction of lithium as Li2O from the inert Li2MnO3, implying an irreversible elimination of oxygen vacancies from the lattice, and thus a reduction of insertion–extraction sites of lithium ions in the discharge process [36]. Both samples show a gradual increase in both charge/discharge capacities with the cycling process. The discharge capacity of pristine LNCM and Na-LNCM slowly increases from 111 to 170 mAh g−1 and 150 to 180 mAh g−1 during 100 cycles, respectively (Figure 6c). It is worth noting that the voltage polarization decreases with cycling process, especially in the case of the Na-doped sample. This provides evidence of an increase of the kinetics induced by the Na-doping, which will be quantified hereunder by the determination of the diffusion coefficient of Li+ ions. All the subsequent figures confirm this behavior of increasing charge/discharge capacities upon cycling for both samples. Figure 6c shows that the Na-LNCM sample delivers much better charge/discharge capacities at 0.1C. This confirms the result already mentioned in the discussion on results from Figure 5, that the Na-doping was able to mitigate the migration of Mn4+ ions (MnO2-like structure after Li2MnO3 activation at first cycle) from octahedral sites (layered structure) to adjacent tetrahedral sites (spinel variant). This effect, also evidenced with K-doping [17], results in more Mn being retained in the MnO2-like structure, producing a LiMnO2 structure after intercalation to supply greater reversible capacity.
Figure 7 shows the incremental capacity (IC) curves, i.e., differential capacity vs. cell voltage (dQ/dV vs. V), at the 1st and 100th discharge. This analysis can be considered as an efficient tool to determine the electrochemical spectroscopy of an electrode. The incremental capacity curves not only specify the reduction potentials, but also clearly display the voltage fade upon cycling. The IC curves were extracted from the GCD profiles (lithiation process) to further characterize the electrochemical behavior at the 100th cycle. The initial IC profile of the pristine LNCM electrode displays two broad peaks. One peak at ~2.7 V commonly reflects Mn3+/4+ activities from the layered compound, and the other one at ~3.8 V is associated to the reduction of Ni2+/4+ [8]. Figure 7 also shows that the Na-doped LNCM electrode exhibits the highest potential at 3.36 V for the first plateau, while the second plateau occurs at ~3.8 V.
As shown in Figure 7, the broad peak due to the reduction of Ni4+ to Ni3+ shifted down by 57 and 28 mV for LNMC and Na-NMC electrodes, respectively, between the 1st and 100th charge–discharge cycles. During the charge–discharge process, the voltage decay and cycling instability represent an intrinsic weakness of Li-rich cathode materials that needs to be solved before their practical application can be envisioned. These problems are mainly associated with a phase transition of the surface layer from the layered structure to the spinel structure. Upon successive charge–discharge reactions, a surface reconstruction layer (SRL) occurs, which directly correlates to the electrochemical performance of the electrode [37]. The SRL features are as follows: (1) creation of oxygen vacancies; (2) migration of transition-metal (TM) cations into Li-sites; (3) reduction of the TM cations to low valence state; and (4) transformation of the lattice structure [38]. Zheng et al. [39] evidenced the influence of the synthesis conditions on the voltage decay rate, concluding that the sol-gel method provides better performance than the co-precipitation technique. It has been suggested that one of the main reasons for voltage fade is the irreversible migration of TM to the Li layer promoted by oxygen vacancies [40]. Recently, Abdel-Ghany et al. [8] minimized the voltage decay by the fabrication of Li1.2Ni0.13Mn0.54Co0.13O2 electrodes using ethylene diamine tetra-acetic acid (EDTA) solution as chelator, which induced a regular texture of the particles. In Figure 7, the smaller voltage decay reflects the beneficial effect of the partial substitution of Na for Li ions.
Figure 8a–d display the cycling behavior and the Coulombic efficiency of the Na-doped LNCM electrode tested at various C-rates. At 0.1C, the capacity decreases slowly upon cycling, as a classical behavior observed for such cathode materials. However, at a higher rate, the capacity of the Na-doped sample increases with cycling (see Figure 8b–d). Upon increasing the C-rate, this electrode shows a decreasing charge–discharge capacity up to the first 40 cycles followed by a gradual increase charge/discharge capacity upon cycling till 200 cycles. To deeply explore this effect, the capacity of the Na-doped sample was measured up to 400 cycles at 2C. These results are reported in Figure 8d. The specific discharge capacities of the Na-doped LNCM electrode cycled 100 times are compared in the modified Peukert plot (Figure 8e). Based on these results, the discharge capacity vs. C-rate can be expressed using an empirical equation of the exponential form Qd = B e−αC, where B is a constant. The best fit (reliability parameter R2 = 0.97) is obtained for B = 182 mAh g−1 and α = 0.5 over the interval 0.1–2C. The above new relationship is derived from an experimental analysis and can be implemented in the LNCM-type battery model.
To the best of our knowledge, Figure 8a–d show the best cycle ability reported for a Li-rich cathode element, owing to the increase in capacity. The increase in capacity upon cycling gives evidence of an increasing number of active lithium ions in the surface layer of the Na-LNCM particles. Since the spurious phase transitions that alter the cycling life of the Li-rich cathode materials begins from the surface of the particle [41], many efforts have been made to construct a surface that suppresses the transition process from the early stage [42]. In particular, Kim et al. reported a surface structure the Li2MnO3 surface phase is further modified in such a way that nickel is regularly arranged between the face-to-face Li sites in the superlattice manganese layers of Li2MnO3 [43]. The authors attributed the improvement of the electrochemical properties to the Ni coordination (2c sites) to the adjacent transition metal (TM) layers, because the Ni atoms form strong bonding with the adjacent oxygen atoms (4i sites) and suppress the TMs migration through the adjacent tetrahedral sites based on high electrostatic repulsion between the TMs and Ni atoms. The presence of Ni in the surface layer could effectively increase the capacity and rate capability, but the capacity still did not increase along cycling.
The increase of capacity upon cycling has been observed in nanosized transition metal oxides (TMOs). They show initial and/or reversible capacities that significantly exceed the correlating theoretical quantity of transferred charge carriers based on conversion reaction. The works related to the additional capacities in TMOs have been reviewed in [44]. The additional capacity is usually ascribed to the sloping voltage curve at low potentials (normally below 0.8 vs. Li+/Li) [30], but considering the complex and not yet fully understood reasons for the additional capacity, a partial contribution of higher potential processes are not excluded like in our case, where the potential was maintained above 2 V. Combining with the phenomenon of capacity fading in the first 40 cycles and recovering, the behavior of the electrode exhibits a so-called “U” shape, which has also been observed in other nanostructured Mn-based oxides [44], and in particular in mesoporous MnO/C networks [45]. In such cases, the “U” shape is attributed to the formation of defects in the electrodes during cycling, leading to the oxidation of Mn2+ to a higher oxidation state [46]. The origin should be the same in the present work, and suggests some segregation of TM atoms in the surface layer. This effect is observed only at C rates ≥ 0.5, where the polarization of the cell is larger, which suggests that this segregation of the TM atoms occurs in an out-of-equilibrium situation. This additional capacity raising with the cycle number is observed for both undoped and Na-doped LNCM, and is thus dictated by the mode of preparation of the nanoparticles, not the doping itself. On another hand, the increase of the cycle life and rate capability of Na-LNCM is clearly due to the increase of diffusivity and conductivity resulting in more space for in the Li+ interlayer, which facilitates the insertion/extraction of Li+ ions [47] and suppresses the conversion from a layered to spinel structure during cycling [48].
A comparison of our results with the electrochemical properties of Na-doped layered oxide electrodes (i.e., energy density, current density, and cyclability) reported in the literature is reported in Table 4. Note that all the previous works present only short-term results, of no more than 100 cycles, and most of them at very low current density (at most at C/5 rate). Moreover, it is difficult to compare electrodes without knowledge of the mass loading. However, there is a general agreement for the best values of specific capacity that were obtained from submicron-sized material (at least for primary particle size lower than 500 nm). The recent results by Zhang et al. [49] seem very attractive with a specific capacity of 217 mAh g−1 over 100 cycles at 1C rate for an electrode formed by nano-hexagons 200–400 nm in size, but the corresponding medium discharge voltage (MDV) fading is 0.331 V. In this work, the electrochemical behavior of the Na-doped electrode evaluated for longer cycling at a relatively higher current density (2C rate) demonstrates a specific capacity of 50 mAh g−1 after 400 cycles. For such a sol-gel prepared electrode, the MDV decay is only 0.28 V after 100 cycles (see Figure 7b).

3.3. Transport Properties

Electrochemical impedance spectroscopy (EIS) was used to obtain insight into the origin of the different electrochemical performance of LNMC and Na-LNMC electrodes. The EIS plots of LNMC and Na-LNMC electrodes tested after the 5th cycle are presented in Figure 9a. Experimentally, three regions can be distinguished in Nyquist plots: (i) the intercepts at high frequency with the Z′-axis (horizontal axis) are related to the uncompensated ohmic resistance of the cell (RΩ); (ii) in the intermediate-frequency region, a depressed semicircle is ascribed to the charge transfer impedance (Rct, CPEct) at the electrode/electrolyte interface, in which the constant phase element is expressed by CPE = 1/T((jω) p) with ω the angular frequency, T, a CPE constant, and p, an exponent (0 ≤ p ≤ 1, p = 1 for pure capacitance), and j is the imaginary number (j = √−1); and (iii) the low-frequency range is ascribed to the ion diffusion process in the bulk electrode (σw Warburg component) [59]. Transport parameters of the EIS fit corresponding to the equivalent circuit (inset of Figure 9a) are reported in Table 5. It can be seen that RΩ is negligible for both electrodes, which shows that the ohmic polarization of these electrodes is negligible. The Rct value for the Na-LNMC (298 Ω) electrode is found to be much lower than that for the LNMC (933 Ω) electrode. This reveals that the Na-doping was efficient to reduce the degradation of the surface of the electrode during the formation of the electrolyte.
To account for the improved electrochemical performance of the Na-LNMC electrode, to determine the Li diffusion coefficient (DLi), Z′ is reported as a function of ω−1/2 in Figure 9b in the low frequency range where this curve is linear according to the Warburg impedance model. The diffusion coefficient can be calculated according to the following equation [60]:
D Li = R 2 T 2 2 A 2 n 4 F 4 C Li 2 σ w 2 ,
where R, T, and F constants have their usual meaning, n is the number of electrons per molecule during oxidization, A is the effective working area of the cathode (BET specific surface area), CLi is the Li-ion concentration in the electrode, and σ is the slope of the linear curve in Figure 9b, as Z′ is given by the equation [61]:
Z′ = RΩ + Rct + σw ω−1/2.
Diffusion coefficients were calculated using Equation (3), in which the σw Warburg component was extracted from the plots in Figure 9b. These linear plots were obtained from EIS measurements in the low-frequency range (Warburg region characterized by an inclined line at 45°). The results reveal that the Na-LNMC material has a higher value of DLi (10.7 × 10⁻¹¹ cm2 s−1) than LNMC (3.4 × 10⁻¹¹ cm2 s−1), which sizes the improvement of the kinetics of lithium-ion diffusion due to the enlarged Li slab space induced by Na-doping. This explains the remarkable increase in the rate capability induced by the Na-doping. The Na-LNMC electrode exhibits a significant decrease of the Rct value, which is a direct indication of an increase of electrical transfer at the interface resulting in an increase of rate capability. The exchange current density j0 is calculated from the linearized Butler–Volmer equation [62]:
j 0 = R T n F A 1 R c t ,
which is an intrinsic property of the cathode material, independent of the manufacturing of the cell, and independent of the size and shape of the particles. The higher value of j0 of 0.37 mA cm−2 for the Na-LNMC electrode (against 0.24 mA cm−2 for pristine LNMC) implies an easier electrochemical reaction on the surface. These values compare well with the exchange current density of 0.25 mA cm−2 for LiNi0.33Co0.33Mn0.33O2 (NCM111) [63], 0.17 mA cm−2 for LiFePO4 (LFP) [64], and 0.23 mA cm−2 for LiNi0.5Mn1.5O4 (LNM) [65] cathode materials.
Another test for the performance of a lithium-insertion electrode consists in the basic concept of the area-specific impedance (ASI) in Ω cm2 due to the combination of different factors that change the overall cell potential (Figure 10). ASI is determined from the change in the equilibrium potential as the charge is passed as a function of the depth of discharge (DOD) [6]:
A S I = A Δ V I ,
where A is the cross-sectional area of the electrode and I is the current passed throughout the cell. ΔV = OCVVcell is the potential change during current interruption at each DOD.
The ASI and the corresponding OCV of the LNMC and Na-LNMC sample are shown in Figure 10. It can be seen that the increase of ASI during cycling is reduced importantly by Na-doping. The largest increment of ASI appeared at 90% DOD, where the resistance increased only from 15.3 to 35 Ω cm2 for the Na-LNMC cathode, while the corresponding values of the pristine LNMC cathode increased from 20.3 to 62.1 Ω cm2. Similar results were reported in our previous work and for other coated cathode materials [6].

4. Conclusions

In this paper, the un-doped Li-rich oxide (pristine) Li1.2Ni0.13Mn0.54Co0.13O2 and 3% Na-doped Li1.17Na0.03Ni0.13Mn0.54Co0.13O2 were prepared by the sol gel method. XRD confirmed that Na+ doping into the pristine LNMC has a direct effect on the amelioration of the electrochemical performance due to an increase in lithium-ion diffusivity as a result of the increase the lattice parameter c, since Na-doping occurs in Li layers and not the TM layer. Compared to the un-doped sample, the Na-doped sample has the same layered structure with the same range of particle sizes, ~150–200 nm. On another hand, Na-doping increases the structural stability as it minimizes the Ni-Li substitution defects to such a low level that their impact on electrochemical properties is negligible. Most of all, the synthesis process and structure of the particles are at the origin of an additional capacity with “U” shaped C-V curves, resulting in the unprecedented electrochemical performance of Na-LNCM among Li-rich electrode materials.

Author Contributions

Conceptualization, A.M.H. and A.E.A.-G.; formal analysis, A.E.A.-G. and R.S.E.-T.; investigation, A.E.A.-G. and R.S.E.-T.; writing—original draft preparation, A.M.H. and A.M.; writing—review and editing, A.M. and C.M.J.; supervision, C.M.J.; funding acquisition, A.M.H. All authors have read and agreed to the published version of the manuscript.

Funding

This research received funding from Science and Technology Development Fund (STDF) through the project number 23159 (Economical synthesis methods for nanosized energy storage cathode materials to be used in lithium-ion batteries).

Data Availability Statement

Data are contained within the article.

Acknowledgments

A.M.H. is grateful to financial support from Science and Technology Development Fund (STDF).

Conflicts of Interest

The authors declare no conflict of interest.

References

  1. Manthiram, A.; Knight, J.C.; Myung, S.-T.; Oh, S.-M.; Sun, Y.-K. Nickel-rich and lithium-rich layered oxide cathodes. Adv. Energy Mater. 2016, 6, 1501010. [Google Scholar] [CrossRef]
  2. Liu, J.; Wang, Q.; Reeja-Jayan, B.; Manthiram, A. Carbon-coated high capacity layered Li[Li0.2Mn0.54Ni0.13Co0.13]O2 cathodes. Electrochem. Commun. 2010, 12, 750–753. [Google Scholar] [CrossRef]
  3. Li, H.; Guo, H.; Wang, Z.; Wang, J.; Li, X.; Chen, N.; Gui, W. Improving rate capability and decelerating voltage decay of Li-rich layered oxide cathodes by chromium doping. Int. J. Hydrog. Energy 2018, 43, 11109–11119. [Google Scholar] [CrossRef]
  4. Hy, S.; Felix, F.; Rick, J.; Su, W.-N.; Hwang, B.J. Direct in situ observation of Li2O evolution on Li-rich high-capacity cathode material Li[NixLi(1–2x)/3Mn(2–x)/3]O2 (0 ≤ x ≤ 0.5). J. Am. Chem. Soc. 2014, 136, 999–1007. [Google Scholar] [CrossRef]
  5. Zhao, Y.; Liu, J.T.; Wang, S.; Ji, R.; Xia, Q.; Ding, Z. Surface structural transition induced by gradient polyanion-doping in Li-rich layered oxides: Implications for enhanced electrochemical performance. Adv. Funct. Mater. 2016, 26, 4760–4767. [Google Scholar] [CrossRef]
  6. Abdel-Ghany, A.; El-Tawil, R.S.; Hashem, A.M.; Mauger, A.; Julien, C.M. Improved electrochemical performance of LiNi0.5Mn0.5O2 by Li-enrichment and AlF3 coating. Materialia 2019, 5, 100207. [Google Scholar] [CrossRef]
  7. Zhang, L.; Jiang, J.; Zhang, C.; Wu, B.; Wu, F. High-rate layered lithium-rich cathode nanomaterials for lithium-ion batteries synthesized with the assist of carbon spheres templates. J. Power Sources 2016, 331, 247–257. [Google Scholar] [CrossRef]
  8. Abdel-Ghany, A.E.; Hashem, A.M.; Mauger, A.; Julien, C.M. Effects of chelators on the structure and electrochemical properties of Li-rich Li1.2Ni0.13Co0.13Mn0.54O2 cathode materials. J. Solid State Electrochem. 2020, 24, 3157–3172. [Google Scholar] [CrossRef]
  9. Yu, R.; Wang, X.; Fu, Y.; Wang, L.; Cai, M.; Liu, M.; Lu, B.; Wang, G.; Wang, D.; Ren, Q.; et al. Effect of magnesium doping on properties of lithium-rich layered oxide cathodes based on a one-step co-precipitation strategy. J. Mater. Chem. A 2016, 4, 4941–4951. [Google Scholar] [CrossRef]
  10. Zhao, J.; Wang, Z.; Guo, H.; Li, X.; He, Z.; Li, T. Synthesis and electrochemical characterization of Zn-doped Li-rich layered Li[Li0.2Mn0.54Ni0.13Co0.13]O2 cathode material. Ceramics. Int. A 2015, 41, 11396–11401. [Google Scholar] [CrossRef]
  11. Park, J.H.; Lim, J.; Yoon, J.; Park, K.S.; Gim, J.; Song, J.; Park, H.; Im, D.; Park, M.; Ahn, D.; et al. The effects of Mo doping on 0.3Li[Li0.33Mn0.67]O2·0.7Li[Ni0.5Co0.2Mn0.3]O2 cathode material. Dalton Trans. 2012, 41, 3053–3059. [Google Scholar] [CrossRef] [PubMed]
  12. Liu, X.; Huang, T.; Yu, A. Fe doped Li1.2Mn0.6−x/2Ni0.2−x/2FexO2 (x ≤ 0.1) as cathode materials for lithium-ion batteries. Electrochim. Acta 2014, 133, 555–563. [Google Scholar] [CrossRef]
  13. Dianat, A.; Seriani, N.; Bobeth, M.; Cuniberti, G. Effects of Al-doping on the properties of Li-Mn-Ni-O cathode materials for Li-ion batteries: An ab initio study. J. Mater. Chem. A 2013, 1, 9273–9280. [Google Scholar] [CrossRef]
  14. Li, H.; Fan, L.Z. Effects of fluorine substitution on the electrochemical performance of layered Li-excess nickel manganese oxides cathode materials for lithium-ion batteries. Electrochim. Acta 2013, 113, 407–411. [Google Scholar] [CrossRef]
  15. Ding, Z.; Xu, M.; Liu, J.; Huang, Q.; Chen, L.; Wang, P. Understanding the enhanced kinetics of gradient-chemical-doped lithium-rich cathode material. ACS Appl. Mater. Interfaces 2017, 9, 20519–20526. [Google Scholar] [CrossRef]
  16. Lim, S.N.; Seo, J.Y.; Jung, D.S.; Ahn, W.; Song, H.S.; Yeon, S.H.; Park, S.B. Rate capability for Na-doped Li1.167Ni0.18Mn0.548Co0.105O2 cathode material and characterization of Li-ion diffusion using galvanostatic intermittent titration technique. J. Alloys Compd. 2015, 623, 55–61. [Google Scholar] [CrossRef]
  17. Zheng, Z.; Guo, X.; Zhong, Y.; Hua, W.; Shen, C.; Chou, S.; Yang, X. Host structural stabilization of Li1.232Mn0.615Ni0.154O2 through K-doping attempt: Toward superior electrochemical performances. Electrochim. Acta 2016, 188, 336–343. [Google Scholar] [CrossRef] [Green Version]
  18. Park, S.H.; Shin, S.S.; Sun, Y.K. The effects of Na doping on performance of layered Li1.1−xNax(Ni0.2Co0.3Mn0.4)O2 materials for lithium secondary batteries. Mater. Chem. Phys. 2006, 95, 218–221. [Google Scholar] [CrossRef]
  19. Qiu, B.; Wang, J.; Xia, Y.; Liu, Y.; Qin, L.; Yao, X.; Liu, Z. Effects of Na+ contents on electrochemical properties of Li1.2Co0.13Ni0.13Mn0.54O2 cathode materials. J. Power Sources 2013, 240, 530–535. [Google Scholar] [CrossRef]
  20. He, W.; Yuan, D.; Qian, J.; Ai, X.; Yang, H.; Cao, Y. Enhanced high-rate capability and cycling stability of Na-stabilized layered Li1.2[Co0.13Ni0.13Mn0.54]O2 cathode material. J. Mater. Chem. A 2013, 1, 11397–11403. [Google Scholar] [CrossRef]
  21. Jarvis, K.A.; Deng, Z.; Allard, L.F.; Manthiram, A.; Ferreira, P.J. Atomic structure of a lithium-rich layered oxide material for lithium-ion batteries: Evidence of a solid solution. Chem. Mater. 2011, 23, 3614–3621. [Google Scholar] [CrossRef]
  22. Cui, C.; Fan, X.; Zhou, X.; Chen, J.; Wang, Q.; Ma, L.; Yang, C.; Hu, E.; Yang, X.Q.; Wang, C. Structure and interface design enable stable Li-rich cathode. J. Am. Chem. Soc. 2020, 142, 8918–8927. [Google Scholar] [CrossRef] [PubMed]
  23. Yin, C.; Wei, Z.; Zhang, M.; Qiu, B.; Zhou, Y.; Xiao, Y.; Zhou, D.; Yun, L.; Li, C.; Gu, Q.; et al. Structural insights into composition design of Li-rich layered cathode materials for high-energy rechargeable battery. Mater. Today 2021, 51, 15–26. [Google Scholar] [CrossRef]
  24. Yu, H.; Ishikawa, R.; So, Y.G.; Shibata, N.; Kudo, T.; Zhou, H.; Ikuhara, Y. Direct atomic-resolution observation of two phases in the Li1.2Mn0.567Ni0.166Co0.067O2 cathode material for lithium-ion batteries. Angew. Chem. Int. Ed. 2013, 52, 5969–5973. [Google Scholar] [CrossRef] [PubMed]
  25. Ates, M.N.; Jia, Q.; Shah, A.; Busnaina, A.; Mukerjee, S.; Abraham, K.M. Mitigation of layered to spinel conversion of a Li-rich layered metal oxide cathode material for Li-ion batteries. J. Electrochem. Soc. 2014, 161, A290–A301. [Google Scholar] [CrossRef] [Green Version]
  26. Hashem, A.M.; Abdel-Ghany, A.E.; Scheuermann, M.; Indris, S.; Ehrenberg, H.; Mauger, A.; Julien, C.M. Doped nanoscale NMC333 as cathode materials for Li-ion batteries. Materials 2019, 12, 2899. [Google Scholar] [CrossRef] [Green Version]
  27. Wang, D.; Liu, M.; Wang, X.; Yu, R.; Wang, G.; Ren, Q.; Yang, X. Facile synthesis and performance of Na-doped porous lithium-rich cathodes for lithium-ion batteries. RSC Adv. 2016, 6, 57310. [Google Scholar] [CrossRef]
  28. Zhang, X.; Jiang, W.J.; Mauger, A.; Lu, Q.; Gendron, F.; Julien, C.M. Minimization of the cation mixing in Li1+x (NMC)1−x O2 as cathode material. J. Power Sources 2010, 195, 1292–1301. [Google Scholar] [CrossRef]
  29. Ilican, S. Effect of Na doping on the microstructures and optical properties of ZnO nanorods. J. Alloys Compd. 2013, 553, 225–232. [Google Scholar] [CrossRef]
  30. Li, X.; Qiao, Y.; Guo, S.; Xu, Z.; Zhu, H.; Zhang, X.; Yuan, Y.; He, P.; Ishida, M.; Zhou, H. Direct visualization of the reversible O2−/O redox process in Li-rich cathode materials. Adv. Mater. 2018, 30, 1705197. [Google Scholar] [CrossRef]
  31. He, W.; Liu, P.; Qu, B.; Zheng, Z.; Zheng, H.; Deng, P.; Li, P.; Li, S.; Huang, H.; Wang, L.; et al. Uniform Na+ doping-induced defects in Li- and Mn-rich cathodes for high-performance lithium-ion batteries. Adv. Sci. 2019, 6, 1802114. [Google Scholar] [CrossRef] [PubMed] [Green Version]
  32. Liu, Y.; Ning, D.; Zheng, L.; Zhang, Q.; Gu, L.; Gao, R.; Zhang, J.; Franz, A.; Schumacher, G.; Liu, X. Improving the electrochemical performances of Li-rich Li1.2Ni0.13Co0.13Mn0.54O2 through a cooperative doping of Na+ and PO4 with Na3PO4. J. Power Sources 2018, 375, 1–10. [Google Scholar] [CrossRef] [Green Version]
  33. Kang, S.H.; Johnson, C.S.; Vaughey, J.T.; Amine, K.; Thackeray, M.M. The effects of acid treatment on the electrochemical properties of 0.5Li2MnO3·0.5LiNi0.44Co0.25Mn0.31O2 electrodes in lithium cells. J. Electrochem. Soc. 2006, 153, A1186–A1192. [Google Scholar] [CrossRef]
  34. Sun, Y.K.; Li, M.J.; Yoon, C.S.; Hassoun, J.; Amine, K.; Scrosati, B. The role of AlF3 coatings in improving electrochemical cycling of Li-enriched nickel-manganese oxide electrodes for Li-ion batteries. Adv. Mater. 2012, 24, 1192–1196. [Google Scholar] [CrossRef] [PubMed]
  35. Du, K.; Yang, F.; Hu, G.R.; Peng, Z.D.; Cao, Y.B.; Ryn, K. Sodium additive to improve rate performance of Li[Li0.2Mn0.54Ni0.13Co0.13]O2 LiNi0.5Co0.2Mn0.3O2 material for Li-ion batteries. J. Power Sources 2013, 244, 29–34. [Google Scholar] [CrossRef]
  36. Peng, Z.; Mu, K.; Cao, Y.; Xu, L.; Du, K.; Hu, G. Enhanced electrochemical performance of layered Li-rich cathode materials for lithium-ion batteries via aluminum and boron dual-doping. Ceram. Int. 2019, 45, 4184–4192. [Google Scholar] [CrossRef]
  37. Schipper, F.; Nayak, P.K.; Erickson, E.M.; Amalraj, S.F.; Srur-Lavi, O.; Penki, T.R.; Talianker, M.; Grinblat, J.; Sclar, H.; Breuer, O.; et al. Studies of cathode materials for lithium-ion batteries: Recent progress and new challenges. Inorganics 2017, 5, 32. [Google Scholar] [CrossRef]
  38. Hua, W.; Wang, S.; Knapp, M.; Leake, S.J.; Senyshyn, A.; Richter, C.; Yavuz, M.; Binder, J.R.; Grey, C.P.; Ehrenberg, H.; et al. Structural insights into the formation and voltage degradation of lithium- and manganese-rich layered oxides. Nat. Commun. 2019, 10, 5365. [Google Scholar] [CrossRef]
  39. Zheng, J.; Gu, M.; Genc, A.; Xiao, J.; Xu, P.; Chen, X.; Zhu, Z.; Zhao, W.; Pullan, L.; Wang, C.; et al. Mitigating voltage fade in cathode materials by improving the atomic level uniformity of elemental distribution. Nano Lett. 2014, 14, 2628–2635. [Google Scholar] [CrossRef]
  40. Qian, D.; Xu, B.; Chi, M.; Meng, Y.S. Uncovering the roles of oxygen vacancies in cation migration in lithium excess layered oxides. Phys. Chem. Chem. Phys. 2014, 16, 14665–14668. [Google Scholar] [CrossRef] [Green Version]
  41. Genevois, C.; Koga, H.; Croguennec, L.; Ménétrier, M.; Delmas, C.; Weill, F. Insight into the atomic structure of cycled lithium-rich layered oxide Li1.20Mn0.54Co0.13Ni0.13O2 using HAADF STEM and electron nanodiffraction. J. Phys. Chem. C 2015, 119, 75–83. [Google Scholar] [CrossRef]
  42. Kim, S.; Cho, W.; Zhang, X.; Oshima, Y.; Choi, J.W. A stable lithium-rich surface structure for lithium-rich layered cathode materials. Nat. Commun. 2016, 7, 13598. [Google Scholar] [CrossRef] [PubMed]
  43. Keppeler, M.; Srinivasan, M. Interfacial phenomena/capacities beyond conversion reaction occurring in nano-sized transition-metal-oxide-based negative electrodes in lithium-ion batteries: A review. ChemElectroChem 2017, 4, 2727–2754. [Google Scholar] [CrossRef]
  44. Sun, Y.M.; Hu, X.L.; Luo, W.; Huang, Y.H. Porous carbon-modified MnO disks prepared by a microwave-polyol process and their superior lithium-ion storage properties. J. Mater. Chem. 2012, 22, 19190–19195. [Google Scholar] [CrossRef]
  45. Luo, W.; Hu, X.; Sun, Y.; Huang, Y. Controlled synthesis of mesoporous MnO/C networks by microwave irradiation and their enhanced lithium-storage properties. ACS Appl. Mater. Interfaces 2013, 5, 1997–2003. [Google Scholar] [CrossRef]
  46. Feng, J.K.; Song, B.H.; Lai, M.O.; Lu, L. Electrochemical property of LiMn2O4 in over-discharge conditions. Funct. Mater. Lett. 2012, 5, 1250028. [Google Scholar] [CrossRef]
  47. Liu, Y.; Liu, D.; Wu, H.-H.; Fan, X.; Dou, A.; Zhang, Q.; Su, M. Improved cycling stability of Na-doped cathode materials Li1.2Ni0.2Mn0.6O2 via a facile synthesis. ACS Sustainable Chem. Eng. 2018, 6, 13045–13055. [Google Scholar] [CrossRef]
  48. Liu, H.; Tao, L.; Wang, W.; Zhang, B.; Su, M. Effects of raw materials on the electrochemical performance of Na-doped Li-rich cathode materials Li[Li0.2Ni0.2Mn0.6]O2. Ionics 2019, 25, 959–968. [Google Scholar] [CrossRef]
  49. Zhang, K.; Sheng, H.; Wu, X.; Fu, L.; Liu, Z.; Zhou, C.; Holze, R.; Wu, Y. Improving electrochemical properties by sodium doping for lithium-rich layered oxides. ACS Appl. Energy Mater. 2020, 3, 8953–8959. [Google Scholar] [CrossRef]
  50. Kuang, F.; Zhang, D.; Li, Y.J.; Wan, Y.; Hou, B.R. Electrochemical impedance spectroscopy analysis for oxygen reduction reaction in 3.5% NaCl solution. J. Solid State Electrochem. 2009, 13, 385–390. [Google Scholar] [CrossRef]
  51. Hua, W.B.; Zhang, J.B.; Zheng, Z.; Liu, W.Y.; Peng, X.H.; Guo, X.D.; Zhong, B.H.; Wang, Y.J.; Wang, X.L. Na-doped Ni-rich LiNi0.5Co0.2Mn0.3O2 cathode material with both high rate capability and high tap density for lithium ion batteries. Dalton Trans. 2014, 43, 14824–14832. [Google Scholar] [CrossRef] [PubMed]
  52. Zhao, R.; Yang, Z.; Liang, J.; Lu, D.; Liang, C.; Guan, X.; Gao, A.; Chen, H. Understanding the role of Na-doping on Ni-rich layered oxide LiNi0.5Co0.2Mn0.3O2. J. Alloys Compd. 2016, 689, 318–325. [Google Scholar] [CrossRef]
  53. Huang, Z.J.; Wang, Z.X.; Jing, Q.; Gao, H.J.; Li, X.H.; Yang, Z.H. Investigation on the effect of Na doping on structure and Li-ion kinetics of layered LiNi0.6Co0.2Mn0.2O2 cathode material. Electrochim. Acta 2016, 192, 120. [Google Scholar] [CrossRef]
  54. Xue, Z.; Qi, X.; Li, L.; Li, W.; Xu, L.; Xie, Y.; Lai, X.; Hu, G.; Peng, Z.; Cao, Y.; et al. Sodium doping to enhance electrochemical performance of overlithiated oxide cathode materials for Li-ion batteries via Li/Na ion-exchange method. ACS Appl. Mater. Interfaces 2018, 10, 27141–27149. [Google Scholar] [CrossRef] [PubMed]
  55. Zhou, Y.; Shan, W.; Hou, X.; Lam, K.; Zhao, X.; Liu, X.; Wu, Y. Study of spherical Li1.2NaxMn0.54Ni0.13Co0.13O2 cathode based on dual Li+/Na+ transport system for Li-ion batteries. Solid State Ion. 2020, 350, 115326. [Google Scholar] [CrossRef]
  56. Vu, D.L.; Lee, J. Na-doped layered LiNi0.8Co0.1Mn0.1O2 with improved rate capability and cycling stability. J. Solid State Electrochem. 2018, 22, 1165–1173. [Google Scholar] [CrossRef]
  57. Zhang, P.; Zhai, X.; Huang, H.; Zhou, J.; Li, X.; He, Y.; Guo, Z. Suppression of structural phase transformation of Li-rich Mn-based layered cathode materials with Na ion substitution strategy. Electrochim. Acta 2020, 349, 136402. [Google Scholar] [CrossRef]
  58. Qing, R.-P.; Shi, J.-L.; Xiao, D.-D.; Zhang, X.-D.; Yin, Y.-X.; Zhai, Y.-B.; Gu, L.; Guo, Y.-G. Enhancing the kinetics of Li-rich cathode materials through the pinning effects of gradient surface Na+ doping. Adv. Energy Mater. 2016, 6, 1501914. [Google Scholar] [CrossRef]
  59. Zhang, X.; Mauger, A.; Lu, Q.; Groult, H.; Perrigaud, L.; Gendron, F.; Julien, C.M. Synthesis and characterization of LiNi1/3Mn1/3Co1/3O2 by wet-chemical method. Electrochim. Acta 2010, 55, 6440–6449. [Google Scholar] [CrossRef]
  60. Shaju, K.M.; Subba-Rao, G.V.; Chowdari, B.V.R. EIS and GITT studies on oxide cathodes, O2-Li2/3x(Co0.15Mn0.85)O2 (x= 0 and 1/3). Electrochim. Acta 2003, 48, 2691–2703. [Google Scholar] [CrossRef]
  61. Swiderska-Mocek, A.; Lewandovski, A. Kinetics of Li-ion transfer reaction at LiMn2O4, LiCoO2, and LiFePO4 cathodes. J. Solid State Electrochem. 2017, 21, 1365–1372. [Google Scholar] [CrossRef] [Green Version]
  62. Wang, L.; Zhao, J.; He, X.; Gao, J.; Li, J.; Wan, C.; Juang, C. Electrochemical impedance spectroscopy (EIS) study of LiNi1/3Mn1/3Co1/3O2 for Li-ion batteries. Int. J. Electrochem. Sci. 2012, 7, 345–353. [Google Scholar]
  63. Heubner, C.; Schneider, M.; Michaelis, A. Investigation of charge transfer kinetics of Li-intercalation in LiFePO4. J. Power Sources 2015, 288, 115–120. [Google Scholar] [CrossRef]
  64. Amin, R.; Belharouak, I. Part-II: Exchange current density and ionic diffusivity studies on the ordered and disordered spinel LiNi0.5Mn1.5O4 cathode. J. Power Sources 2017, 348, 218–325. [Google Scholar]
  65. Sun, Y.-K.; Myung, S.-T.; Park, B.-C.; Yashiro, H. Improvement of the electrochemical properties of Li[Ni0.5Mn0.5]O2 by AlF3 coating. J. Electrochem. Soc. 2008, 155, A705–A710. [Google Scholar] [CrossRef]
Figure 1. (a) XRD patterns of LNCM (in red) and Na-LNCM (in black) cathode materials (using a CuKα X-ray source, λ = 1.54056 Å) and Rietveld refinements of (b) LNCM and (c) Na-LNCM. Cross marks are experimental data and solid lines (in red) are calculated diagrams. The curve at the bottom is the difference between the calculated and observed intensities (in blue). (d) Analysis of micro-strain from the full-width B at half-maximum of the XRD peaks according to Equation (1).
Suschem 03 00010 g001
Figure 2. EDX spectra of (a) LNMC and (b) Na-doped LNMC samples.
Suschem 03 00010 g002
Figure 3. (a) SEM image of LNCM, (b) SEM image of Na-LNCM, (c) TEM image of LNCM, (d) TEM image of Na-LNCM, (e) HRTEM image of LNCM, (f) HRTEM image of Na-LNCM, and (g) SAED pattern of LNCM and (h) SAED pattern of Na-LNCM.
Suschem 03 00010 g003
Figure 4. (a) N2 adsorption–desorption isotherms and (b) pore size distribution (PSD) curves for LNCM and Na-LNCM samples.
Suschem 03 00010 g004
Figure 5. Cyclic voltammetry of (a) pristine LNCM and (b) Na-doped LNCM recorded in the voltage range of 2.5–4.6 V at a scan rate of 0.1 V s−1. 1st cycle (blue), 2nd cycle (black) and 3rd cycle (red).
Suschem 03 00010 g005
Figure 6. Typical galvanostatic charge–discharge curves from 1st to 100th cycle of (a) pristine LNCM and (b) Na-LNCM recorded in the potential range 2.5–4.8 V vs. Li+/Li at C/10 rate. (c) Comparison of cycling behaviors of the pristine and Na-doped electrodes over 85 cycles.
Suschem 03 00010 g006
Figure 7. Incremental capacity curves of (a) pristine LNCM and (b) Na-doped LNCM electrodes at the 1st and 100th discharge.
Suschem 03 00010 g007
Figure 8. Specific capacity (black for charge, red for discharge) and Coulombic efficiency (blue) for Na-doped LNCM electrodes at various current densities (a) 0.1C, (b) 0.5C, (c) 1C and (d) 2C. (e) Modified Peukert plot for the Na-doped LNCM electrode.
Suschem 03 00010 g008
Figure 9. (a) Nyquist plots of LNMC and Na-LNMC electrodes and (b) Nyquist plot of the linear relationship between the Warburg impedance and the inverse square root of angular frequency.
Suschem 03 00010 g009
Figure 10. Area specific impedance (ASI) of LNMC and Na-LNMC as a function of depth of discharge (DOD).
Suschem 03 00010 g010
Table 1. Structural parameters obtained from Rietveld refinements of X-ray diffraction data for the LNCM and Na-LNCM samples.
SampleLNCMNa-LNCM
Lattice parameters
a (Å)2.849 (7)2.850 (2)
c (Å)14.214 (1)14.242 (5)
c/a4.987 (9)4.997 (1)
V3)99.92100.18
I(003)/I(104)1.331.49
Lc (nm)38.449.2
ε × 10−3 (rd)2.262.86
Reliability factors
Rp (%)8.278.98
Rwp (%)11.312.18
RF1.753.22
χ21.261.81
Ni2+ in Li layer2.851.68
S(MO2)a(Å)2.1022.109
I(LiO2)b(Å)2.6292.638
a S(MO2) = 2(⅓Zoxy)c is the thickness of the metal–O2 planes. b I(LiO2) = c/3S(MO2) is the thickness of the inter-slab space.
Table 2. EDX analysis of element amounts of Na/Ni/Mn/Co in LNMC and Na-doped LNMC samples.
Nominal FormulaComposition
NaNiCoMn
Li1.2Ni0.13Co0.13Mn0.54O20.0000.1270.1350.538
Li1.17Na0.03Ni0.13Co0.13Mn0.54O20.0320.1260.1270.547
Table 3. BET specific surface area, calculated average particle size from BET data (LBET) using Equation (2) and LTEM from TEM images.
SampleSBETLBETLTEM
(m2 g−1)(nm)(nm)
LNCM7.28181180
Na-LNCM6.67198200
Table 4. Electrochemical properties of some Na-doped layered NMC-type cathodes with 3%Na dopant. Number of cycles is indicated in parenthesis.
Pristine MaterialSynthesisParticle Size (nm)Specific Capacity (mAh g−1)Ref.
LiNi0.5Co0.2Mn0.3O2coprecipitation100–400210 @ C/5 (10)[50]
LiNi0.5Co0.2Mn0.3O2 (a)coprecipitation500150 @ C/5 (50)[51]
Li1.2Mn0.54Ni0.13Co0.13O2solid-state reaction500170 @ 2C (5)[52]
Li1.2Co0.13Ni0.13Mn0.54O2polymer-pyrolysis100–150190 @ C/3 (100)[20]
LiNi0.6Co0.2Mn0.2O2HT solid reaction50–80150 @C/10 (100)[35]
Li1.2Ni0.246Mn0.462Co0.062O2hydrothermal400–600180 @1C (100)[53]
Li1.2Mn0.54Ni0.13Co0.13O2Li/Na ion exchange15 µm (d)180 @1C (100)[54]
Li1.2Mn0.54Ni0.13Co0.13O2 (b)coprecipitation200–400120 @1C (100)[55]
LiNi0.8Co0.1Mn0.1O2solid-state reaction300161 @ C/10 (100)[56]
Li1.2Mn0.54Ni0.13Co0.13O2coprecipitation500210 @ C/10 (5)[35]
Li1.167Ni0.18Mn0.548Co0.105O2 (c)spray pyrolysis1 µm (d)180 @ C/2 (50)[16]
Li1.2Mn0.54Ni0.13Co0.13O2 (c)HT solid reaction200–400217 @ 1C (100)[57]
Li1.2Mn0.54Ni0.13Co0.13O2 (e)molten salt18.6 µm (d)230 @ C/5 (100)[58]
Li1.2Mn0.54Ni0.13Co0.13O2sol-gel200180 @ C/10 (100)this work
Li1.2Mn0.54Ni0.13Co0.13O2sol-gel20050 @ 2C (400)this work
(a) x(Na) = 0.02, (b) x(Na) = 0.15, (c) x(Na) = 0.05, (d) size of secondary particle, (e) gradient surface Na-doped.
Table 5. Transport parameters of LNMC and Na-LNMC electrodes deduced from EIS measurements carried out after five charge-discharge cycles. Diffusion coefficients have been calculated using Equation (3).
SampleRΩRctCPEctσwDLi
(Ω)(Ω)Tp(Ω s−1/2)(cm2 s−1)
LNMC3.29333.8 × 10−539.241.33.4 × 10−11
Na-NMC2.92985.1 × 10−625.724.610.7 × 10−11
Publisher’s Note: MDPI stays neutral with regard to jurisdictional claims in published maps and institutional affiliations.

