Abstract
This paper presents results from experimental and analytical investigations conducted to evaluate the lateral load behavior and capacity of steel-plate composite (SC) wall-to-reinforced concrete (RC) basemat connections. Two SC wall-to-reinforced concrete basemat connection specimens were tested. These SC wall specimens had a height-to-length ratio of 0.6 and did not include boundary elements. The experimental results include the lateral force-displacement (V-Δ) responses of the specimens and observations of local damage such as steel plate local buckling and concrete crushing. 3D finite element models were developed and benchmarked using the experimental results. The benchmarked models were used to conduct analytical parametric studies, expand the database, and gain additional insights into the behavior of SC wall-to-RC basemat connections. The parameters included in analytical investigations were the wall aspect ratio (h/lw), reinforcement ratio (ρ), and wall thickness (T).
1. Introduction
Steel-plate composite (SC) walls have been considered an alternative to conventional reinforced concrete (RC) construction for safety-related nuclear facilities. Empty SC modules are fabricated in the controlled environment of the shop, then transported to the field, erected, and assembled in situ before concrete casting. These SC wall designs eliminate the need for formwork as the steel faceplates also serve as formwork for placing concrete. The nature of construction practice for SC walls provides improved quality control and reduced construction time, which results in a reduction in construction costs and schedule, as evidenced by the construction of the AP1000® nuclear power plants in Sanmen, China, and in the US in Vogtle, Georgia. Because of this reason, SC walls are being considered for next-generation nuclear power plants, including small modular reactors. In addition, SC walls are gaining interest from the building industry for the application to the elevator core walls of high-rise building structures.
Experimental and analytical investigations have been conducted over the past 30 years around the world. The focus has been on mostly the structural performance of SC walls subjected to axial compression [1,2,3,4], in-plane shear [5,6,7,8,9,10,11,12,13], out-of-plane shear [14,15], out-of-plane flexure [16,17], and combined in-plane and out-of-plane forces [18]. These investigations demonstrated adequate structural performance and ductility of SC walls. Based on the results from the investigations, design guidelines have been developed [19] for SC walls.
The construction of the AP1000® nuclear power plants and the research investigations described above suggest that SC walls have tremendous potential to serve as an alternative to conventional reinforced concrete (RC) walls while expediting construction; however, this potential can be achieved only when the SC walls are connected and the externally induced forces transferred successfully to the RC basemat. Three possible SC wall-to-RC basemat connection technologies have been described and identified [20,21], but it can still be challenging to design and detail connections between SC walls and RC basemat due to the complex and unclear force transfer mechanisms associated with the connections. This paper provides results from experimental and analytical investigations conducted on SC wall-to-RC basemat connections to evaluate their fundamental behavior and strength. The connections are designed and detailed in accordance with the overstrength connection design approach, which is based on AISC N690-18 [19] and described in the paper as well.
When SC wall connections are designed, two connection design philosophies can be considered: (i) full-strength and (ii) over-strength connection design. These two philosophies are permitted by AISC N690-18 [19]. With the full-strength connection philosophy, the connection region is strong enough to develop the full-strength (125%) of the weaker of the connected structures. It is often associated with the formation of plastic hinges away from the connection region, dissipating energy during design basis seismic events. So, this full-strength connection philosophy is often recommended and preferred.
However, the full-strength connection design can be sometimes challenging and somewhat unnecessary, particularly when the SC wall is significantly overdesigned with respect to design demands from linear analysis due to radiation shielding or other serviceability-level requirements. In such cases, the over-strength connection design philosophy can be used. With the over-strength connection design philosophy, the connection region required strength is greater than or equal to 200% of the seismic demands +100% of the non-seismic demands; however, this means that the connection region will be weaker than the SC wall and the source of inelastic deformations; therefore, it is imperative to investigate and evaluate the in-plane behavior of such overstrength connections. This paper presents the results from an experimental investigation conducted to evaluate the behavior of SC wall piers designed with the over-strength connection design philosophy. After providing the experimental results, the paper focuses on the development and validation of a finite-difference-based numerical modeling approach to evaluate the fundamental behavior of wall piers subjected to in-plane shear. The developed modeling approach is used for analytical parametric studies to evaluate the influence of various design parameters, including SC wall reinforcement ratio, aspect ratio (SC wall height to width), and rebar size.
2. Previous Research
2.1. SC Wall-to-RC Basemat Non-Contact Lap Splice
Katayama et al. [21] have experimentally and analytically investigated the behavior and design of non-contact lap splice connections between SC walls to RC basemat subjected to axial tension force. With the exception of the applied loading, the connection details investigated by the authors are similar to those considered in this paper. Figure 1 illustrates the non-contact lap splice connection that the authors considered. As illustrated, the rebars from the RC wall are extended and lap spliced with the steel faceplates of the SC wall portion. Nine full-scale tests were conducted by the authors to investigate the axial tension behavior of SC-to-RC non-contact lap splice connections. The connections were designed to develop the full strength of rebars in the RC basemat. The parameters considered included: (i) the rebar size, (ii) shear reinforcement ratio, (iii) rebar embedment length into the SC wall, and (iv) location with respect to the steel faceplate.
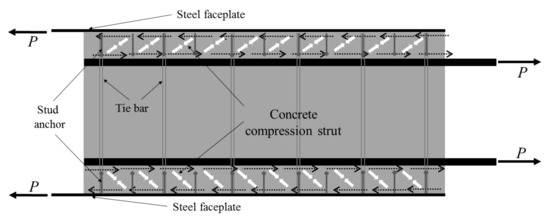
Figure 1.
Schematic view of force transfer mechanism from SC wall to RC wall with concrete compression struts [20].
Seo and Varma [20] extended the experimental investigations by conducting additional full-scale tests to investigate the axial tension behavior of SC-to-RC non-contact lap splice connections. The experimental investigation focused on the influence of three different tie designs on their behavior. Two layers of rebar were implemented in their specimens, which resulted in higher moments induced by the eccentricity of rebars with respect to the faceplate of the SC wall portion. The two layers of rebar represented the reinforcement design and layout in realistic designs. The authors developed design recommendations for the SC-to-RC non-contact lap splice connections subjected to axial tension based on the findings.
2.2. SC Wall-to-RC Basemat Full-Strength Connection
Eight quasi-static cyclic tests were conducted by Kurt et al. [7] and Epackachi et al. [22] to evaluate the lateral behavior and capacity of SC walls without boundary elements. The authors considered multiple test parameters, including (i) aspect ratio (wall height/wall length = h/lw), (ii) steel faceplate reinforcement ratio (total faceplate thickness/wall thickness = 2tp/Tsc), and (iii) overall wall thickness (Tsc). The authors reported no significant influence of the faceplate slenderness ratio on the lateral load-carrying capacity of SC walls in the range of slenderness ratios considered. It was also reported that the capacity of the SC walls is affected by the aspect ratio of the walls. That is, the capacity decreased with increasing aspect ratios. The contribution of the steel faceplates to the capacity increased as the reinforcement ratio of the wall decreased. The authors also reported that the SC wall specimens (designed with full-strength connection design philosophy) did not develop their flexural plastic strength. This was attributed to the lack of boundary elements in SC walls which would typically carry the flexural stresses. Without the boundary elements, the web portion of SC walls had to carry both flexural and shear stresses, which reduced the in-plane strength of the walls to the flexural yield strength, which is slightly lower than the flexural plastic strength. The authors also provided equations for estimating the flexural yield strength, which is governed by the occurrence of yielding in compression and extensive yielding in tension.
The eight test specimens were designed based on the full-strength connection design philosophy to transfer the flexural plastic strength of the SC walls. Figure 2 shows typical details for these full-strength connection specimens. As illustrated, force transfer between the wall and the foundation was achieved using structural connectors such as welds, headed stud anchors, couplers, and reinforcement bars. The stud anchors welded on top of the baseplate transferred shear force/stresses from the concrete infill to the baseplate. Rebar couplers were welded to the bottom surface of the baseplates, and the reinforcement bar anchors were attached (threaded) to these couplers. These rebar anchors facilitate the shear force transfer from the SC wall to the concrete basemat.
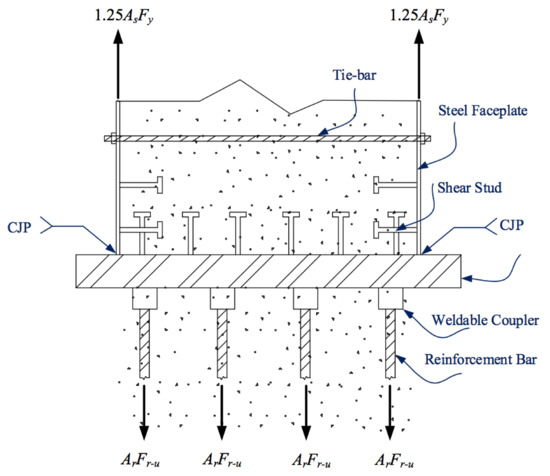
Figure 2.
Typical full-strength connection detailing between the SC wall and the concrete basemat [7].
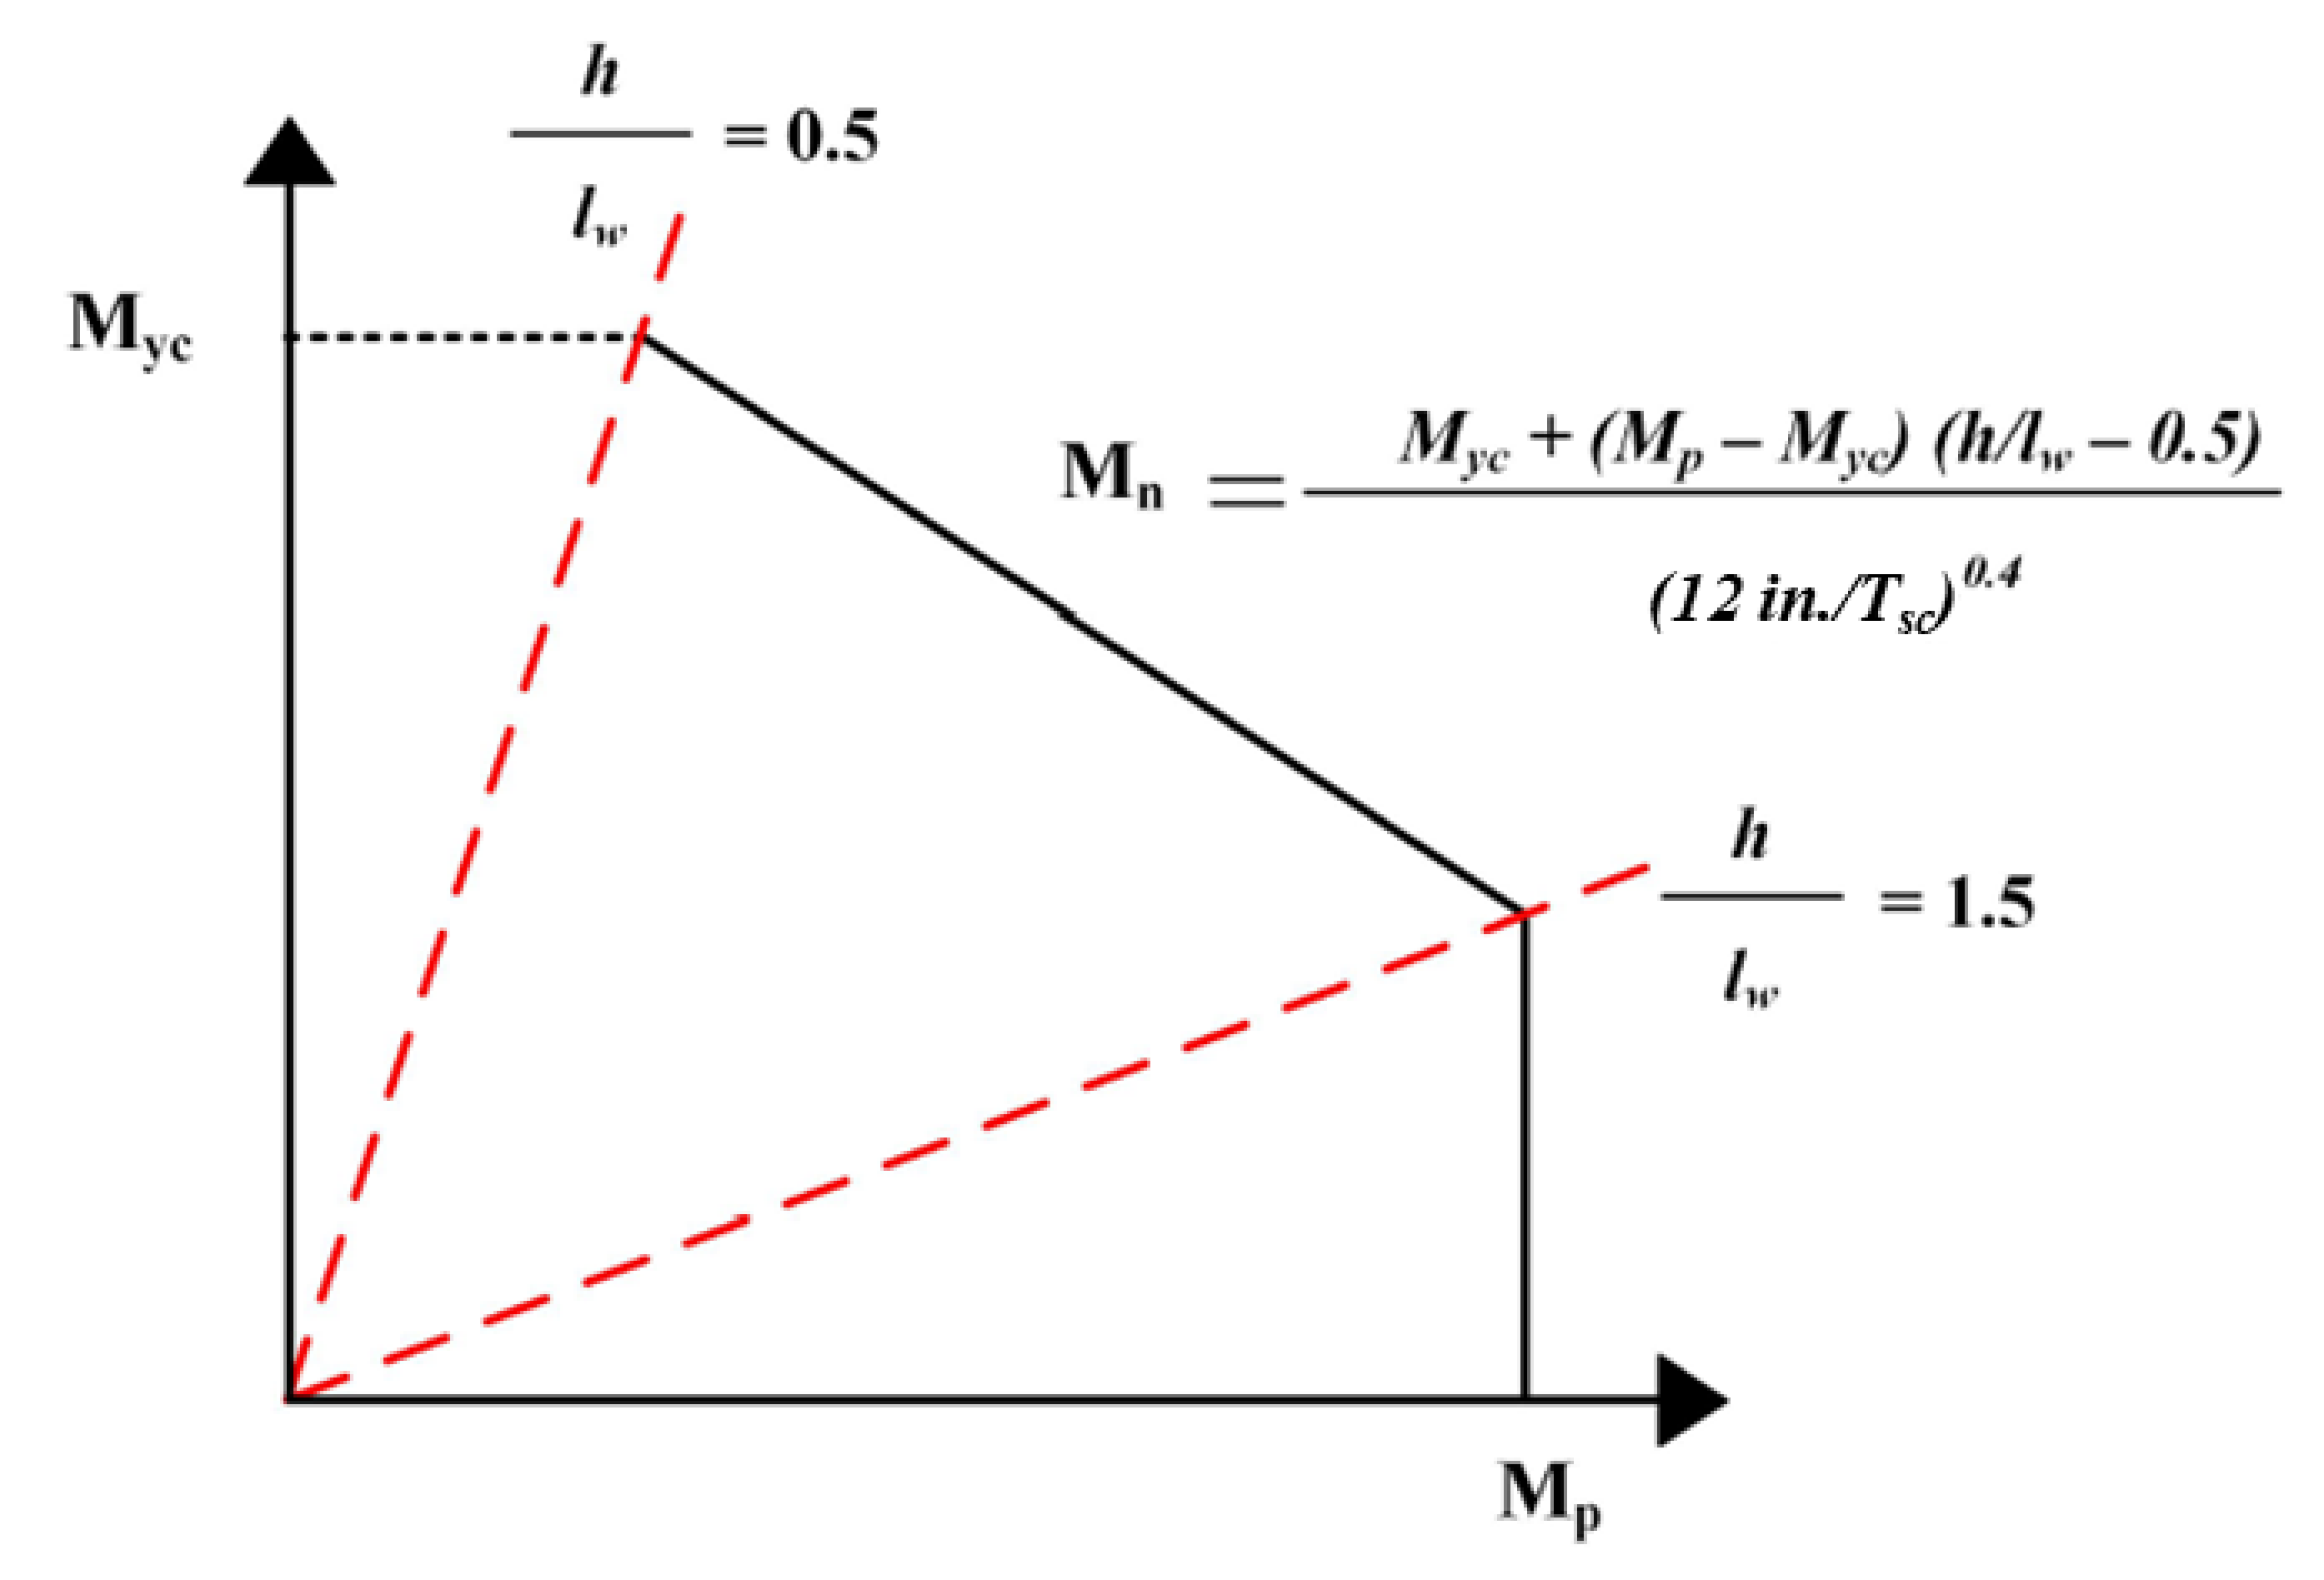
Kurt et al. [7] conducted additional analytical parametric studies to expand the knowledge base on full-strength SC wall-to-RC basemat connections with different geometric and material properties. The parametric studies focused on the lateral load-carrying capacity of SC walls and the influence of the relative tensile strength ratio of the steel faceplates and rebar anchors. The authors proposed design equations for the in-plane flexural capacity (Mn) of SC walls based on findings from both the experimental and analytical studies. Mn in the proposed equation is mainly controlled by aspect ratio (h/lw). As shown in Figure 3, for SC walls with h/lw less than 0.5, the moment capacity is anchored to the moment corresponding to the initiation of compression yielding of the faceplates (Myc). For SC walls with h/lw greater than 1.5, the capacity is limited to the plastic moment of the section, Mp. Linear interpolation is permitted for intermediate aspect ratios (0.5 ≤ h/lw ≤ 1.5). These design flexural capacity equations were further validated by Bhardwaj et al. [23,24].
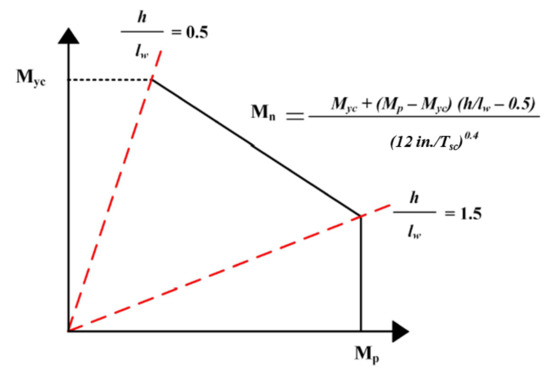
Figure 3.
Interaction curve for the lateral load capacity of SC walls [7].
3. Experimental Program
The eight SC wall specimens tested by Epackachi et al. [22] and Kurt et al. [7] represent SC wall-to-RC basemat connections designed based on the full-strength connection design philosophy. The full-strength connection design philosophy ensures that the connection is stronger than the connected structural elements. It has been validated experimentally and analytically by the authors. The lateral behavior of the eight specimens was in-plane flexural controlled and the inelastic behavior was observed in the specimens away from the connection region. The specimens failed after reaching their design in-plane flexural strengths.
The overstrength connection design philosophy requires the connection to be designed for 200% of the seismic demands plus 100% of the non-seismic demands calculated from elastic finite element analyses of the SC wall structure for loads and load combinations. Overstrength connections are expected to fail prior to the failure of connected structural elements; therefore, the lateral behavior and capacity of overstrength connections need to be evaluated for the simultaneous actions of amplified design demands calculated from FE analysis of load combinations. In this study, two SC wall specimens (SCRC1 and SCRC2) were considered and they were designed based on the over-strength connection design philosophy.
3.1. Specimen Design and Expected Behavior
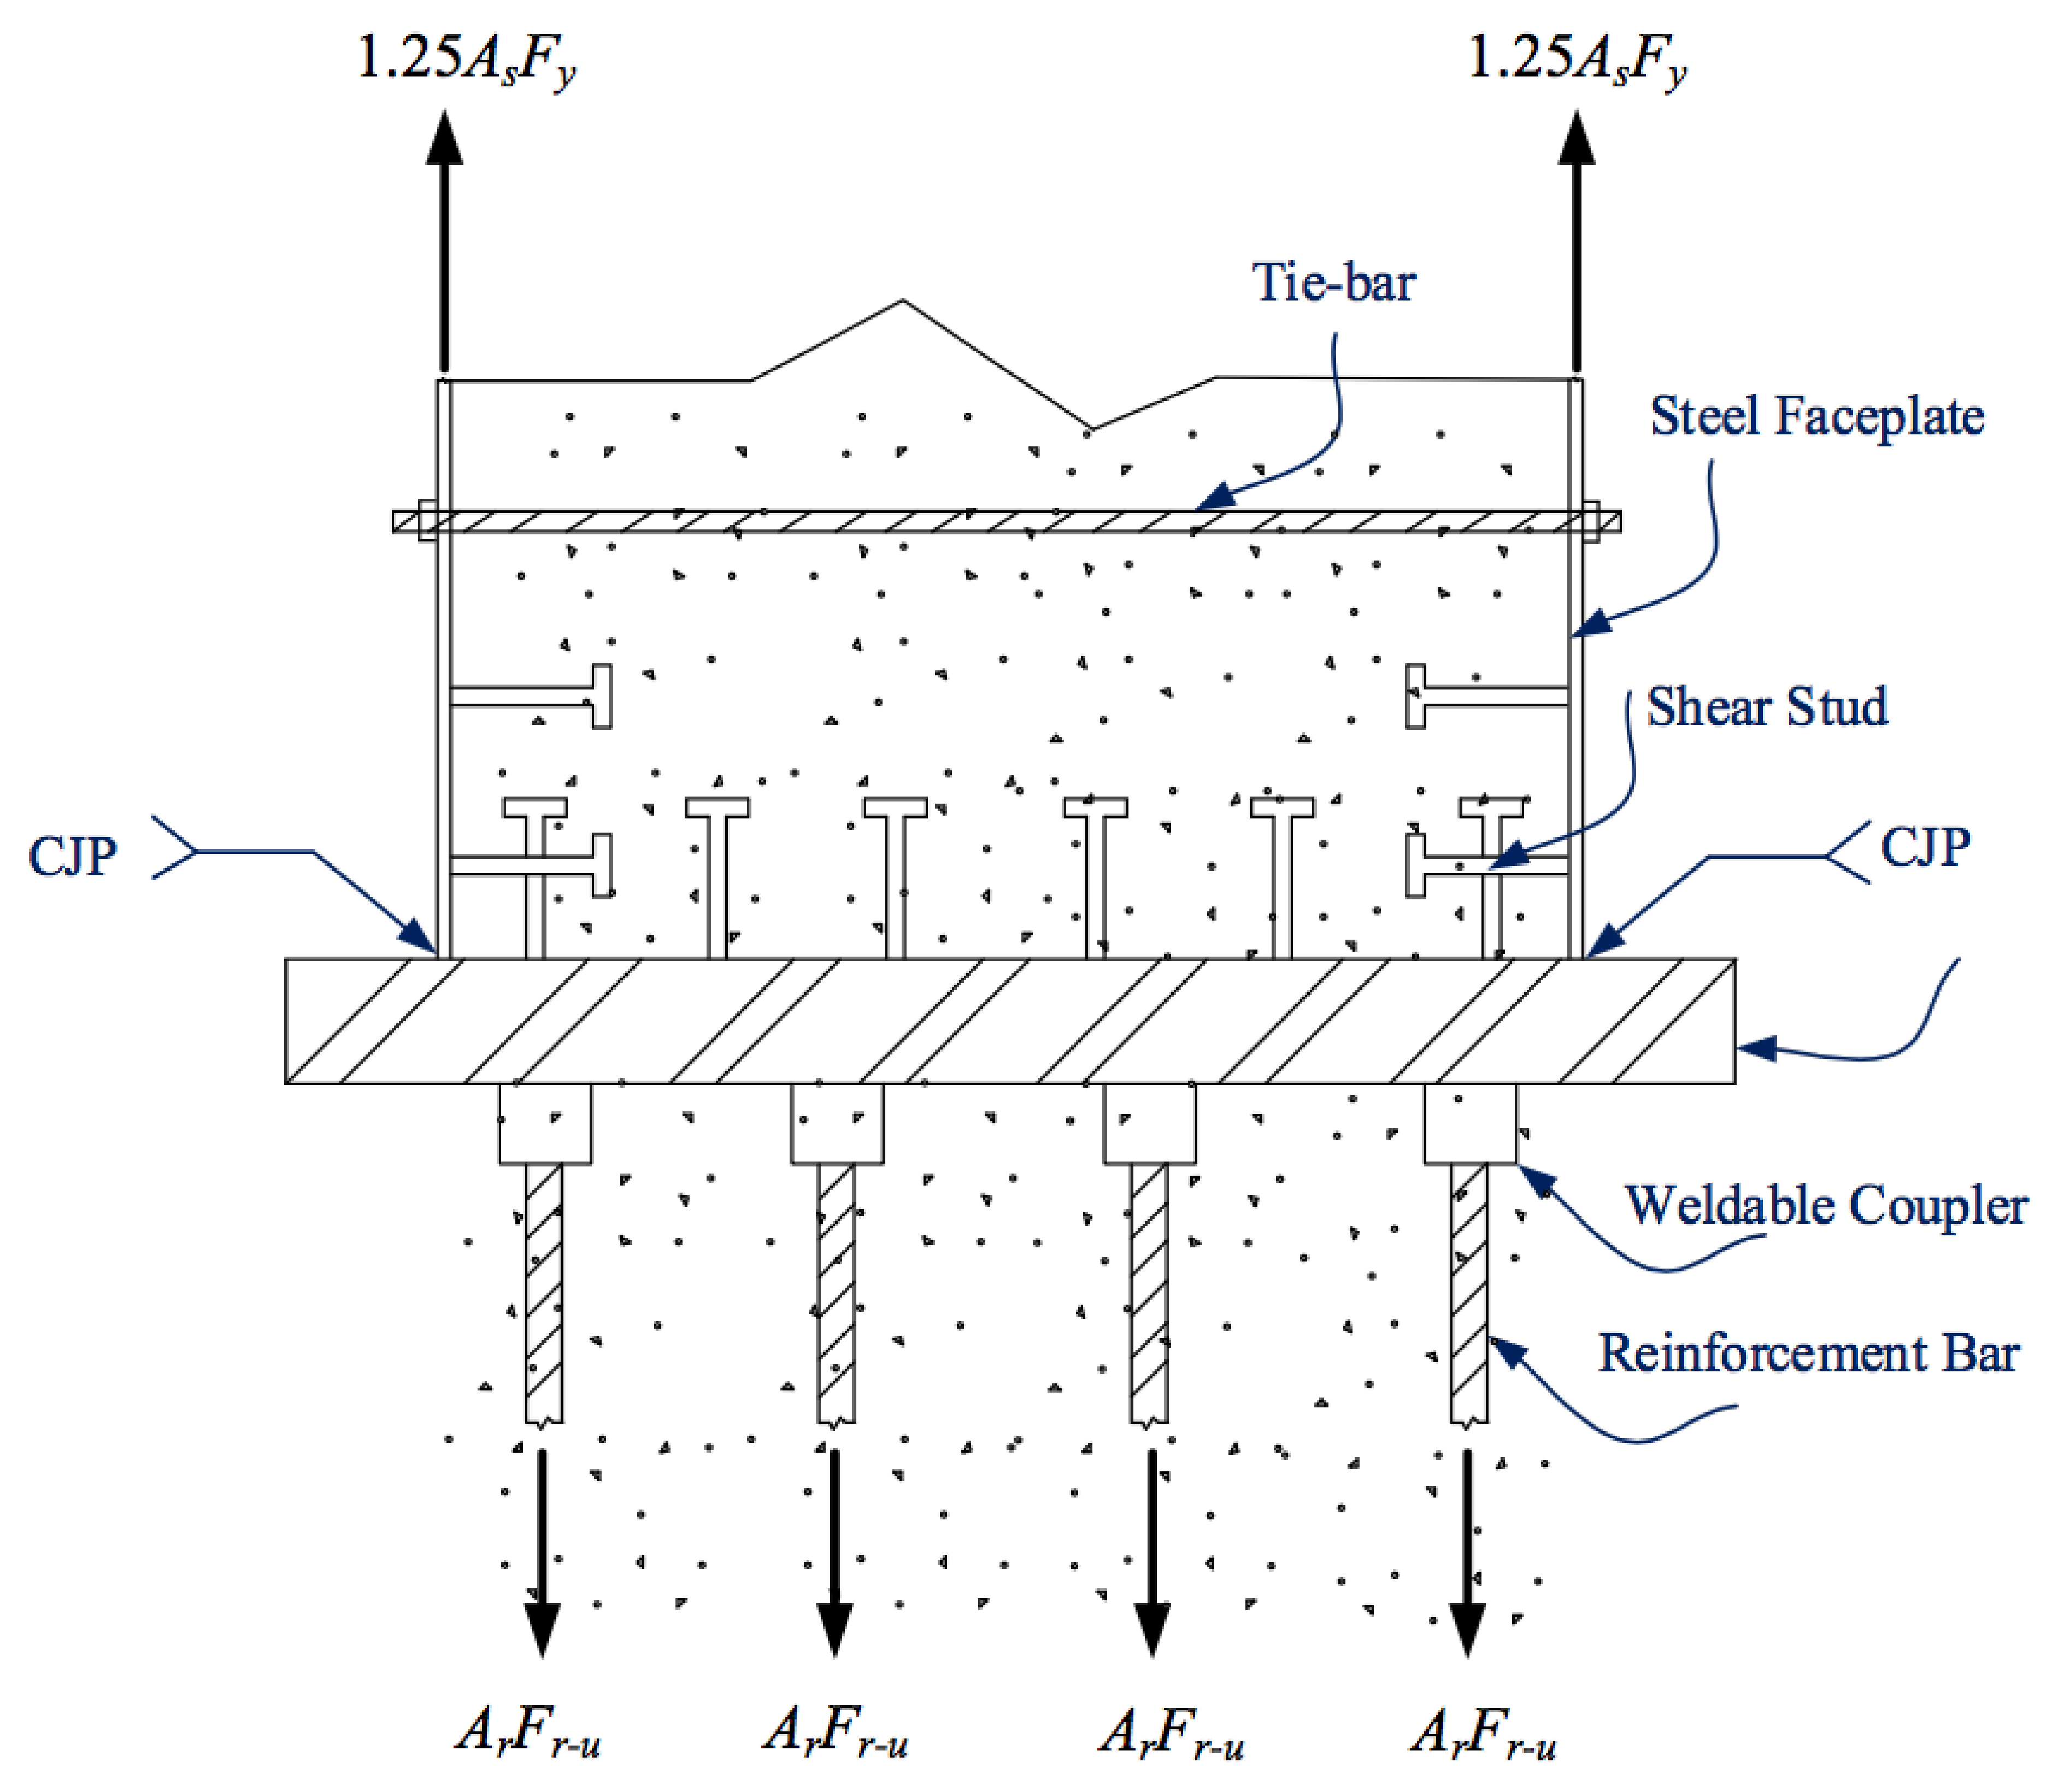
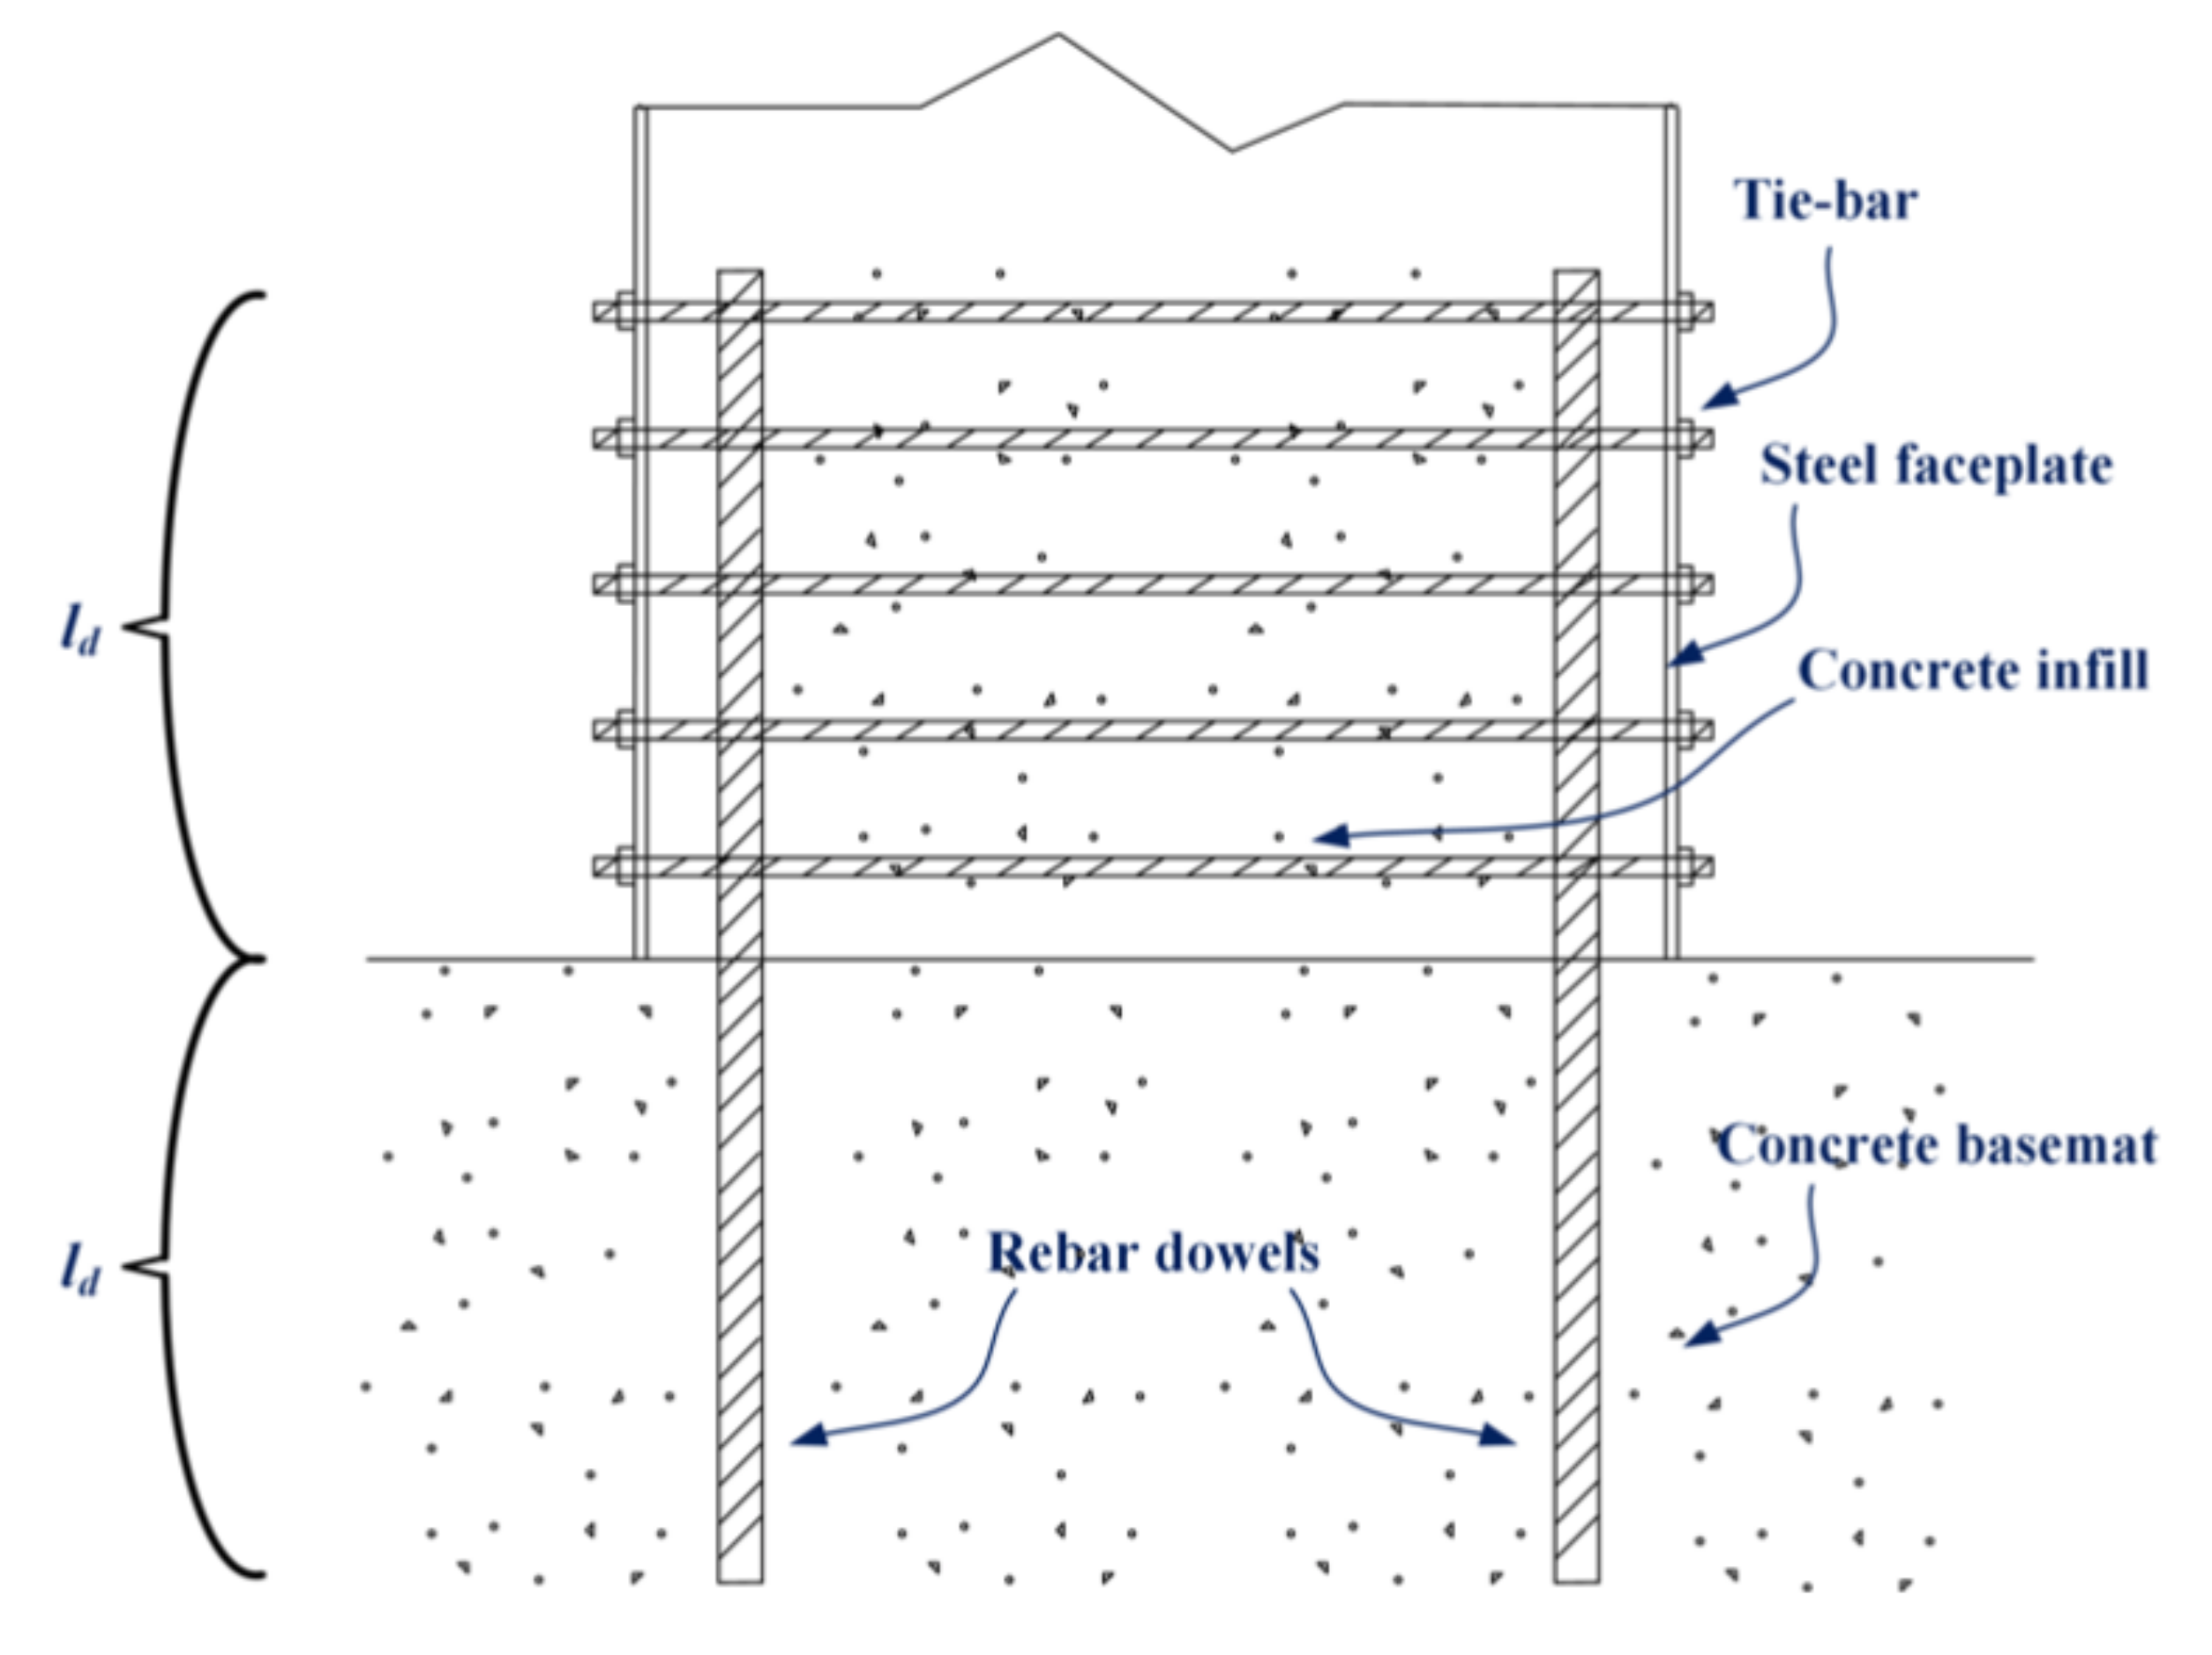
Figure 4 illustrates the details of the SC wall-to-RC basemat overstrength connection considered in this study. As illustrated, the connection does not include a baseplate, which was an important component of the full-strength connection detail (see Figure 2). The baseplate was replaced with the longitudinal rebars that were embedded in the RC basemat. The rebars were extended and lap spliced to the steel faceplate in the SC wall portion. The embedded rebar length was equal to the development length of the rebars (ld) per ACI 318-14 [25]. This condition results in the connection region being an equivalent RC wall since the forces on the faceplates of the over-strength connection were initially transferred to the rebars from the steel faceplates. This is followed by the transfer of the forces from the rebars to the concrete basemat.
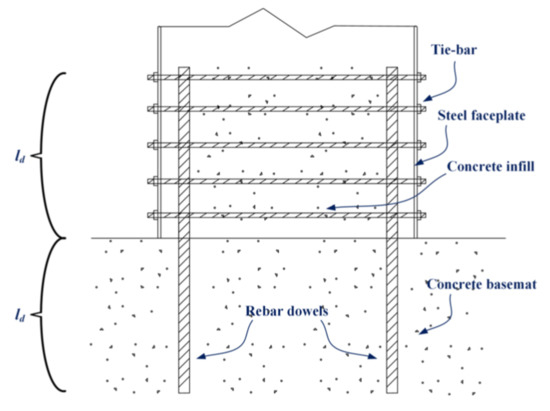
Figure 4.
Typical over-strength connection detailing between the SC wall and the concrete basemat.
The expected lateral capacity of the specimens was calculated using the properties of the equivalent RC wall. That is, the expected lateral capacity of the specimens was calculated using cross-section moment–curvature analysis for the equivalent RC wall, excluding steel faceplates. The in-plane flexural capacity for the equivalent RC wall (MnRC) was divided by the lateral loading height of the wall (h) to obtain the corresponding in-plane shear capacity (VnMnRC). In addition, two additional capacities associated with potential failure modes of the connection region were calculated, and they are (i) the upper limit () of the in-plane shear capacity of RC shear walls specified in ACI 318M-14 [25] and ACI349M-13 [26] and (ii) shear friction capacity at the interface between the connection region and the concrete basemat. ACI 318M-14 [25] recommends using for the shear-friction force, where is the total steel area of the reinforcement bars, and is the nominal yield stress of the reinforcement bars, and μ is the coefficient of friction. There are different recommendations for the coefficient of friction, μ, in Table 22.9.4.2 of ACI 318M-14 [25]. The coefficient of friction is 0.6 for nonroughened surfaces and 1.0 for intentionally roughened surfaces. The cold joint surfaces on the concrete foundations were intentionally roughened using impact hammers for the individual specimens; thus, μ was taken as 1.0 in the specimen design calculations. The maximum transferred shear force between two concrete surfaces is limited to the lesser of ,, and per Section 16.5.2.4 of ACI 318-14 [25], where Ac is the area of concrete resisting shear transfer.
3.2. Test Specimens
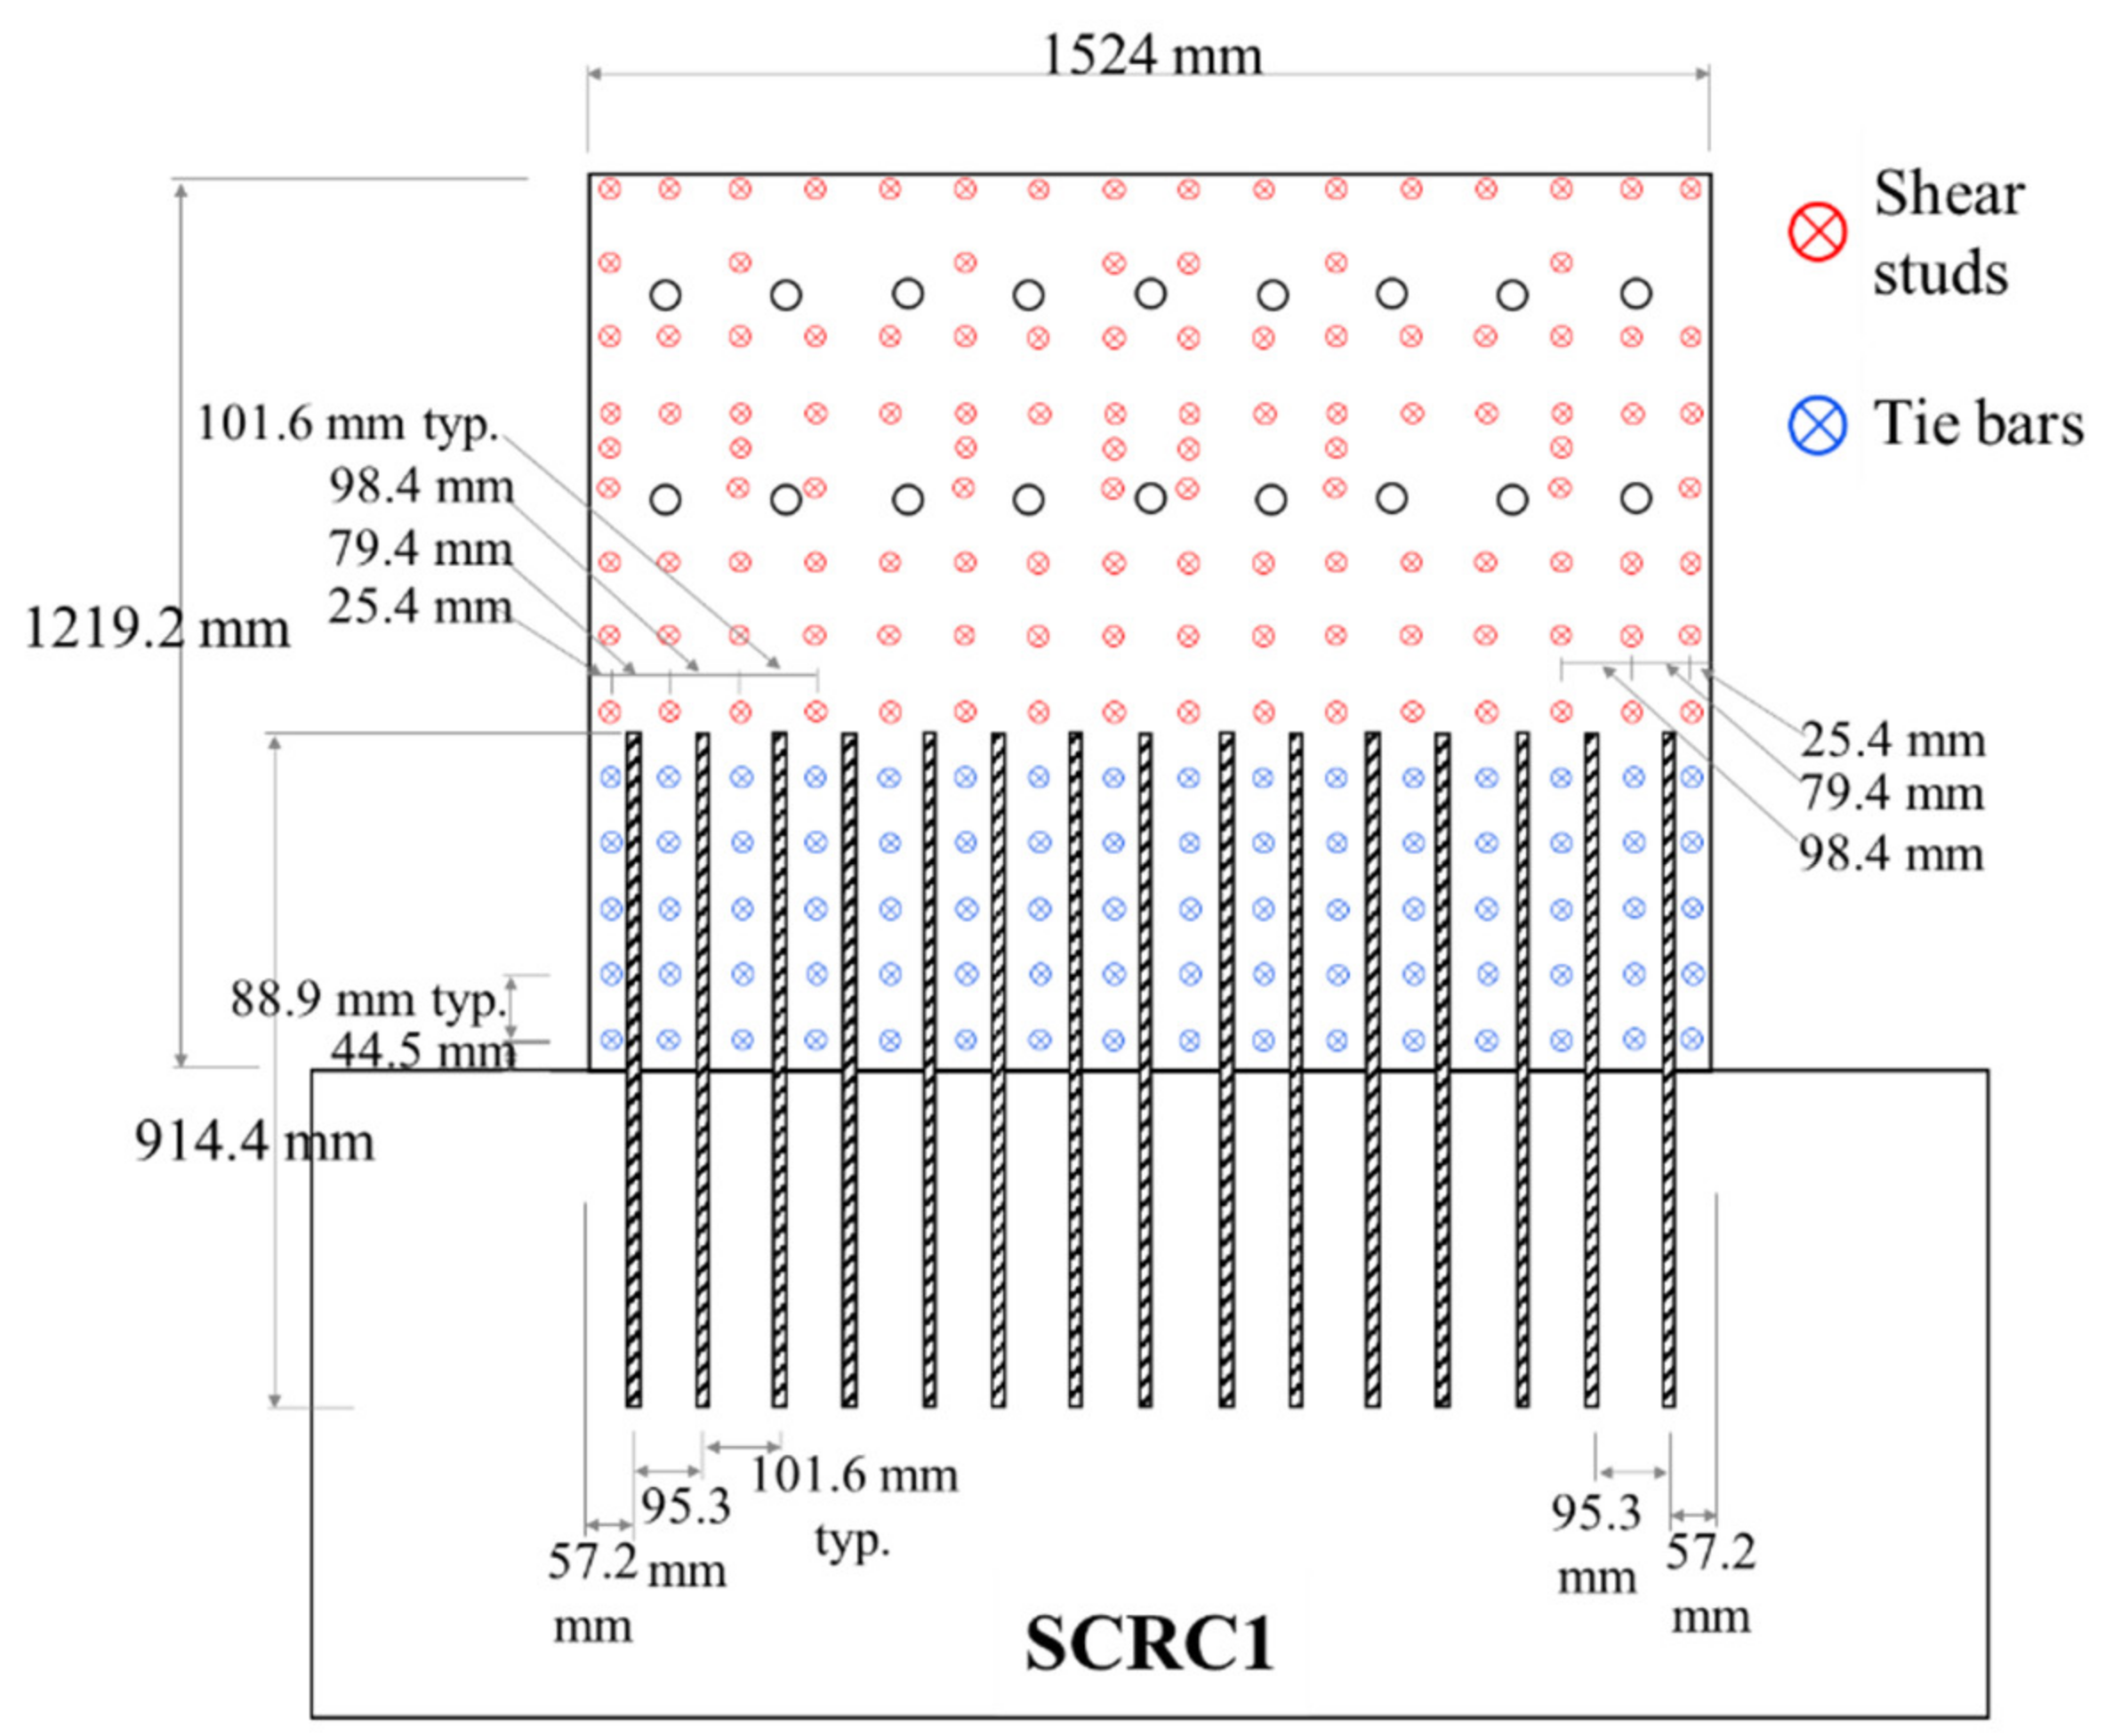
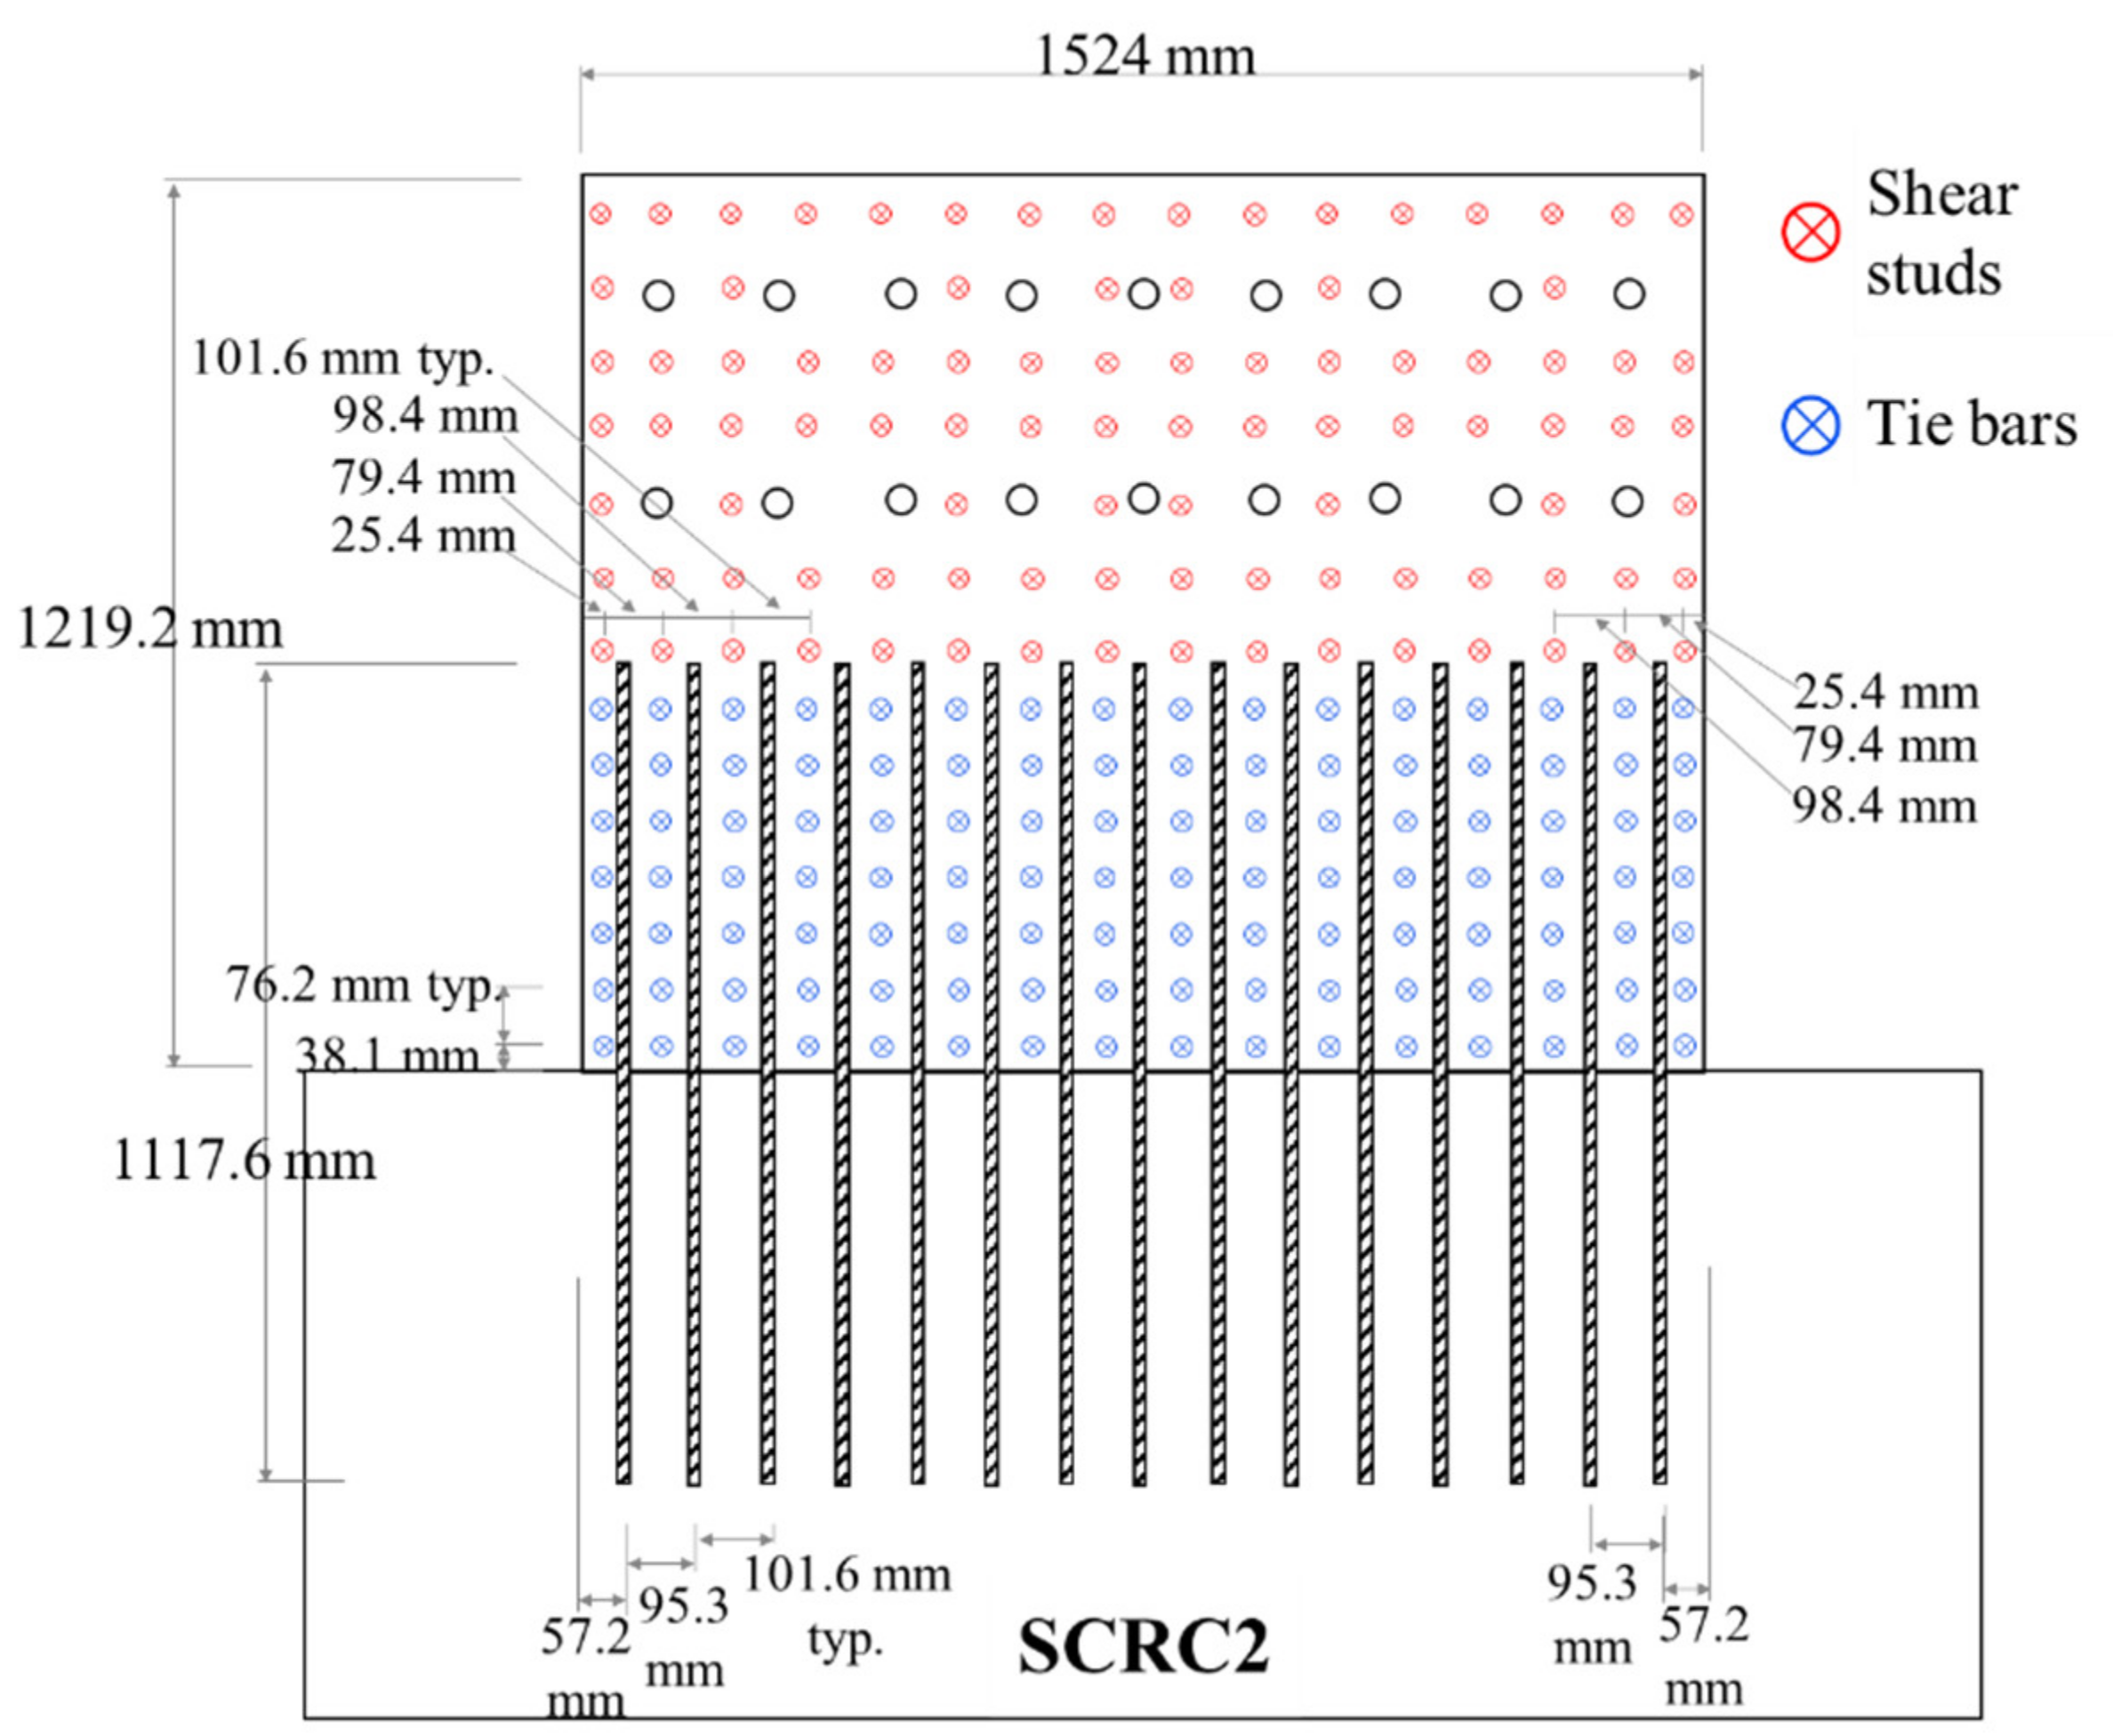
Figure 5 and Figure 6 show geometric properties of the headed steel anchors and tie bars on the faceplates for Specimens SCRC1 and SCRC2. As shown, both specimens were 1524 mm (60 in.) long and 1219 mm (48 in.) high resulting in an aspect ratio (h/lw) of 0.6. Specimen SCRC1 had #5 rebars at every 101.6 mm (4 in.). The embedment length of the #5 rebars into the SC wall as well as the RC basemat was 457.2 mm (18 in.), which was calculated based on Section 18.10.2.3 of ACI 318M-14 [25] while applying a factor of 1.25 for strain hardening. Specimen SCRC2 had #6 rebars at every 101.6 mm (4 in.). The embedment length of the #6 rebars in the SC wall and RC basemat was 558.8 mm (22 in.), calculated as discussed for #5 rebars. The two test specimens had 9.5 mm (3/8 in.) diameter tie bars placed around the rebars at the bottom. The vertical spacing of the tie bars was 88.9 mm (3.5 in.) for Specimen SCRC1 and 76.2 mm (3 in.) for Specimen SCRC2, respectively. The longitudinal tie bar spacing for both specimens was 98.4 mm (3 − 7/8 in.) Specimen SCRC2 required more tie-bars than Specimen SCRC1 due to the larger rebar size. In addition, steel-headed stud anchors (9.5 mm) were provided for both specimens at every 101.6 mm (4 in.). Both the tie bars and headed stud anchors were provided to prevent local buckling of the steel faceplates subjected to compressive stress. The tie bar and headed stud anchor layout were determined based on Zhang et al. [3] and AISC N690-18 [19].
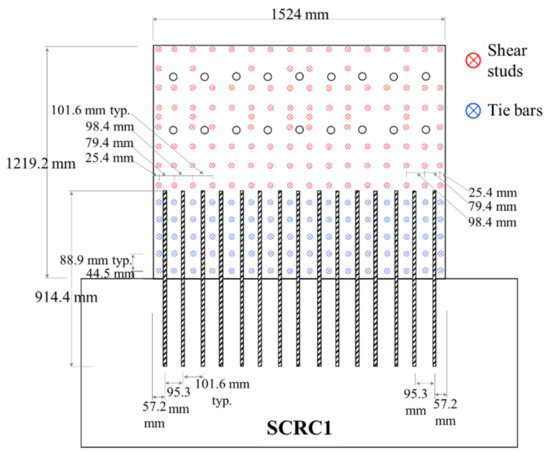
Figure 5.
Geometric properties of Specimen SCRC1.
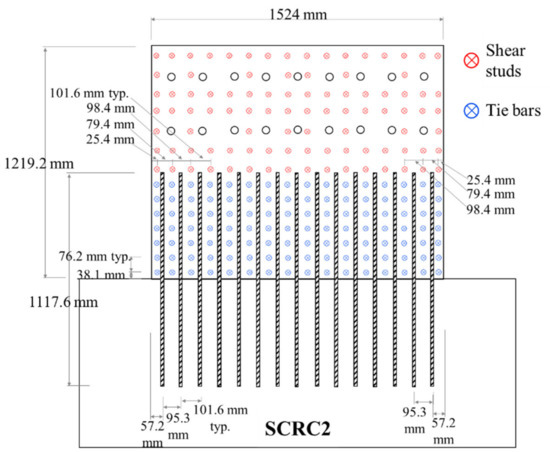
Figure 6.
Geometric properties of Specimen SCRC2.
3.3. Material Properties
Tension coupon tests were conducted according to ASTM E8 [27] to measure the material properties of the rebars, steel faceplates, and tie bars. The measured yield strengths for #5 and #6 reinforcement bars were 517.1 and 524.0 MPa (75 and 76 ksi), respectively. The measured yield strength of the faceplates was 358.5 MPa (52 ksi). The ultimate strength for the tie bars was measured as 627.4 MPa (91 ksi). Concrete uniaxial compressive strengths for the specimens were measured on the day of the tests per ASTM C39 [28], and the average values for SCRC1 and SCRC2 were 41.4 MPa (6000 psi) and 40.7 MPa (5900 psi), respectively.
3.4. Test Setup and Loading Protocol
Figure 7 shows the over-strength connection specimens within the test setup. As shown, the specimens were free-standing shear walls that were anchored to the laboratory’s strong floor through the concrete basemat. The specimens were connected to two 4450 kN hydraulic actuators using loading beams. The loading beams were secured by tightening the high-strength threaded rods using high-strength hex nuts and tension indicating washers. The actuators were connected to steel sections post-tensioned to the laboratory’s strong wall.
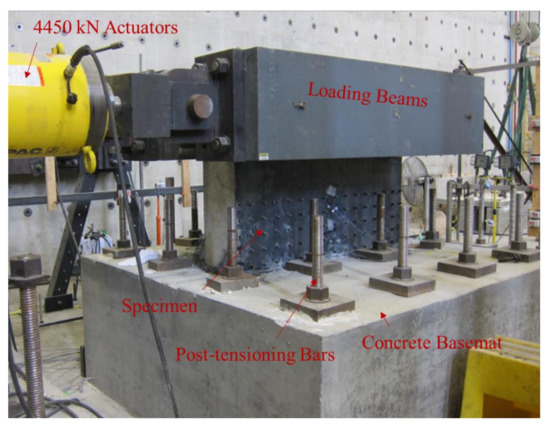
Figure 7.
Test setup.
The over-strength connection test specimens were subjected to cyclic lateral loading history similar to but not identical to the ATC-24 [29] guidelines for cyclic testing of components of steel structures. The cyclic loading history consisted of elastic and inelastic cycles, as illustrated in Figure 8. The two elastic cycles were conducted under load control at lateral load levels of 0.25 Vn, 0.50 Vn, and 0.75 Vn, where Vn is the in-plane shear capacity (VnMnRC) corresponding to the lateral flexural capacity for the equivalent RC wall (MnRC) of the SC wall specimens from sectional analyses. Additional inelastic cycles at lateral displacement levels of 1.0 Δy, 1.5 Δy, 2.0 Δy, 3.0 Δy, and 5.0 Δy were applied. Δy is the estimated yield displacement by taking the displacement at the first 0.75 Vn divided by Ksec, which is the secant flexural stiffness.
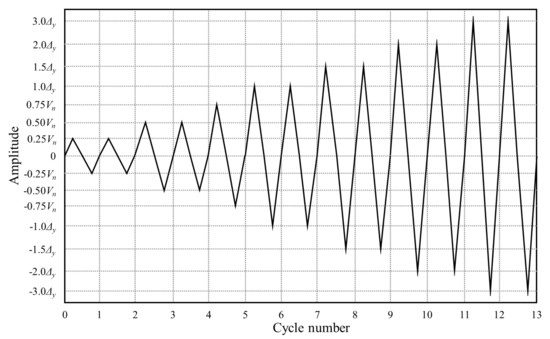
Figure 8.
Loading protocol.
3.5. Instrumentation
The instrumentation surrounding the specimens was intended to record the horizontal and vertical displacements of the wall specimens and the concrete foundation, and their relative displacements to each other. Strain gages were installed on rebar dowels and steel faceplates to measure the longitudinal and shear strains along the height. The strain gage locations on the rebar dowels were ground smooth with minimal loss of cross-section, after which the gages were installed, waterproofed, and sealed.
4. Test Results
4.1. Specimen SCRC1
Figure 9 shows the experimentally measured lateral load–displacement response of Specimen SCRC1. The figure also shows the response in terms of drift ratio and . Drift ratio was calculated as the ratio of the measured displacement to the height of the specimen (h). Initial flexural cracking of the concrete infill occurred at approximately 800 kN (180 kips) at the location of rebars on the tension side. The outermost rebars started yielding at a drift ratio of 0.5%. The overall yielding of the specimen started at a drift ratio of around 0.8%. The maximum lateral load (in-plane shear) capacity (Vntest+) of the specimen was 2179.6 kN (490 kips = 0.74) at a drift ratio of 1.3% in the first quadrant. This lateral load corresponds to 98% of the calculated flexural capacity from the sectional analysis of the reinforced concrete cross-section (MnRC). The maximum lateral load capacity measured in the third quadrant (Vntest−) was 1935.9 kN (435 kips = 0.66).
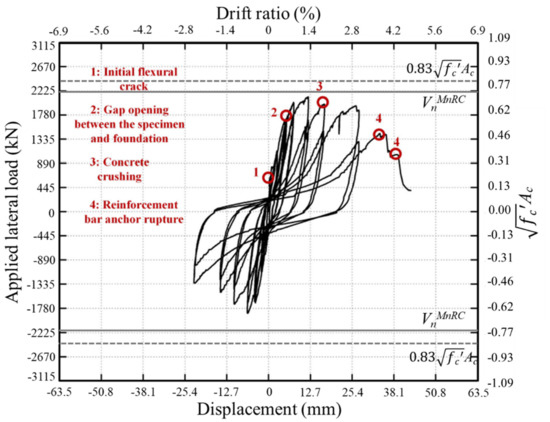
Figure 9.
Experimentally measured lateral load–displacement response of Specimen SCRC1.
Crushing of concrete under compression was observed at a 1.8% drift ratio. The lateral load capacity degraded smoothly up to a drift ratio of 2.9%. The corresponding lateral load-carrying capacity was 88% of Vntest+. The outermost rebars failed by rupturing in tension. The drift ratio corresponding to failure was 3.8%. After their failure, the load-carrying capacity of the specimen decreased rapidly. Initial stiffness, Kinitest, of the specimen was measured to be 893.1 kN/mm (5100 kip/in.). Secant stiffness of the specimen, Ksectest, was calculated as the ratio of 0.75 Vntest+ to the displacement at that load level. Measured secant stiffness, Ksectest, was 315.2 kN/mm (1800 kip/in.).
4.2. Specimen SCRC2
The lateral load–displacement response of SCRC2 is presented in Figure 10. The figure also presents the drift ratio and load in terms of . The concrete infill cracked on the tension side at 800.0 kN (180 kips). The yielding of the outermost rebars initiated at a 0.7% drift ratio. The maximum lateral load (in-plane shear) capacity (Vntest+) of the specimen was 2713.4 kN (610 kips = 0.91), corresponding to a drift ratio of 1.7% in the first quadrant. The specimen maintained 90% of its in-plane load capacity up to a drift ratio of 2.7%. The lateral load capacity of the specimen was equal to 92% of the calculated RC wall moment capacity from sectional analysis (MnRC). This ratio was marginally lower than that observed for Specimen SCRC1. Initial stiffness, Kinitest, of the specimen was measured to be 718.0 kN/mm (4100 kip/in.). Secant stiffness of the specimen, Ksectest, was 332.7 kN/mm (1900 kip/in.).
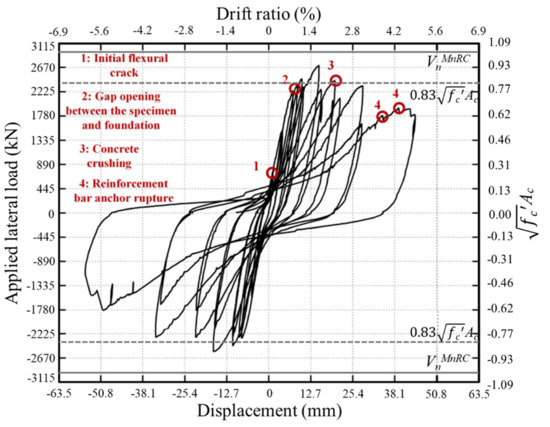
Figure 10.
Experimentally measured lateral load–displacement response of Specimen SCRC2.
Figure 11 shows the damage states observed during the testing of Specimen SCRC2. The observed damage states for SCRC1 were similar to those observed for Specimen SCRC2. Figure 11b shows the initial flexural cracking of the specimen. An increase in the tensile strains of the rebar during inelastic cycles caused a gap to open between the wall and concrete foundation. Figure 11c shows the gap opening between the SC wall specimen and the foundation at Vntest. The concrete infill crushed and bulged out on the compression side of the wall with an increase in displacement. Figure 11d shows the crushed and bulged-out concrete on the compression toe of the wall at a drift ratio of 1.5%. Figure 11e shows the final stage of Specimen SCRC2. The steel faceplates of the specimen were removed to observe the damage on the concrete infill after the testing was over. Figure 11f shows the specimen with the faceplates removed up to half the height of the specimen. There were no significant diagonal tension cracks in the concrete infill. The damage in the concrete infill was localized and concentrated around the toes and the base of the wall by the crushing of concrete under flexural compression.
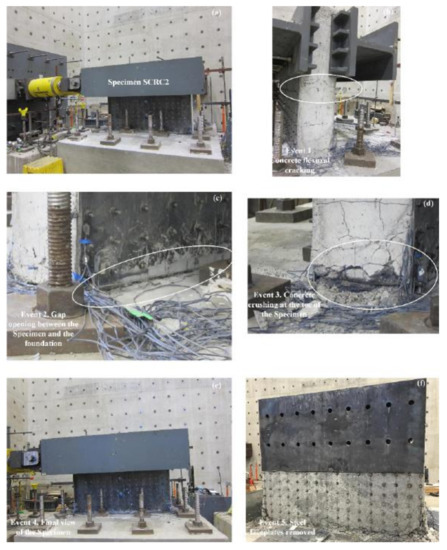
Figure 11.
Damage states observed during testing of Specimen SCRC2: (a) initial specimen without loading, (b) flexural cracking, (c) gap opening between the wall–concrete foundation, (d) crushing and spalling of concrete infill on the compression toe of the wall, (e) final stage of the specimen, and (f) view of the specimen with steel faceplates removed.
4.3. Comparison to Full-Strength Connection
The experimental results for Specimens SCRC1 and SCRC2 were compared with those for Specimen SC8, which was the specimen previously designed and tested with full-strength connection by the authors. Specimen SC8 had similar dimensions as Specimens SCRC1 and SCRC2. The dimensions were 914.4 (36 in.), 1524 mm (60 in.), and 304.8 mm (12 in.) in height, length, and thickness, respectively. The thickness of the faceplates was 4.76 mm (3/16 in.), resulting in a reinforcement ratio of approximately 3.1%. The faceplates of the control specimen were welded to the baseplate, as illustrated in Figure 2. The headed stud anchor spacing was 101.6 mm (4 in.), resulting in a slenderness ratio (s/tp) of 21. The headed stud anchors were replaced with tie bars at every 304.8 mm (12 in.). The yield strength of the faceplates was 393 MPa (57 ksi), and the compressive strength of the infill concrete was 40.0 MPa (5800 psi) on the day of the test. Additional details of the test setup and connection are provided elsewhere [7].
Specimen SC8 underwent concrete flexural cracking, which was followed by yielding of the steel faceplates on both faces with an increase in lateral loading. The faceplates between the first row of headed stud anchors and the steel baseplate underwent local buckling at the compression toe of the wall with an additional increase in lateral loading. As the loading direction changed, buckling alternated to opposite ends of the wall due to compression. Concrete crushing and spalling were observed as the lateral deformations increased. The specimen failed with ductile fracture of the steel faceplates at the interface between the base plate and the steel faceplates due to accumulated plastic strains.
Table 1 summarizes the results from testing Specimen SCRC1, SCRC3, and SC8. It includes the initial stiffness (Kinitest), secant stiffness (Ksectest), maximum lateral load (in-plane shear) capacity (Vntest), and drift ratio at failure. Kinitest and Ksectest of the control specimen (Specimen SC8) were 910.7 kN/mm (5200 kip/in.) and 683.0 kN/mm (3900 kip/in.), respectively. Vntest of the control specimen (SC8) was 3113.8 kN (700 kips) and the specimen failed at a drift ratio of 1.2% by the fracture. Figure 12 shows the experimental measured envelop curve of Specimen SC8. The figure compares this curve with envelop curves of Specimens SCRC1 and SCRC2. As shown, Specimen SC8 exhibited higher Vntest than Specimens SCRC1 and SCRC2 by 50% and 15%, respectively. Specimen SC8 failed by fracture of the steel faceplates in the tension zone at a drift ratio of 1.3%, while Specimens SCRC1 and SCRC2 failed by the fracture of the rebars at the drift ratio of 3.8% and 4.3%, respectively.

Table 1.
Summary of the experimental results for Specimens SCRC1, SCRC2, and SC8.
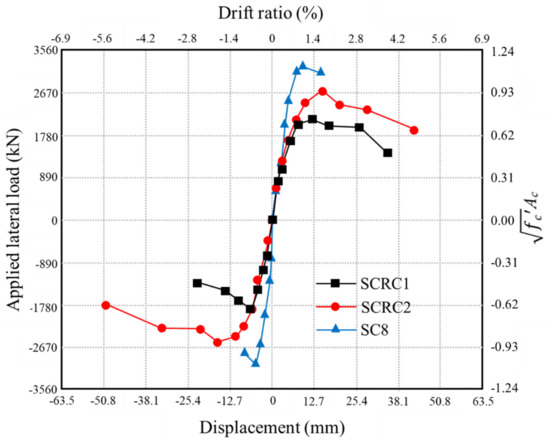
Figure 12.
Comparison of experimental envelop curves measured from Specimens SCRC1, SCRC, and SC8.
5. Finite Element Models and Analyses
5.1. Details of the Finite Element Models
Detailed three-dimensional (3D) finite element (FE) models for Specimens SCRC1 and SCRC2 were developed. The models were used to further evaluate the in-plane behavior and capacity of SC wall-to-RC basemat connections designed with over-strength connection design philosophy. The FE models were benchmarked using results from the experimental investigation. Figure 13 shows the FE models for Specimens SCRC1 and SCRC2. The concrete infill was modeled using eight-node solid elements with reduced integration and the MAT_159 concrete material model. This is a damage-plasticity model where the damage is controlled by the plastic strain of the individual elements. The solid elements for the concrete infill were 25.4 mm × 25.4 mm × 25.4 mm (1 in. × 1 in. × 1 in.) and measured compressive strength of the concrete infill on the test day was used for the concrete models.

Figure 13.
Schematic views of the benchmarked models.
The steel faceplates were modeled using shell elements and each shell element was 25.4 mm × 25.4 mm (1 in.× 1 in.) with a thickness of 4.76 mm (3/16 in.). The Belytschko–Tsay formulation was used for the shell elements since it is robust and fast for this kind of application. Using reduced integrated elements requires introducing hourglass control and artificial stiffness to avoid the inaccurate deformations of the elements and inaccurate results. Stiffness-based hourglass formulation, type-5 in LS-Dyna, was introduced with a coefficient of 0.05. The ratio of the hourglass energy to the internal energy of the model was below 1%, which was the desirable outcome. The steel tie bars and headed stud anchors were modeled using beam elements with the default cross-sectional integration formula. The circular cross-section type was defined with the nominal diameters of the rebars used in the tests. The beam elements shared the same nodes with the faceplate shell elements and they were constrained (embedded) inside the concrete infill using the lagrange_in_solid definition.
Contacts between the steel faceplates, concrete infill, and the foundation were defined by the automatic_surface_to_surface contact definition. The coefficient of friction between the concrete infill and the concrete foundation was assumed to be 1.0, as recommended by ACI-318M-14 [25] for intentionally roughened surfaces. The contact interaction between the steel faceplate and the concrete infill was assumed to be hard contact in the normal direction. The FE models were loaded monotonically, and the application of the load was 914.4 mm (36 in.) above the foundation, so the aspect ratio of the FE models was the same as that of Specimens SCRC1 and SCRC2.
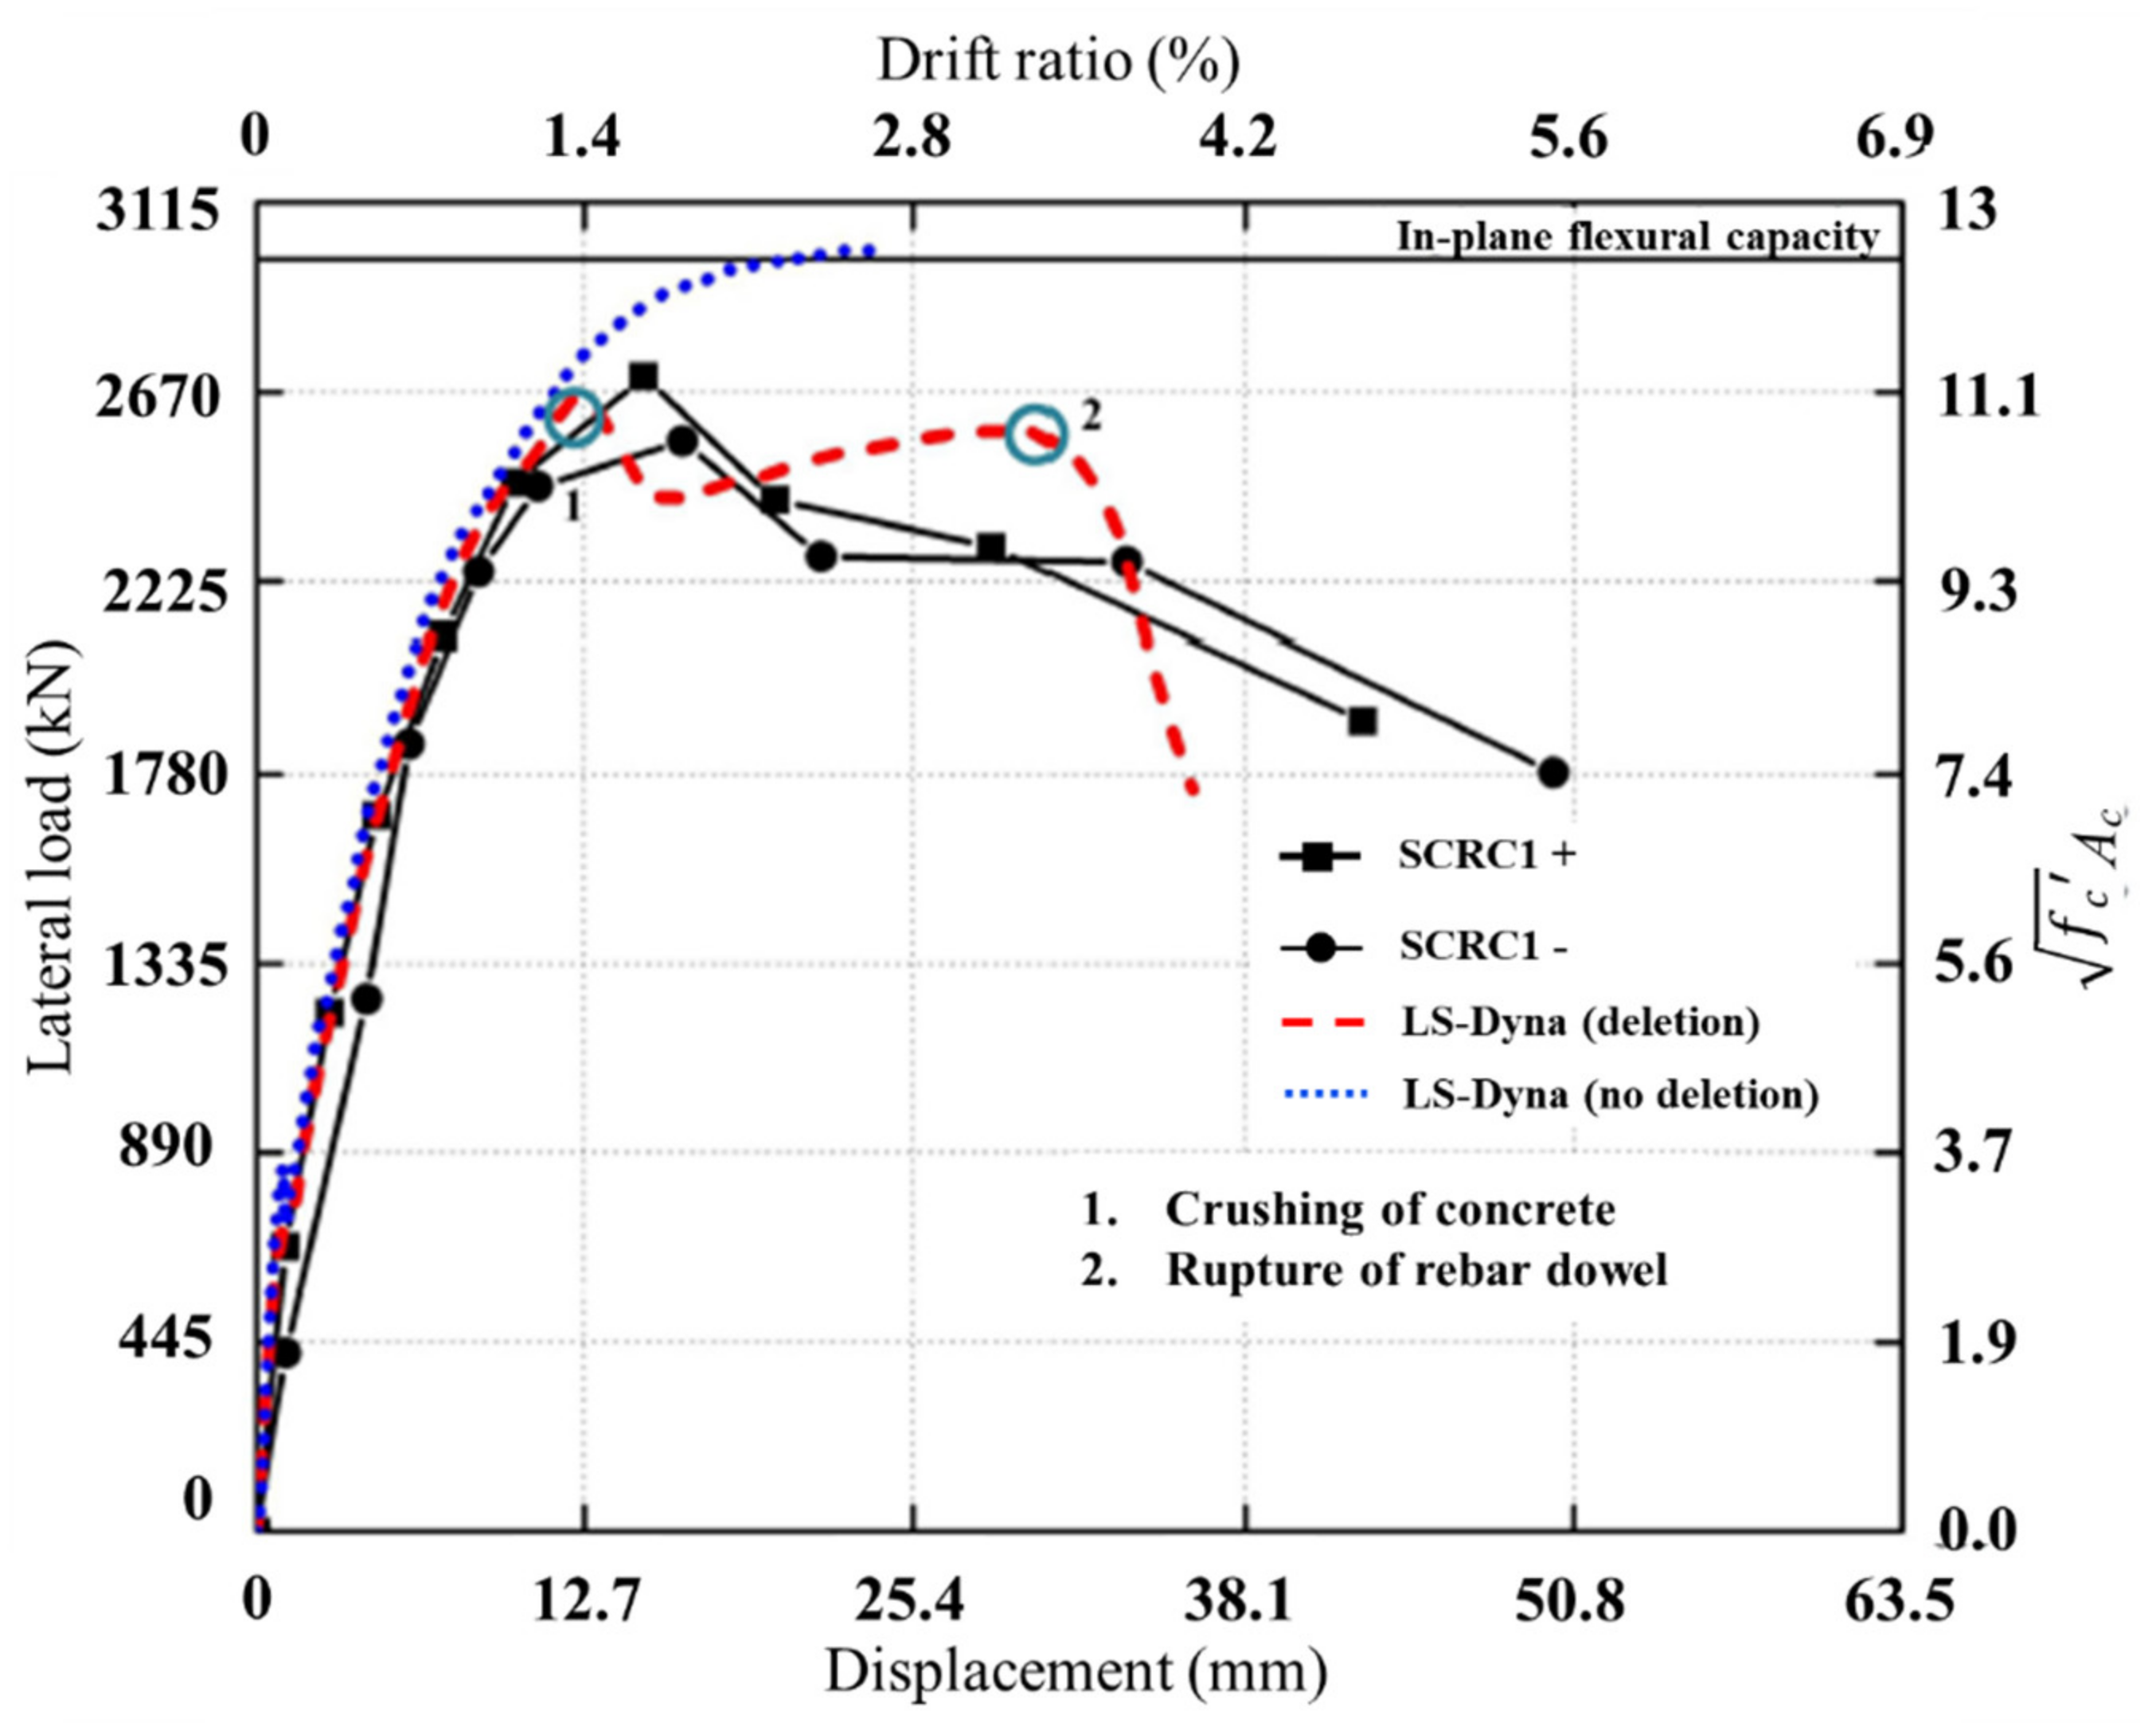
Figure 14 shows the comparison of experimentally measured envelops (in both first and third quadrants) of Specimen SCRC1 to the analytically predicted monotonic response curve from the benchmarked model. As shown, the experimentally measured initial stiffness (Kinitest) and secant stiffness (Ksectest) compared relatively well with the analytically predicted monotonic curve. The initial stiffness of the test specimen and the FE model were within 5%. The monotonically loaded FE model did not account for the deletion of the solid elements and hence reached the lateral load capacity calculated by the fiber analysis of the RC cross-section of the wall (VnMnRC). The lateral load capacity of the FE model (VnFEM) for SCRC1 was 2224.1 kN (500 kips).
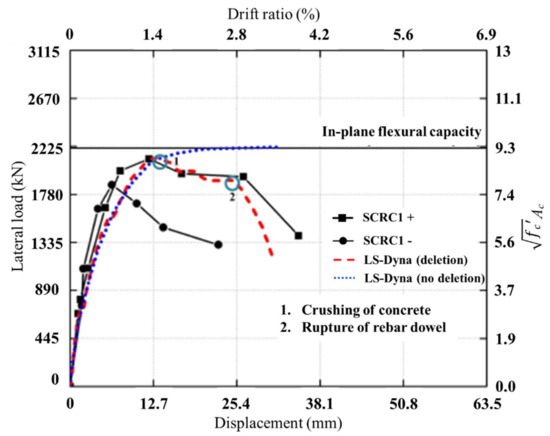
Figure 14.
Comparison of envelope curves for Specimen SCRC1 with benchmarked FE models.
Element deletion was introduced in the benchmarked model to capture the experimentally observed reductions in the lateral load capacity due to concrete crushing and rebar rupture. Concrete element deletion at a minimum principal strain of 0.05 was defined to include the effect of crushing the concrete infill at the toes of the specimen. In addition, a failure tensile strain of 0.50 for the rebars was defined to capture the rupture of the rebars at the later stages of the test. Although these strains are unrealistically high, they are used to adequately model the experimental behavior of the specimen. It is recommended to use these strain values to define the damage and degradation until there are better studies for damage models of SC walls without boundary elements. The two damage states, Event 1 (concrete crushing) and Event 2 (rebar rupture), as marked in Figure 14 using green circles, reduced the capacity of the models.
A similar comparison between the analytical model and Specimen SCRC2 is shown in Figure 15. As shown, experimentally measured Kinitest and Ksectest compare favorably well with the analytically predicted stiffnesses. The maximum lateral load predicted from the FE model (VnFEM) without element deletion was 2980.3 kN (670 kips), which corresponds to the lateral capacity of Specimen SCRC2 calculated from sectional analysis of the RC portion (VnMnRC). VnFEM with element deletion was 2669.0 kN (600 kips), which is about 10% less than VnMnRC. Once again, green circles highlight the occurrence of Events: (1) concrete crushing, and (2) rebar rupture.
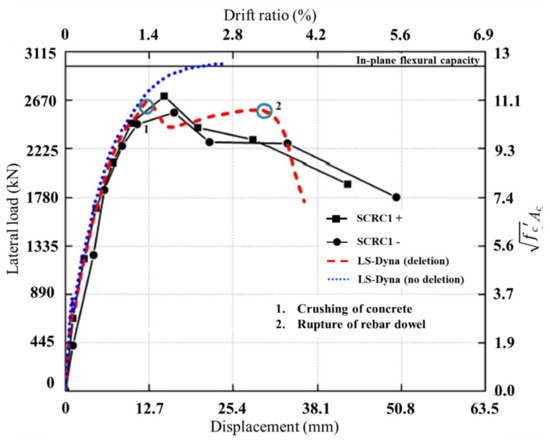
Figure 15.
Comparison of envelope curves for Specimen SCRC2 with benchmarked FE models.
5.2. Parametric Studies
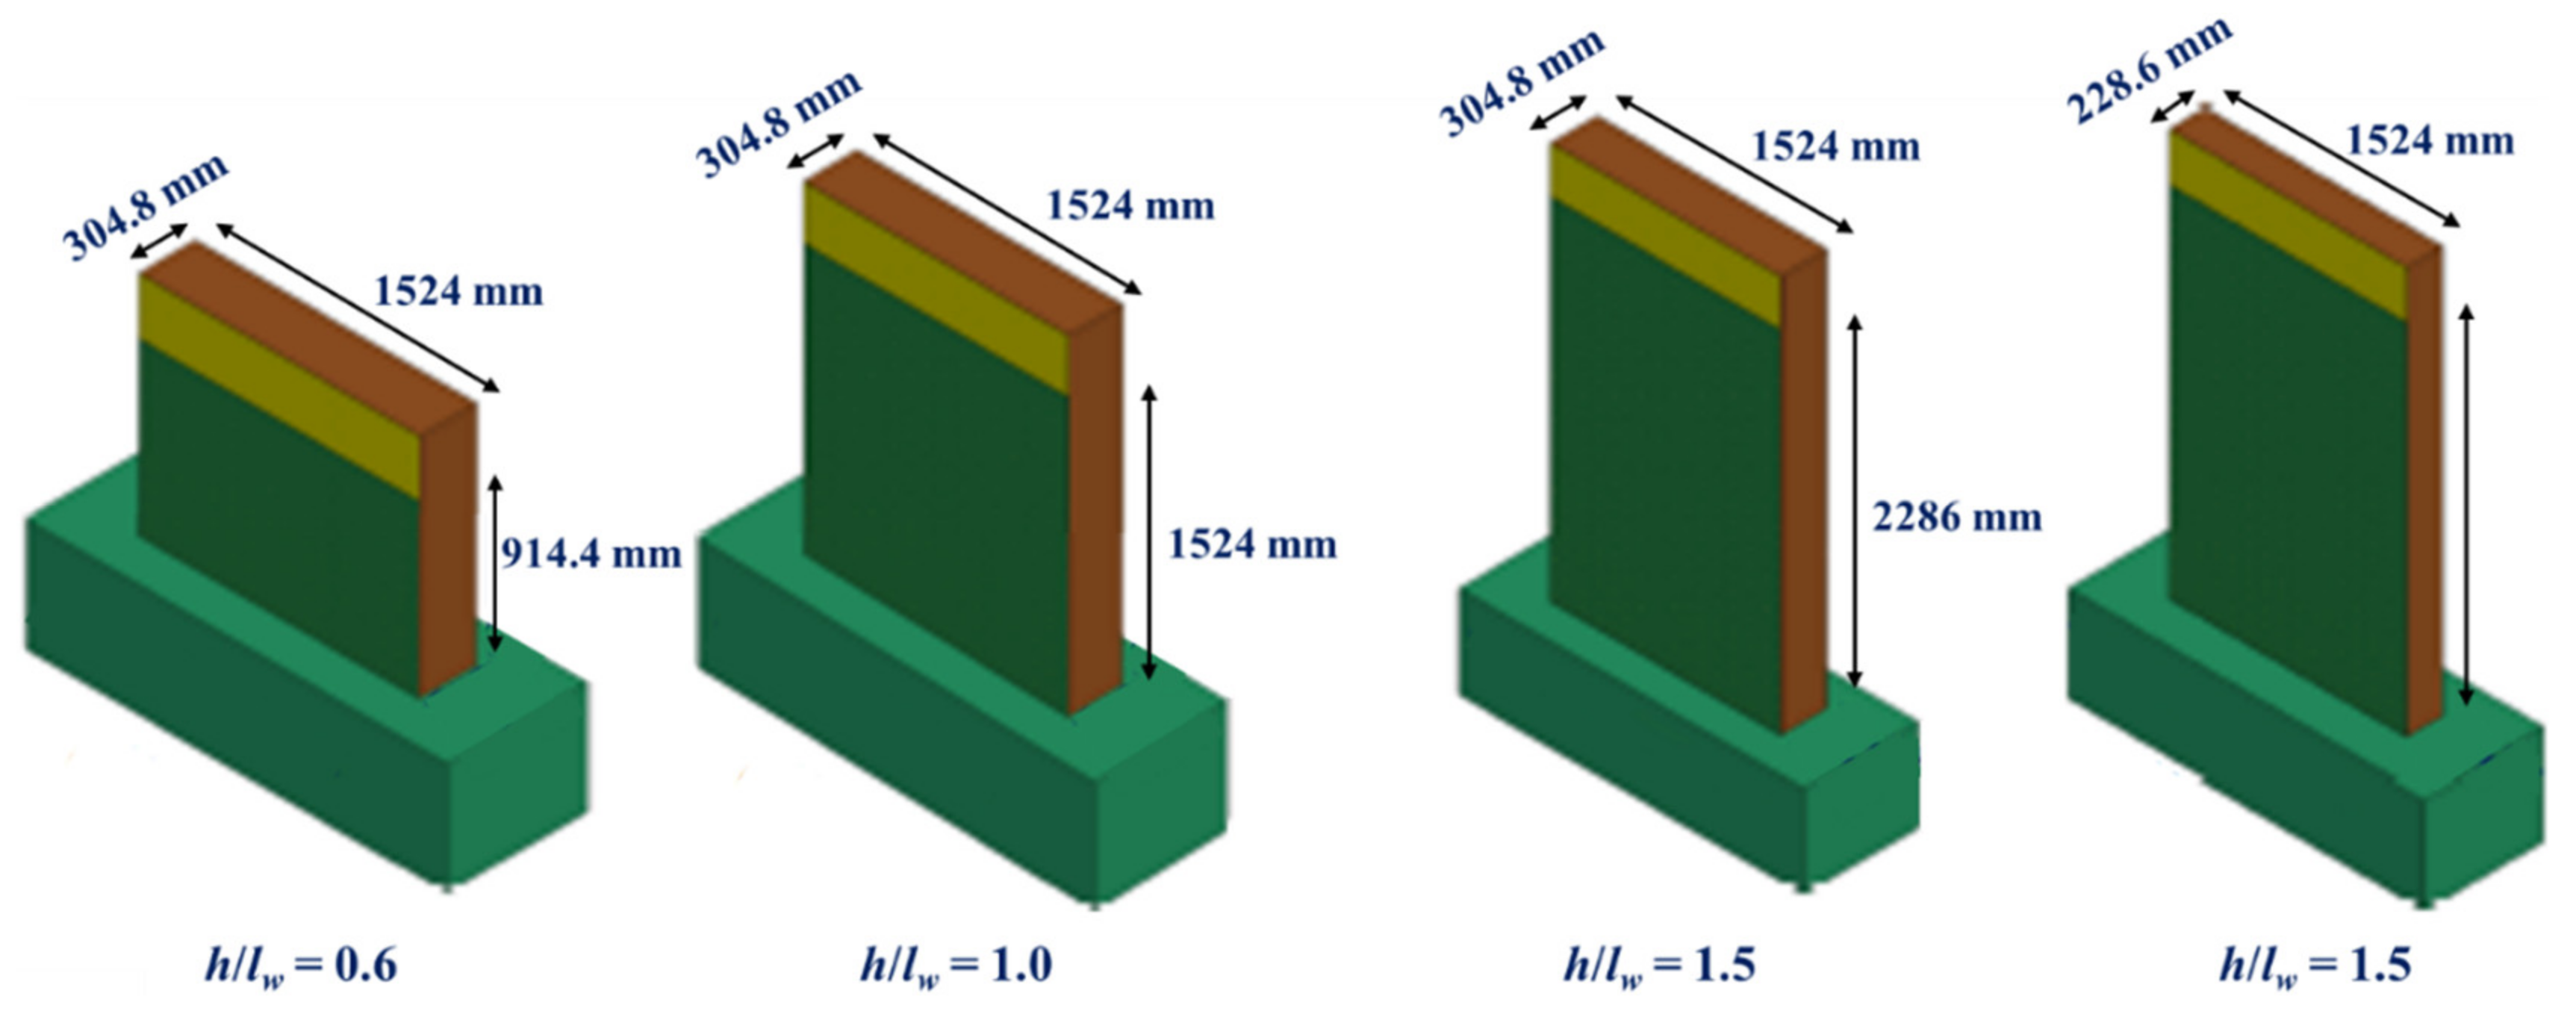
The benchmarked models compared reasonably well with the calculated lateral load capacities and test results. These benchmarked models were used to conduct analytical parametric studies to further investigate the in-plane behavior of SC wall-to-RC basemat over-strength connections with non-contact lap spliced rebars. Table 2 presents the parametric study design matrix. Briefly, 12 SC wall-to-RC basemat connections were included in the matrix considering two different SC wall thicknesses (Tsc = 228.6 mm, 304.8 mm), three different SC wall heights (h = 914.4 mm, 1524 mm, 2286 mm), and constant SC wall length (lw = 1524 mm) resulting in three different aspect ratios (h/lw = 0.6, 1.0, 1.5), two different levels of SC wall reinforcement ratio (ρsc = 3.1%, 4.2%), and three different rebar sizes (#4, #5, and #6). Figure 16 shows the geometric dimensions of the SC walls considered in the parametric studies.
Table 2.
Comparison of wall capacities for parametric studies.

Figure 16.
Geometric dimensions of the 3D finite element models for the parametric studies.
Table 2 also presents the estimated lateral (in-plane) flexural capacities (MnRC, MnSC) of the 12 SC wall overstrength connections with lap spliced vertical rebars. The distribution of the rebars embedded in SC wall-to-RC over-strength connections affects the flexural capacity of the connection region as well as the width of the cracks occurring inside the concrete infill. Similar reinforcement ratios can be achieved with different rebar sizes. The rebar spacing needs to be optimized to have the desired strength from the connection while simultaneously controlling the crack width; however, when the size of the reinforcement bars is reduced to decrease the spacing between them, the rebars tend to have higher stresses in them. This may cause adverse effects on the shear capacity of the concrete section. This phenomenon is addressed by the design equations for shear in Table 25.5.1 of ACI 318M-14 [25]. To minimize the aforementioned adverse effects, the flexural capacity of the RC portion (MnRC) was kept between 50 to 90% of the flexural capacity of the SC portion (MnSC) in the parametric studies.
The RC portion of the SC wall comprises rebars that are embedded in the concrete infill of the SC wall and the concrete basemat. The in-plane flexural capacity, MnRC, of the RC wall is based on fiber-based section analysis, resulting in the moment–curvature relationship of the cross-section. The in-plane shear capacity of the RC wall, VnRC, is capped at as recommended by the ACI 318M-14 [25]. The lateral load capacities (Table 2) for the specimens were calculated using the RC and SC strength equations described here. The expected tensile strength of the steel plates was assumed as 1.1 × 344.7 MPa = 379.2 MPa (). Reinforcement bar anchors, on the other hand, had expected tensile strength, , of 1.25 × 413.7 MPa = 517.1 MPa (1.25 × 60 ksi = 75 ksi). The compressive strength of the concrete does not have a substantial effect on the flexural capacity of the RC cross-section, but it affects the shear strength that is proportional to . For this parametric study, the expected compressive strength of the concrete infill is assumed to be equal to 1.5 × 34.5 MPa = 48.3 MPa (1.5 × 5000 psi = 7500 psi).
There are multiple tension stiffening equations proposed by the researchers. Although the equations proposed by different researchers provided reasonable results with their own experimental results, the developed equations were comparably off with different researchers’ experiment results. Bentz [30] discussed the reason for differences in tension stiffening equations proposed by different researchers. It was concluded that the reinforcement ratio of the cross-section had an influence on the tensile strength. The differences in the equations developed by different researchers were resolved by introducing a bond parameter in the equations. The ratio between the total cross-sectional area of the concrete infill to the sum of the perimeter of all reinforcement bars was called the bond parameter. The bond parameters for Specimens SCRC1 and SCRC2 were calculated as 12.2 and 10.2, respectively. The parametric study matrix was designed to have the bond parameters in the same range as the specimens.
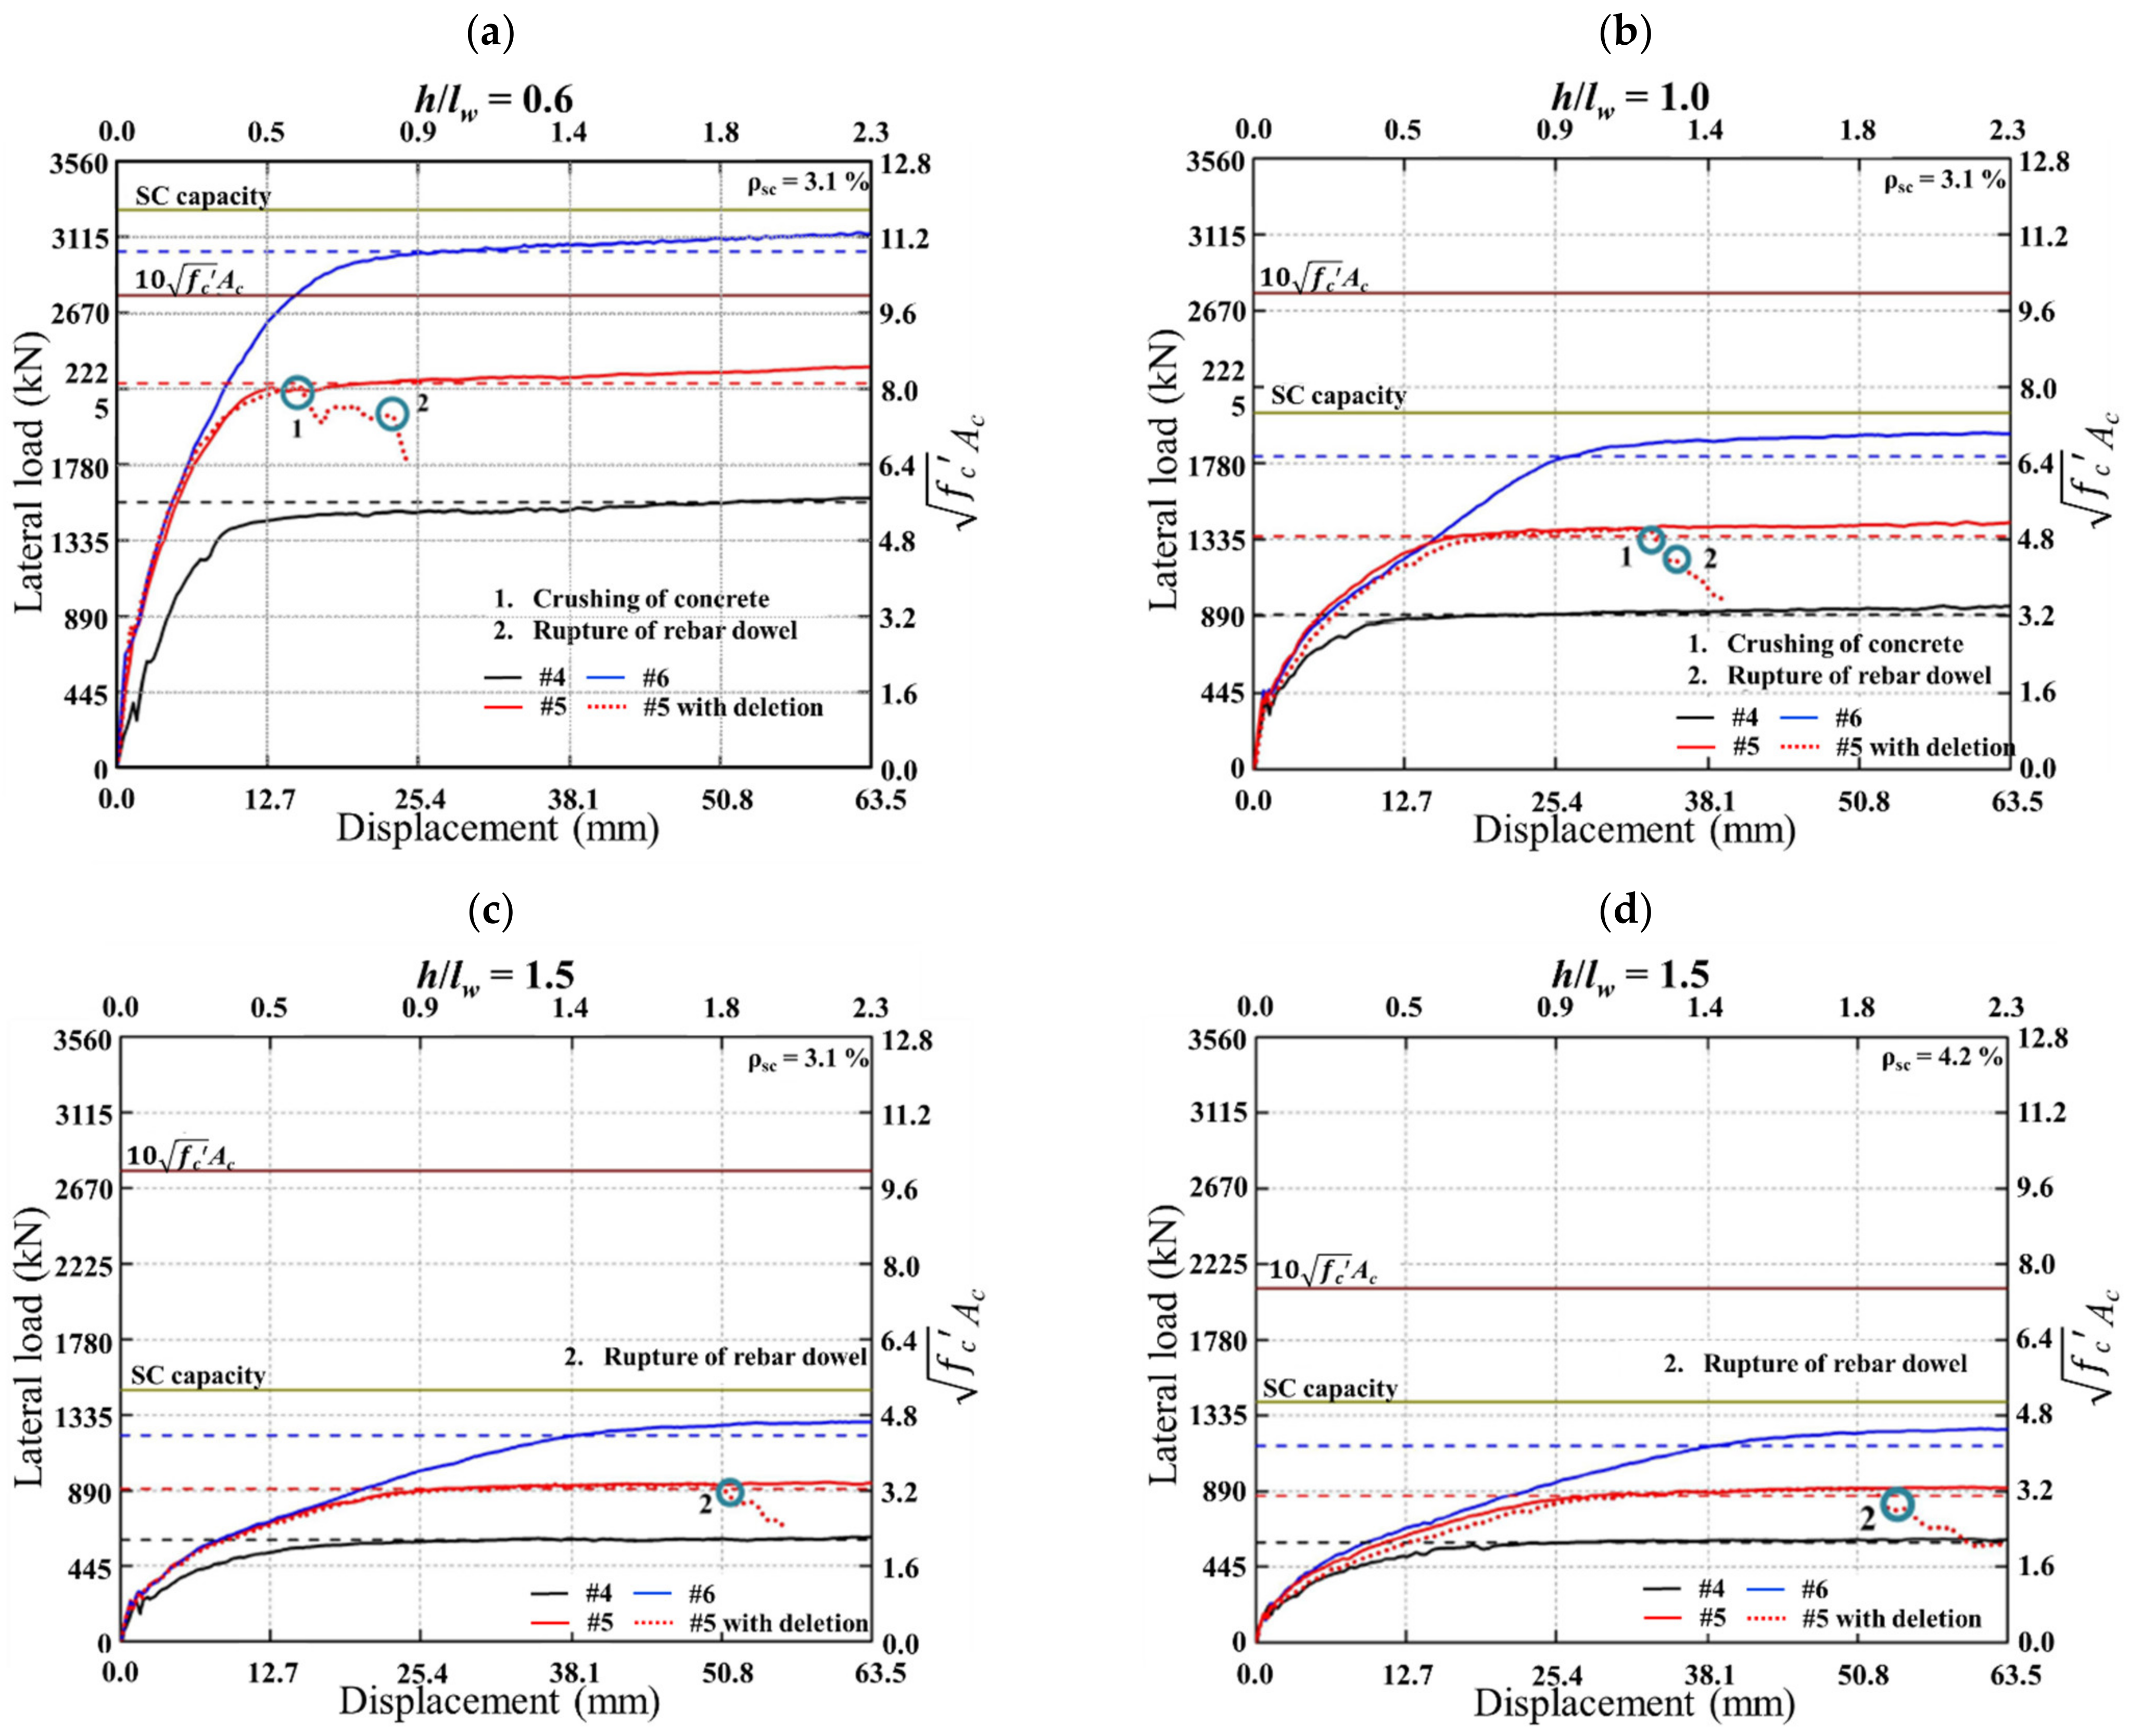
Figure 17a shows analytically predicted lateral load–displacement responses of parametric study Cases 1, 2, and 3 (Tsc = 304. 8 mm, h/lw = 0.6, ρsc = 3.1%). All of the models reached their calculated in-plane capacities of VnMnRC (dotted horizontal lines). The lateral load capacities and initial stiffness of the three cases increased with an increase in the rebar size. The capacities were less than the SC capacity of the walls (MnSC, green horizontal lines) for all three cases. The capacities were 1512.4 kN (340 kips) and 2313.1 kN (520 kips) for Case 1 (#4 rebar) and Case 2 (#5 rebar), respectively; however, they were lower than the ACI upper limit () for in-plane shear strength (solid red lines). The lateral load capacity for Case 3 (#6 rebar) was higher than . This was also the observed behavior from the SCRC2 test that had #6 rebars and SCRC2 failed in flexure by rupturing the extreme rebars. Figure 17a also includes the model with #5 rebar dowels and damage introduced for the concrete and steel rebar dowels. The two events, concrete crushing and steel rupture, are also marked on the graph as events 1 and 2 highlighted using green circles.
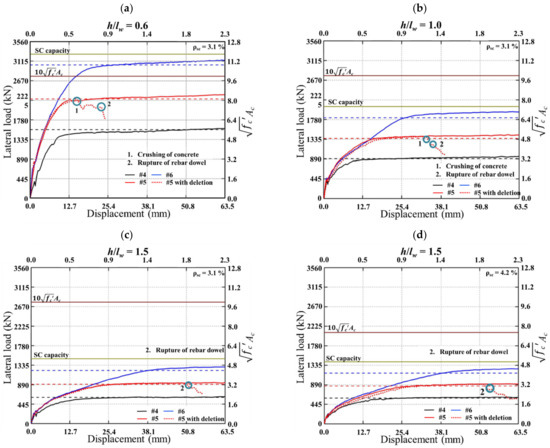
Figure 17.
Lateral load–displacement curves from the parametric studies: (a) h/lw = 0.6, ρsc = 3.1%, (b) h/lw = 1.0, ρsc = 3.1%, (c) h/lw = 1.5, ρsc = 3.1%, and (d) h/lw = 1.5, ρsc = 4.2%.
The lateral load–displacement responses for Cases 4, 5, and 6 (Tsc = 304. 8 mm, h/lw = 1.0, ρsc = 3.1%) are shown in Figure 17b. The initial stiffness of the walls was similar to each other. The lateral load capacities were 934.1 kN (210 kips), 1423.4 kN (320 kips), and 1912.7 kN (430 kips) for Case 4 (#4 rebar), Case 5 (#5 rebar), and Case 6 (#6 rebar), respectively, and they were less than both MnSC and . This is attributed to the reduced shear demands on the walls with an increase of h/lw. Figure 17b also includes the model with #5 rebar dowels and damage included. The events of concrete crushing and rebar rupture are marked on the corresponding curve.
Figure 17c shows the analytically predicted lateral load–displacement response curves for Cases 7, 8, and 9 (Tsc = 304. 8 mm, h/lw = 1.5, ρsc = 3.1%). These three cases exhibited similar responses to those for Cases 4–6. The lateral load capacities for these three models were 600.5 kN (135 kips) for Case 7 (#4 rebar), 911.9 kN (205 kips) for Case 8 (#5 rebar), and 1267.7 kN (285 kips) for Case 9 (#6 rebar), which were less than both MnSC and . The lateral load capacities of Cases 7, 8, and 9 were lower than those of Cases 4, 5, and 6 due to a higher aspect ratio (h/lw). Figure 17c also shows the model with damage included. The difference between this relatively slender model compared to the lower aspect ratio walls was that crushing of the concrete did not occur and rupture of the rebar dowels was the failure mode. Figure 17d shows the analytically predicted lateral load–displacement response curves for Cases 10, 11, and 12 (Tsc = 228.6 mm, h/lw = 1.5, ρsc = 4.2%). The analysis results of the three cases were similar to those of Cases 7, 8, and 9. The lateral load capacities were 578.3 kN (130 kips) for Case 10 (#4 rebar), 845.2 kN (190 kips) for Case 11 (#5 rebar), and 1223.3 kN (275 kips) for Case 12 (#6 rebar) and they were lower than both MnSC and .
6. Summary and Conclusions
Experimental investigations were conducted to evaluate the structural performance of SC wall-to-RC basemat over-strength connections with non-contact lap spliced rebars. The lateral load–displacement responses and lateral load–drift ratio responses were measured and evaluated. Three-dimensional finite element models were developed and benchmarked using the experimental results. The benchmarked models were used to conduct analytical parametric studies and expand the database. The primary findings from the study are summarized below. It is important to note that the findings are based on the limited experimental results and analytical parametric studies. Additional experimental data are recommended to further verify the findings.
- SC walls with overstrength connections with lap spliced rebars had better deformation (drift) capacity as compared to SC walls with full-strength connections.
- Tests conducted on SC walls with overstrength connections showed that the connections failed when the rebar dowels ruptured in axial tension at relatively large displacements.
- The lateral load capacity of SC walls with overstrength connections was governed by the flexural capacity of the cross-section of the RC portion of walls, MnRC.
- The initial stiffness of the SC walls with overstrength connections reduced from the linear (proportional) limit before the peak load, but the deformation (drift) capacity was still higher than SC walls with full-strength connections.
- SC walls with overstrength connections reached their lateral load capacities at drift ratios of 1.4% and 1.7%, whereas SC walls with full-strength connections reached their lateral load capacity at lower drift ratios of 0.9%.
- The results of the parametric studies showed that SC walls with overstrength connections develop lateral load capacities corresponding to the in-plane flexural capacities MnRC of the RC cross-sections at the base of the walls.
- The lateral load capacities of the walls decrease and the effects of in-plane shear forces become less influential with increasing aspect ratios.
- Parametric studies showed that the thickness of the wall does not have a significant influence on the lateral load capacity of SC walls with overstrength connection (within practical limits).
Author Contributions
E.G.K.: Methodology; validation; formal analysis; investigation; data curation; writing—original draft preparation; J.S.: Validation; writing—review and editing; visualization; A.H.V.: Conceptualization; methodology; resources, writing—review and editing, visualization, supervision, project administration, funding acquisition. All authors have read and agreed to the published version of the manuscript.
Funding
This research was funded by the United States Department of Energy through the Nuclear Energy University Program (NEUP)—Advanced Methods of Manufacturing (AMM), Nuclear Energy Enabling Technologies (NEET-1), Award Number DE-NE0000543, Grant No. CA-12-IN-PU-0606-01: Modular Connection Technologies of SC Walls for SMRs.
Institutional Review Board Statement
Not applicable.
Informed Consent Statement
Not applicable.
Data Availability Statement
All data can be obtained by writing to the corresponding author.
Acknowledgments
The authors would like to express their gratitude to the U.S. Department of Energy. The experiments were conducted at the Robert L. and Terry L. Bowen Laboratory for Large-Scale Civil Engineering Research in the Lyles School of Civil Engineering at Purdue University. The contributions and efforts of the staff at Bowen Lab led by Thomas Bradt are acknowledged gratefully.
Conflicts of Interest
The authors declare no conflict of interest.
References
- Kanchi, M.; Kitano, T.; Sugawara, R.; Hirakawa, K. Experimental Study on A Concrete Filled Steel Structure Part 2 Compressive Tests (1). In Summary of Technical Papers of Annual Meeting, Architectural Institute of Japan, Structures; Japanese Architectural Society: Tokyo, Japan, 1996; pp. 1071–1072. (In Japanese) [Google Scholar]
- Usami, S.; Akiyama, H.; Narikawa, M.; Hara, K.; Takeuchi, M.; Sasaki, N. Study on a Concrete Filled Steel Structure for Nuclear Plants (Part 2). Compressive Loading Tests on Wall Members. In Proceedings of the Transactions of the 13th Structural Mechanics in Reactor Technology (SMiRT-13), Porto Alegre, Brazil, 13–18 August 1995; pp. 21–26. [Google Scholar]
- Zhang, K.; Varma, A.H.; Malushte, S.; Gallocher, S. Effects of Shear Connectors on the Local Buckling and Composite Action in Steel Concrete Composite Walls. Nucl. Eng. Des. 2014, 269, 231–239. [Google Scholar] [CrossRef]
- Zhang, K.; Seo, J.; Varma, A.H. Steel-Plate Composite Walls: Local Buckling and Design for Axial Compression. ASCE J. Struct. Eng. 2020, 146, 04020044. [Google Scholar] [CrossRef]
- Funakoshi, A.; Akita, S.; Matsumoto, T.; Hara, K.; Matsuo, I.; Hayashi, N. Experimental study on a concrete filled steel structure: Part 7: Bending shear tests (Outline of the experimental program and the results). In Summary of Technical Papers of Annual Meeting, Architectural Institute of Japan, Structures II; Japanese Architectural Society: Tokyo, Japan, 1997; pp. 1063–1064. [Google Scholar]
- Kitano, T.; Akita, S.; Nakazawa, M.; Fujino, Y.; Ohta, H.; Yamaguchi, T.; Nakayama, T. Experimental study on a concrete-filled steel structure Part 4: Shear tests (outline of the experimental program and the results). In Summary of Technical Papers of Annual Meeting, Vol. B-2. Architectural Institute of Japan; Japanese Architectural Society: Tokyo, Japan, 1997; pp. 1057–1058. [Google Scholar]
- Kurt, E.G.; Varma, A.H.; Booth, P.N.; Whittaker, A. In-plane Behavior and Design of Rectangular SC Wall Piers without Boundary Elements. ASCE J. Struct. Eng. 2016, 142, 04016026. [Google Scholar] [CrossRef]
- Ozaki, M.; Akita, S.; Oosuga, H.; Nakayama, T.; Adachi, N. Study on steel plate reinforced concrete panels subjected to cyclic in-plane shear. Nucl. Eng. Des. 2004, 228, 225–244. [Google Scholar] [CrossRef]
- Seo, J.; Varma, A.H.; Sener, K.; Ayhan, D. Steel-Plate Composite (SC) Walls: In-Plane Shear Behavior, Database, and Design. J. Constr. Steel Res. 2016, 119, 202–215. [Google Scholar] [CrossRef]
- Varma, A.H.; Zhang, K.; Chi, H.; Booth, P.N.; Baker, T. In-plane shear behavior of SC composite walls: Theory vs. experiment. In Proceedings of the 21st International Conference on Structural Mechanics in Reactor Technology (SMiRT 21), New Delhi, India, 6–11 November 2011. [Google Scholar]
- Booth, P.N.; Bhardwaj, S.R.; Tseng, T.C.; Seo, J.; Varma, A.H. Ultimate shear strength of steel-plate composite (SC) walls with boundary elements. J. Constr. Steel Res. 2020, 165, 105810. [Google Scholar] [CrossRef]
- Vecchio, F.J.; McQuade, I. Towards Improved Modeling of Steel-Concrete Composite Wall Elements. J. Nucl. Eng. Des. 2011, 241, 2629–2642. [Google Scholar] [CrossRef]
- Hrynyk, T.D.; Vecchio, F.J. Capturing Out-of-Plane Shear Failures in the Analysis of Reinforced Concrete Shells. ASCE J. Struct. Eng. 2015, 141, 04015058. [Google Scholar] [CrossRef] [Green Version]
- Sener, K.; Varma, A.H. Steel-Plate Composite SC Walls: Experimental Database and Design for Out-of-Plane Shear. J. Constr. Steel Res. 2014, 100, 197–210. [Google Scholar] [CrossRef]
- Sener, K.; Varma, A.H.; Seo, J. Experimental and Numerical Investigations of the Shear Behavior of Steel-Plate Composite (SC) Beams without Shear Reinforcement. Eng. Struct. 2016, 127, 495–509. [Google Scholar] [CrossRef]
- Sener, K.; Varma, A.H.; Ayhan, D. Steel-Plate Composite SC Walls: Out-of-Plane Flexural Behavior, Database, and Design. J. Constr. Steel Res. 2015, 108, 46–59. [Google Scholar] [CrossRef]
- Varma, A.H.; Malushte, S.R.; Sener, K.; Booth, P.N.; Coogler, K. Steel-Plate Composite Walls: Analysis and Design Including Thermal Effects. In Proceedings of the Transactions of the 21st International Conference on Structural Mechanics in Reactor Technology (SMiRT21), New Delhi, India, 6–11 November 2011. [Google Scholar]
- Varma, A.; Malushte, S.R.; Sener, K.C.; Lai, Z. Steel-plate composite (SC) walls for safety related nuclear facilities: Design for in-plane forces and out-of-plane moments. Nucl. Eng. Des. 2014, 269, 240–249. [Google Scholar] [CrossRef]
- AISC N690-18; Specification for Safety-Related Steel Structures for Nuclear Facilities. AISC: Chicago, IL, USA, 2018.
- Seo, J.; Varma, A.H. Experimental behavior and design of steel plate composite-to-reinforced concrete lap splice connections. J. Struct. Eng. 2017, 143, 04017011. [Google Scholar] [CrossRef]
- Katayama, S.; Fujita, F.; Furuwada, M.; Shohara, R.; Takeuchi, M.; Matsumoto, R. Experimental study on a steel plate reinforced concrete structure (part #33). Pull-out tests on anchorage rebars of SC panels. In Summaries of Technical Papers of Annual Meeting, Architectural Institute of Japan, B-2, Structures II, Structural Dynamics Nuclear Power Plants; Japanese Architectural Society: Tokyo, Japan, 1999; pp. 1247–1248. [Google Scholar]
- Epackachi, S.; Whittaker, A.; Varma, A.H.; Kurt, E. Finite Element Modeling of Steel-Plate Concrete Composite Wall Piers. Eng. Struct. 2015, 100, 369–384. [Google Scholar] [CrossRef]
- Bhardwaj, S.; Varma, A.H.; Orbovic, N. Behavior of Steel-Plate Composite Wall Piers under Biaxial Loading. J. Struct. Eng. 2019, 145, 04018252. [Google Scholar] [CrossRef]
- Bhardwaj, S.; Sener, K.C.; Varma, A.H. Multi-Hazard Investigation and Testing of Composite (SC) Wall Piers: Seismic and Thermal Loads. Nucl. Eng. Des. 2019, 348, 121–130. [Google Scholar] [CrossRef] [Green Version]
- ACI 318M-14; Building Code Requirements for Structural Concrete and Commentary (Metric). ACI: Farmington Hills, MI, USA, 2014.
- ACI 349M-13; Code Requirements for Nuclear Safety-Related Concrete Structures and Commentary (Metric). ACI: Farmington Hills, MI, USA, 2013.
- ASTM E8 E8M-13a; Test Methods for Tension Testing of Metallic Materials. ASTM: Conshohocken, PA, USA, 2013.
- ASTM C39 C39M; Standard Test Method for Compressive Strength Test of Cylindrical Concrete Specimens. ASTM: Conshohocken, PA, USA, 2013.
- ATC-24; Guidelines for Cyclic Seismic Testing of Components of Steel Structures. ATC: Redwood City, CA, USA, 1992.
- Bentz, E.C. Explaining the Riddle of Tension Stiffening Models for Shear Panel Experiments. ASCE J. Struct. Eng. 2005, 131, 1422–1425. [Google Scholar] [CrossRef]


Publisher’s Note: MDPI stays neutral with regard to jurisdictional claims in published maps and institutional affiliations. |
© 2022 by the authors. Licensee MDPI, Basel, Switzerland. This article is an open access article distributed under the terms and conditions of the Creative Commons Attribution (CC BY) license (https://creativecommons.org/licenses/by/4.0/).