Article

Influence of the Nature of Cement on the Physical and Mechanical Properties of Soil Concretes from Sandy Clay and Laterite

1
Laboratoire de Mécanique et Matériaux du Génie Civil (LM2GC), CY Cergy Paris Université, Neuville sur Oise, 95031 Cergy-Pontoise, France
2
Laboratory of Energy Modeling Materials and Methods (E3M), University of Douala, Logbessou P.O. Box 2701, Cameroon
3
Laboratory of Mechanics, Materials, Structures and Production (LMMPS), National Advanced School of Engineering, University of Yaoundé I, Yaoundé P.O. Box 8390, Cameroon
*
Author to whom correspondence should be addressed.
CivilEng 2024, 5(2), 307-326; https://doi.org/10.3390/civileng5020016
Submission received: 25 January 2024 / Revised: 30 March 2024 / Accepted: 2 April 2024 / Published: 7 April 2024
(This article belongs to the Special Issue Feature Papers in CivilEng)

Abstract

:
Soil concrete is a material produced by mixing the soil at the site with a hydraulic binder. This paper aims to study the influence of the nature of binder on the physical and mechanical properties of soil concrete. For the mixtures, three types of soil were chosen and studied: sandy clay with a granular class of 0/5 (SA5), laterite with a granular class of 0/5 (LA5), and laterite with a granular class of 0/10 (LA10). Three different cements were used: CEM I 52.5, CEM II 42.5, and CEM III 32.5, with cement contents of 150 and 250 kg/m3. The soil concretes were designed for a constant spread of 32–33 cm measured on a mini-slump. The results showed that LA5-based soil concrete has a higher water content of about 8.8% more than SA5 and LA10-based soil concretes. For all the mixtures, the lowest porosity values were obtained with CEM III 32.5, followed by CEM I 52.5, and finally CEM II 42.5. For the three types of cement and the same soil granular size, the compressive strength, static, and dynamic modulus of SA5-based soil concretes are higher than LA5. It was noted that the mechanical properties of soil concretes made with CEM III 32.5 are higher than those made with CEM I 52.5 and CEM II 42.5. Regardless of the type of cement used, the mechanical properties obtained on LA10-based soil concrete are higher than those on LA5-based soil concrete.

1. Introduction

There are various deep mixing systems for soil and hydraulic binder to produce soil concrete [1,2]. Soil concrete is nowadays an attractive material in the fields of soil improvement and soil treatment due to its economic and ecological aspects. Despite technological advances in the field, it is often difficult to predict the strength of the material [3], so when designing a structure, caution is taken and a high safety factor is chosen [4]. Ref. [5] showed that there are four main factors that influence the strength of soil concrete: binder characteristics, nature of the soil encountered, mixing, and curing conditions. In this study, the soil concrete consisted of organic soils. The results showed an increase in compressive strength as a function of the cement content. Ref. [6] proposed new predictive models for the uniaxial compressive strength of jet grouting materials based on data mining techniques. This analysis is conducted on four natural soils (lean clay, organic lean clay, fat clay, and silty clay) of clayey nature prepared with CEM I 42.5 R and CEM II 42.5 R cements. This study shows that for soil–cement mixtures, after 28 days of curing, their stiffness (as well as their uniaxial compressive strength) is almost not affected by age. However, the compressive strength values formulated with CEM I 42.5 R are higher than those of CEM II 42.5 R.
Ref. [7] affirms that the compressive strength of soil concrete increases with time in the same way as normal concrete. It has been shown that on clay soils made with CEM III 32.5 cement, the compressive strength of this material increases with time in the same way as that of normal concrete [8].
Most of the studies in the literature, such as the work of [9,10], have been carried out on artificial soils, and almost none on natural soils. The main hydraulic binder used in these studies is CEM III/C, which is a blast furnace cement with more than 85% slag [11], as it is also considered to be eco-efficient due to its low CO2 emissions. In the same way, the study conducted by [12] shows that the production of CEM III/C produces about 10 times less CO2 than CEM I.
Compared to ordinary concrete, the strength development of soil concrete is delayed by the large amounts of water injected during mixing [13], and there is a pronounced increase in long-term strength depending on the type of soil and cement used [14]. In order to explain this phenomenon, some authors have suggested a possible pozzolanic reaction between the portlandite resulting from the hydration of cement and clay [15]. Usually, formulations with CEM III 32.5 for clay and peat soils offer the lowest strengths (2 to 8 MPa), silty soils give intermediate strengths (4 to 14 MPa), and the best results are obtained with sandy and gravelly soils (12 to 19 MPa) [16].
The nature of the binder has a major impact on the mechanical and physical properties of soil concrete [7], and to date, there has been some research on the subject. Kawasaki compared the effects of Portland cement and slag cement on soils of different origins, namely Kanagawa soil from Tokyo Bay and Saga soil from Kyushu Island [9]. The results show that the effect of slags is very different depending on the type of soil, which is attributed to the complex chemical reactions of the hydration process.
As mentioned by [17], there is no specific compliance code or even generally accepted norms for soil concrete. Design models are now mainly based on empirical knowledge. Therefore, to extend the application of these materials to permanent structural works, it is necessary to increase the accuracy of the models and improve their mechanical and physical behavior by optimizing the mix design according to the nature of the binder [10].
In the past, studies on soil concrete were much more limited to artificial soils but also to underground structures. The field of application of this material is extending to structures underground and even above the ground, which require higher resistance. The sandy clay and laterite soil used in this work are, respectively, from Douala and Yaoundé in Cameroon. These soils are very common in Cameroon. Most of the civil and industrial projects in the field of public works in Cameroon are carried out with CEM II 42.5 cement, which is produced by local cement factories, in this case, the CIMENCAM factory. In the beginning, the study focused on soil concrete made with CEM II 42.5 cement. Subsequently, the results were compared with soil concrete designed with CEM I 52.5 and CEM III 32.5 cements produced, respectively, by EQIOM and CALCIA in France. This will enhance the study of the influence of the nature of cement on the physical and mechanical properties of soil concretes based on sandy clay and laterite. In this paper, a constant spread is proposed to enable a workability study of all the mixtures. Our study examines the influence of the nature and dosage of the binder and the nature and granulometry of the soil on the physical and mechanical properties of soil concrete. Microstructural and chemical analyses provide a better understanding of the compatibility and role of the binder on the mechanical properties.

2. Materials and Methods

2.1. Material Properties
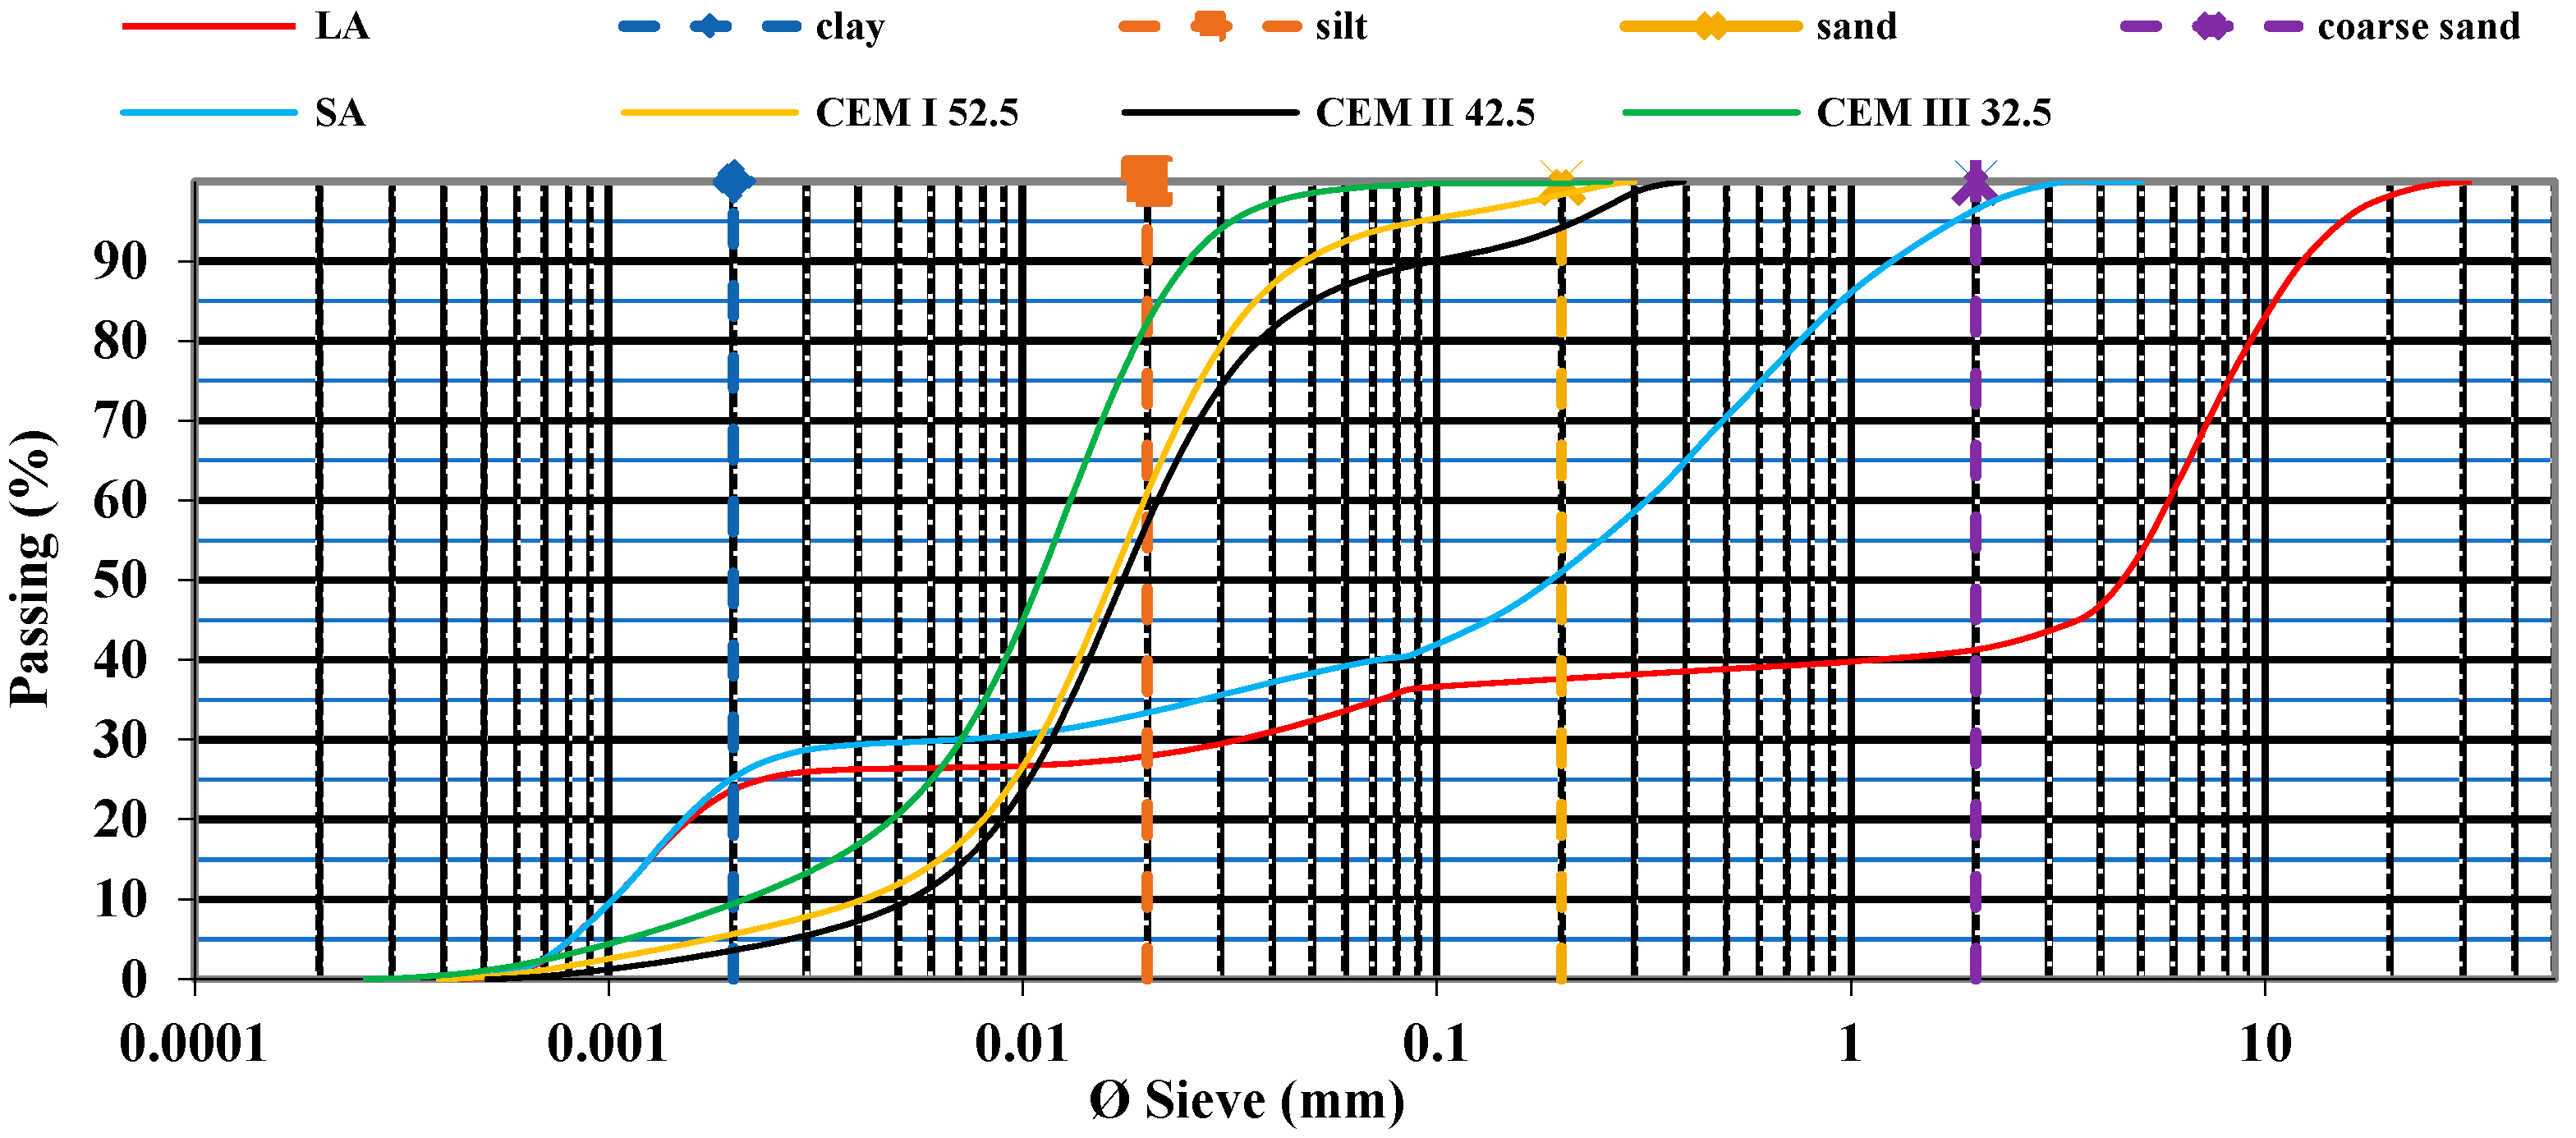
  • Soils
Two soils used as aggregates to make the soil concrete in this work were laterite (denominated LA) and sandy clay (denominated SA), which come respectively from Simbog in Yaoundé and Japoma in Douala in Cameroon. Two grain size classes (0/5) and (0/10) were considered for laterite (LA5 and LA10) and (0/5) for sandy clay (SA5) to study the influence of the grain size on the properties of soil concrete. Table 1 shows the loss on fire and chemical composition of soil samples (LA and SA) obtained from X-ray fluorescence spectrometry.
The main chemical constituents in sandy clay and laterite are SiO2, Al2O3, Fe2O3, and CaO. It should be noted that SA has a higher SiO2 content (42.95%) than LA (33.33%). This can be explained by that sandy clay is a granitic rock essentially made of quartz. However, the contents of Al2O3 (27.18%) and Fe2O3 (9.96%) are higher in LA than in SA. The high loss on fire values of LA (14.54%) and SA (12.87%) are due to the presence of bound water and organic matter in these natural soils.
Figure 1 shows the granular distribution of the different types of soil and cement.
In the case of LA, there is almost no sand fraction, and in the case of SA, there is an absence of coarse sand fraction.
The intrinsic characteristics of the soils used in the manufacture of soil concrete were determined by testing the specific density of solid grains, pH, methylene blue (VBS), Atterberg limits (Wp, WL, and Ip), and sand equivalent (ES), respectively, in accordance with norms: NF EN ISO 17892-3, NF-EN ISO 10523, NF EN 933-9, NF EN ISO 17892, and NF EN 933-8. The results are presented in Table 2.
LA and SA have a liquid limit WL of 76.45% and 56.39%, respectively, a plasticity index Ip of 33.81% and 27.06%. According to the GTR soil geotechnical classification, both soils are very plastic, silty soils. The pH values show that both soil samples are acidic, with a value of 5.34 for SA and 5.23 for LA. This acidity is explained by the fact that the soils are generally in contact with acidic rainwater (pH below 5.6) [18]. According to [8], soil pH is a parameter that influences the compressive strength of soil concrete. The VBS values show that LA has a higher amount of clay (0.9) than SA (0.43).
  • Cement
The types of cement used for this study are CEM I 52.5 N CE CP2 NF and CEM III/C 32.5N CE PM- ES NF, manufactured in France by EQIOM and CALCIA, respectively, in compliance with the European classification [19], and CEM II B-P 42.5 R NC, manufactured in Cameroon by CIMENCAM and in compliance with the Cameroonian standard NC 234 [20]. Table 3 shows the chemical composition of the three types of cement used in this work, obtained from X-ray fluorescence spectrometry.
The CEM III 32.5 cement contains a higher content of SiO2 (32.8%) and Al2O3 (10.2%) than the CEM II 42.5 and CEM I 52.5 cements, i.e., respectively 25.50% SiO2 and 7.61% Al2O3 for the first and 20.70% SiO2 and 4.60% Al2O3 for the second. Furthermore, CEM III 32.5 has a low content (0.70%) of Fe2O3 compared to CEM I 52.5 (3.30%) and CEM II 42.5 (6.78%). Table 4 shows the different intrinsic characteristics of the types of cement used in the manufacture of soil concrete.
The Blaine-specific surface values obtained show that the value for CEM II 42.5 (0.35 m2/g) is lower than that for CEM I 52.5 (0.4 m2/g) and CEM III 32.5 (0.47 m2/g). This result agrees with the particle size analysis of the different cements used (Figure 1), which clearly shows that the finest cement is CEM III 32.5, followed by CEM I 52.5, and finally CEM II 42.5. The specific density of CEM III 32.5 (2900 kg/m3) is lower than that of CEM II 42.5 (3100 kg/m3) and CEM I 52.5 (3150 kg/m3).

2.2. Mixtures Design

Four cement contents of 150, 200, 250, and 300 kg/m3 were used to produce the soil concrete, thus covering the entire range of dosages normally used in deep mixing applications. The abbreviations used for soil concrete will be related to the nature of the material, the grain size, the nature of the cement used, and the dosage. For example, the soil concrete obtained from a mixture of sandy clay of granular class 0/5 with cement CEM II 42.5 dosed at 250 kg/m3 will be named SA5C250_II.
The mix design method consists of first setting the cement dosage value. Then, the W/C ratio is chosen for values that allow self-placing soil concrete to be achieved, and the quantity of soil to be added to the mixture is deduced to obtain 1 m3 of fresh soil concrete. The choice of water dosage is then verified experimentally using a mini-cone whose dimensions are homothetically 2 times smaller than those of the Abrams cone (Figure 2). All mixtures were carried out at constant workability, with a spread of between 32 and 33 cm corresponding to self-compacting soil concrete.
By neglecting the air in the mixture, we obtain the following equation:
Vwater + Vcement +Vsoil = 1 m3 soil concrete.
After several spreading tests, the water content of the mixture is determined in accordance with the workability assumption. Table 5, Table 6 and Table 7 show the different mixtures studied.
The water content is higher for LA5C than for SA5C in the different soil concrete mixtures. This is explained by that LA5 is more plastic soil with a higher WL and specific surface than SA. This is consistent with the work of [9], who shows that the water content of the mix increases with the clay content of the soil to achieve the target slump value. This high water demand of a clay-containing mix is due to the water retention in the clay structure and its high specific surface area (Table 1). This retained water will have different physical properties than “free” water and is not effective in terms of cement and concrete chemistry. It is important to note that the amount of water in LA10C is less than LA5C; this is due to the grading. There are more fine elements in LA5, which results in a higher water demand compared to LA10. Finally, it should be noted that the nature and dosage of cement have no effect on the workability for the same water content.

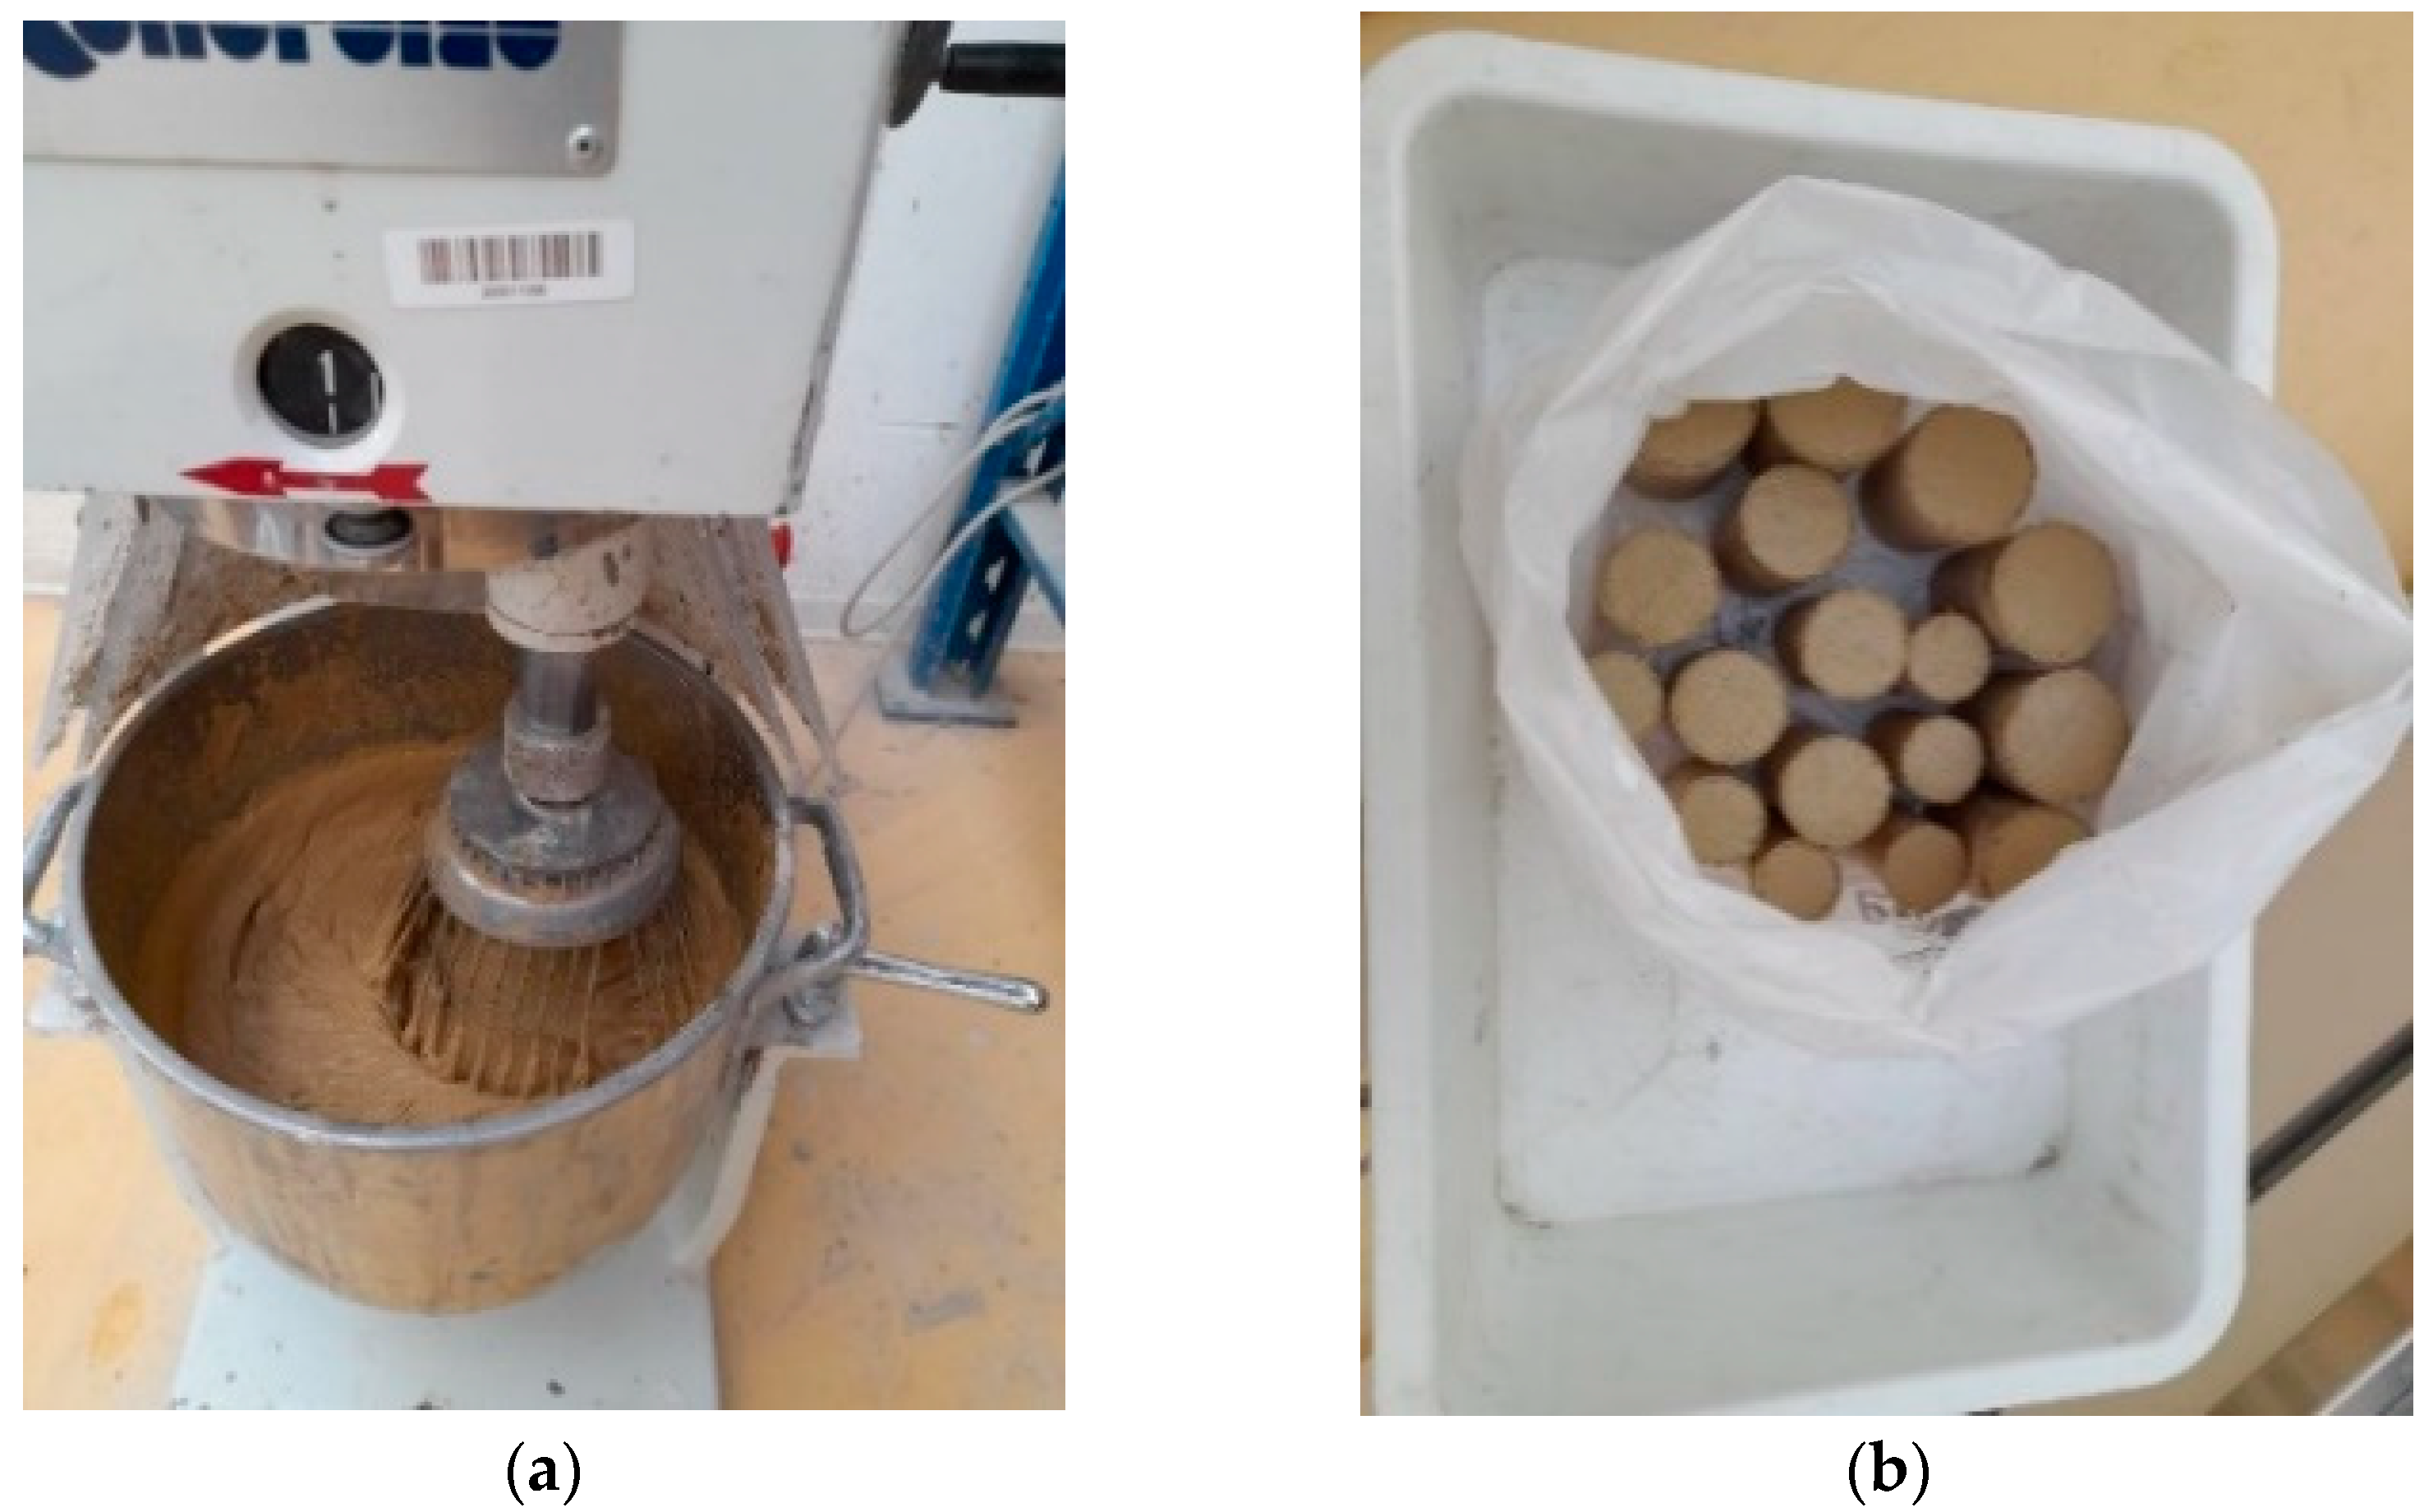
2.3. Specimen Preparation

Soil concrete is made in the laboratory under ideal mixing conditions, so the mixing procedure has no significant influence on the properties of the studied mixtures. The soil and cement are first mixed dry by hand for about 5 min to obtain a visually homogeneous mixture. Mechanical mixing [21] with water is then carried out using a CONTROLAB mixer (Figure 3a).
During mixing, the tool performs a planetary rotation movement at a speed of 63 rpm, which is the minimum speed of the mixer. The mixing time is set at 10 min, as mixing beyond this time has no real effect on the strength of the hardened concrete, as observed by [22].
After mixing, the material is cast into cylindrical molds of 60 mm in diameter and 120 mm in length in three layers. After each layer, the soil concretes are clamped using the tapping method (15 strokes). For all mixes, the filling of the molds is completed at the latest 45 min after mixing with cement. This limits the influence of the resting time before placement on the material characteristics [23].
Immediately after production, the soil concrete specimens are stored in sealed bags to allow for endogenous drying [24]. The soil concrete specimens are unmolded after 7 days of curing time (Figure 3b). This curing time allows the material to reach sufficient strength to avoid damaging the specimens during the demolding phase [25]. Immersion in saturated lime water for curing of all specimens was carried out [26].

2.4. Experimental Procedures

  • Air trapped
The volume of air trapped during the mixing phase of fresh concrete was determined for each mix design using an aerometer according to NF EN 12350-7 [27].
  • Water porosity
The measurement of water-accessible porosity and bulk density was carried out on cylindrical specimens of 40 mm diameter and 100 mm height. The samples were dried in an oven at 60 °C until they reached a constant mass, as noted in [28]. Once dried, they were weighed and placed in a vacuum desiccator for 2 h. The saturation phase lasted 3 days; the weight of the dry sample on the saturated surface was measured, and then a hydrostatic weighing was carried out to calculate the porosity value and the apparent density according to NF P 18-459 [28]. The measurements were taken at 28 days of age.
  • Uniaxial compression
The uniaxial compression tests were carried out in accordance with NF EN 12390-3 [29] on cylindrical specimens of 60 mm diameter and 120 mm height. The specimens are loaded under controlled stress at a rate of 0.04 MPa/s with a Zwickwell electromechanical press. This relatively low loading rate was chosen to allow time for cracks to propagate in the material.
  • Static modulus of elasticity
Some specimens were equipped with strain gauges to determine the static elastic modules during the compression test. Four gauges were used on the cylinder, two attached axially and two attached transversally. The static modulus is determined by calculating the slope of the unloading phase of the stress-strain curve for each cycle from a linear data set between the peak and the halfway point of each cycle. The value of the modulus of elasticity is determined for a stress level equivalent to 30% of the breaking strength (0.3 fc).
  • Dynamic modulus of elasticity
Measurements of the P-wave velocity noted Vp in the different samples were carried out on concrete soil specimens of dimensions 60 mm in diameter and 120 mm in height using a wave propagation test device called Pundit Lab. The knowledge of Vp and Poisson’s ratio from a previous study [30] allows the calculation of the value of the dynamic modulus through equation 2 below.
E d y n = ρ V p 2 .   ( 1 + v ) ( 1 2 v ) ( 1 v )
  • Microscopic observation
Microscopic electronic observations were made on a REISS microscope of the different samples after crushing for 28 days. The procedure consists first of taking a fragment of material after compression tests and placing it under a vacuum in the SEM. Using an electron beam, the microstructure of the samples is observed.

3. Results and Discussions

3.1. Physical Characteristics of the Material in the Fresh and Hardened State
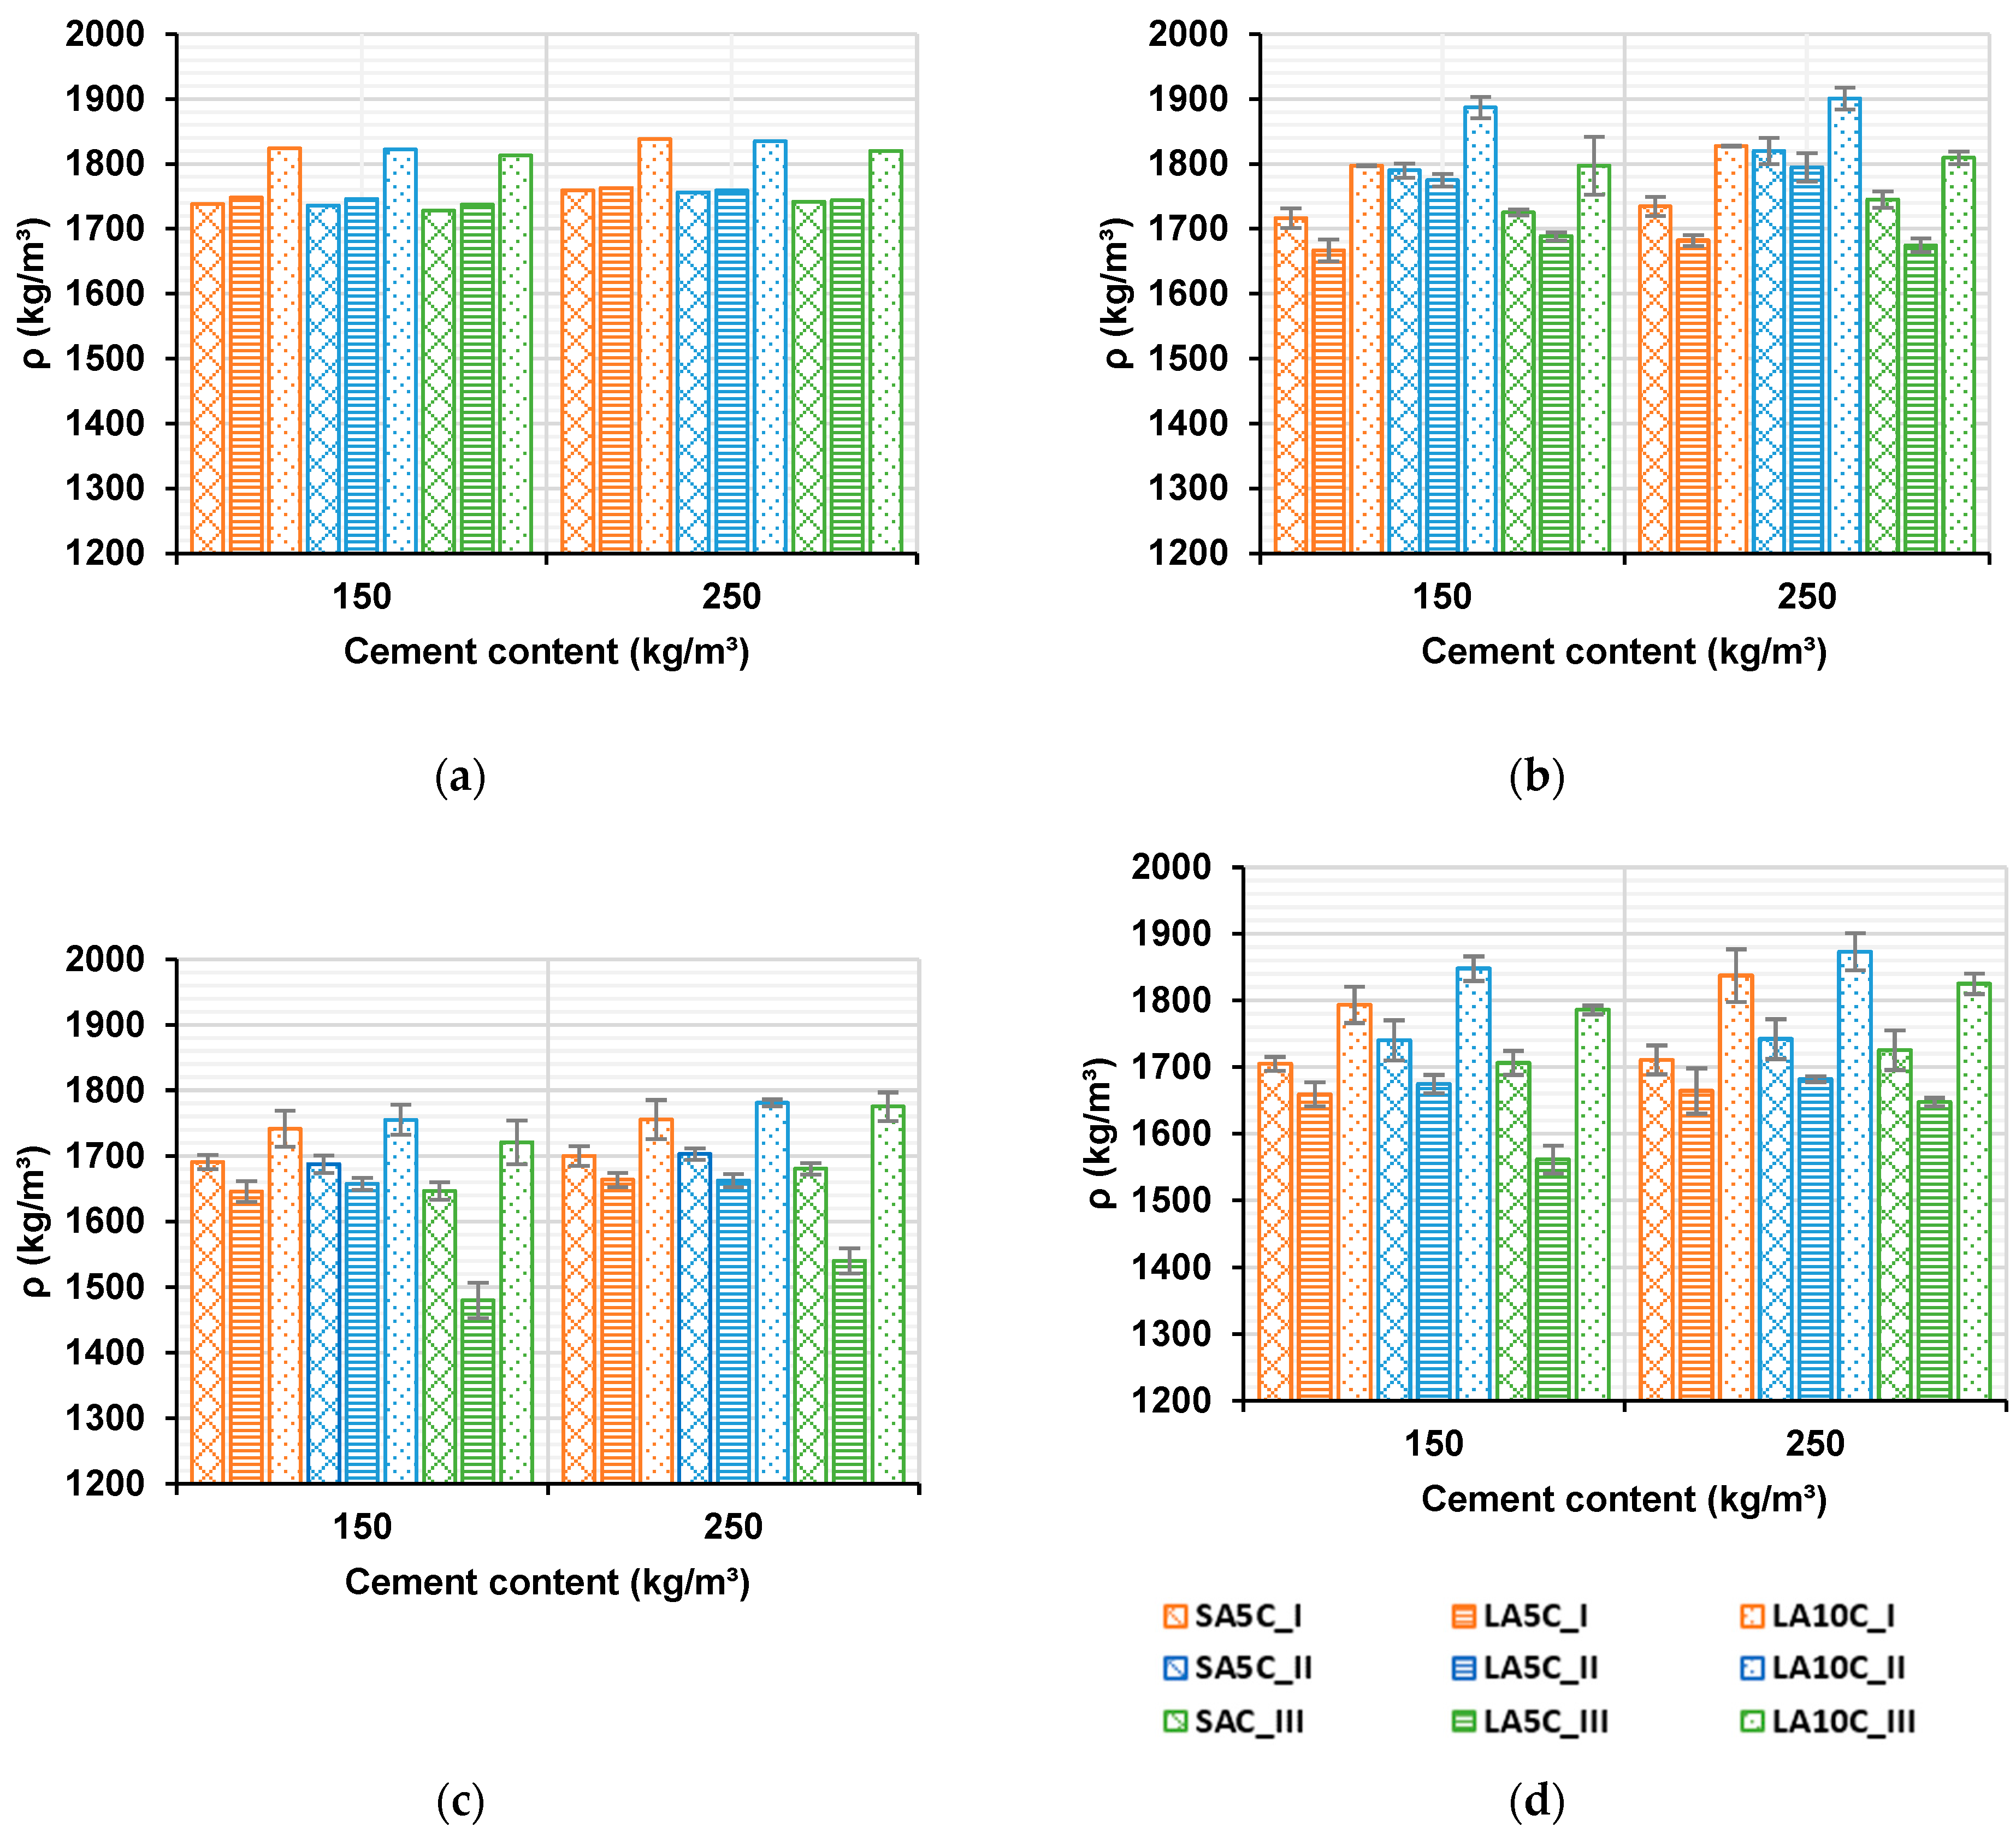
3.1.1. Density

The density results obtained for the different fresh soil concretes vary between 1480 and 1901 kg/m3, Figure 4a–d. These measured density values are comparable to values found in the literature for this material [30]. The slight difference observed between the theoretical and experimental density values in the fresh state can be explained by the absorption of water by the soils and mainly by the entrapped air in the soil concrete. The experimental values for the LA5 formulations are systematically smaller than the theoretical values, which can be explained by the higher values of trapped air in the LA5C. The high-density values of fresh soil concrete compared to hardened concrete at 28 and 90 days can be explained by the endogenous curing phase of 7 days in the plastic bags before storage in water, where the soil grains absorb some of the free water, resulting in an increase in the volume of the material and consequently a decrease in its density. Between 28 and 90 days, the hydration of the cement in the hardened soil concrete continues through pozzolanic reactions, increasing the density of the material. In Figure 4a, a slight difference in the theoretical density of the soil concretes formulated with CEM I 52.5, CEM II 42.5 and CEM III 32.5 is obtained. This can be explained by the slight differences in density between the different types of cement, which are 3150, 3100, and 2900 kg/m3, respectively. However, the experimental results obtained in the fresh state (Figure 4b) give rather higher values for the formulations made with CEM II 42.5, followed by CEM I 52.5, and CEM III 32.5. This may be explained by the specific surface, which is lower for CEM II (0.35 m2/g), followed by CEM I (0.4 m2/g), and CEM III (0.47 m2/g). A similar study conducted on mortars showed the effect of grinding on the increase in compressive strength [31].

3.1.2. Air Trapped

The percentages of entrapped air are determined and presented in Figure 5. The results obtained show a variation of the occluded air content between 3 and 4.8% for soil concrete made with sandy clay and between 3.1 and 5.2% for soil concrete made with laterite. The values of these results are comparable to those of the literature, such as those of [30], who obtained occluded air contents between 2 and 6% on soil concretes formulated based on Kaolinite, Fontainebleau sand, and CEM III 32.5. For soil concretes designed with CEM I 52.5, CEM II 42.5, and CEM III 32.5, there is no significant influence of nature or the cement dosage on the occluded air content. For each cement type, the values of the air content are higher in LA5C than in SA5C. This is due to a higher amount of clay in LA than SA, resulting in a granular arrangement that traps more air in soil concrete made with LA. For this reason, LA5C has a higher trapped air content than LA10C. This is explained by the larger granular fraction in LA10 that traps difficult air in the soil concrete compared to LA5. The influence of the clay content on the physical and chemical properties of soil concretes, particularly on the occluded air content, was shown by [9].

3.1.3. Water Porosity

Water porosity is presented in Figure 6, which shows the evolution of porosity as a function of the nature and dosage of cement and the nature of the soil.
The values presented in Figure 6 show that an increase of 100 kg in cement dosage leads to a slight decrease in porosity. Indeed, increasing the cement content makes the soil concrete denser with more hydrates and consequently reduces the pores of the material. The water porosity is greater in laterite than in sandy clay for the same grain size. This can be explained by the higher water content in the mixtures made with laterite. These results are consistent with the results of [9], which show that the porosity increases with the clay content in the material. The water porosity values of soil concrete designed with CEM III 32.5 are the lowest, followed by those designed with CEM I 52.5, and the highest values were obtained with CEM II 42.5. This can be explained by the better chemical compatibility of CEM III 32.5 with the soil compared to CEM I 52.5 and CEM II 42.5, as shown in SEM images.

3.2. Mechanical Properties

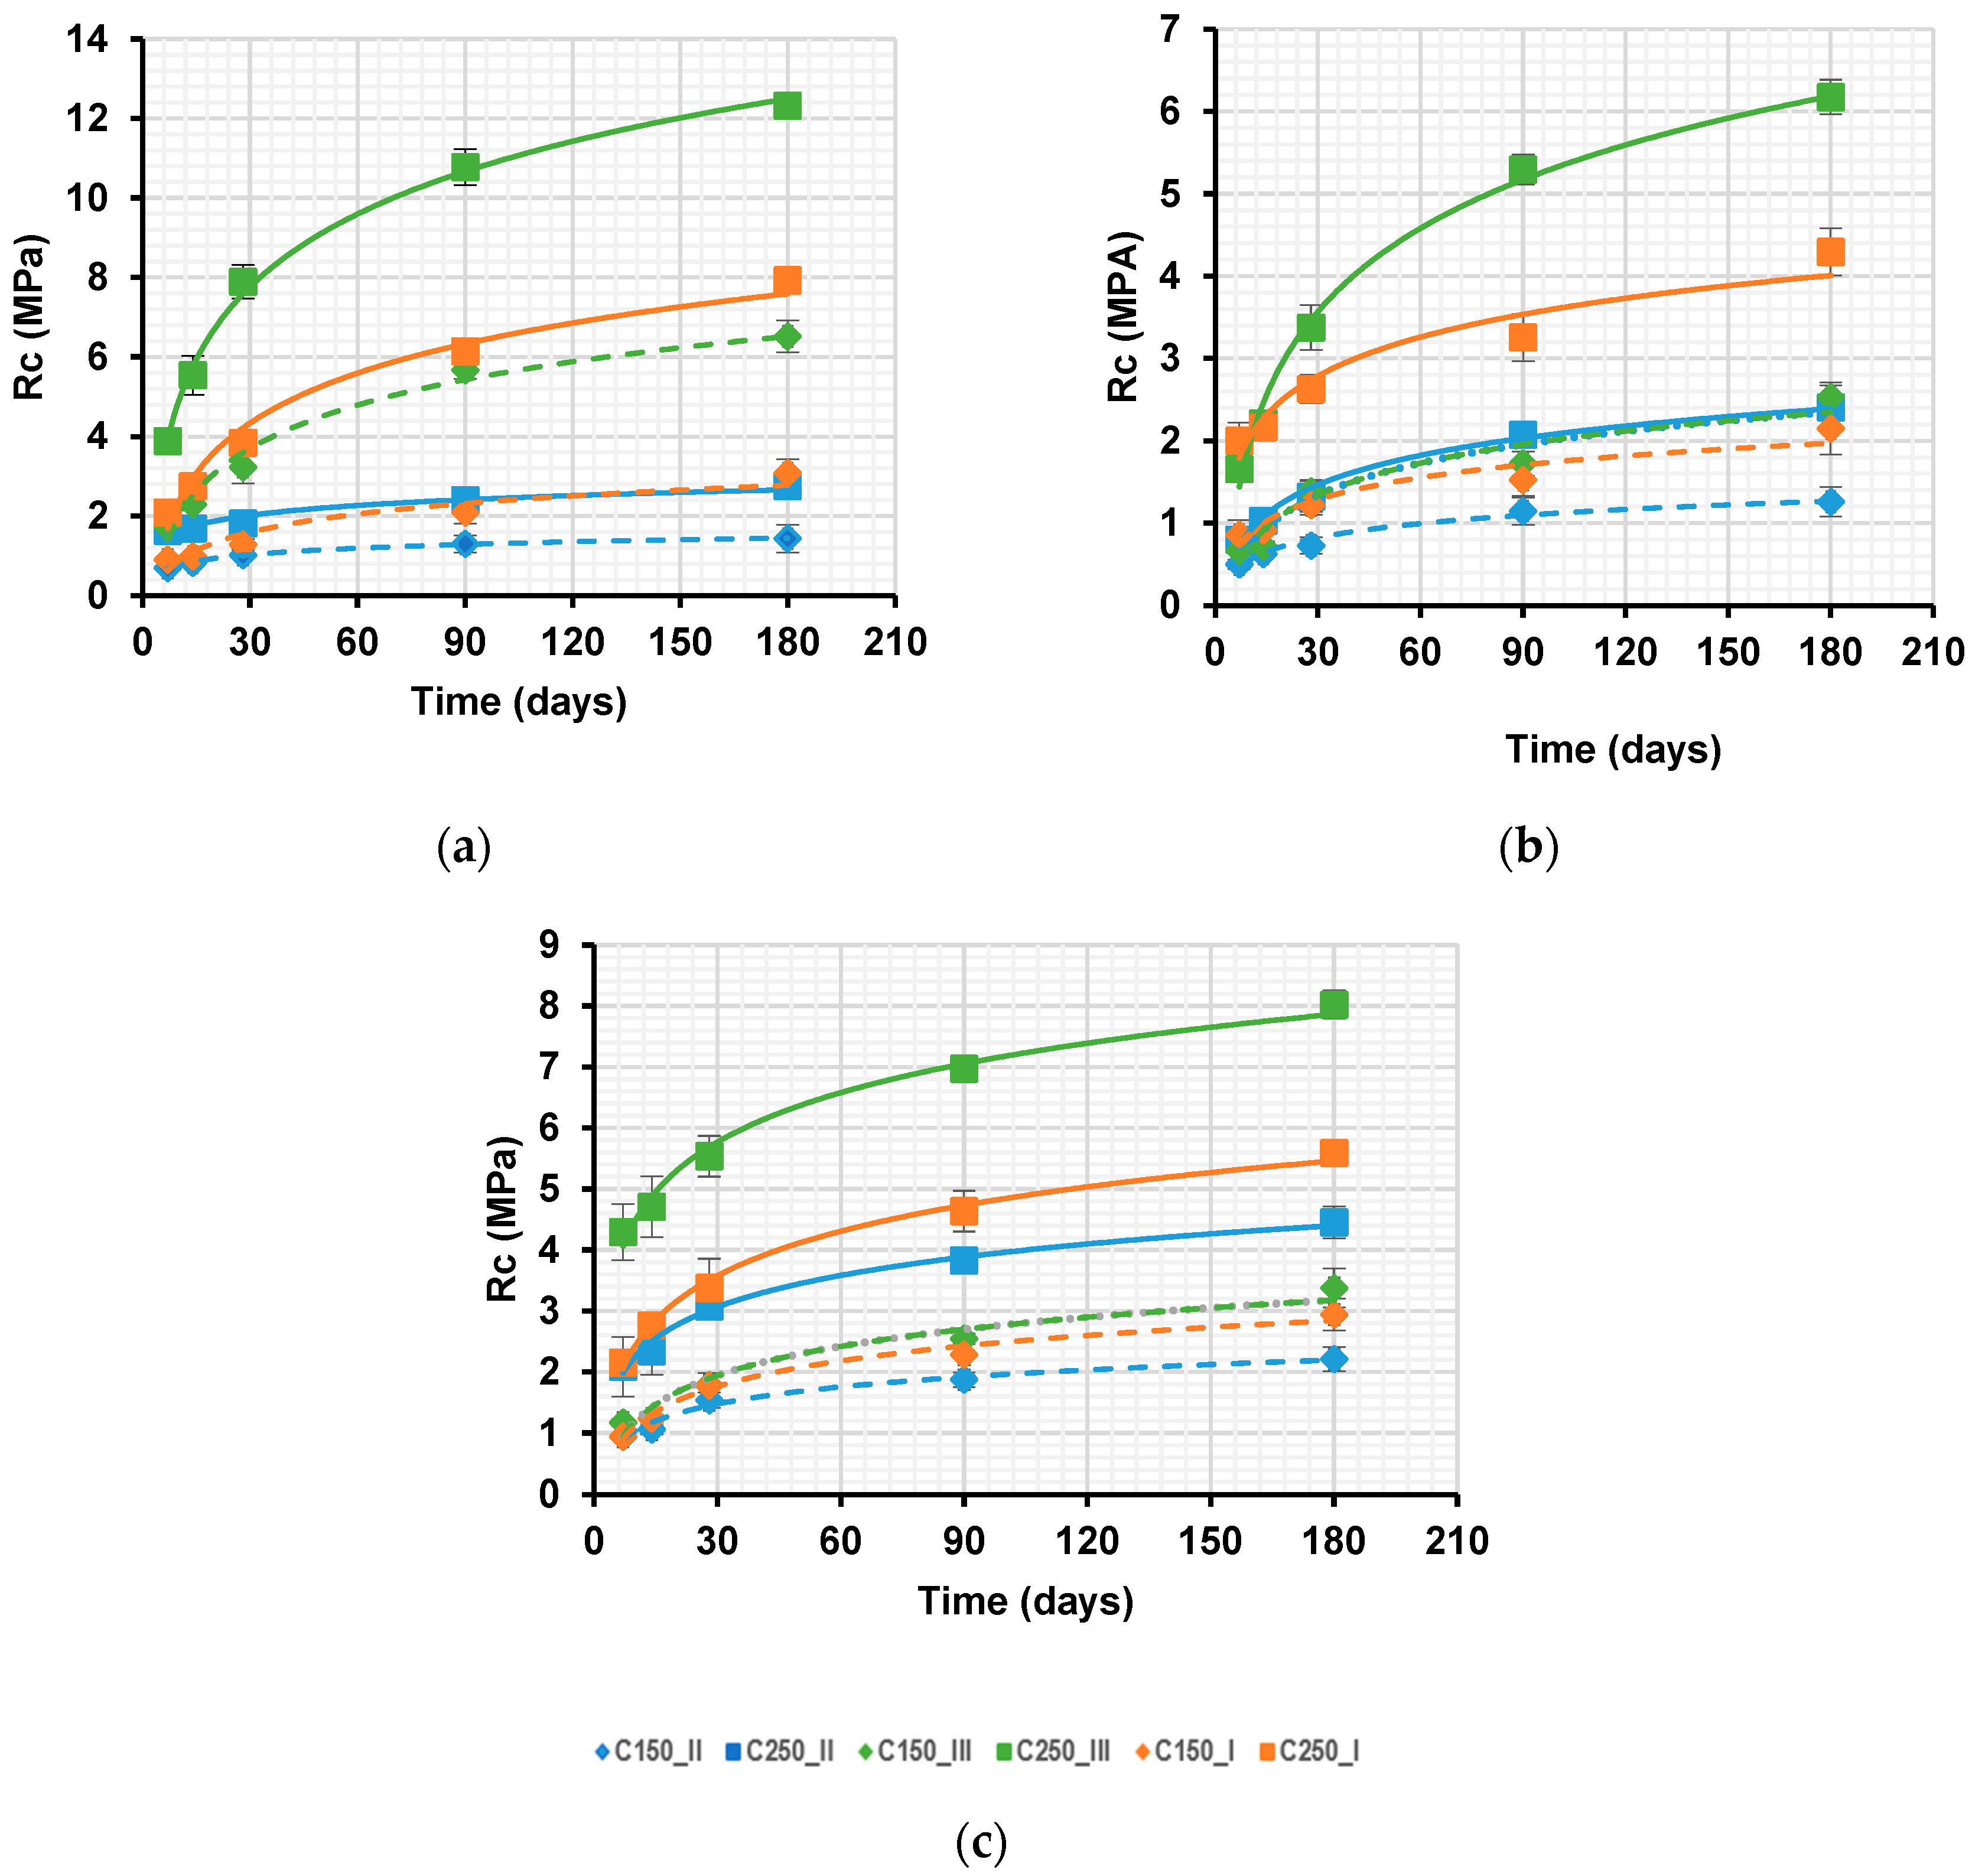
3.2.1. Uni-Axial Compressive Strength

The compressive strength development with curing time of soil–cement specimens made with three different soils and CEM II 42.5 is presented in Figure 7a–c. To study the influence of cement content on the compressive strength of soil concretes, four cement contents were tested.
Compressive strength values were determined for 7, 14, 28, 90, and 180 days of curing, and each point represents the average value of 5 specimens. The compressive strength of soil concrete increases with time and seems to stabilize around 180 days. This increase in compressive strength is explained by the development of pozzolanic reactions during the hydration of the cement in the soil concrete. Compared to ordinary concrete, which reaches about 90% of the maximum compressive strength at 28 days, soil concrete reaches about 65% at the same time [32]. This may be due to the large amount of water and fine elements present in the material, which slow down the rapid development of the compressive strength of soil concrete. For the same granular class (0/5), the compressive strength of specimens made with sandy clay is higher than that made with laterite. This can be partly explained by the higher water content and, therefore, by the higher porosity of specimens made with LA5. The influence of the aggregate size on the compressive strength is also noted. The compressive strength of specimens made with LA10 is higher than the compressive strength of ones made with LA5 for a given cement and water content at the same curing time. This can be explained by the larger aggregate size in the formulations made with LA10. This agrees with the results of the work of [32], which show that the compressive strength of soil–cement mixtures increases with increasing soil aggregate size.
Figure 8a,b shows the evolution of the compressive strength as a function of the cement content and the E/C ratio at 90 days of curing time for soil concretes designed with three different soils and CEM II 42.5.
It is observed that depending on the three soils, the soils concretes have an increasing evolution of the compressive strength as a function of the cement content. However, a decreasing evolution of the compressive strength as a function of the W/C ratio can be observed following an exponential trend. This trend is like the work carried out by [30]. Although the evolution of compressive strength as a function of cement dosage in SA5 soil concrete is higher than that of LA5 soil concrete, an almost similar evolution is still observed. This can be explained by the higher amount of water used in the formulation of LA5 soil concrete. In contrast to the other two soil concretes, the LA10 soil concrete has a much higher evolution due to the larger grain size and the amount of water being close to that of the SA5 soil concrete.
Figure 9 shows the evolution of the compressive strength of soil concretes depending on the curing time designed with the three types of cement (CEM I 52.5, CEM II 42.5, and CEM III 32.5) and the three types of soil.
A logarithmic evolution of the compressive strength as a function of time was observed for all the curves in Figure 9a–c. It should be noted that for the same cement dosage and regardless of soil type, the compressive strength of soil concrete made with CEM III 32.5 is higher than that of those made with CEM I 52.5 and CEM II 42.5. This difference in compressive strength between specimens made with CEM III 32.5 and other cements is very significant, mainly for the cement content of 250 kg/m3 and after 90 days of curing time. Figure 10 shows the values of the compressive strength at 90 days for a cement content of 250 kg/m3 for all mixtures. For a soil concrete LA10 with CEM III 32.5, a difference of 33% compared to CEM I 52.5 and 44% compared to CEM II 42.5 is observed. This is the same trend for the other two types of soil concrete. This can be explained by the better compatibility between CEM III 32.5 and the two soils used, which is reflected in the SEM images by a denser paste-aggregate bond. This better compatibility of soil concrete designed with CEM III 32.5 could be due to its low chemical composition of Fe2O3 (0.70%) compared to CEM I 52.5 (3.30%) and CEM II 42.5 (6.78%). Research showed the effect of high values of Fe2O3 chemical composition on the properties of Portland cement clinker on the compressive strength; an increase in Fe2O3 leads to its decrease [33].
For a given type of cement and a given cement content, the highest strength is obtained for specimens made with sandy clay, SA5 (except for CEM II 42.5), and the lowest strength is obtained for LA5. This can be related to the grading of the soil, the water content of the concrete, and the compatibility of the chemical composition of cement and soil. This explains the fact that for the same water content, we have a higher compressive strength with LA10 soil concrete than with SA5. Furthermore, for the same granular class (0/5), higher compressive strengths are noted for soil concrete from sandy clay than for soil concrete from laterite. This is due to a higher water content in the LA5-based soil concrete (570 kg/m3) than in the SA5-based soil concrete (525 kg/m3). Therefore, the SA5-based soil concrete is better than the LA5-based soil concrete.
For the soil concretes made with CEM I 52.5 and CEM III 32.5, the SA-based concretes give us better compressive strengths than the LA5-based one (0/5). This is due to the higher water content and porosity of the laterite.

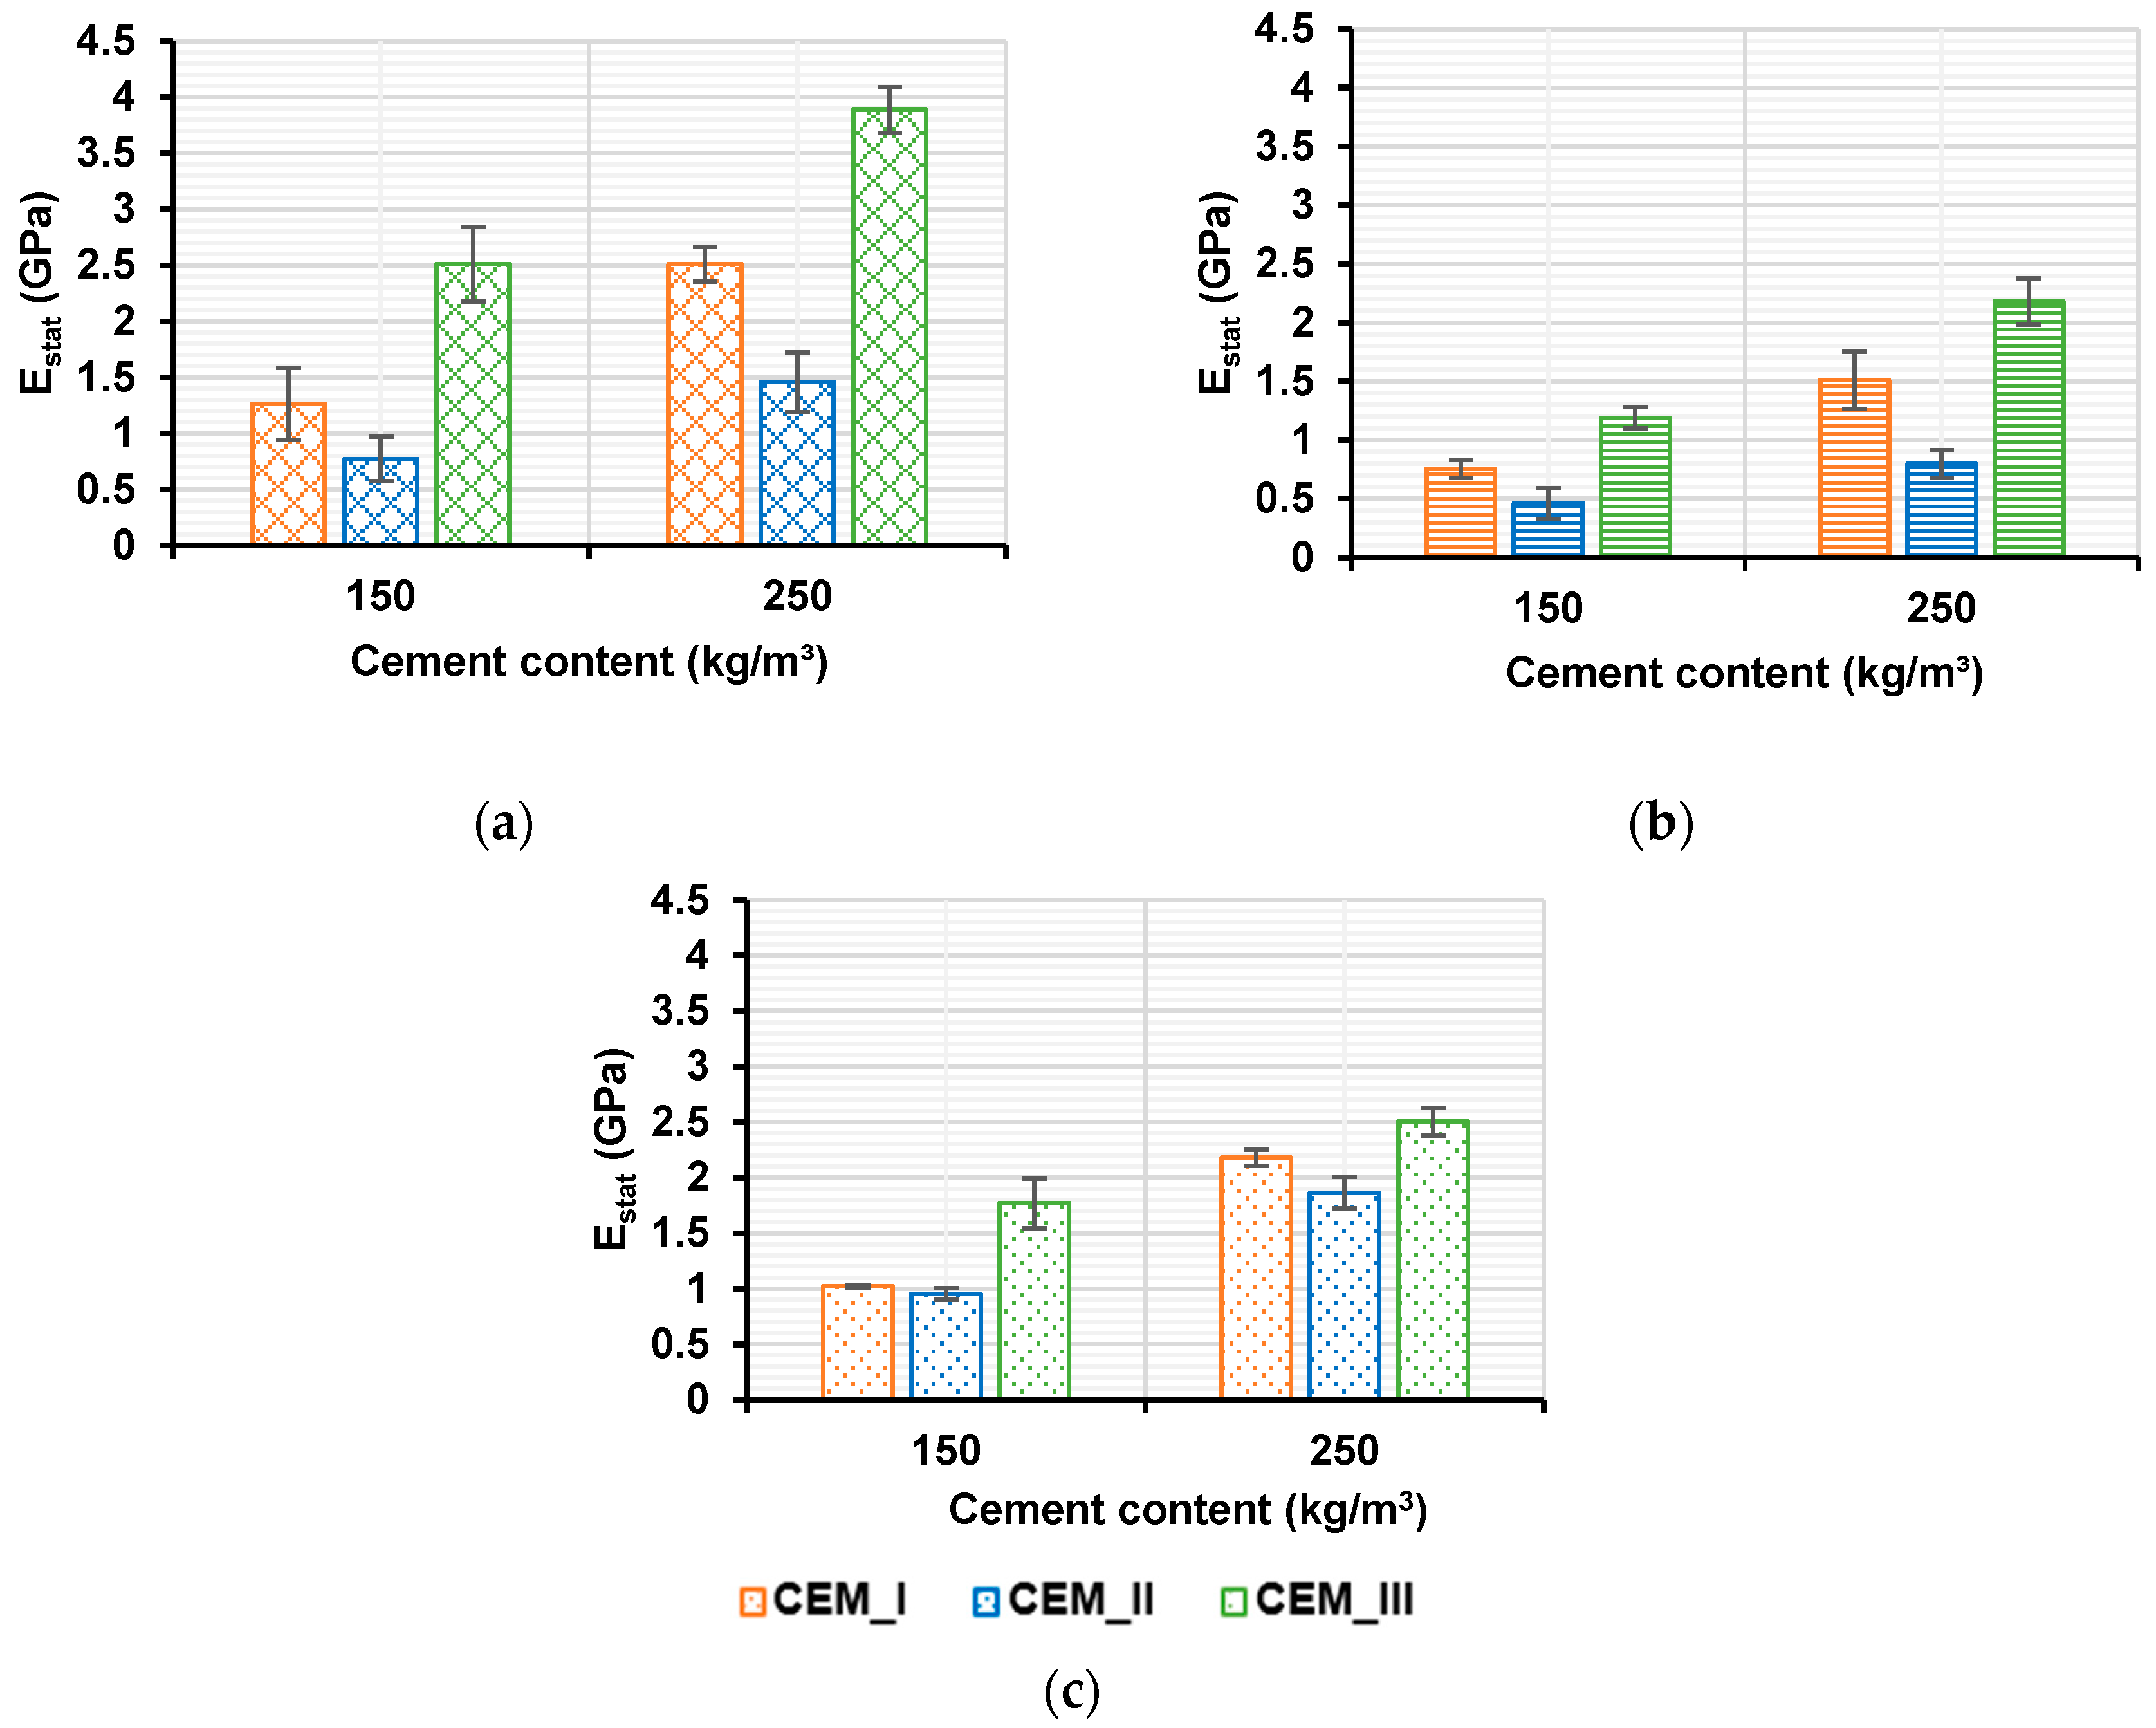
3.2.2. Modulus Static Elasticity

Figure 11 shows the evolution of the static elasticity modulus as a function of cement content at 28 days. The Young’s modulus increases with cement content and grain size but decreases as the amount of clay in the soil increases. For all types of soil and cement content, the highest values of static Young’s modulus were obtained for soil concretes formulated with CEM III 32.5, followed by CEM I 52.5 and CEM II 42.5. This can be explained first by a physical property of the cement, which is its fineness modulus. It is lower for CEM III 32.5, followed by CEM I 52.5, and CEM II 42.5. However, it has been shown on mortars by [31] that the finer the grinding of the cement, the better the mechanical properties, especially the compressive strength. The second explanation is chemical because, through X-ray fluorescence spectrometry conducted on the different types of cement, it shows us a rather low Fe2O3 composition in CEM III 32.5 compared to CEM I 52.5 and CEM II 42.5. Ref. [33] has shown that the high Fe2O3 content in cement could have a negative influence on the compressive strength of concrete. For 250 kg/m3 cement content, the soil concrete based on SA5 formulated with CEM III 32.5, for example, has a Young’s modulus value that is 35.9 and 61.5% higher than those formulated with CEM I 52.5 and CEM II 42.5, respectively. In the case of LA5 soil concrete formulated with CEM III 32.5, its Young’s modulus value is 31.8 and 63.6% higher than those formulated with CEM I 52.5 and CEM II 42.5, respectively. In the case of LA10 soil concrete formulated with CEM III 32.5, its Young’s modulus value is 12 and 24% higher than those formulated with CEM I 52.5 and CEM II 42.5, respectively. These results are consistent with the literature, and those of [30], who obtained static Young’s modulus values for soil concretes at 300 kg/m3 cement content based on Kaolinite and standardized sand formulated with CEM III 32.5 at 90 days, are between 6 and 20 GPa. For all cements, the Young’s modulus values are higher for SA5 soil concrete, followed by LA10 and LA5 soil concrete. This is due to a higher compressive strength on SA5-based soil concrete than LA10 and LA5-based soil concretes due to a higher amount of water in LA5 soil concrete compared to SA5 and LA10 soil concretes and a higher grain size in LA10 compared to LA5.

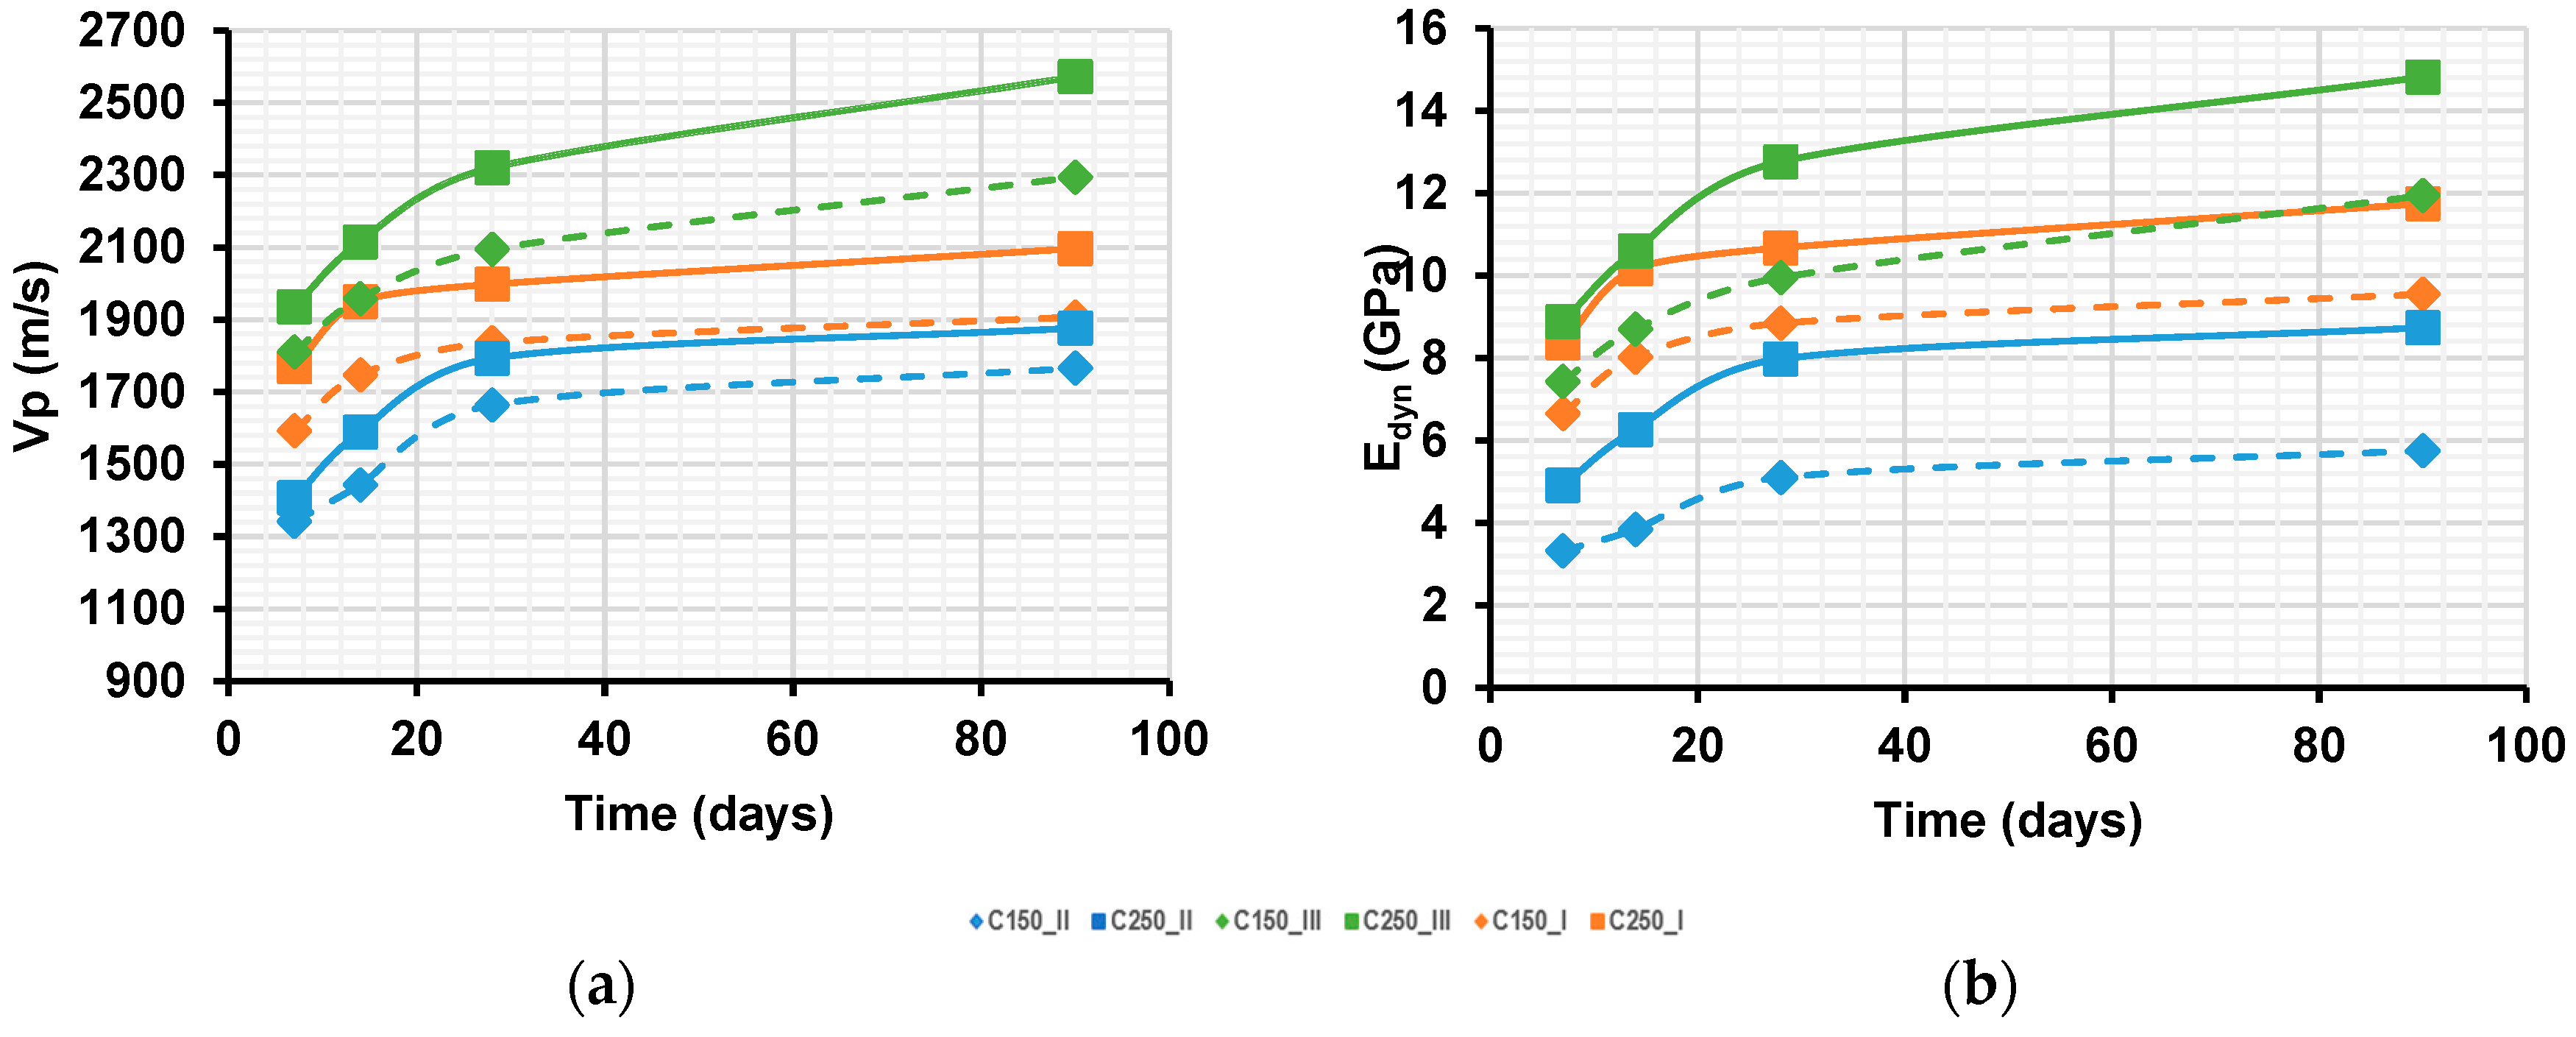
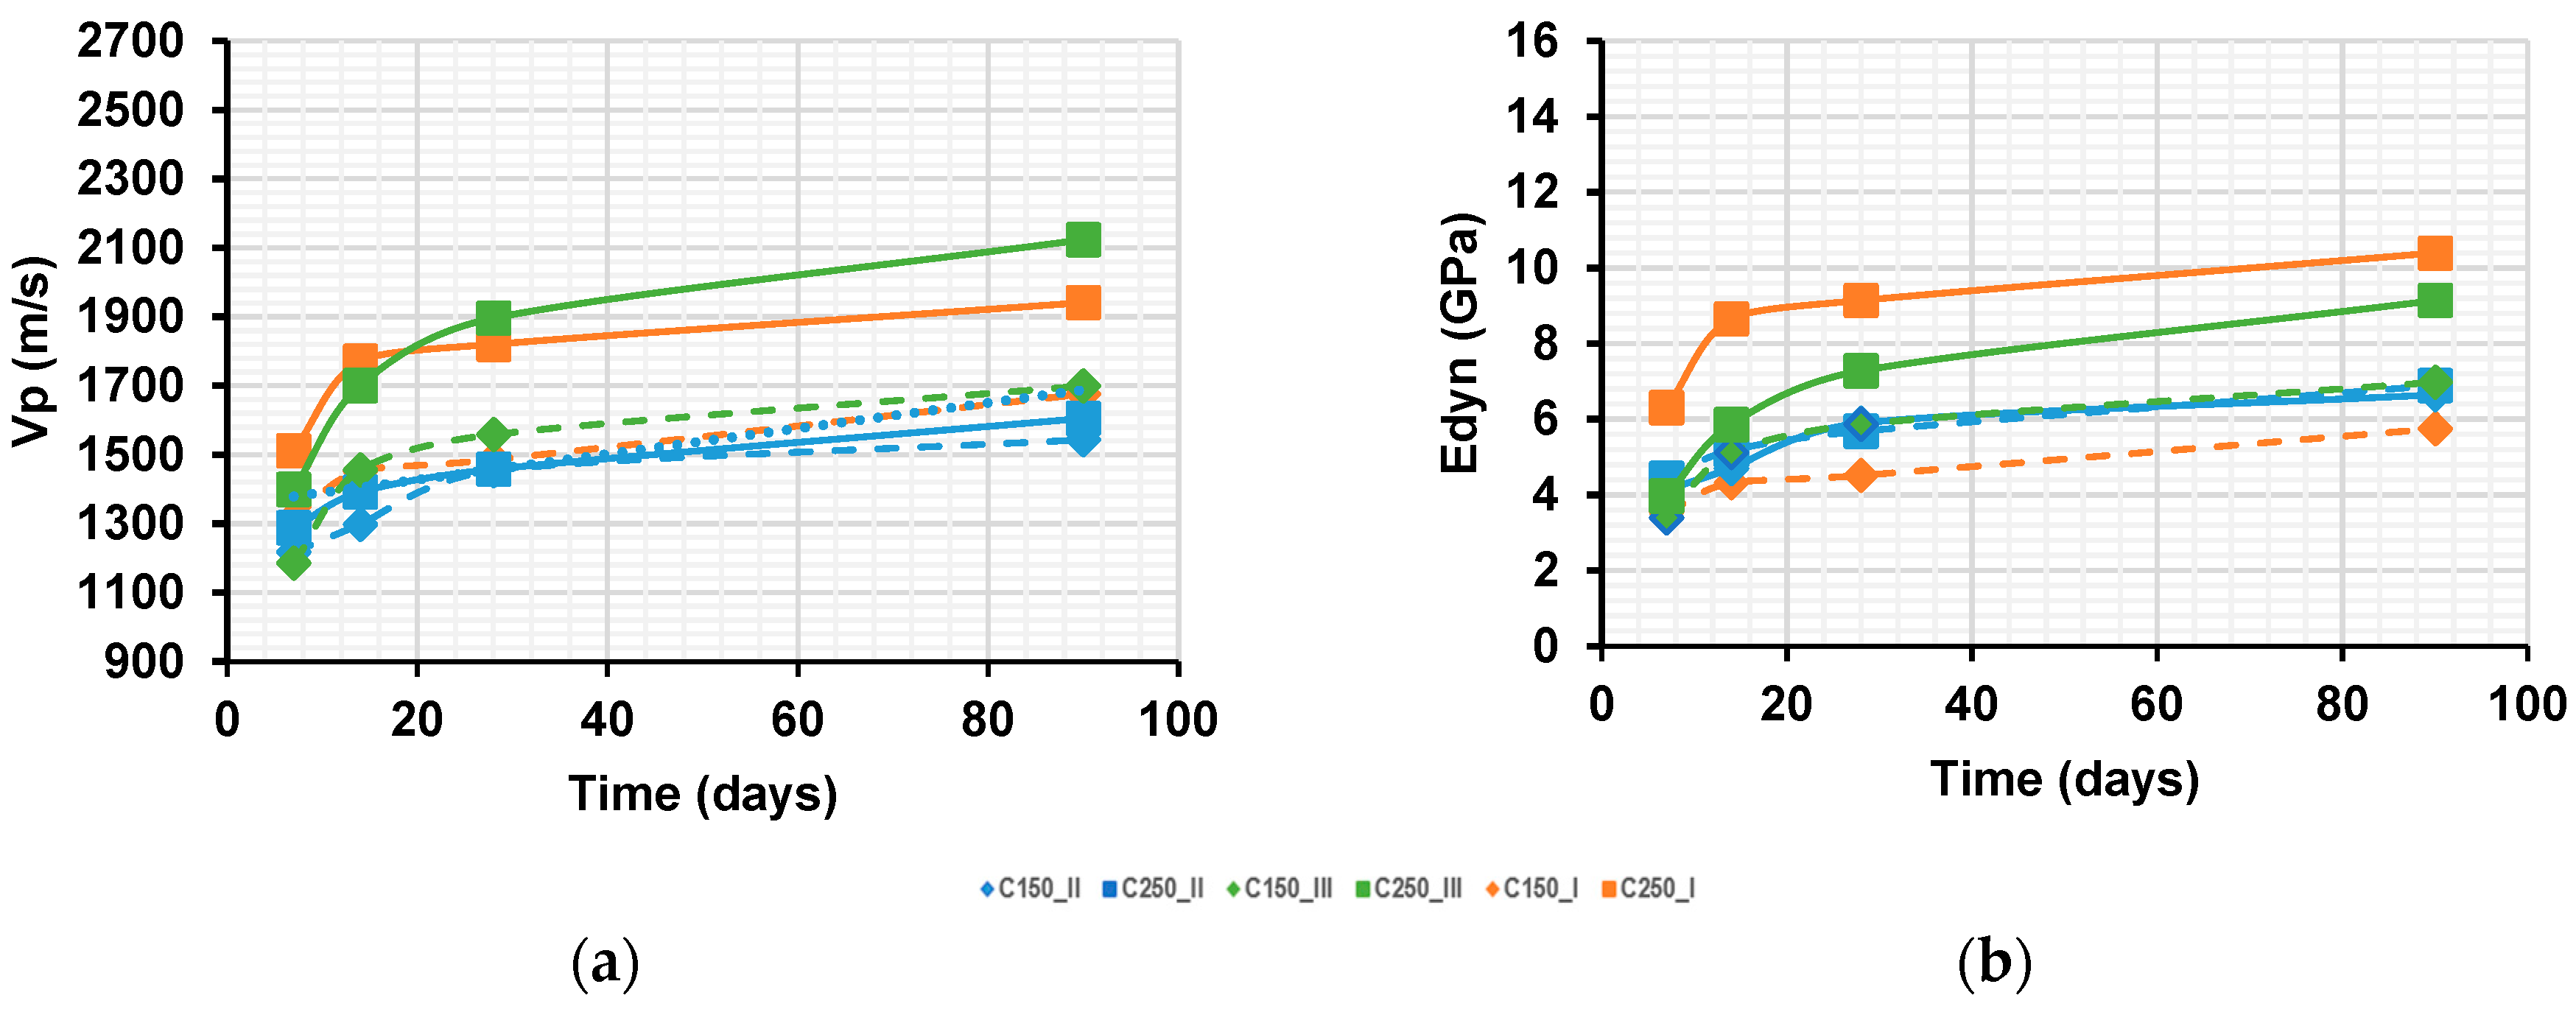
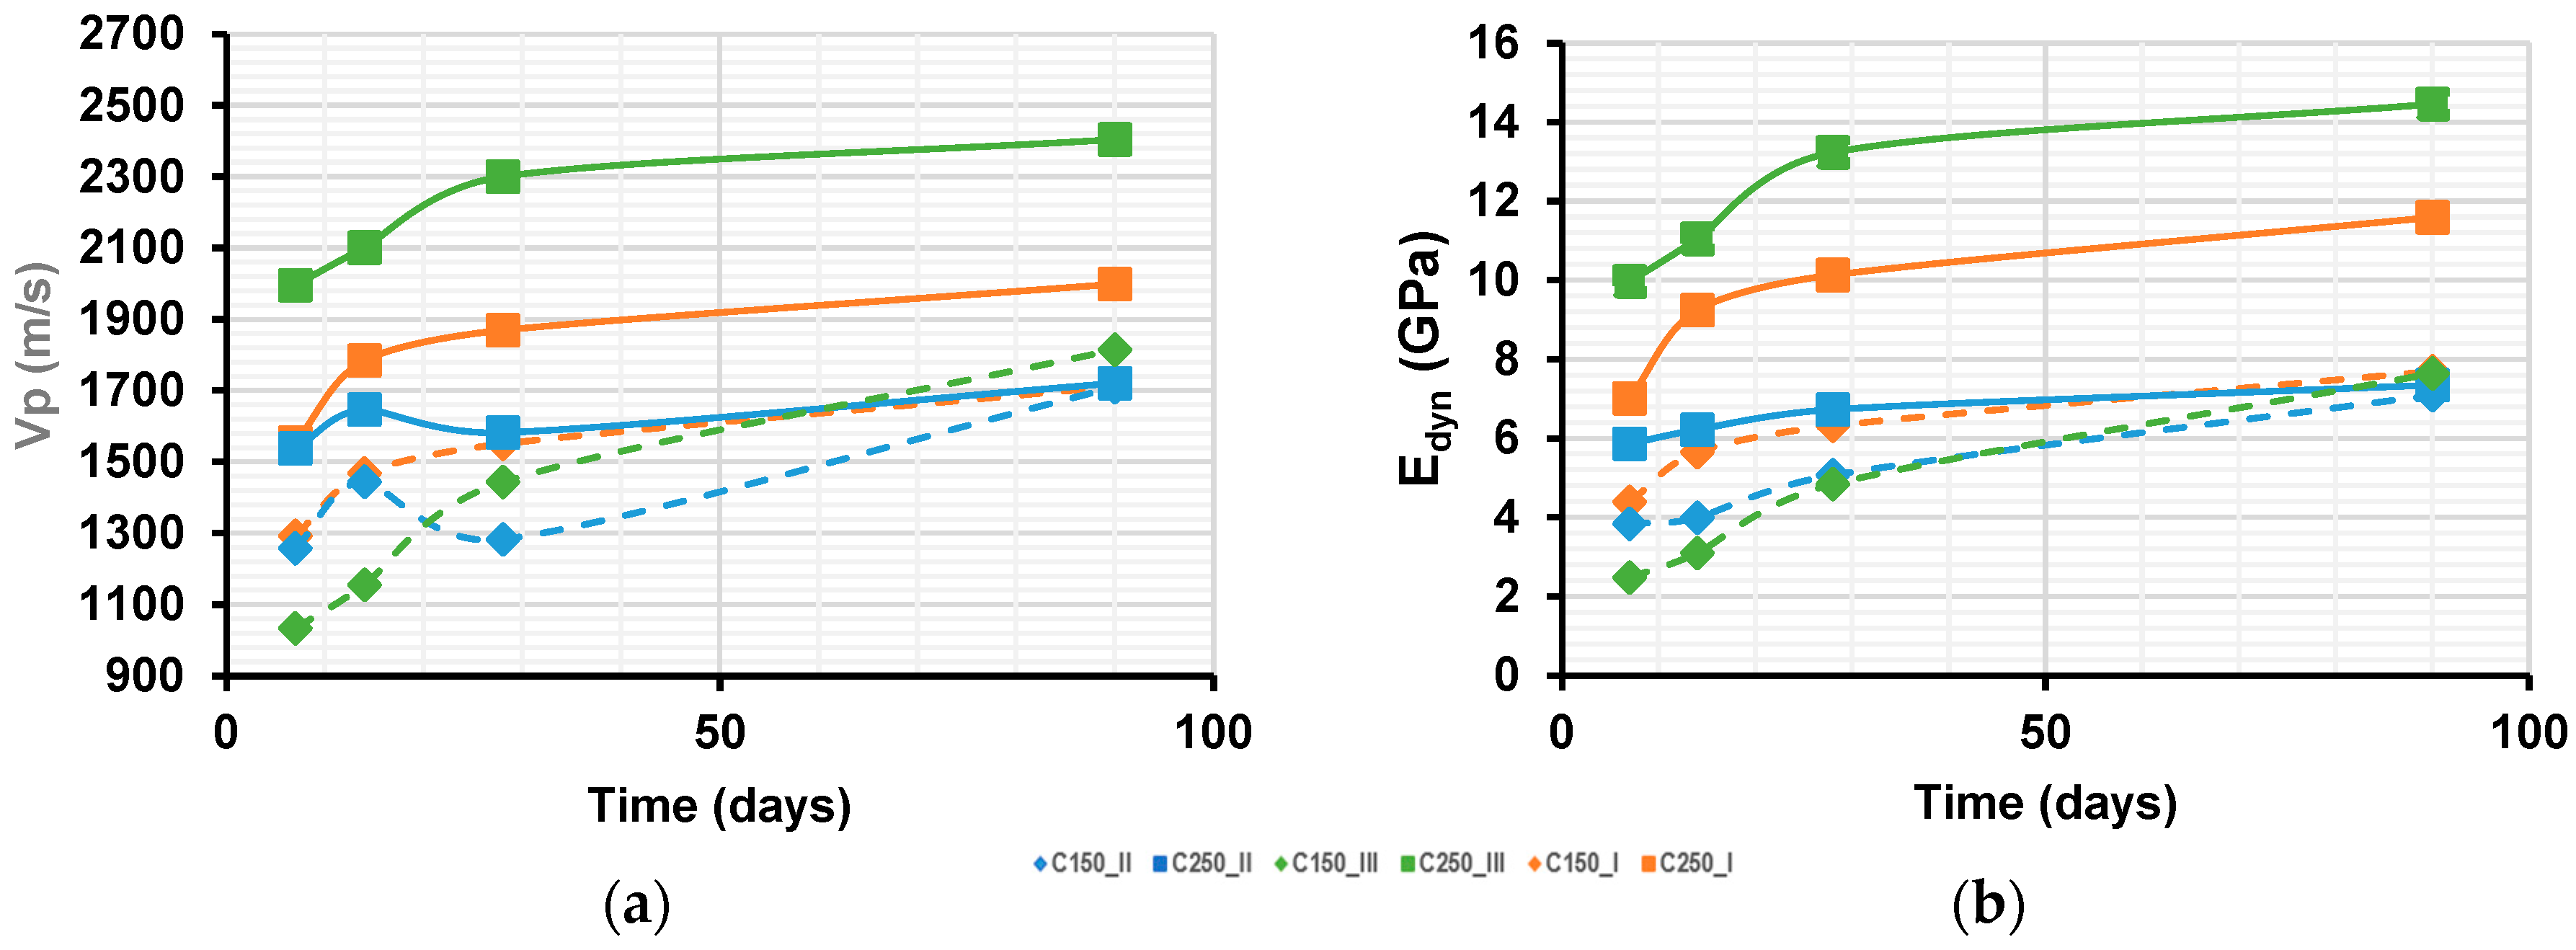
3.2.3. Modulus Dynamic Elasticity

Figure 12, Figure 13 and Figure 14 show the evolution of the P-wave velocities and the value of the dynamic modulus elasticity (Edyn) as a function of time. Both parameters increase with time. For all types of cement used, the P-wave velocities of the soil concrete specimens studied are approximately between 1034 and 2573 m/s, and the dynamic moduli elasticity is between 2.5 and 14.8 GPa. These results are consistent with the work of [30]. Vp and Edyn increase with the cement content but decrease when the amount of clay in the soil increases. The results obtained from all the figures allow us to distinguish two phases in the evolution of Vp and Edyn as a function of time. The first phase is between 7 and 28 days, during which Vp and Edyn increase rapidly, and beyond 28 days, we note that Vp and Edyn increase slowly. This is related to the hydration process of the cement, which allows the rapid development of compressive strengths in the concrete, generally between 7 and 28 days. For high cement content (250 kg/m3), except for LA5 soil concrete, CEM III 32.5 has higher Edyn values than CEM I 52.5 and CEM II 42.5. The same is true for low cement content (150 kg/m3), but in the long term, from 90 days onwards. This is due to the higher compressive strengths of CEM III 32.5 than CEM I 52.5 and CEM II 42.5. It is also interesting to note the importance of Poisson’s ratio in the Edyn calculations, as its inclusion slightly modifies the positions of the curves between figures a and b.

4. Microscopic Observation

Figure 15, Figure 16, Figure 17 and Figure 18 represent SEM (scanning electronic microscopy) observations carried out on the different sandy clay and laterite soil concretes of granular class (0/5), made with CEM I 52.5, CEM II 42.5, and CEM III 32.5.
Ettringite is visible (Figure 15a, Figure 16a, Figure 17a and Figure 18a) on all specimens of sandy clay and laterite-based soil concrete formulated with CEM I 52.5. This visibility is even higher at high cement content (250 kg/m3), which is due to the very high clinker content in the manufacture of CEM I 52.5. We also observe in all the pictures that the CSH (paste) is denser for soil concrete formulated with CEM III 32.5 (Figure 15c, Figure 16c, Figure 17c and Figure 18c), which show a good bonding of the paste-aggregate interface [34]. This explains the fewer pores and consequently fewer cracks in the specimens formulated with CEM III 32.5 compared to those formulated with CEM I 52.5 and CEM II 42.5. It explains not only the better mechanical resistance (uni-axial compression) obtained on soil concrete formulated with CEM III 32.5 but also the lower porosity compared to soil concrete formulated with CEM I 52.5 and CEM II 42.5.

5. Conclusions

The purpose of this research work was to study the influence of the nature of binder on the physical and mechanical properties of soil concrete based on sandy clay and laterite. For this investigation, three different binders and three types of soil were used. The results obtained allow the following conclusions to be drawn:
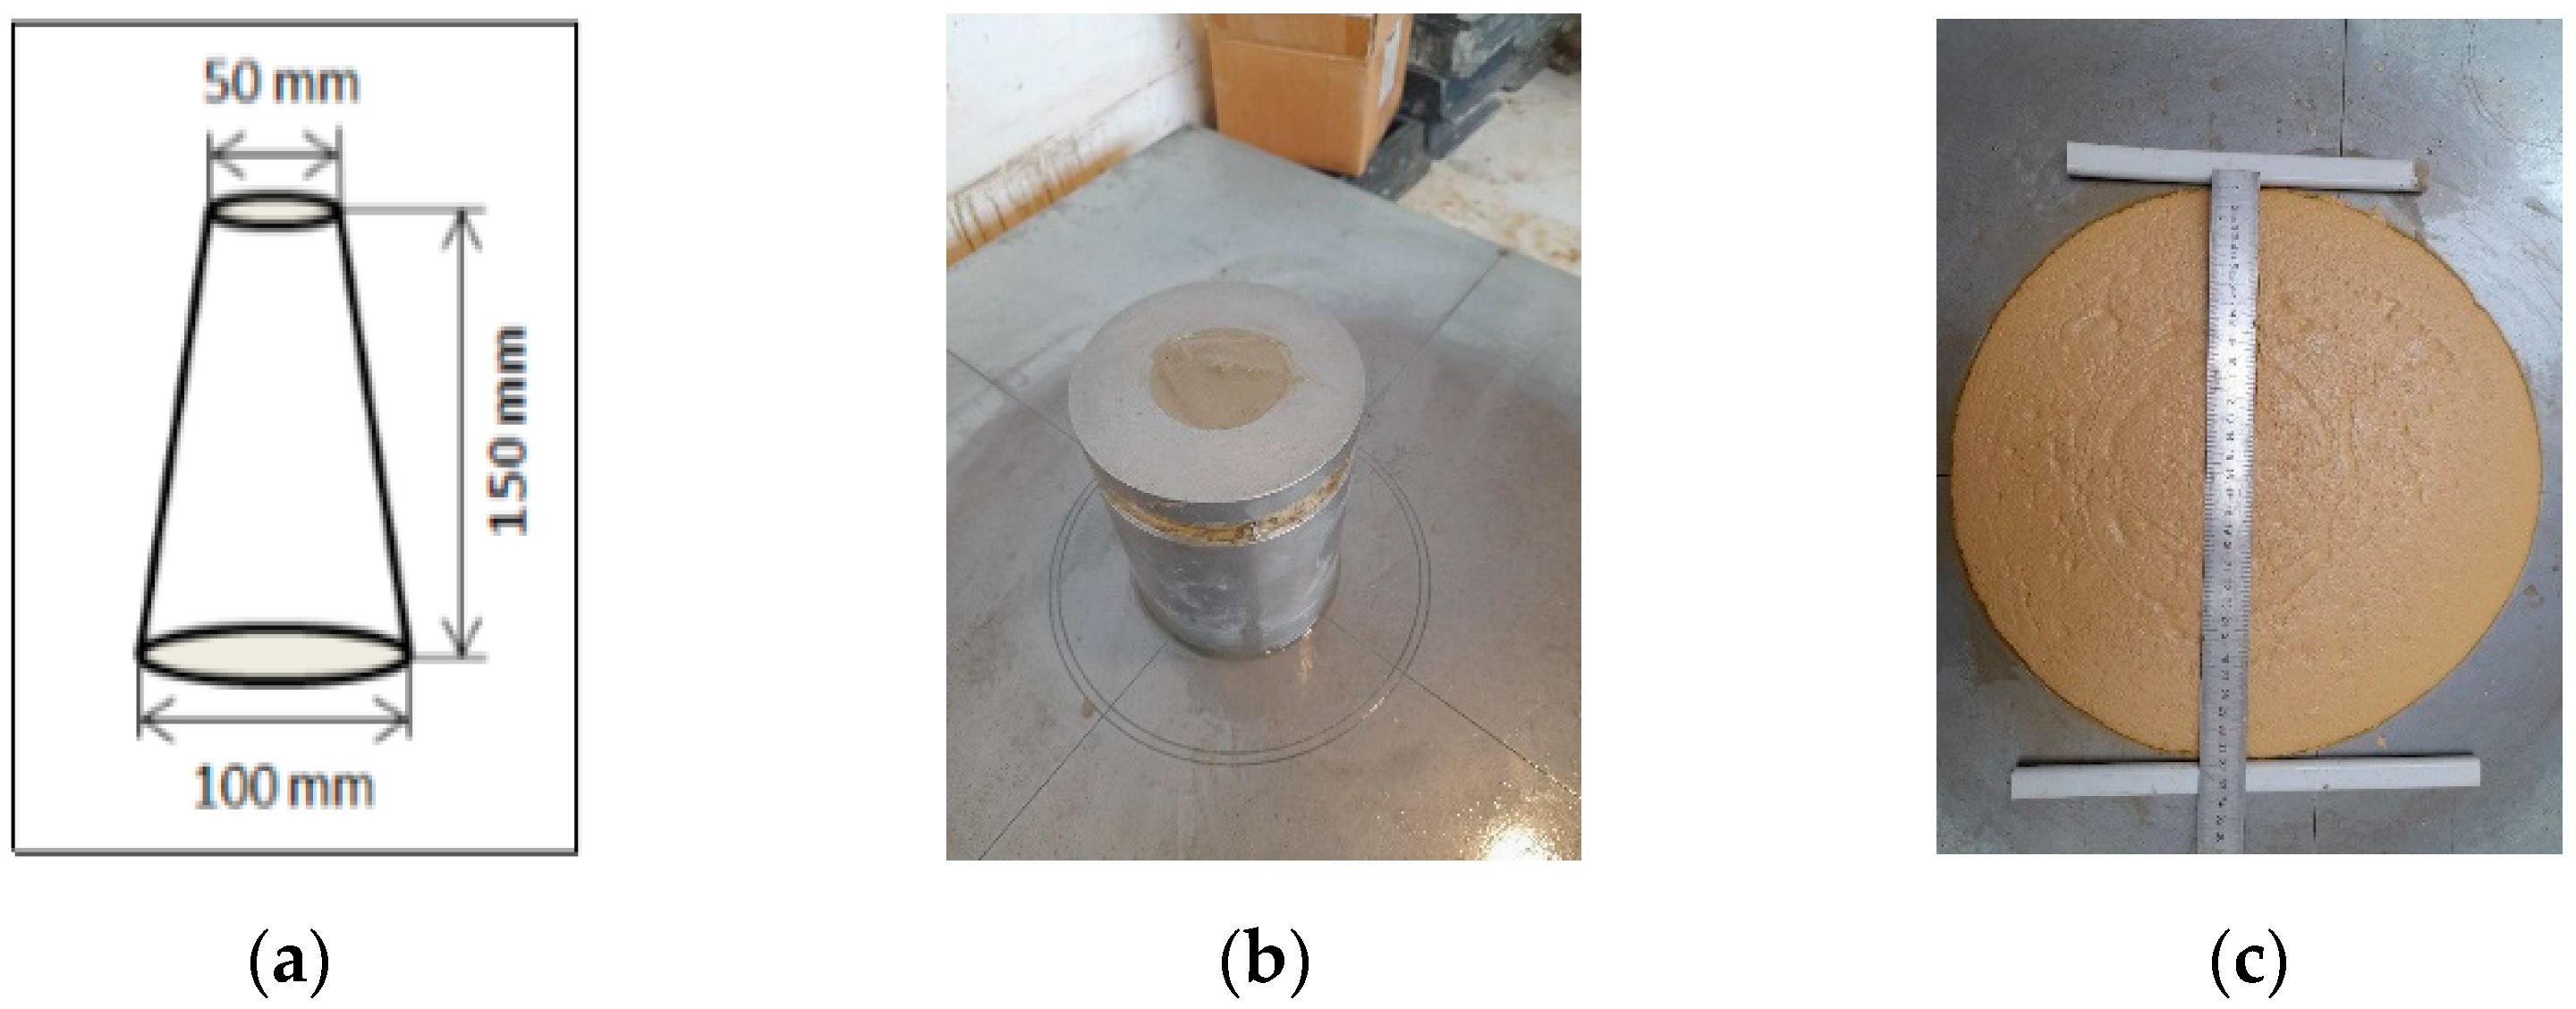
  • For the mixtures made with the three binders, the consistency criterion set (32–33 cm spread) allows for a water content of 570 and 525 kg/m3 for the formulations based, respectively, on a laterite of 5 mm and sandy clay. This is due to the higher Ip of LA (33.81%) than the Ip of SA (27.06%).
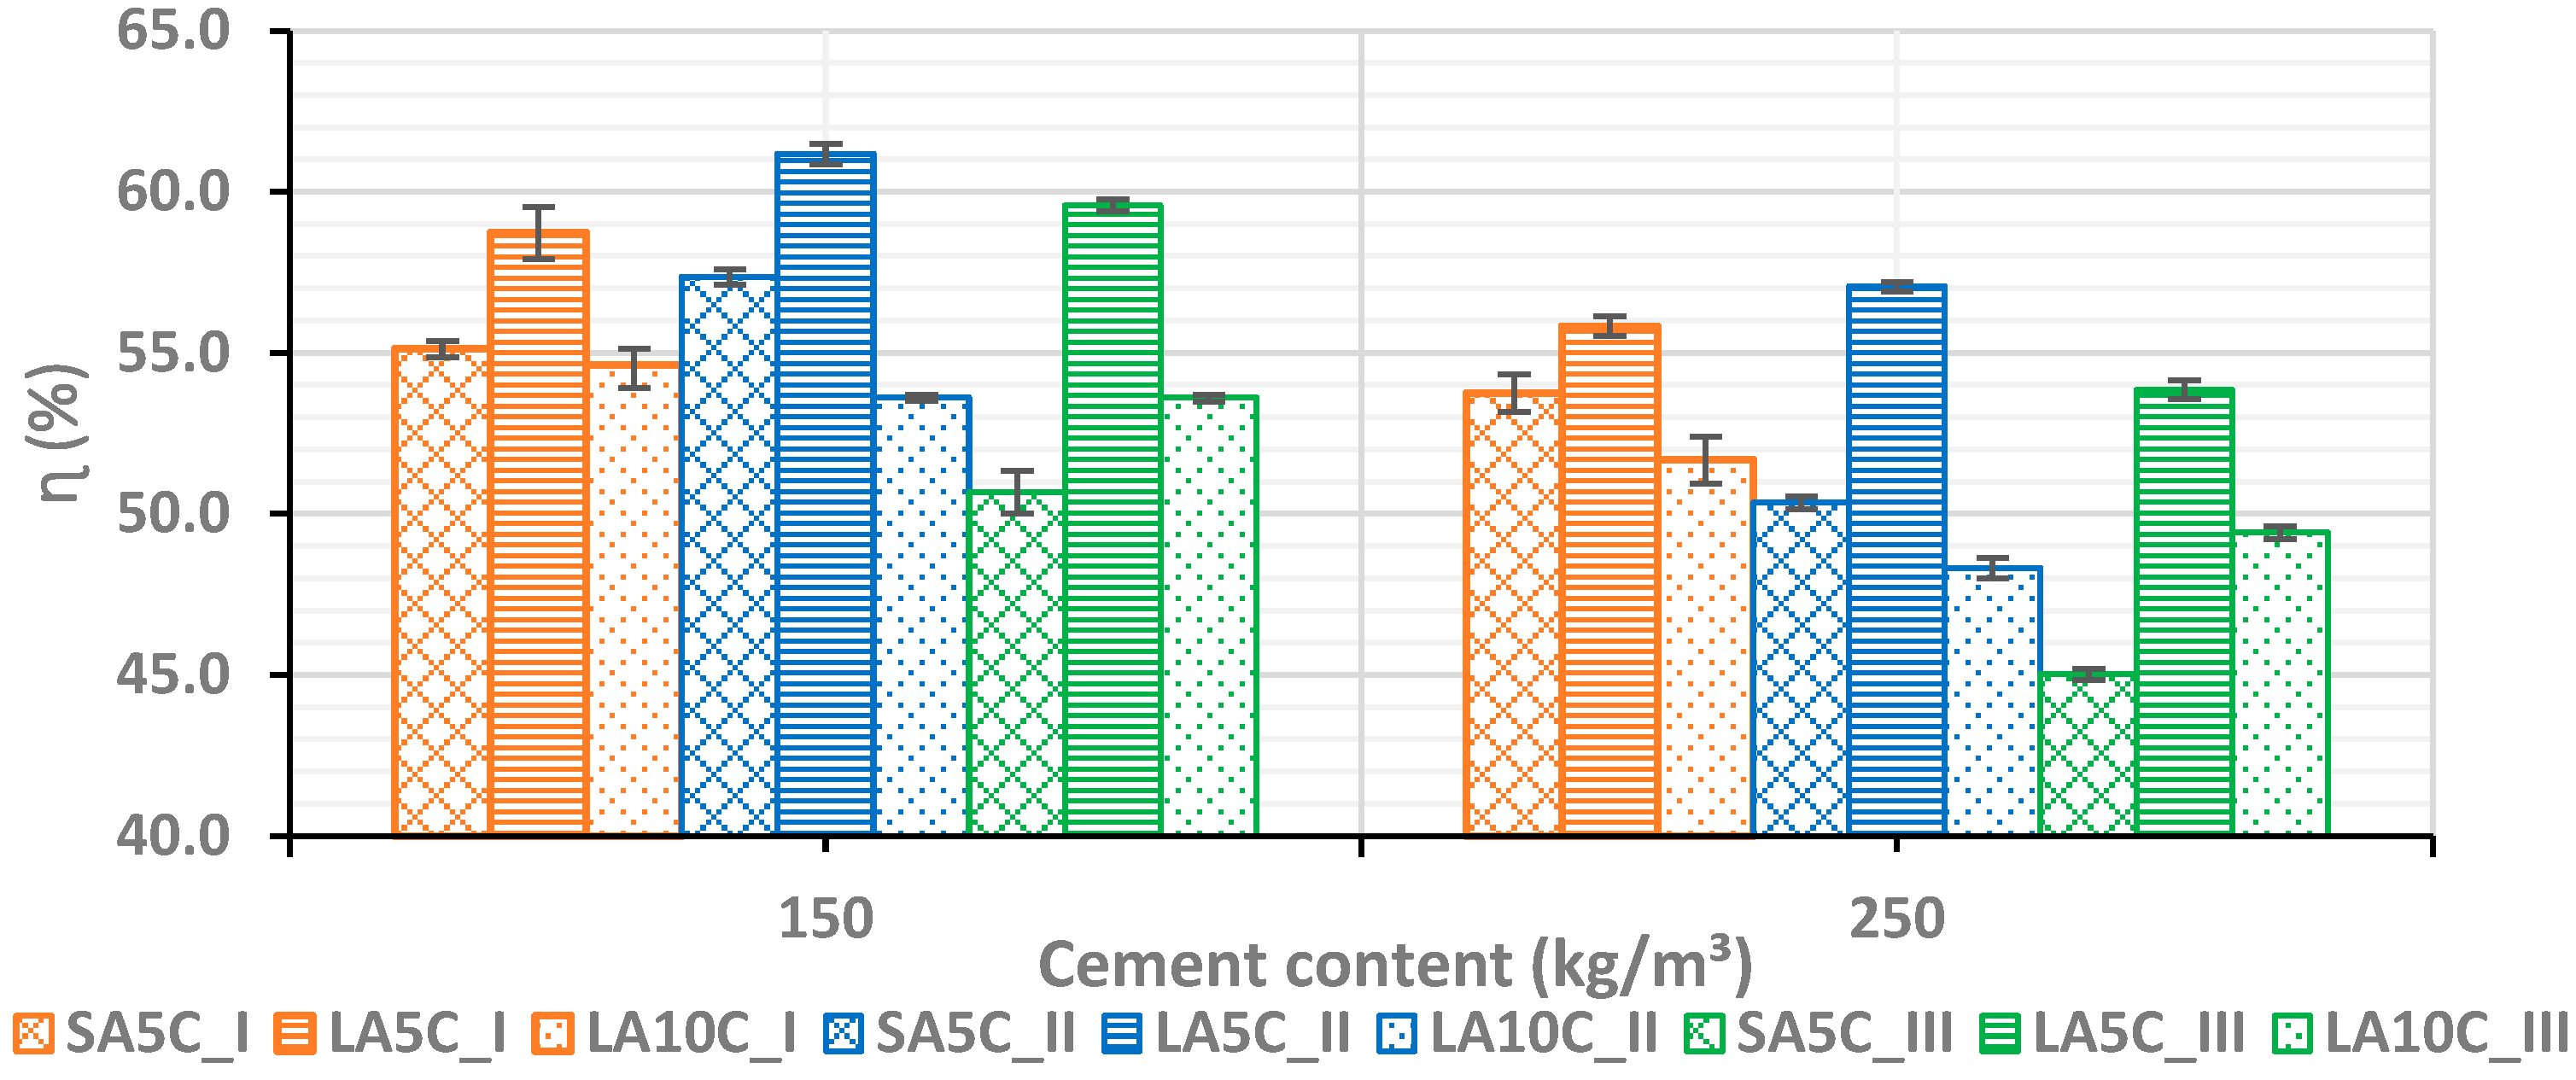
  • The porosity values are between 43 and 62% for all mixes. This is due to the very high water content required for the formulation of our material. For all types of soil, the lowest values of water porosity were obtained for soil concrete formulated with CEM III 32.5, followed by CEM I 52.5 and CEM II 42.5.
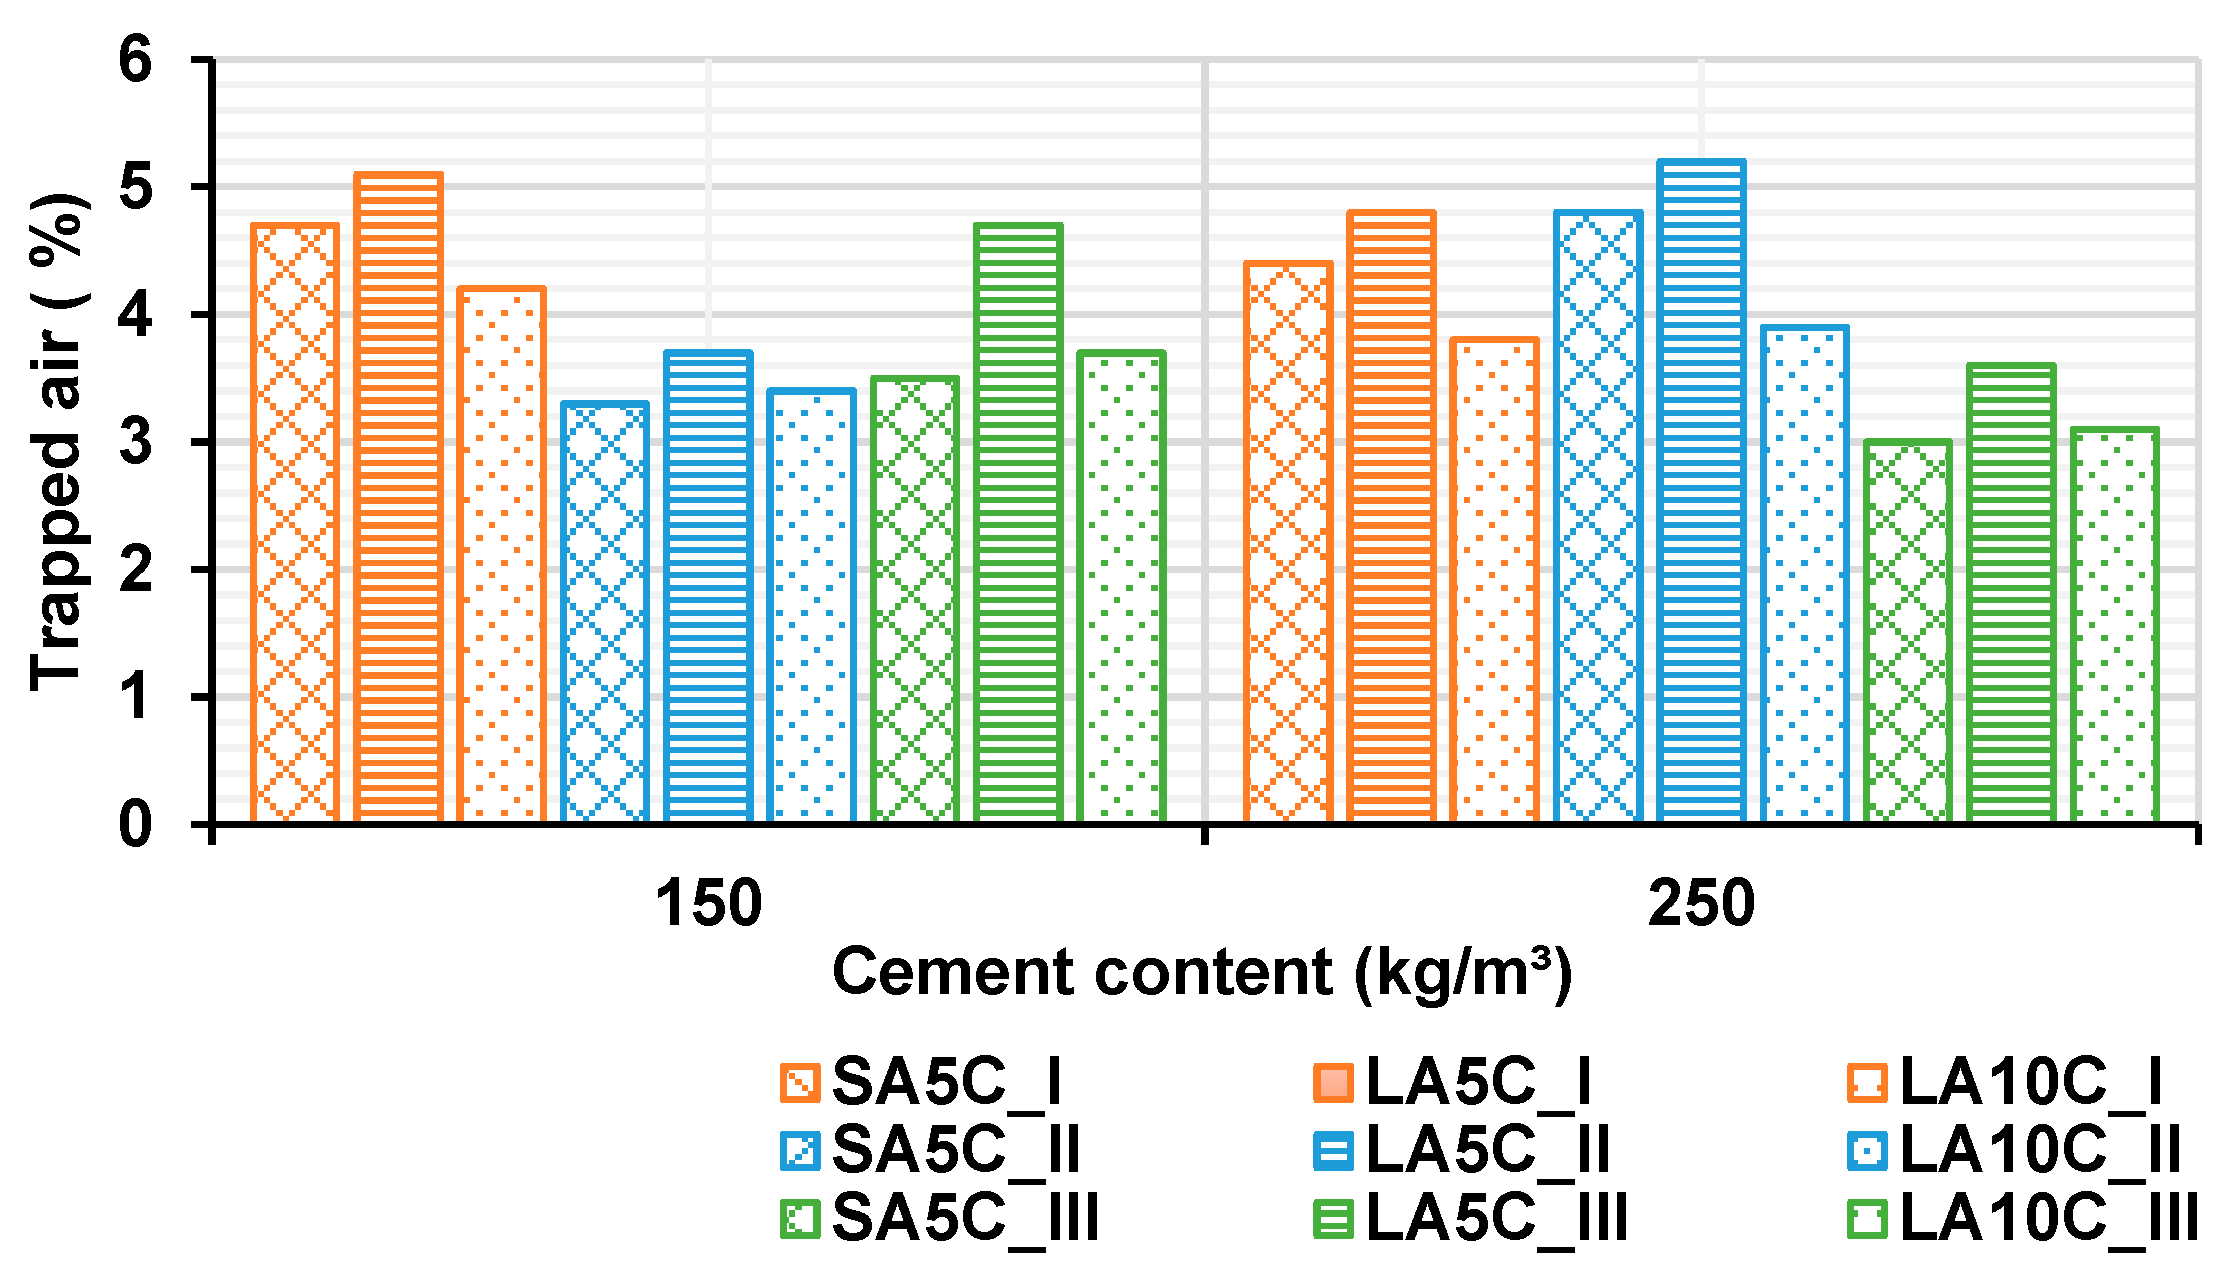
  • The values of the occluded air content are higher in soil concrete formulated with CEM I 52.5, followed by CEM II 42.5, and finally CEM III 32.5. We note a decrease in the occluded air content as a function of the cement dosage.
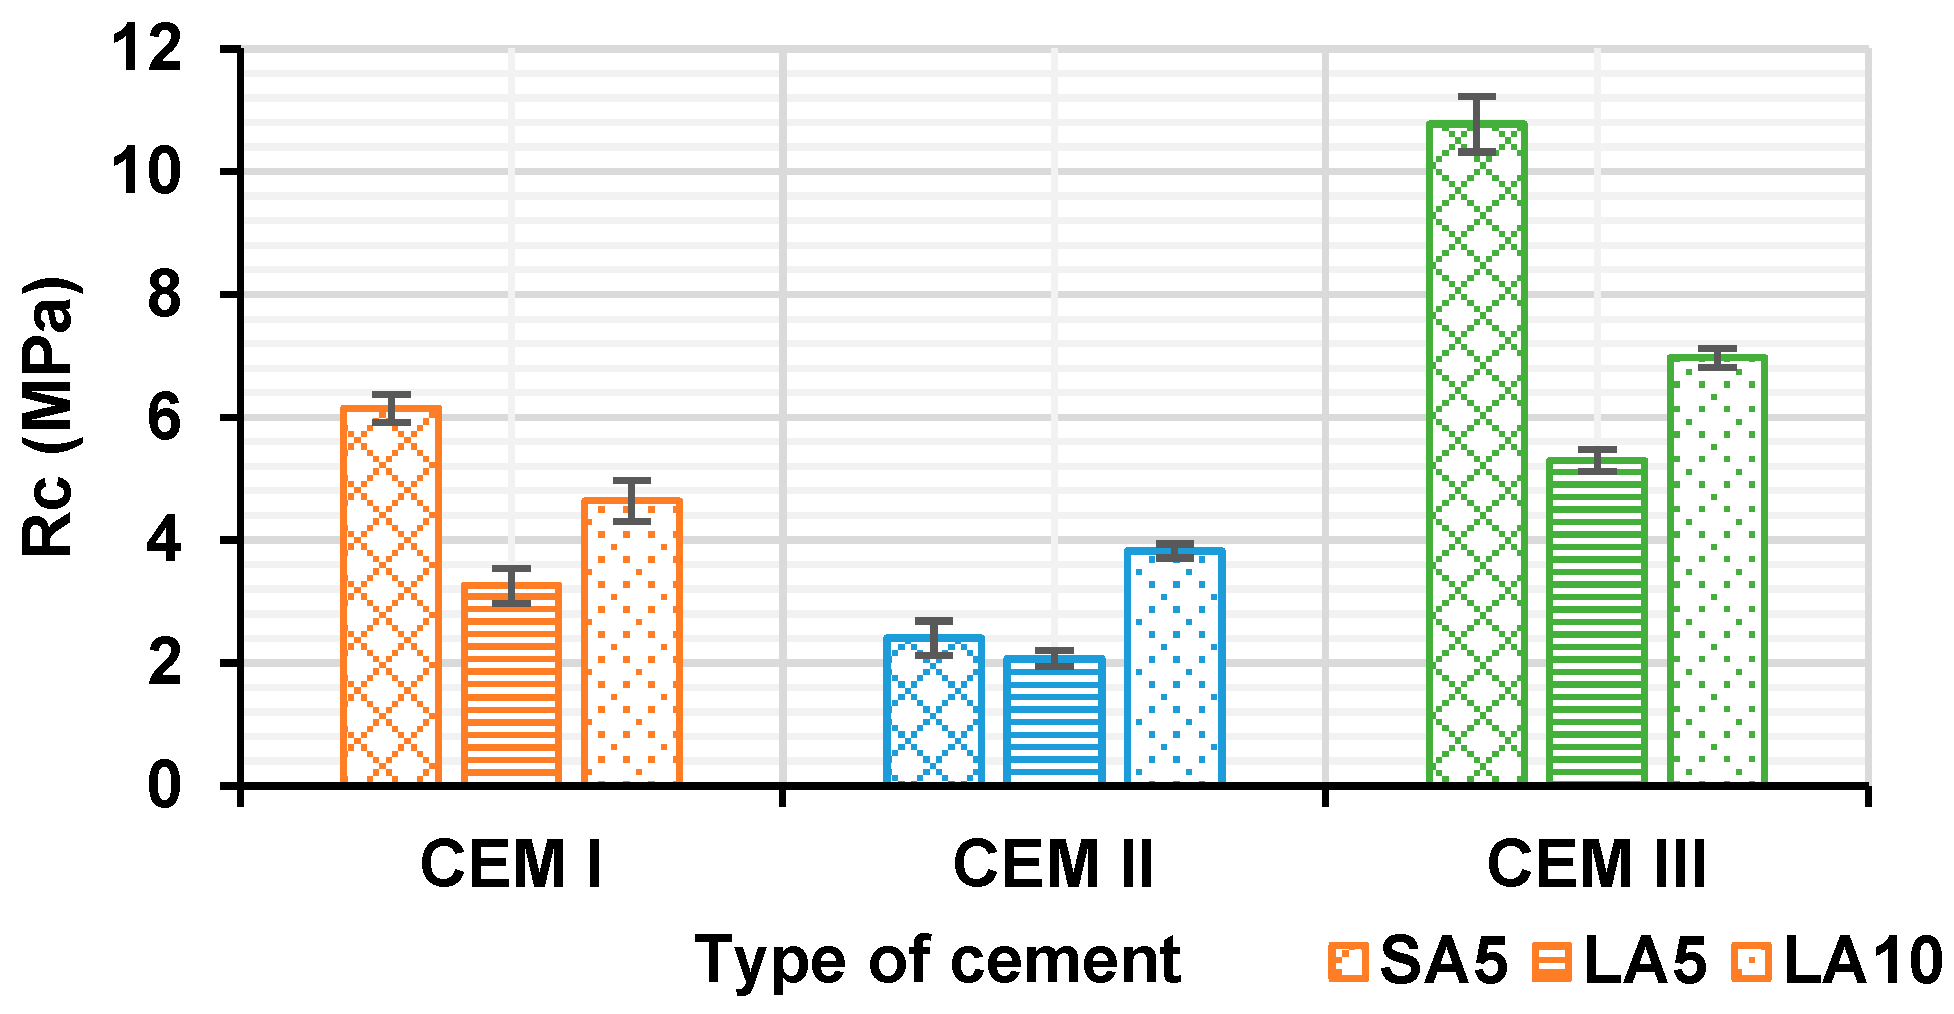
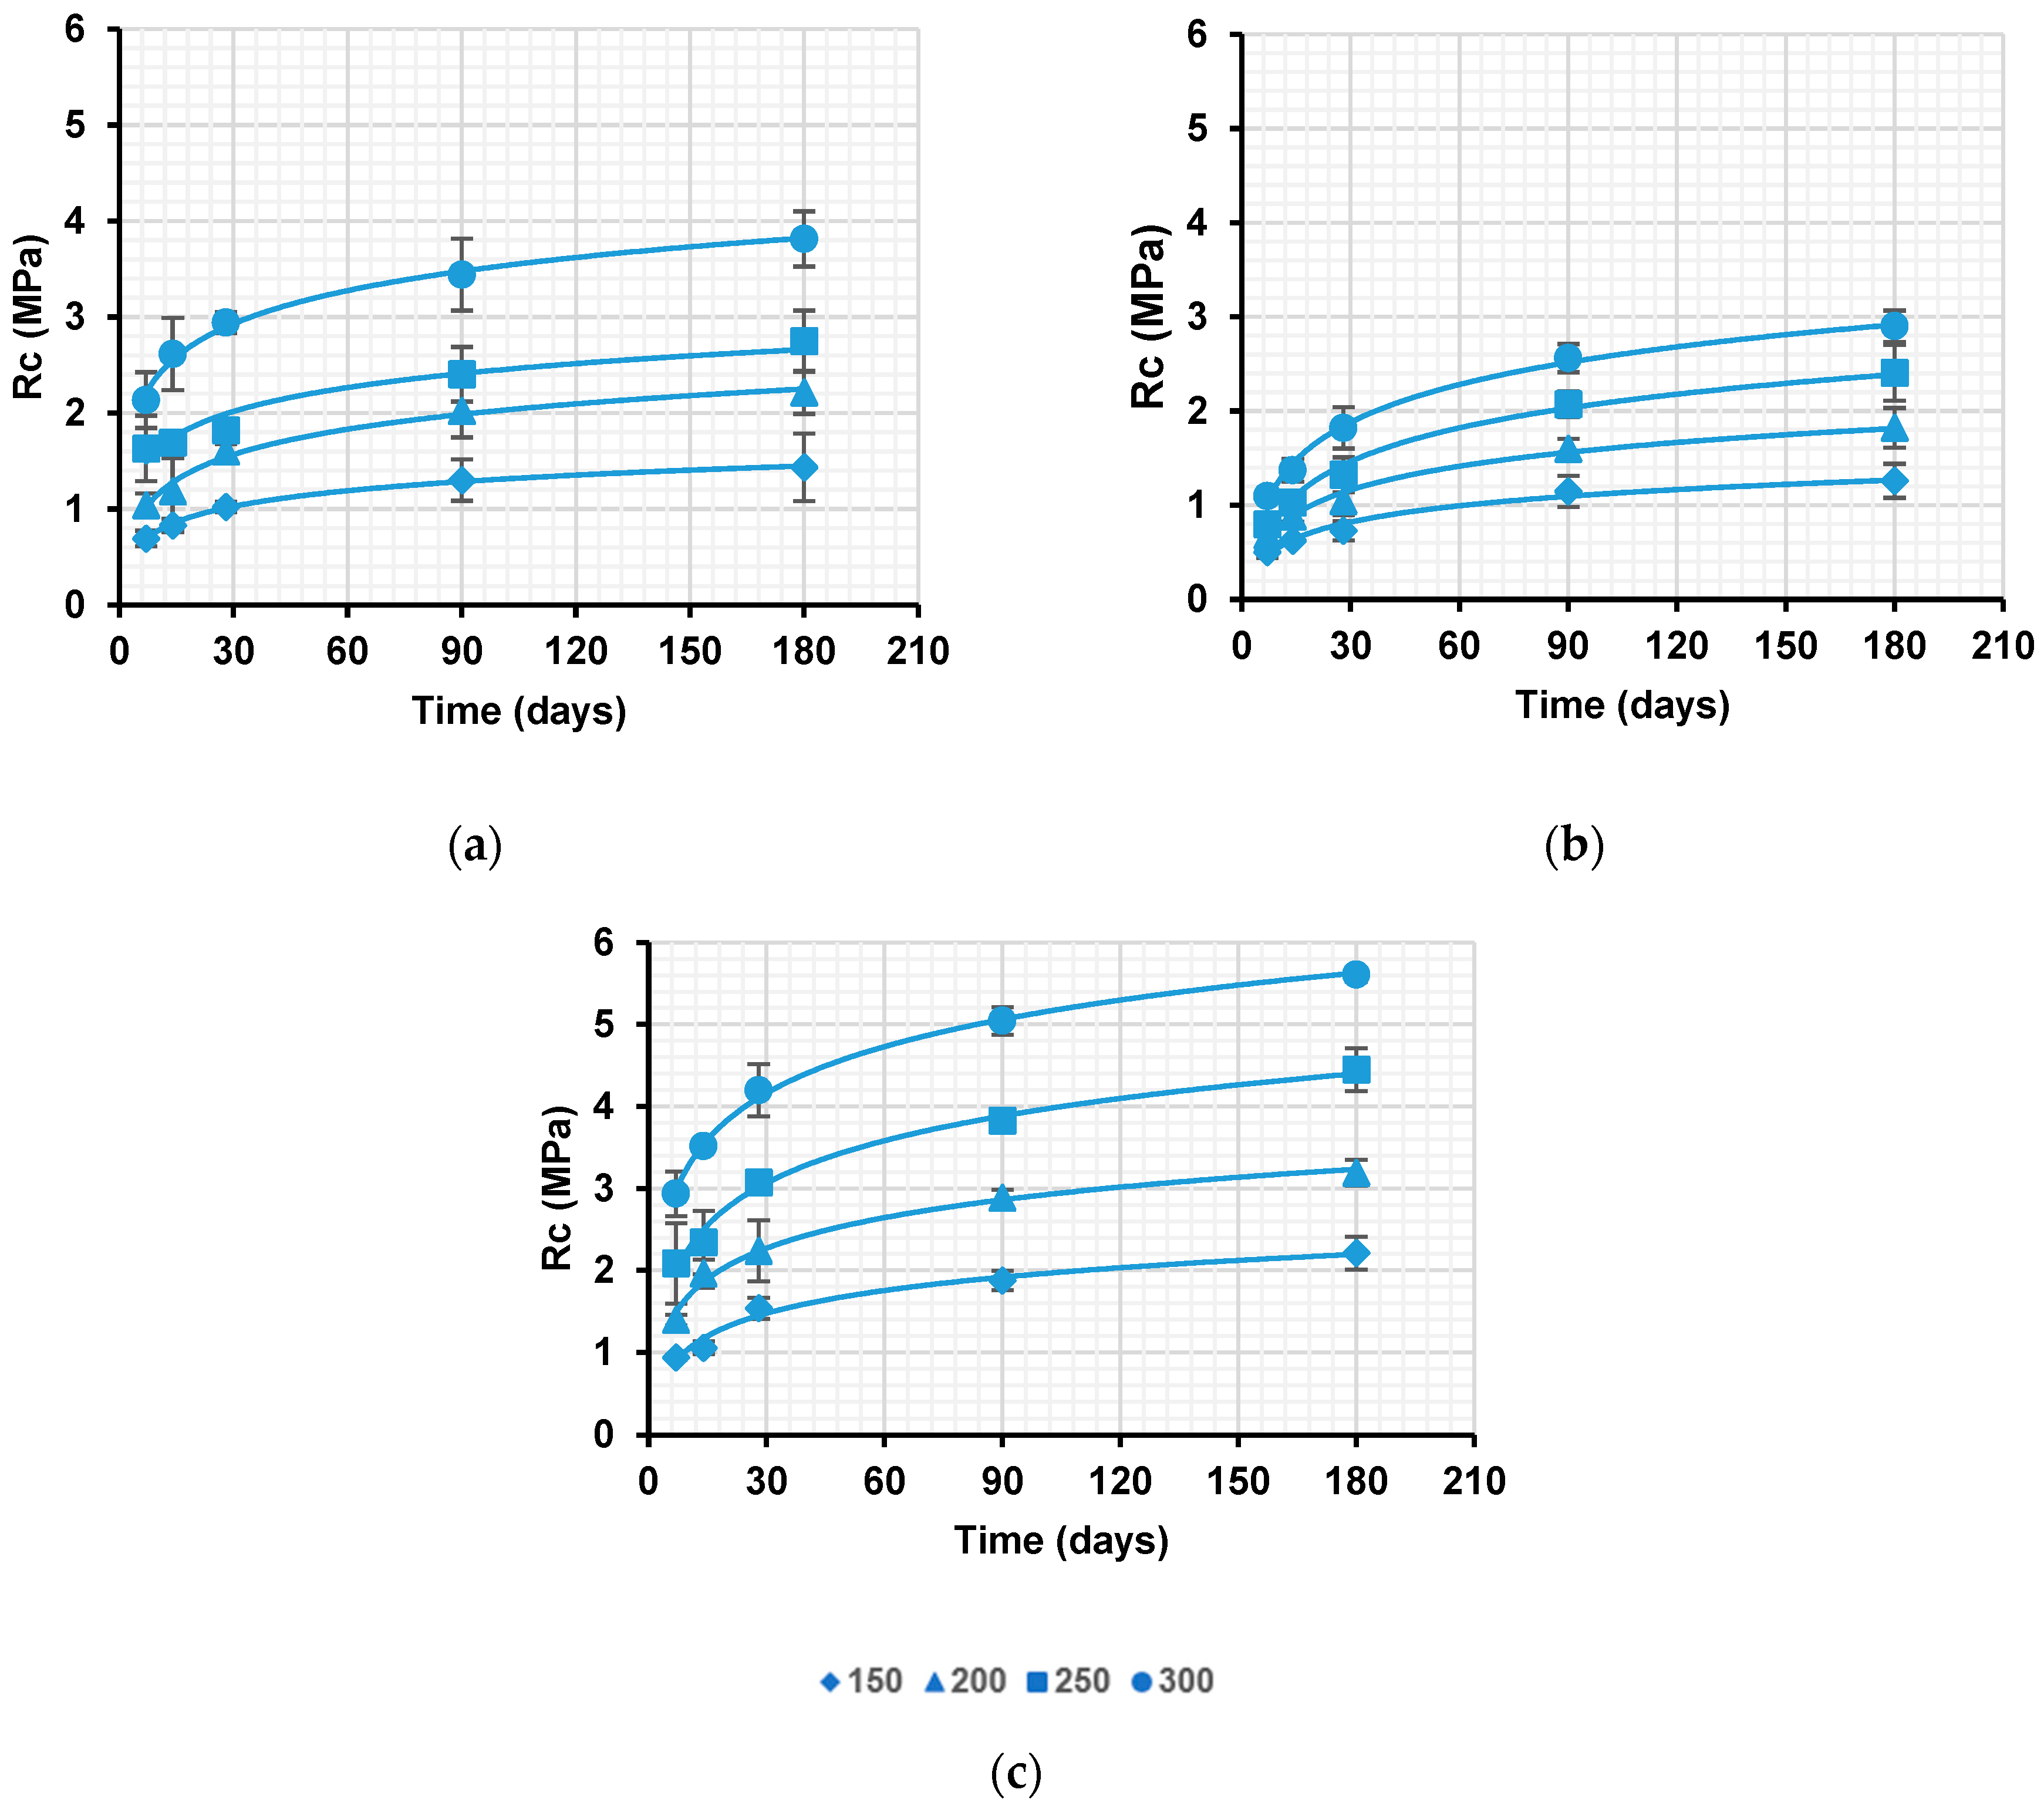
  • The highest compressive strength values are observed on the different specimens formulated with CEM III 32.5, followed by CEM I 52.5 and CEM II 42.5. These higher values are obtained on specimens based on sandy clay. This indicates a better compatibility of this soil due to its lower clay content than that of the laterite.
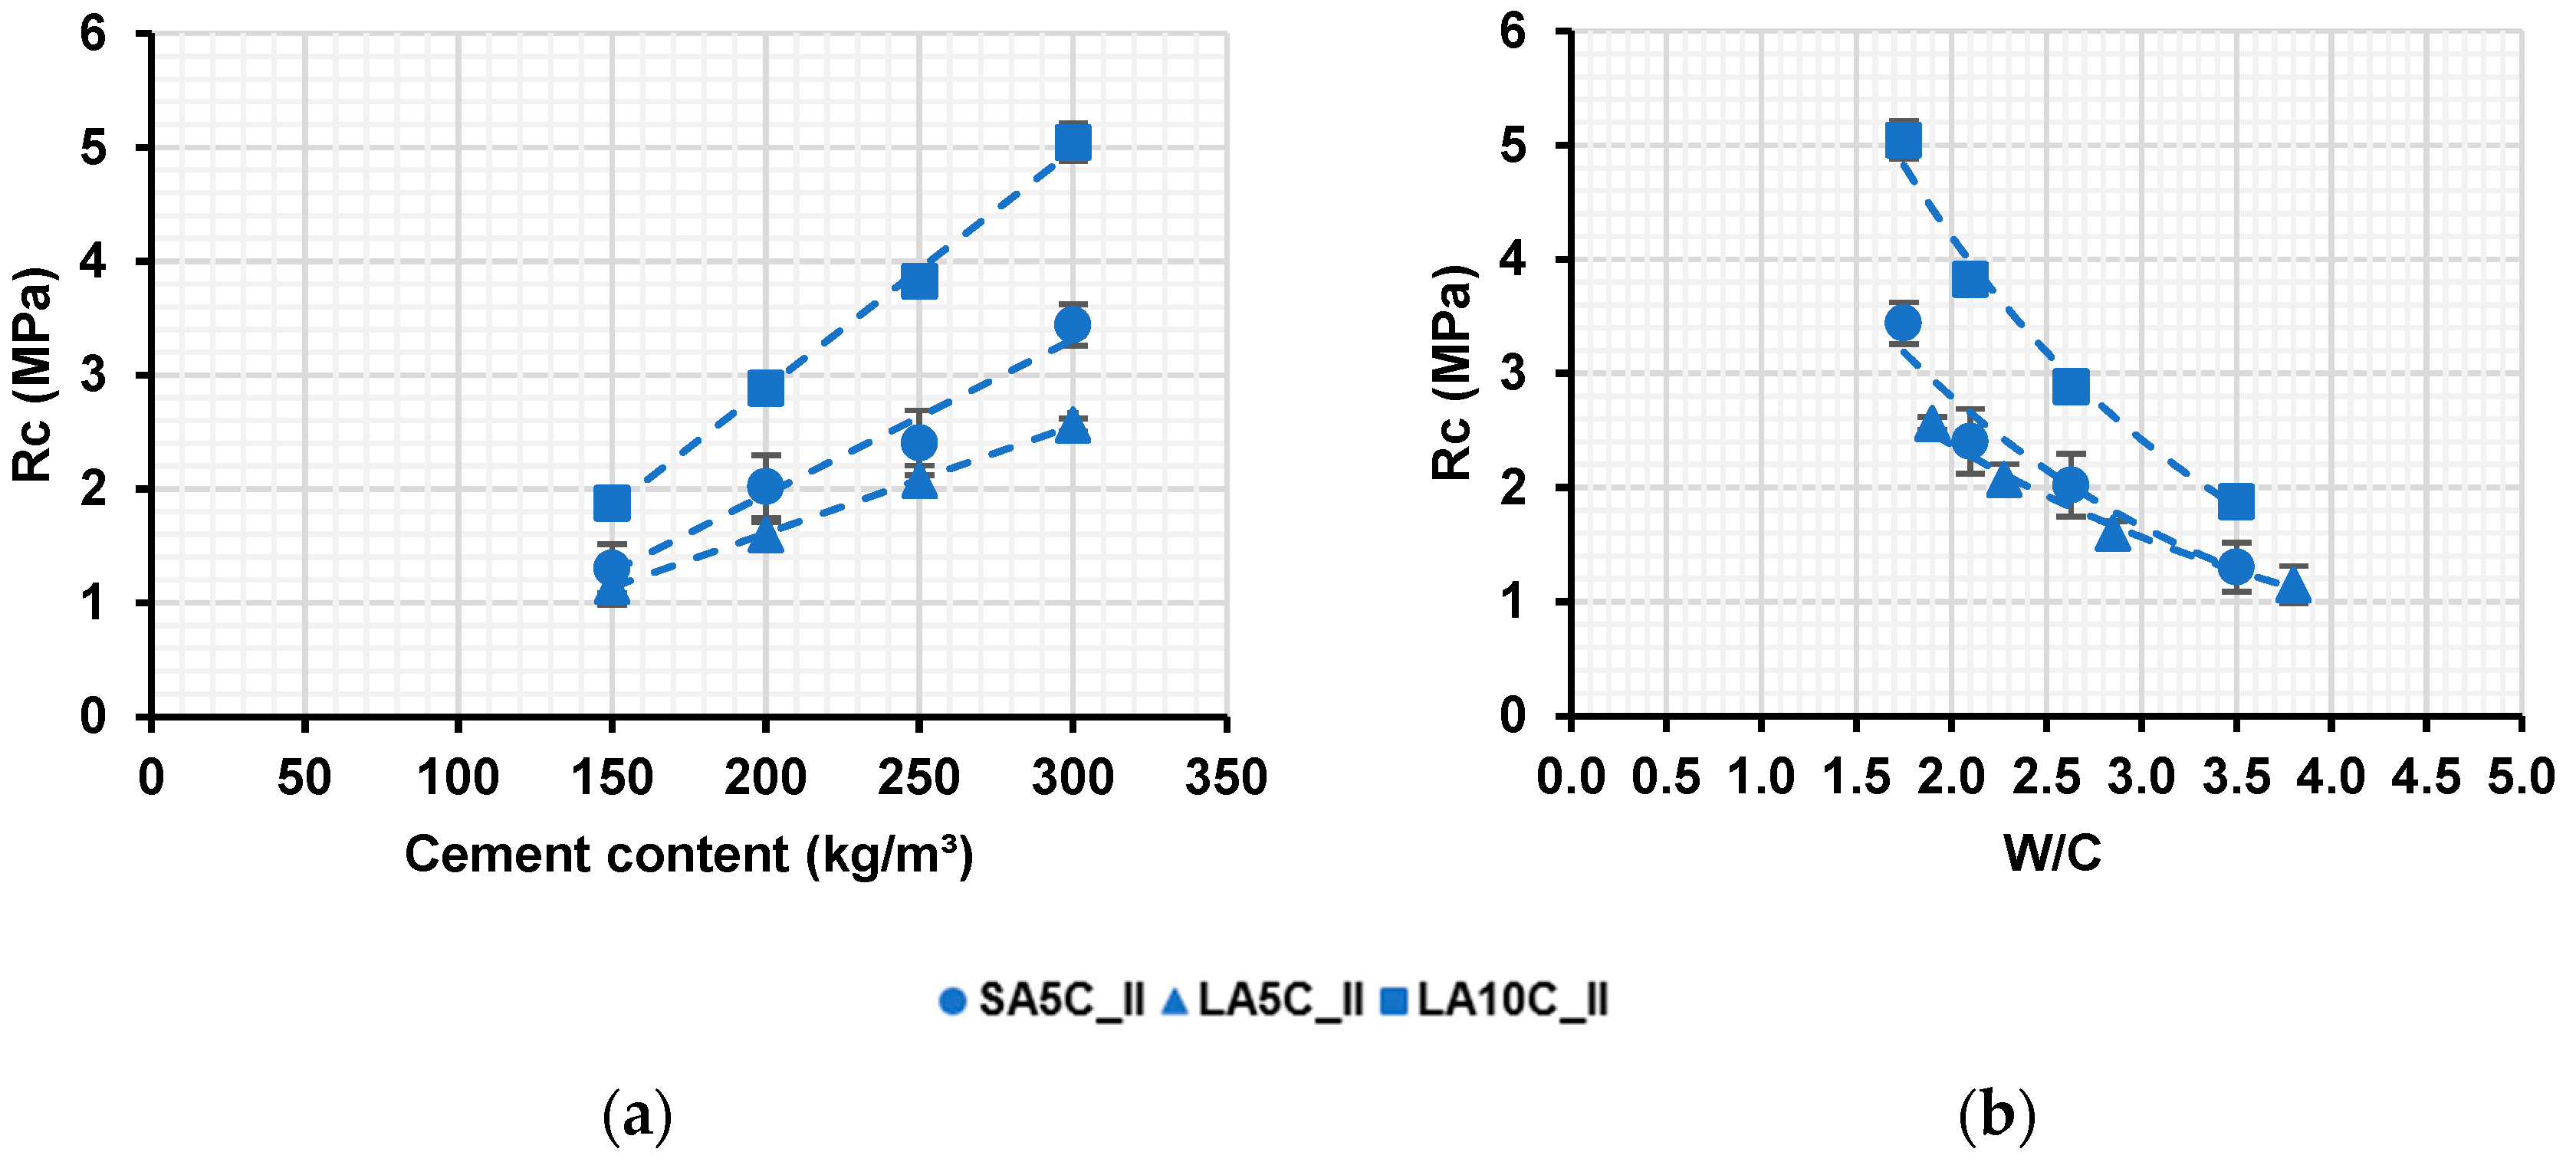
  • The analysis of the compressive strength as a function of the W/C parameter allows us to say that whatever the nature of the cement and the soil used, the compressive strength decreases as a function of the W/C ratio.
  • The values of the static modulus increase as a function of the cement content. The highest values are obtained for formulations with CEM III 32.5 (1.8 to 3.9 GPa), followed by CEM I 52.5 (1 to 2.5 GPa), and finally CEM II 42.5 (0.5 to 1.5 GPa).
  • Whatever the cement used, we note a rapid evolution of the dynamic Young’s modulus values up to 28 days. These values also increase with the cement dosage and are higher for soil concretes formulated with CEM III 32.5.
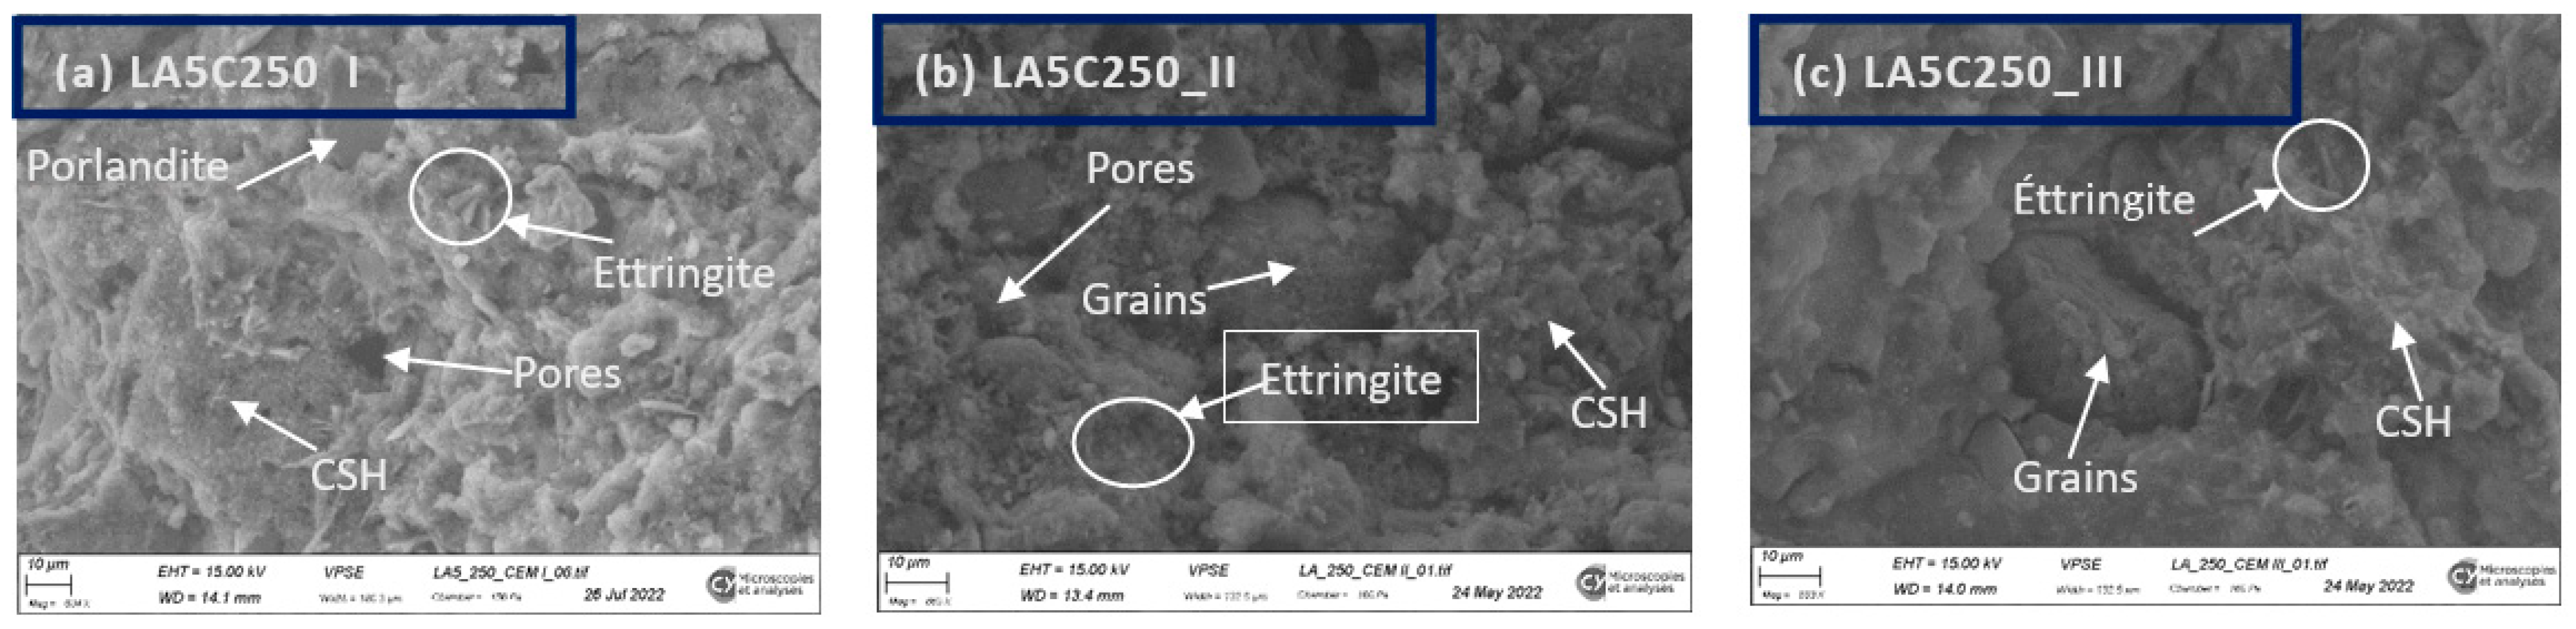
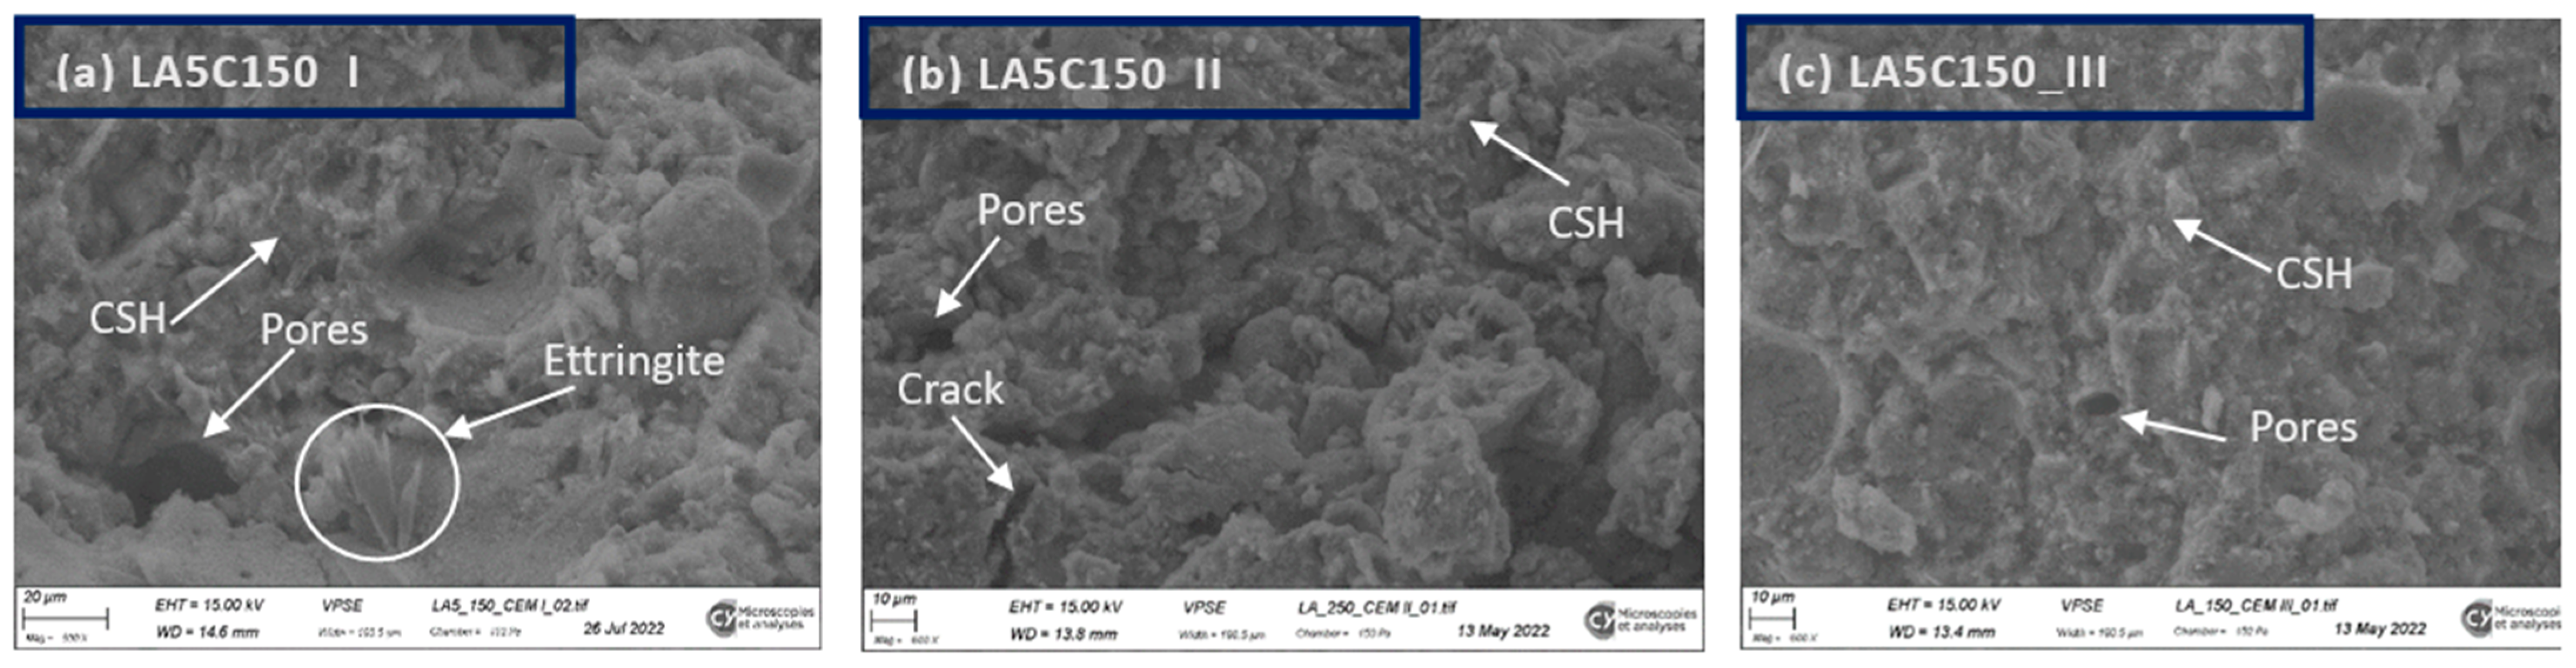
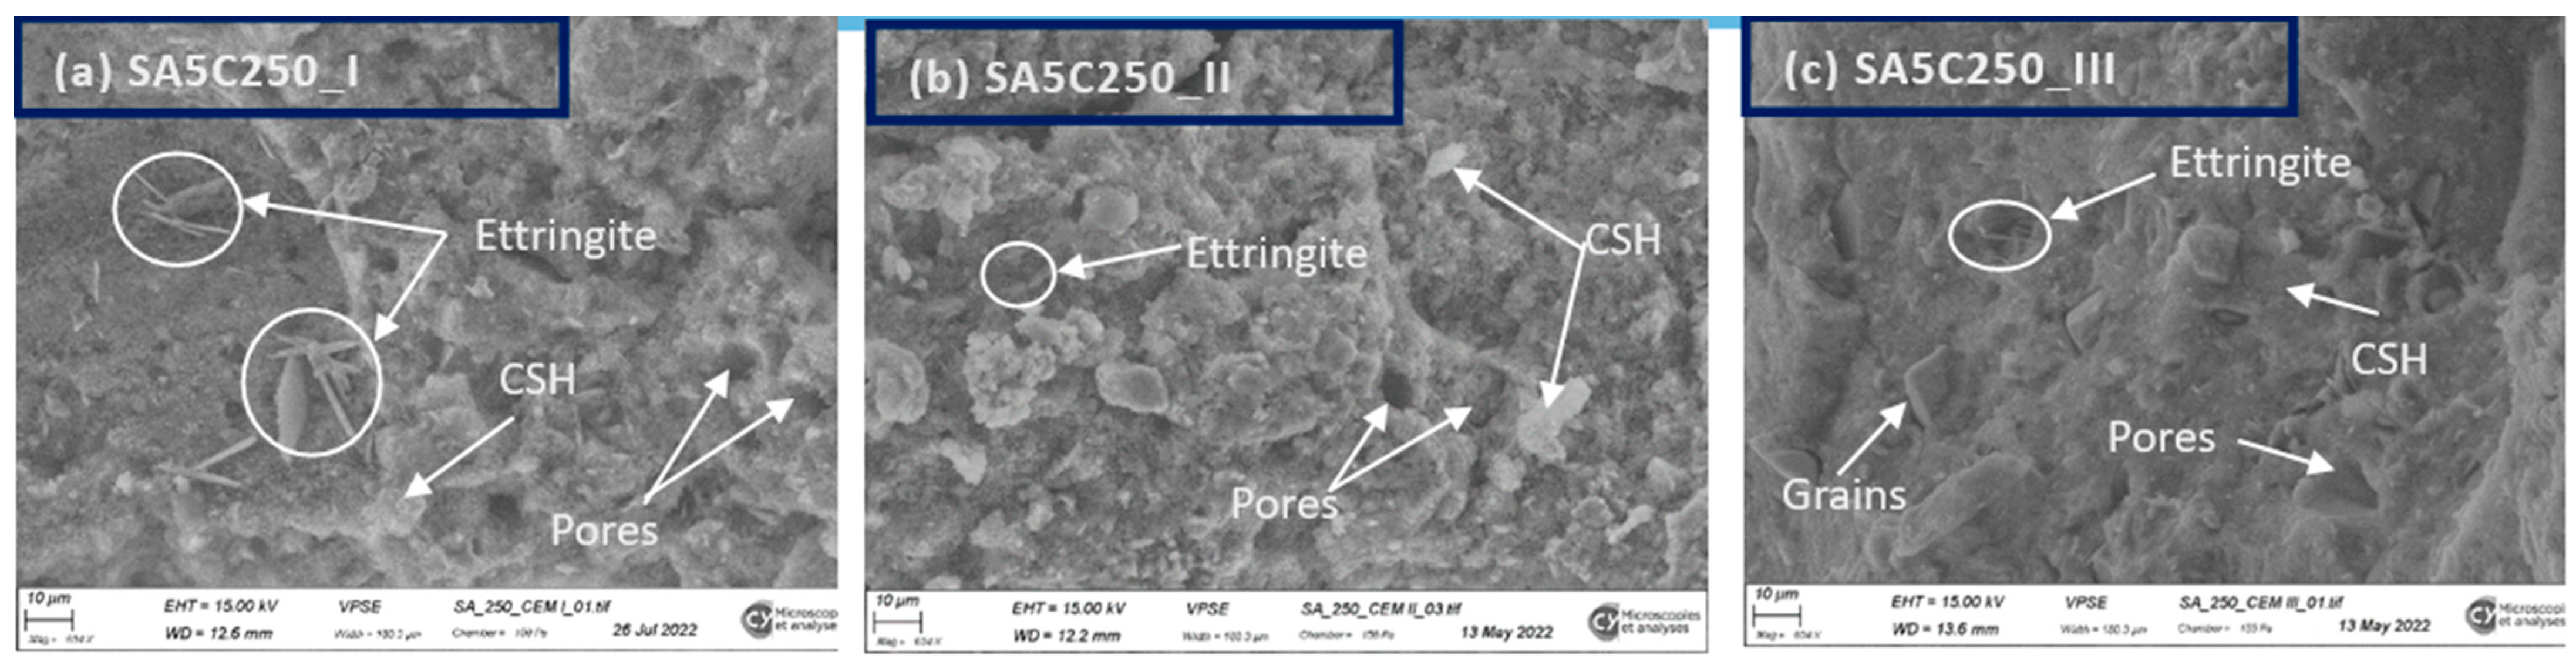
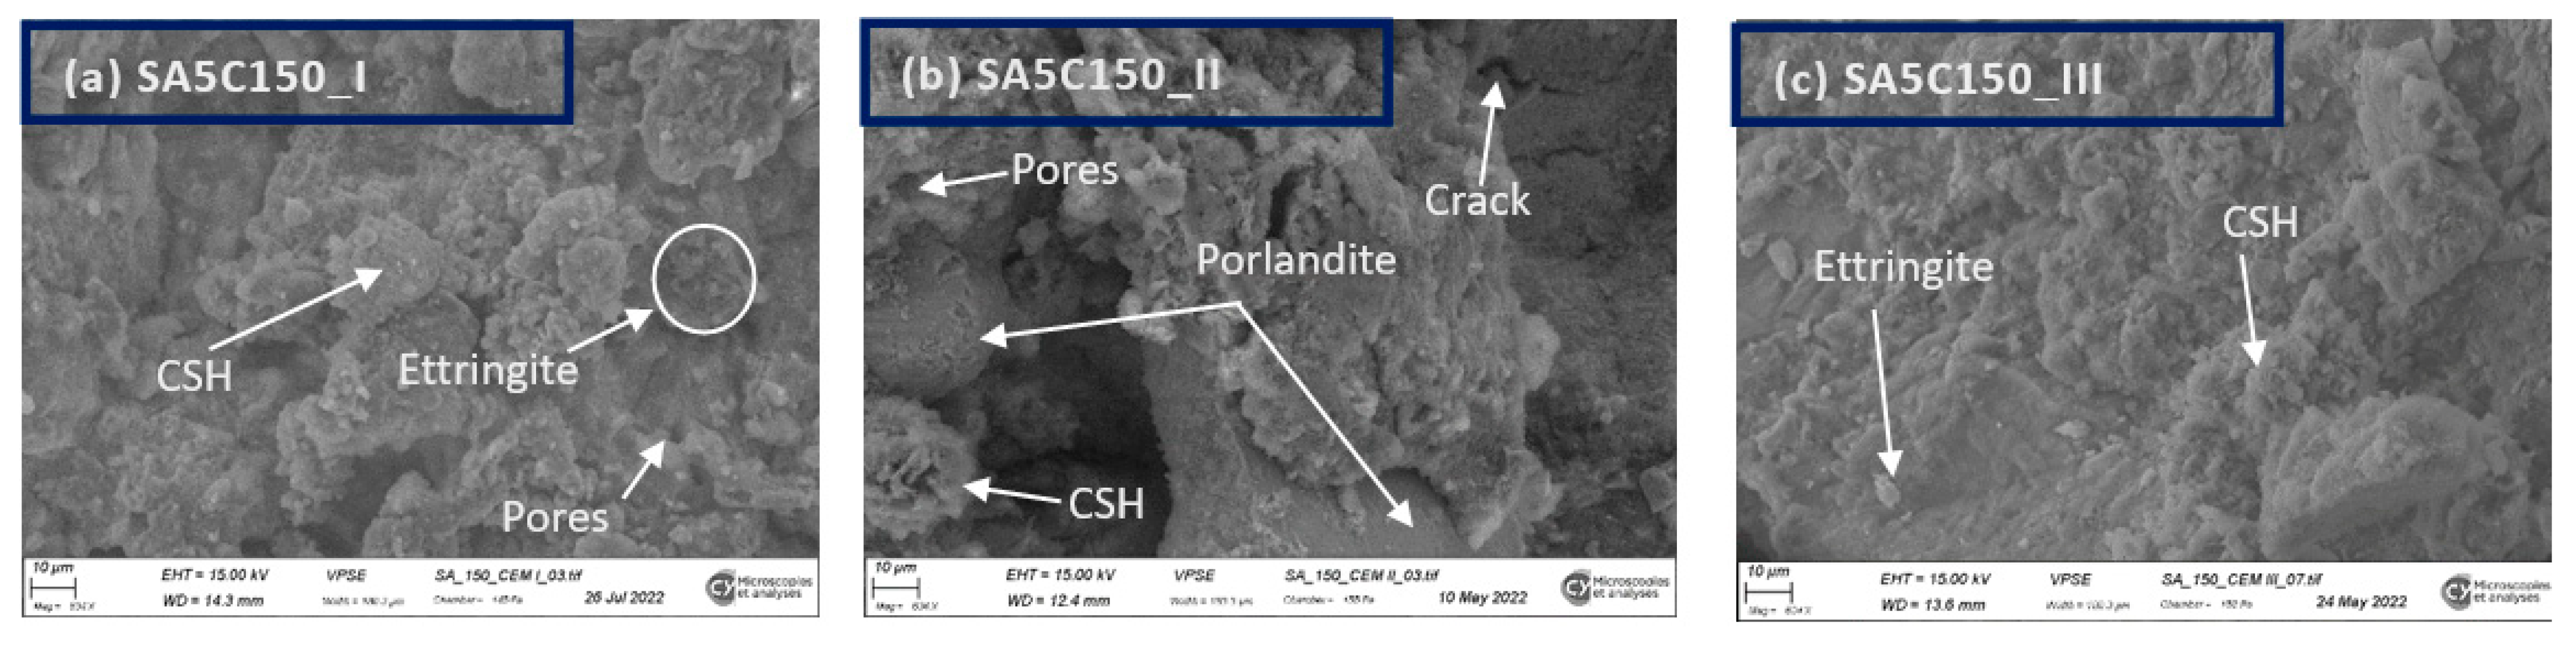
  • We notice that the CSH (paste) is denser for soil concrete formulated with CEM III 32.5, which shows a good bonding of the paste-aggregate interface. For this reason, we observe fewer pores with CEM III 32.5 compared to those formulated with CEM I 52.5 and CEM II 42.5.
In view of the results obtained from this study, the physical and mechanical properties of the soil–cement mixtures are significantly influenced by the nature of the binder and soil.
The mechanical performances of soil–cement mixture are improved considerably through the use of binders rich in blast furnace slag compared to binders primarily based on clinker. Increasing the clay content in the soil by increasing the quantity of water in the mixture on the one hand and the chemical reaction of clay with the binder on the other hand leads to a reduction in mechanical performance.

Author Contributions

Conceptualization, J.E., E.E. and A.K.; methodology, J.E., E.E., A.K. and J.C.A.; software, A.K.; validation, A.N., J.E., E.E. and J.C.A.; formal analysis; A.K.; investigation; A.K.; resources, A.N., J.E., E.E. and J.C.A.; data curation, A.K.; writing—original draft preparation, A.K.; writing—review and editing, A.K. and E.E.; visualization, J.E. and M.M.; supervision, A.N., M.S., J.C.A. and M.M.; project administration, A.N. and J.E. All authors have read and agreed to the published version of the manuscript.

Funding

This research received no external funding.

Data Availability Statement

The original contributions presented in the study are included in the article. Requests for more information can be addressed to the corresponding authors.

Acknowledgments

This research work is part of a cotutelle agreement between CY Cergy Paris University and the University of Douala. The authors would like to thank the financial support provided by the C3A program (Ambition Africa Asia Chair) of CY Cergy Paris University and Campus France. The authors are also grateful to the Administration of the Saint-Jérôme Catholic University Institute of Douala for its encouragement in the completion of this work.

Conflicts of Interest

The authors declare that they have no conflicts of interest.

References

  1. Terashi, M. The State of Practice in Deep Mixing Methods. In Grouting and Ground Treatment; American Society of Civil Engineers: New Orleans, LA, USA, 2003; pp. 25–49. [Google Scholar] [CrossRef]
  2. Denies, N.; Huybrechts, N. Deep mixing method for the construction of earth and water retaining walls. RILEM Tech. Lett. 2017, 2, 1–9. [Google Scholar] [CrossRef]
  3. Tinoco, J.; Correia, A.G.; Cortez, P. Support vector machines applied to uniaxial compressive strength prediction of jet grouting columns. Comput. Geotech. 2014, 55, 132–140. [Google Scholar] [CrossRef]
  4. Topolnicki, M.; Soltys, G. Novel Application of Wet Deep Soil Mixing for Foundation of Modern Wind Turbines. In Proceedings of the Grouting and Deep Mixing 2012, New Orleans, LA, USA, 15–18 February 2012; American Society of Civil Engineers: Reston, VA, USA, 2012; pp. 533–542. [Google Scholar] [CrossRef]
  5. Moseley, M.P.; Kirsch, K. Ground Improvement; CRC Press: Boca Raton, FL, USA, 2004; Available online: https://www.taylorfrancis.com/books/mono/10.1201/9780203489611/ground-improvement-klaus-kirsch-michael-moseley (accessed on 19 March 2024).
  6. Tinoco, J.; Correia, A.G.; Cortez, P. Application of data mining techniques in the estimation of the uniaxial compressive strength of jet grouting columns over time. Constr. Build. Mater. 2011, 25, 1257–1262. [Google Scholar] [CrossRef]
  7. Porbaha, A.; Shibuya, S.; Kishida, T. State of the art in deep mixing technology. Part III:geomaterial characterization. Proc. Inst. Civ. Eng.-Ground Improv. 2000, 4, 91–110. [Google Scholar] [CrossRef]
  8. Kitazume, M.; Terashi, M. The Deep Mixing Method; CRC Press: Boca Raton, FL, USA, 2013. [Google Scholar]
  9. Helson, O.; Beaucour, A.-L.; Eslami, J.; Noumowe, A.; Gotteland, P. Physical and mechanical properties of soilcrete mixtures: Soil clay content and formulation parameters. Constr. Build. Mater. 2017, 131, 775–783. [Google Scholar] [CrossRef]
  10. Szymkiewicz, F.; Guimond-Barrett, A.; Kouby, A.L.; Reiffsteck, P. Influence of grain size distribution and cement content on the strength and aging of treated sandy soils. Eur. J. Environ. Civ. Eng. 2012, 16, 882–902. [Google Scholar] [CrossRef]
  11. Sheen, Y.-N.; Zhang, L.-H.; Le, D.-H. Engineering properties of soil-based controlled low-strength materials as slag partially substitutes to Portland cement. Constr. Build. Mater. 2013, 48, 822–829. [Google Scholar] [CrossRef]
  12. Van Rompaey, G. Etude de la Réactivité des Ciments Riches en Laitier, à Basse Température et à Temps Court, Sans Ajout Chloruré. Ph.D. Thesis, Université libre de Bruxelles, Faculté des Sciences–Sciences de la Terre et de l’Environnement, Bruxelles, Belgium, 2006. [Google Scholar]
  13. Shen, S.-L.; Wang, Z.-F.; Horpibulsuk, S.; Kim, Y.-H. Jet grouting with a newly developed technology: The Twin-Jet method. Eng. Geol. 2013, 152, 87–95. [Google Scholar] [CrossRef]
  14. Åhnberg, H. Strength of Stabilised Soil-a Laboratory Study on Clays and Organic Soils Stabilised with Different Types of Binder; Lund University: Lund, Sweden, 2006. [Google Scholar]
  15. Filz, G.; Adams, T.; Navin, M.; Templeton, A.E. Design of Deep Mixing for Support of Levees and Floodwalls. In Proceedings of the Grouting and Deep Mixing 2012, New Orleans, LA, USA, 15–18 February 2012; Available online: https://ascelibrary.org/doi/abs/10.1061/9780784412350.0004 (accessed on 19 March 2024).
  16. Lunardi, P. Ground improvement by means of jet-grouting. Proc. Inst. Civ. Eng.-Ground Improv. 1997, 1, 65–85. [Google Scholar] [CrossRef]
  17. Kolovos, K.G.; Asteris, P.G.; Cotsovos, D.M.; Badogiannis, E.; Tsivilis, S. Mechanical properties of soilcrete mixtures modified with metakaolin. Constr. Build. Mater. 2013, 47, 1026–1036. [Google Scholar] [CrossRef]
  18. Stalin, V.K.; Muthukumar, M. Effect of acid permeation on the chemical characteristics of soil and fly ash. In Proceedings of the Indian Geotechnical Conference, Allahabad, India, 20–22 December 2002; pp. 301–304. [Google Scholar]
  19. Norme Ciment NF EN 197-1: Composition des Ciments Courants|Infociments. Available online: https://www.infociments.fr/norme-beton-nf-en-197-1-composition-des-ciments-courants (accessed on 19 August 2023).
  20. NF EN 197-1. Afnor EDITIONS. Available online: https://www.boutique.afnor.org/fr-fr/norme/nf-en-1971/ciment-partie-1-composition-specifications-et-criteres-de-conformite-des-ci/fa149898/1234 (accessed on 19 August 2023).
  21. Hessouh, J.J.; Eslami, J.; Beaucour, A.-L.; Noumowe, A.; Mathieu, F.; Gotteland, P. Physical and mechanical characterization of deep soil mixing (DSM) materials: Laboratory vs construction site. Constr. Build. Mater. 2023, 368, 130436. [Google Scholar] [CrossRef]
  22. Melentijevic, S.; Arcos, J.L.; Oteo, C. Application of cement deep mixing method for underpinning. In Proceedings of the 18th International Conference on Soil Mechanics and Geotechnical Engineering, Paris, France, 2–6 September 2013; pp. 2549–2552. Available online: https://www.cfms-sols.org/sites/default/files/Actes/2549-2552.pdf (accessed on 19 August 2023).
  23. Denies, N.; Huybrechts, N.; De Cock, F.; Lameire, B.; Maertens, J.; Vervoort, A. Large-Scale Bending Tests on Soil Mix Elements. In Proceedings of the IFCEE 2015, San Antonio, TX, USA, 17–21 March 2015; American Society of Civil Engineers: San Antonio, TX, USA, 2015; pp. 2394–2409. [Google Scholar] [CrossRef]
  24. Liu, L.; Zhou, A.; Deng, Y.; Cui, Y.; Yu, Z.; Yu, C. Strength performance of cement/slag-based stabilized soft clays. Constr. Build. Mater. 2019, 211, 909–918. [Google Scholar] [CrossRef]
  25. Saussaye, L.; Boutouil, M.; Baraud, F.; Leleyter, L. Soils treatment with hydraulic binders: Physicochemical and geotechnical investigations of a chemical disturbance. In Proceedings of the ISSMGE-TC 211 International Symposium on Ground Improvement IS-GI, Brussels, Belgium, 30 May–1 June 2012; pp. 479–489. [Google Scholar]
  26. Terashi, M. Theme lecture: Deep mixing method-Brief state of the art. In Proceedings of the 14th ICSMFE, Hamburg, Germany, 6–12 September 1997; pp. 2475–2478. [Google Scholar]
  27. NF EN 12350-7. Afnor EDITIONS. Available online: https://www.boutique.afnor.org/fr-fr/norme/nf-en-123507/essais-pour-beton-frais-partie-7-teneur-en-air-methode-de-la-compressibilit/fa190563/83427 (accessed on 16 August 2023).
  28. NF P18-459. Afnor EDITIONS. Available online: https://www.boutique.afnor.org/fr-fr/norme/nf-p18459/beton-essai-pour-beton-durci-essai-de-porosite-et-de-masse-volumique/fa160729/34961 (accessed on 23 August 2023).
  29. NF EN 12390-3. Afnor EDITIONS. Available online: https://www.boutique.afnor.org/fr-fr/norme/nf-en-123903/essais-pour-beton-durci-partie-3-resistance-a-la-compression-des-eprouvette/fa190566/83462 (accessed on 23 August 2023).
  30. Helson, O.; Eslami, J.; Beaucour, A.-L.; Noumowe, A.; Gotteland, P. Hydro-mechanical behaviour of soilcretes through a parametric laboratory study. Constr. Build. Mater. 2018, 166, 657–667. [Google Scholar] [CrossRef]
  31. Didouche, Z.; Kadri, E.-H.; Ezziane, K. Effet du broyage sur l’amélioration des propriétés mécaniques des mortiers. Acad. J. Civ. Eng. 2018, 36, 191–194. [Google Scholar]
  32. Akin, M.K. Experimental studies on the physico-mechanical properties of jet-grout columns in sandy and silty soils. J. Afr. Earth Sci. 2016, 116, 190–197. [Google Scholar] [CrossRef]
  33. Guo, X.; Yuan, S.; Xu, Y.; Qian, G. Effects of phosphorus and iron on the composition and property of Portland cement clinker utilized incinerated sewage sludge ash. Constr. Build. Mater. 2022, 341, 127754. [Google Scholar] [CrossRef]
  34. Bellato, D.; Marzano, I.P.; Simonini, P. Microstructural Analyses of a Stabilized Sand by a Deep-Mixing Method. J. Geotech. Geoenviron. Eng. 2020, 146, 04020032. [Google Scholar] [CrossRef]
Figure 1. Particle size analysis of soils and cements.
Civileng 05 00016 g001
Figure 2. Measurement of workability: (a) mini-cone dimensions; (b) mini-cone; (c) spread.
Civileng 05 00016 g002
Figure 3. (a) CONTROLAB mortar mixer; (b) storage of specimens for 7 days.
Civileng 05 00016 g003
Figure 4. Density of soil concrete as a function of the cement dosage: (a) theorical density; (b) fresh density; (c) hardened density at 28 days; (d) hardened density at 90 days.
Civileng 05 00016 g004
Figure 5. Entrapped air content of different mixtures.
Civileng 05 00016 g005
Figure 6. Water porosity of different mixtures.
Civileng 05 00016 g006
Figure 7. Evolution of compressive strength depending on the curing time of soil concrete made with different cement contents of CEM II 42.5 and three different soils: (a) SA5; (b) LA5; (c) LA10.
Civileng 05 00016 g007
Figure 8. Evolution of the compressive strength of soil concretes made with CEM II 42.5 at 90 days as a function of: (a) cement content; (b) W/C ratio.
Civileng 05 00016 g008
Figure 9. Evolution of compressive strength as a function of time for soil concretes formulated with CEM I 52.5. CEM II 42.5 and CEM III 32.5 and three different soils: (a) SA5; (b) LA5; (c) LA10.
Civileng 05 00016 g009
Figure 10. Evolution of the compressive strength at 90 days for a cement dosage of 250 kg/m3 as a function of the type of cement.
Civileng 05 00016 g010
Figure 11. Evolution of the static Young’s modulus formulated with CEM I 52.5, CEM II 42.5, and CEM III 32.5 at 28 days as a function of the cement content: (a) SA5; (b) LA5; (c) LA10.
Civileng 05 00016 g011
Figure 12. Evolution of P-wave velocity and dynamic modulus of sandy clay soil concrete as a function of time: (a) P-wave velocity; (b) Edyn dynamic modulus.
Civileng 05 00016 g012
Figure 13. Evolution of P-wave velocity and dynamic modulus of 5 mm laterite-based soil concrete as a function of time: (a) P-wave velocity; (b) Edyn dynamic modulus.
Civileng 05 00016 g013
Figure 14. Evolution of P-wave velocity and dynamic modulus of 10 mm laterite-based soil concrete as a function of time: (a) P-wave velocity; (b) Edyn dynamic modulus.
Civileng 05 00016 g014
Figure 15. SEM micrographs of SA5C250_I (a), SA5C250_II (b) and SA5C250_III (c) for a curing of 28 days.
Civileng 05 00016 g015
Figure 16. SEM micrographs of SA5C150_I (a), SA5C150_II (b) and SA5C150_III (c) for a curing of 28 days.
Civileng 05 00016 g016
Figure 17. SEM micrographs of LA5C250_I (a), LA5C250_II (b) and LA5C250_III (c) for a curing of 28 days.
Civileng 05 00016 g017
Figure 18. SEM micrographs of LA5C150_I (a), LA5C150_II (b), and LA5C150_III (c) for a curing period of 28 days.
Civileng 05 00016 g018
Table 1. Loss on fire and X-ray fluorescence spectrometry of soil samples.
Loss on Fire (%) Elementary Composition (%) Sandy Clay
SiO2Al2O3Fe2O3CaOMgOSO3Na2OK2OP2O5
12.87 42.9525.724.621.100.040.030.130.200.09
Laterite
14.54 33.3327.189.961.530.090.090.270.240.08
Table 2. Intrinsic characteristics of soils.
MaterialsSpecific Density (kg/m3)pH
Value (-)
Surface BET [m2/g]VBS
Value (-)
Wp (%)WL (%)Ip (%)ES (%)
Sandy clay24875.340.900.4329.33 56.3927.0610.49
Laterite26885.230.760.9042.6476.45 33.81 5.99
Table 3. Chemical composition of the different cements used.
Loss on Fire (%) SiO2Al2O3Fe2O3CaOMgOSO3Na2OK2OP2O5
Elementary composition (%)CEM I 52.5
1.020.704.603.3064.401.303.400.071.330.50
CEM II 42.5
4.2425.507.616.7845.262.742.190.211.140.27
CEM III 32.5
1.832.8010.200.7046.05.502.90nd0.58nd
Table 4. Intrinsic characteristics of cements.
MaterialsSpecific Density (kg/m3)Surface BET [m2/g]
CEM I 52.531500.40
CEM II 42.531000.35
CEM III 32.529000.47
Table 5. Mixture proportions and workability of soil concrete made with CEM II 42.5.
Sandy Clay
Cement [kg/m3]Soil
[kg/m3]
Water [kg/m3]W/C
[-]
Measurement with Mini-Conecm
15010615253.5Diameter of the spread-out soil concrete33.0 ± 0.6
20010215252.6332.3 ± 1.5
2509815252.1033.2 ± 1.0
3009415251.7531.5 ± 1.7
Laterite 5 mm
15010265703.80Diameter of the spread-out soil concrete32.3 ± 0.8
2009825702.8531.2 ± 0.4
2509395702.2832.8 ± 0.9
3008965701.9033.6 ± 1.7
Laterite 10 mm
15011475253.50Diameter of the spread-out soil concrete31.2 ± 1.0
20011035252.6230.2 ± 0.6
25010605252.1032.3 ± 0.5
30010175251.7531.9 ± 2.7
Table 6. Mixture proportions and workability of soil concrete made with CEM III 32.5.
Sandy Clay
Cement [kg/m3]Soil
[kg/m3]
Water [kg/m3]W/C
[-]
Measurement with Mini-Conecm
15010535253.50Diameter of the spread-out soil concrete34.1 ± 1.0
2509675252.1033.3 ± 0.8
Laterite 5 mm
15010175703.80Diameter of the spread-out soil concrete33.2 ± 1.2
2509245702.2833.6 ± 0.7
Laterite 10 mm
15011385253.50Diameter of the spread-out soil concrete32.7 ± 0.6
25010455252.1033.4 ± 0.9
Table 7. Mixture proportions and workability of soil concrete made with CEM I 52.5.
Sandy Clay
Cement [kg/m3]Soil
[kg/m3]
Water [kg/m3]W/C
[-]
Measurement with Mini-Conecm
15010635253.50Diameter of the spread-out soil concrete30.8 ± 1.2
2509845252.1031.1 ± 0.7
Laterite 5 mm
15010285703.80Diameter of the spread-out soil concrete29.9 ± 1.1
2509435702.2830.4 ± 0.8
Laterite 10 mm
15011495253.50Diameter of the spread-out soil concrete29.5 ± 1.6
25010635252.1030.1 ± 0.9
Disclaimer/Publisher’s Note: The statements, opinions and data contained in all publications are solely those of the individual author(s) and contributor(s) and not of MDPI and/or the editor(s). MDPI and/or the editor(s) disclaim responsibility for any injury to people or property resulting from any ideas, methods, instructions or products referred to in the content.

