

Energy-Based Design of Buckling-Restrained Steel Braced Frames for Concurrent Occurrences of Earthquake and Wind

1
Creighton Manning Engineering, 2 Winners Circle, Albany, NY 12205, USA
2
Department of Civil and Environmental Engineering, Syracuse University, Syracuse, NY 13244, USA
*
Author to whom correspondence should be addressed.
CivilEng 2024, 5(2), 343-377; https://doi.org/10.3390/civileng5020018
Submission received: 26 January 2024
/
Revised: 22 March 2024
/
Accepted: 11 April 2024
/
Published: 15 April 2024
(This article belongs to the Special Issue Feature Papers in CivilEng)
Abstract
:This paper describes the development of a dual hazard spectrum for use in the dynamic analysis of steel frames subject to the combined effects of earthquakes and wind. The proposed spectrum is obtained by combining the power spectra of earthquakes and wind using the square root of the sum of squares (SRSS) combination method. An equivalent time excitation function is then computed using an inverse fast Fourier transform (IFFT) and serves as input for the dynamic analysis. Using time-history analysis on the OpenSees platform, the dynamic responses expressed in terms of peak and residual inter-story and roof drifts for two multistory steel frames located in two US cities (Los Angeles and Charleston) are obtained to demonstrate that designing these buildings based on just one hazard may not be adequate. For frames that are considered under-designed, an energy-based design procedure that uses buckling-restrained braces (BRBs) to dissipate the excess energy imparted to these frames is proposed so they will satisfy the FEMA 356 recommended drift limits for the performance levels of immediate occupancy and life safety.
1. Introduction
Wind and earthquakes are two natural hazards that can cause severe damage to structures. Damage in buildings under dynamic loads can often be accounted for by examining the first few modes of vibration. High-rise buildings likely have lower frequencies in the first few modes, which make them more susceptible to damage by wind, but low-rise buildings usually have their dominant frequencies in the higher range and they are therefore mostly affected by earthquakes. As a result, current design practice often treats wind and seismic effects separately, by assuming their simultaneous occurrences are negligible. This design philosophy is reflected in ASCE/SEI 7-22 [1], where earthquake and wind load effects do not appear together in any of the load combinations used for design. However, the probability that both hazards occur concurrently does exist, especially for structures located in regions known to experience both wind and earthquake hazards, as well as for structures built near the coast. For instance, a study by Fan et al. [2] that analyzed seismic data over a 10-year period from 2006 to 2015 using the AELUMA (automated event location using a mesh of arrays) method concluded that “large storms can interact with shallow sea floor near the edge of continental shelves” and “produce seismic sources with equivalent earthquake magnitudes that can be greater than 3.5”. They called such events “stormquakes” and “found evidence of more than 10,000 stormquakes occurring from 2006 to 2019 offshore of New England, Florida and the Gulf of Mexico in the United States, as well as offshore of Nova Scotia, Newfoundland and British Columbia in Canada”.
1.1. Studies on Dual Hazards on Structures
According to [1], for structures located in regions susceptible to both earthquake and wind effects, the final design can be based on the more demanding of the two hazards in terms of the risks of exceedance for the types of limit states that are being considered in the design. Nevertheless, using probabilistic tools, Duthinh & Simiu [3] and Crosti et al. [4] showed that this approach was not always risk-consistent and indicated that structures designed for just one hazard could result in a higher risk of damage than when those same structures were designed for both earthquake and wind hazards. Duthinh & Simiu [3] used the probability of union of two disjoint events to demonstrate that risks of exceedance of limit states due to two distinct hazards could increase by a factor of up to two when compared to risks for structures exposed to only one hazard. They used an example of a water tank to demonstrate that the risk of exceedance of the limit state was greater for multi-hazards than for a single hazard. They then proposed an approach based on examining the mean return interval (MRI) of wind and earthquakes and suggested that the MRI of both hazards should be doubled to assure that risks associated with one hazard in regions where that hazard dominates were not exceeded for structures in regions where both wind and seismic hazards could occur.
Crosti et al. [4] analyzed three ten-story five-bay steel frames with different numbers of moment and shear connections using the equivalent lateral force procedure and compared the drift response of these frames under increasing load factors assigned to wind and earthquake loads. By assuming earthquakes and wind to be independent, they showed that the level of risk of achieving the same lateral drift state for a structure exposed to multiple hazards was more than twice that of the structure when it was exposed to a single hazard. They then pointed out the need to consider multi-hazard synergy in design.
Aly [5] and Aly & Abburu [6] studied earthquake and wind loads on two (54- and 76-story) high-rise reinforced concrete buildings. By performing a modal transformation of the equations of motion written for the frames and assuming Rayleigh damping for these frames, they integrated each modal equation numerically to obtain and compare the inter-story drifts. They found that when the effects of earthquakes and wind were analyzed separately, earthquakes tended to excite higher vibration modes, producing smaller inter-story drifts but higher accelerations; meanwhile, wind tended to generate larger inter-story drifts but lower accelerations. When compared to earthquakes, the accelerations due to wind lasted for a longer period and could cause occupancy discomfort. They concluded that tall buildings designed for windy conditions might be safe under moderate earthquakes but not under strong earthquakes.
Thilakarathna et al. [7] evaluated the effect of wind on the seismic performance of a 40-story dual system consisting of a reinforced concrete core wall and a special moment resisting frame. The building, which was assumed to be located in a moderate-level seismic region, was designed for three different levels of wind loads (that corresponded to low, moderate and high wind speeds). Using nonlinear time-history analysis, the inelastic seismic demand was obtained and the seismic performance under the three levels of wind loads were compared. The results showed that the levels of the design wind load had an effect on the seismic performance of the building. They concluded that in order to achieve a safe design, high-rise buildings should be analyzed for their seismic performance even if wind controlled the design.
Mazza & Vulcano [8] performed numerical analyses of five 15-story steel buildings. The first (reference) frame was a steel frame with K-bracing, and the other four were derived from the first by placing diagonal braces and/or viscoelastic dampers (VEDs) on the reference frame. A bilinear model was used for the frame members and a parallel combination of two Maxwell models and one Kelvin model was used to model the VEDs. Artificially generated accelerograms that corresponded to a medium subsoil class with different levels of peak ground accelerations were used as ground excitations. Along-wind loads in the form of time histories that correspond to a wind velocity with a return period of 5 years were generated and applied to the frames. The analyses were carried out using a step-by-step initial stress-like iterative procedure. The results showed that to satisfactorily resist the earthquake and wind loads, both diagonal bracing and VEDs should be used.
Kwag et al. [9] proposed a framework using a risk-based multi-hazard approach. The framework uses spatial representation divided into distinct regions to combine performance functions with different intensity measures for multiple hazards. The significance of these graphically depicted regions is that they can be used to determine whether the performance of a building is governed by a single (earthquake or wind) or multiple (both earthquake and wind) hazards. Using this framework, they compared the behavior of three buildings (20-story, 30-story and 40-story high) in three locations, and demonstrated that the earthquake and wind-prone regions decreased but the multi-hazard-prone region increased with building height.
Roy et al. [10] investigated the probabilities of occurrences of low to medium earthquakes and long-duration winds in the design life of base-isolated reinforced concrete buildings, and they concluded that designing the buildings based on existing guidelines might underestimate their responses under multi-hazard excitations if damage accumulation was not considered. They formulated a multi-hazard framework using probabilistic seismic hazard analysis techniques for high-rise buildings subjected to earthquakes and long-duration winds, and they showed in their study that 20- and 25-story base-isolated high-rise reinforced concrete buildings designed for earthquakes tended to be vulnerable to wind damage.
These researchers have demonstrated that regardless of height, designing a structure to satisfy the performance criteria for a single (more dominant) hazard does not always guarantee that the performance criteria for other (less dominant) hazards will automatically be satisfied if either the wind or earthquake excitation is significant enough. More importantly, under a multi-hazard scenario, the risks of exceeding the controlling limit states are even higher. To ensure that the design is adequate, a more robust method capable of considering the concurrent occurrences of these hazards is needed.
One objective of this paper is therefore to propose a methodology by which the dual wind–earthquake hazard effect on structures can be accounted for when they are occurring simultaneously.
1.2. Buckling Restrained Braces
Both earthquakes and wind impart energy to a building. This energy needs to be dissipated if severe damage to the building is to be avoided. If a building is not equipped with any supplementary energy dissipation devices, it must undergo inelastic deformations to dissipate this energy. If the amount of inelasticity is excessive, the usefulness of the building is compromised. To limit the amount of damage, drift limits are often set for buildings of different risk categories under various performance levels [11]. To satisfy these drift limits, the use of supplementary energy dissipation devices for buildings located in high earthquake and/or strong wind regions is needed. The supplementary energy dissipation device used in the present study is a buckling restrained brace (BRB). BRBs are not only capable of dissipating energy but also provide added strength and stiffness to the structure, thereby allowing them to withstand strong earthquakes and high winds without undergoing excessive elastic and inelastic deformations.
BRBs are energy dissipation structural elements designed to yield under compression and tension. The concept of BRBs was first introduced in Japan in the late 1980s [12,13,14]. Since then, a number of researchers around the world have performed theoretical, experimental and numerical research on various types and configurations of BRBs. A detailed review of the research and applications of BRBs is given by Zhou et al. [15]. A typical BRB has three major components: steel core, bond-preventing layer and casing. The steel core is the axial force-resisting element of the BRB. It consists of a connection zone, a transition zone and yielding zone. The middle portion of the steel core (the yielding zone) is designed to yield under an axial force. However, the connection and transition zones are expected to remain elastic. The bond-preventing layer decouples the casing from the core and ensures the force is carried only by the core without engaging the casing. The casing or restraining unit is often filled with concrete. Its function is to support the core and prevent it from buckling under compression; hence the name “buckling restrained brace”. Because buckling of the steel core is prevented from occurring by the concrete-filled casing, the hysteretic behavior of BRB generated through tension yielding and controlled inelastic buckling of the steel core is rather stable and plump. These inelastic deformations help dissipate energy and so frames equipped with BRBs can withstand cyclic lateral loads such as earthquakes and wind.
A second objective of this paper is to present an energy-based method to design these BRBs to dissipate the excess energy beyond what the structure itself is capable of dissipating.
2. Research Objectives
As alluded to in the preceding section, current design practice often treats wind and seismic effects separately (by assuming their simultaneous occurrence is negligible) and that the final design can be based on the more dominant of the two hazards. However, a number of researchers have demonstrated that such an approach does not always result in a safe design. Furthermore, in the design for wind, wind is often treated as a static load when its effect is dynamic in nature. The two main objectives of this research are therefore to (1) develop a methodology that can account for the dynamic effects of both wind and earthquakes acting simultaneously on structures, and (2) propose an energy-based procedure for the design of BRBs to dissipate energy from the combined hazards and ensure that the building drifts will satisfy the FEMA 356 [11] recommended drift limits.
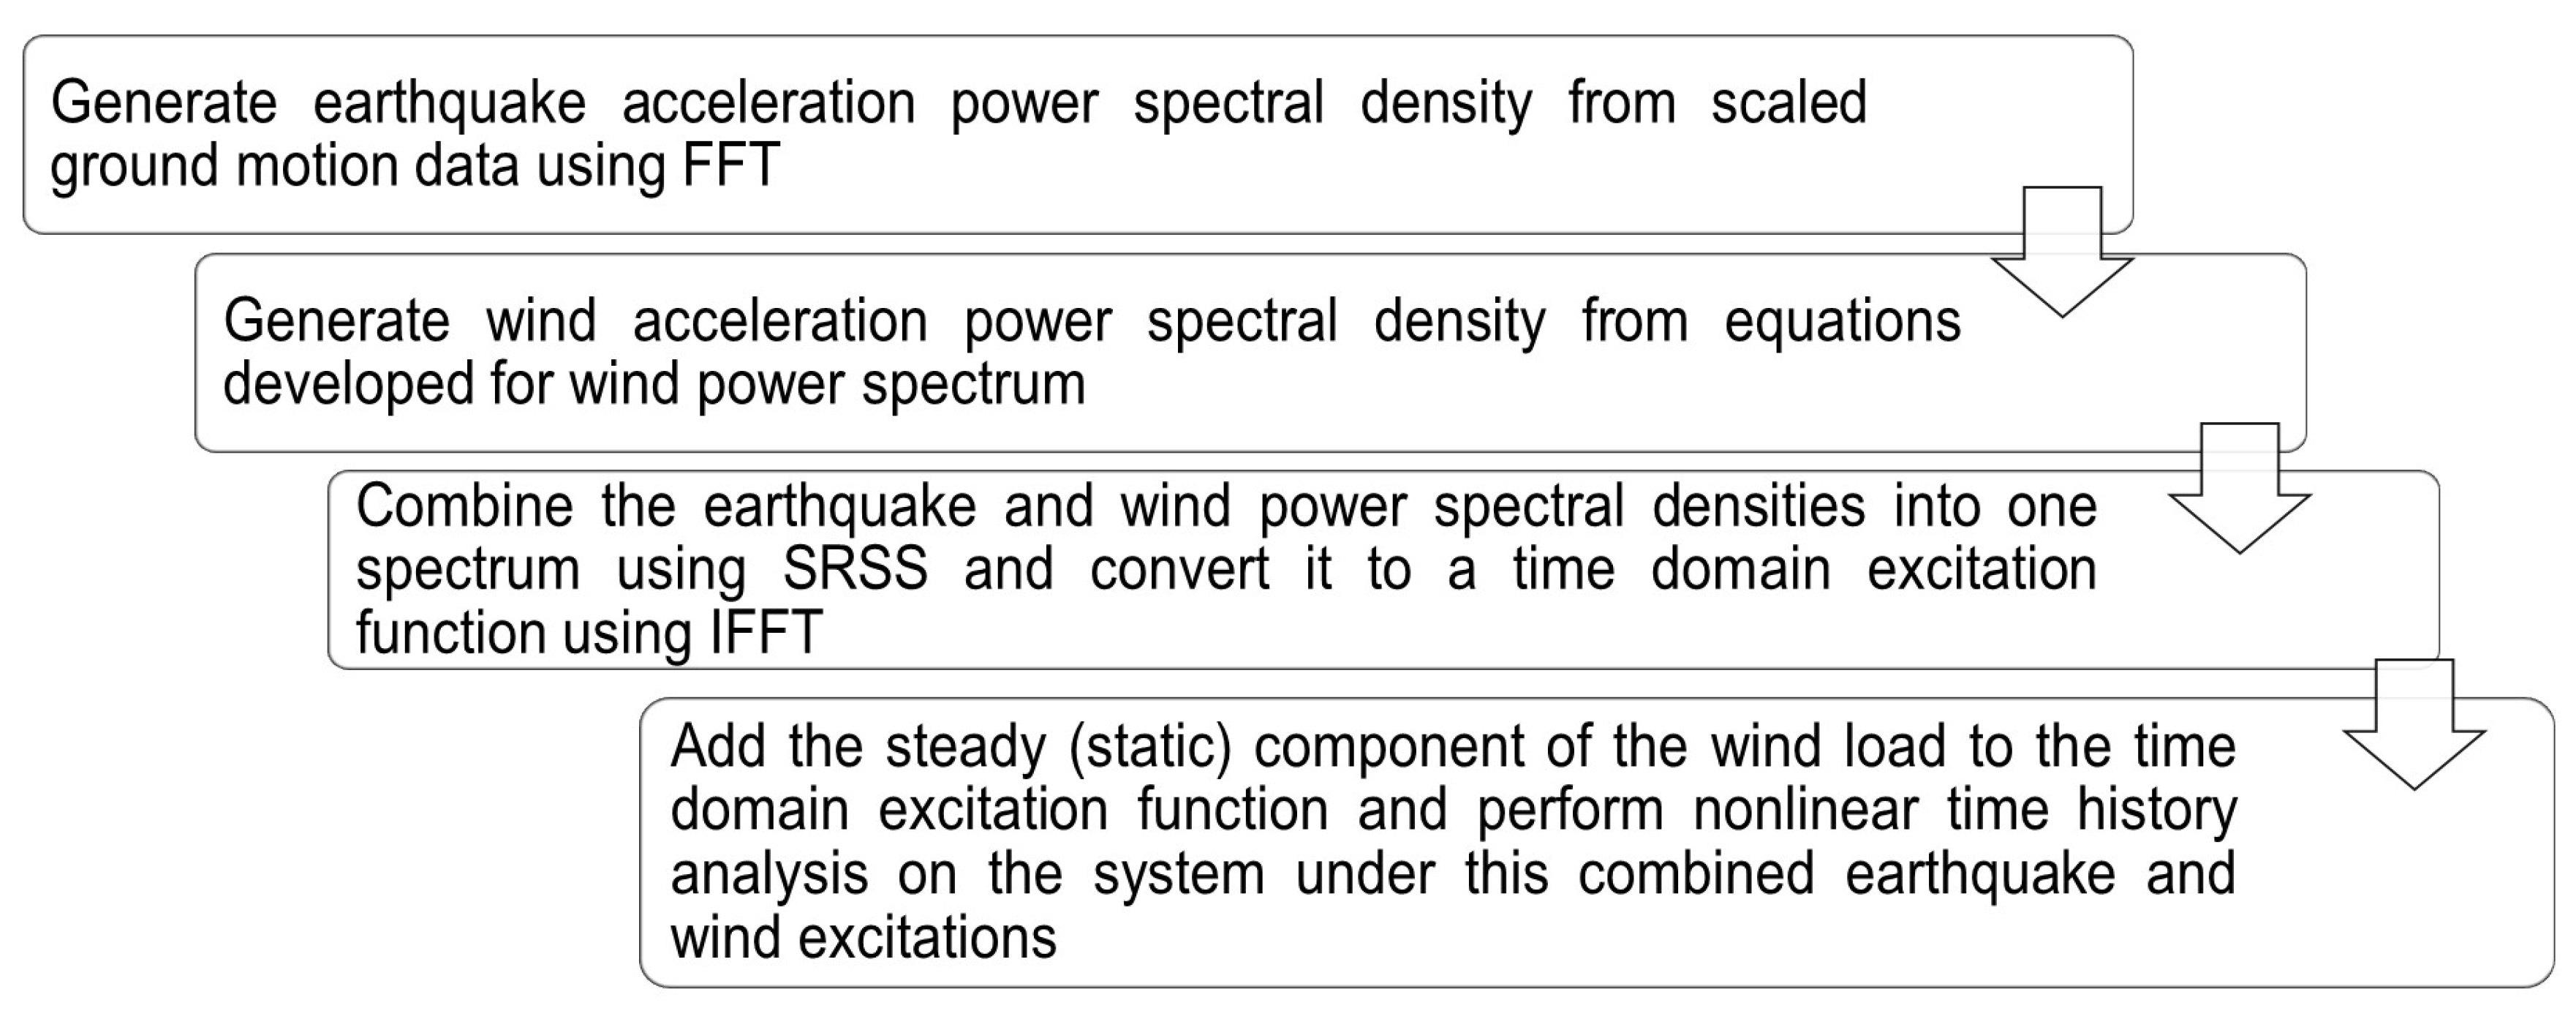
To achieve the first objective, the proposed power spectrum is developed by combining the power spectral densities of earthquakes and wind using the square root of the sum of squares (SRSS) combination rule. This combination rule is used because it is one of most commonly used statistical approaches to account for the cumulative effect of multiple events when the probability that the maximum effect of all these events will be occurring at the same instance is not high. Applying inverse fast Fourier transform (IFFT) to this spectrum, one can obtain a time-varying excitation function which can then be used as input to the system for analysis and design.
To achieve the second objective, a simplified energy-based method developed based on the equivalent lateral force (ELF) procedure is proposed. In using this method, the energy demand is first estimated based on the target deformation and ductility that correspond to the applied excitation force. The BRBs are then designed to provide the needed energy dissipation capacity to overcome this energy demand.
Steel frames will be used in the present study because they often possess the needed ductility for earthquake-resisting designs. Furthermore, they are the type of frames that can be retrofitted relatively easily with BRBs to enhance their dynamic performance.
In performing the analyses and design described in this study, the following assumptions are used:
- The steel frames are in an undamaged state when the dual hazards strike.
- The excitations caused by earthquakes and wind have the same duration and their maximum effects occur within this time span, i.e., the structure is experiencing its most severe loading condition during this time interval.
- The FEMA-recommended drift limits [11] for the performance-based seismic design (PBSD) of moment and braced steel frames are used in the present study to assess the adequacy of these frames when subject to dual wind–earthquake excitations. This is because in the proposed methodology, the dual hazard effect is represented by a time-varying excitation like that of an earthquake.
In what follows, details of methodologies used in achieving the above two objectives are provided.
3. Dual Earthquake–Wind Hazard Power Spectrum
In the present study, the dual earthquake–wind power spectrum is obtained by combining the respective earthquake and wind power spectral densities derived using earthquake and wind data given in [1,16]. The power spectral density (PSD) or power spectrum is used to represent the dual earthquake–wind effects because a power spectrum describes how the power of a time-varying signal is distributed over a range of frequencies contained in the time signal. Given both earthquakes and wind are dynamic forces, each having their own range of forcing frequencies, the effect of these frequencies on a structure having natural frequencies that fall within these frequency ranges can be accounted for together in the proposed dual power spectrum. In addition, since an energy-based approach to design is used in the present study, representing the dual hazard effect by means of a power spectrum is a rational approach to the problem.
3.1. Earthquake Power Spectrum
For earthquakes, the time series of interest is the ground acceleration (in m/s2) and its PSD (in (m/s2)2/Hz) can be computed using the equation:
where is the imaginary number, is the frequency in Hz and is the period in seconds.
Since is not a continuous function, the integral given in Equation (1) is often carried out numerically using a fast Fourier transform (FFT).
3.2. Wind Power Spectrum
Wind is created by air movement and is dynamic in nature. Although the current design for wind effects on structures often treats wind as a static load; in actuality, wind velocity (expressed in m/s) consists of a steady (static) and a fluctuating (dynamic) component given by [17]
where is the height and time-dependent wind velocity in m/s; is the (steady) mean wind velocity in m/s at height meters above ground; and is the fluctuating component of wind velocity in m/s, which varies with both height (in meters) and time (in seconds).
The mean wind velocity in m/s at height z meters above ground can be expressed by the power law as [17]
where is the basic wind speed in m/s at a height of 10 m above ground [2]; is a nondimensional parameter in which 1 m is the roughness length for dense urban terrain, and 50 m is the reference height as suggested by Holmes & Bekele [17].
Wind force is a function of wind velocity; like wind velocity, it has a steady and a fluctuating component [17], i.e.,
where is the wind force in Newtons acting at a height of meters above ground at time ; denotes air density in kg/m3, and the standard value used in this study was 1.224 kg/m3; and is the nondimensional drag coefficient. For a bluff body, is dependent on the shape of the body [18]. If the bluff body has a rectangular cross-section with B/D (ratio of the along-wind to cross-wind dimension) larger than 2, stabilizes to a value of 1.05. Since the frames used in the present study satisfy this requirement, = 1.05 is used. denotes the area in m2 exposed in the along-wind direction. Note that the term that involves the square of when Equation (2) is substituted into Equation (4) is omitted because it is relatively small when compared to the other terms.
The first term on the right side of Equation (4) represents the steady wind force which is not frequency dependent, but the second term is the force from the fluctuating wind component, which is frequency dependent and can be represented by a PSD. In the present study, the PSDs of the fluctuating wind force and acceleration are obtained as [17,19]
where denotes the PSD of the fluctuating wind force in N2/Hz; denotes the PSD of the fluctuating wind acceleration in (m/s2)2/Hz; denotes the mass in kg; [17], in kg/s; and is the PSD of the fluctuating component of wind velocity in (m/s)2/Hz.
A number of researchers [19,20,21,22,23,24,25,26,27,28,29] have proposed equations to represent . A widely used assumption for the fluctuating component of the wind velocity is a zero-mean, stationary, Gaussian random process. In the present study, the Kaimal & Finnigan [30] wind velocity spectrum was used; thus, the equation for in (m/s)2/Hz is given by:
where is the frequency in Hz; z is the height in meters above ground; is given in Equation (3); and is the standard deviation in m/s that can be calculated from , in which is the nondimensional turbulence intensity [17].
3.3. Proposed Dual Hazard Power Spectrum
The proposed dual hazard PSD in (m/s2)2/Hz is obtained by combining the PSDs of earthquakes (given by Equation (1)) and wind (given by Equation (6)) using the SRSS combination rule, i.e.,
SRSS is used here because not only is it a commonly used statistical tool to combine the effects of two or more random processes when the probability that the maximum effects of these processes are occurring at the same instant is not high, it has also been successfully applied to the modal analysis of dynamic systems and used in the spectral analysis of structures subject to dynamic excitations. The reason that the power spectral densities of the two hazards are combined using SRSS as opposed to just combining the results of structural responses to each of the two hazards is because the response, and in particular the inelastic response, of the structure will be more accurately captured if the combined energies of the two hazards are applied concurrently to the structure.
Once the dual hazard power spectrum is obtained from Equation (8), the dual hazard acceleration time-history can be generated using the inverse fast Fourier transform (IFFT). In using IFFT, a phase angle needs to be defined. In the present study, the phase angle used to generate this dual hazard acceleration time-history is taken as the same as that of the input earthquake data since it is not rational to employ a random phase angle which will lead to a time series that may not be compatible with the original ground motion phase angle.
The steady wind component can now be combined with the fluctuating component in the time domain, as follows:
where is the total dual hazard excitation (in m/s2); is the dual hazard acceleration (in m/s2) that corresponds to the fluctuating part of the wind load; and (in m/s2) is the dual hazard acceleration caused by the steady part of the wind load. The plus or minus sign in Equation (9) accounts for the possibility that wind can blow in either direction, and so the steady wind component is added to or subtracted from the fluctuating component, in order to determine the more severe condition for the analysis.
The flow chart in Figure 1 summarizes the steps needed for the construction of this proposed dual hazard power spectrum and the generation of a time-domain dual hazard excitation function. Once this function is obtained, time history analysis can be carried out on the system.
4. Earthquake and Wind Data Characterizations
To apply the dual hazard methodology to a structure, the structure’s location and performance levels must be known so that the appropriate earthquake and wind data can be gathered and utilized. In the present study, high occupancy (or risk category III) buildings located in Los Angeles (California) and Charleston (South Carolina) are used. Both Los Angeles and Charleston are located in earthquake-prone regions of the US that are also subject to high wind [1,16]. Earthquakes are considered the more dominant hazard in Los Angeles while wind is considered more dominant in Charleston, although both earthquakes and wind are regarded as important natural hazards in both cities. Because they are both coastal cities (one on the west coast and the other on the east coast of the US), they are also susceptible to stormquakes.
According to [1], risk category III structures are defined as structures which “represent a substantial hazard to human life in the event of failure”. These structures represent the majority of structures built in these two cities. Risk category III buildings are required to be designed for immediate occupancy (IO) under design based earthquakes (DBEs) and for life safety (LS) under maximum considered earthquakes (MCEs). DBEs and MCEs have a 10% and 2% probability of exceedance over a period of 50 years, with mean return periods of 475 and 2475 years, respectively. The engineering demand parameters (EDP) that can be used to quantify the performances of buildings are peak (maximum) and residual (permanent) drifts. According to [11], the drift ratios (lateral displacement divided by height) for steel moment and braced frames designed for IO and LS should not exceed the limits given in Table 1. Since the drift limits are different for the two performance levels, time-history analyses will be performed for both.
4.1. Earthquake Data
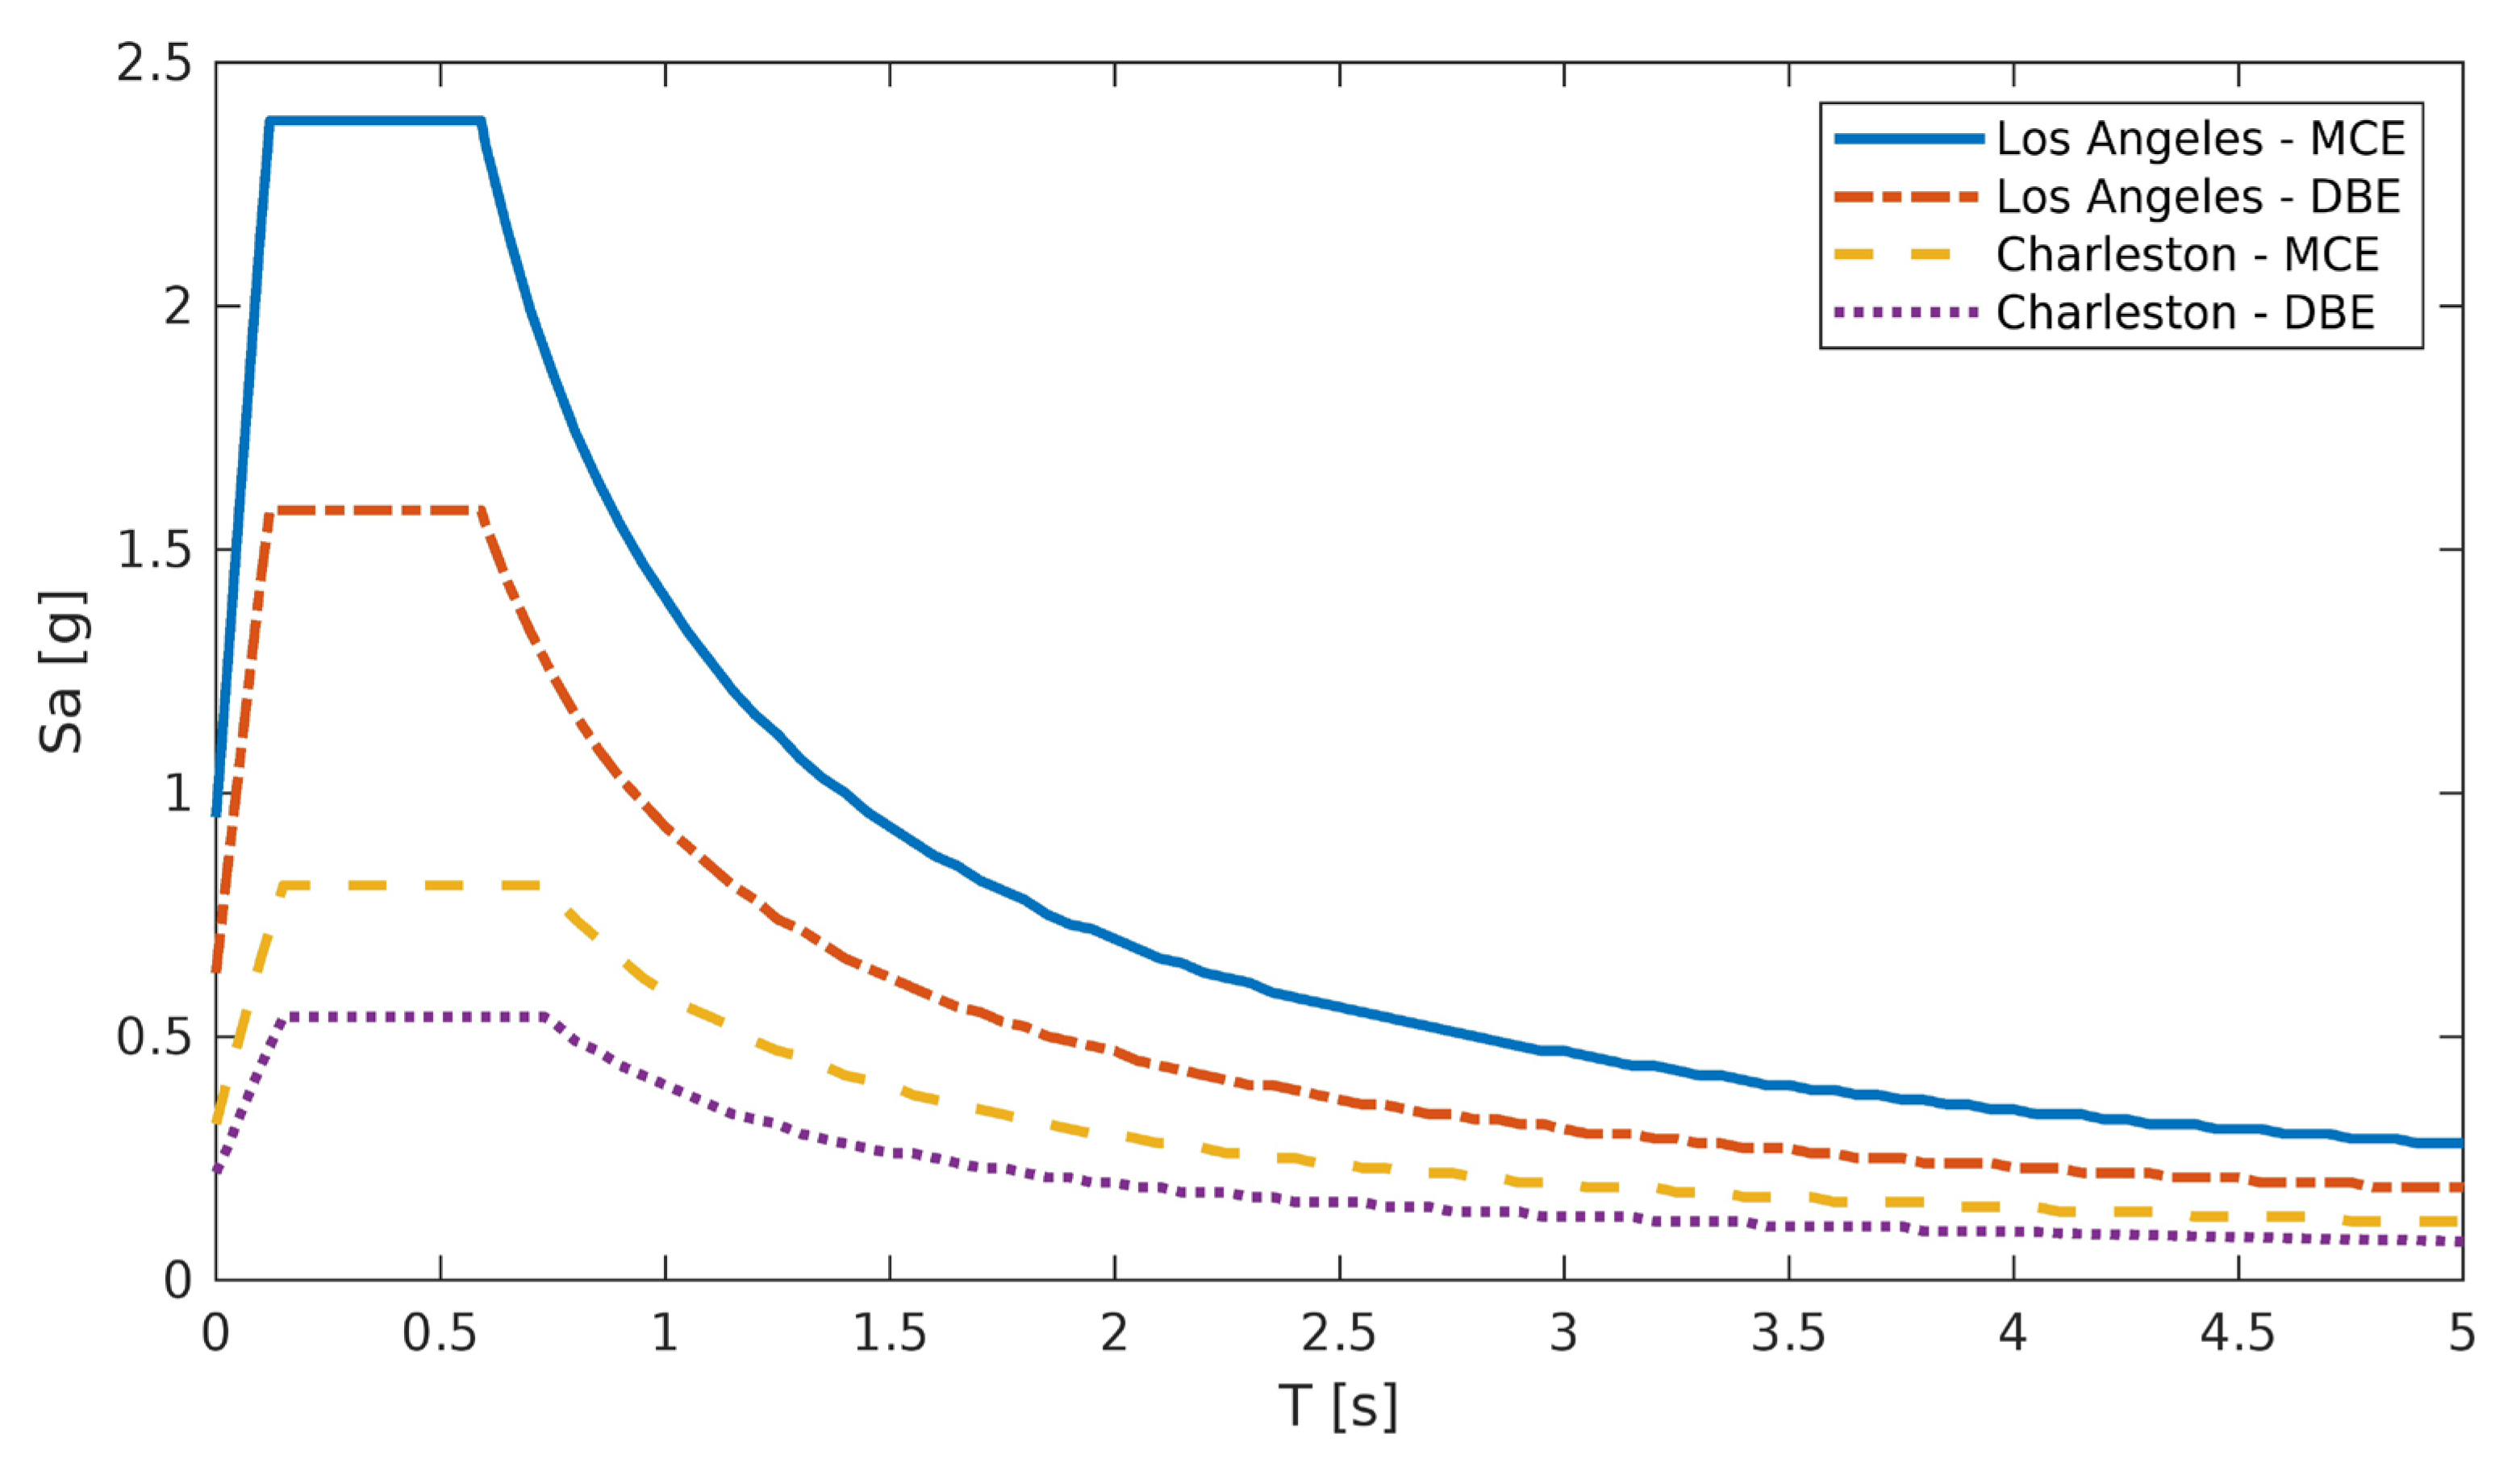
According to [1], the soil site for Los Angeles is Class CD (dense sand or very stiff clay with an estimated shear wave velocity between 305 and 442 m/s) and that for Charleston is Class DE (loose sand or medium stiff clay with an estimated shear wave velocity between 152 and 213 m/s). Based on these soil site classifications, 24 ground motion records (12 for each site, as shown in Table A1 and Table A2 of Appendix A) were selected. Before analysis can be carried out, these ground motions need to be scaled against a site-specific target spectrum. The DBE (for the performance level of IO) and MCE (for the performance level of LS) target spectra used for scaling the selected ground motions for Los Angeles and Charleston can be obtained from [1] or from https://asce7hazardtool.online (accessed on 15 August 2023) and are shown in Figure 2. Note that all the ASCE/SEI 7-22 spectra assume a 5% damping, and the MCE spectra are obtained from the respective DBE spectra by multiplying the ordinates of the latter by 1.5. The software SeismoMatch (https://seismosoft.com/products/seismomatch) (accessed on 15 August 2023) can be used for this scaling. Once the ground motions have been scaled, Equation (1) can be used to develop the earthquake power spectra.
4.2. Wind Data
To keep the probability of exceedance consistent for both earthquakes and wind for the performance levels of IO and LS, the probability of exceedance for wind is calculated based on a Poisson distribution given by
where is the probability of exceedance over a period of years, is the mean return period in years and is the number of occurrences in years.
For a given location, the mean return period (or mean recurrence interval) of wind at each performance level can be estimated using the wind maps given in [1] or from https://asce7hazardtool.online (accessed on 1 September 2023). The basic wind speeds determined at the two locations (Los Angeles and Charleston) for the two performance levels (IO and LS) are given in Table 2. Equations (6) and (7) can now be used to obtain the wind power spectra.
5. Dual Earthquake–Wind Hazard Excitations
For each earthquake and wind load, the dual earthquake–wind power spectrum is obtained by combining the earthquake and wind power spectra using Equation (8). The dual earthquake–wind excitation is then obtained by first determining by applying an inverse fast Fourier transform (IFFT) to the dual earthquake–wind power spectrum, then adding or subtracting the steady component of wind in accordance with Equation (9).
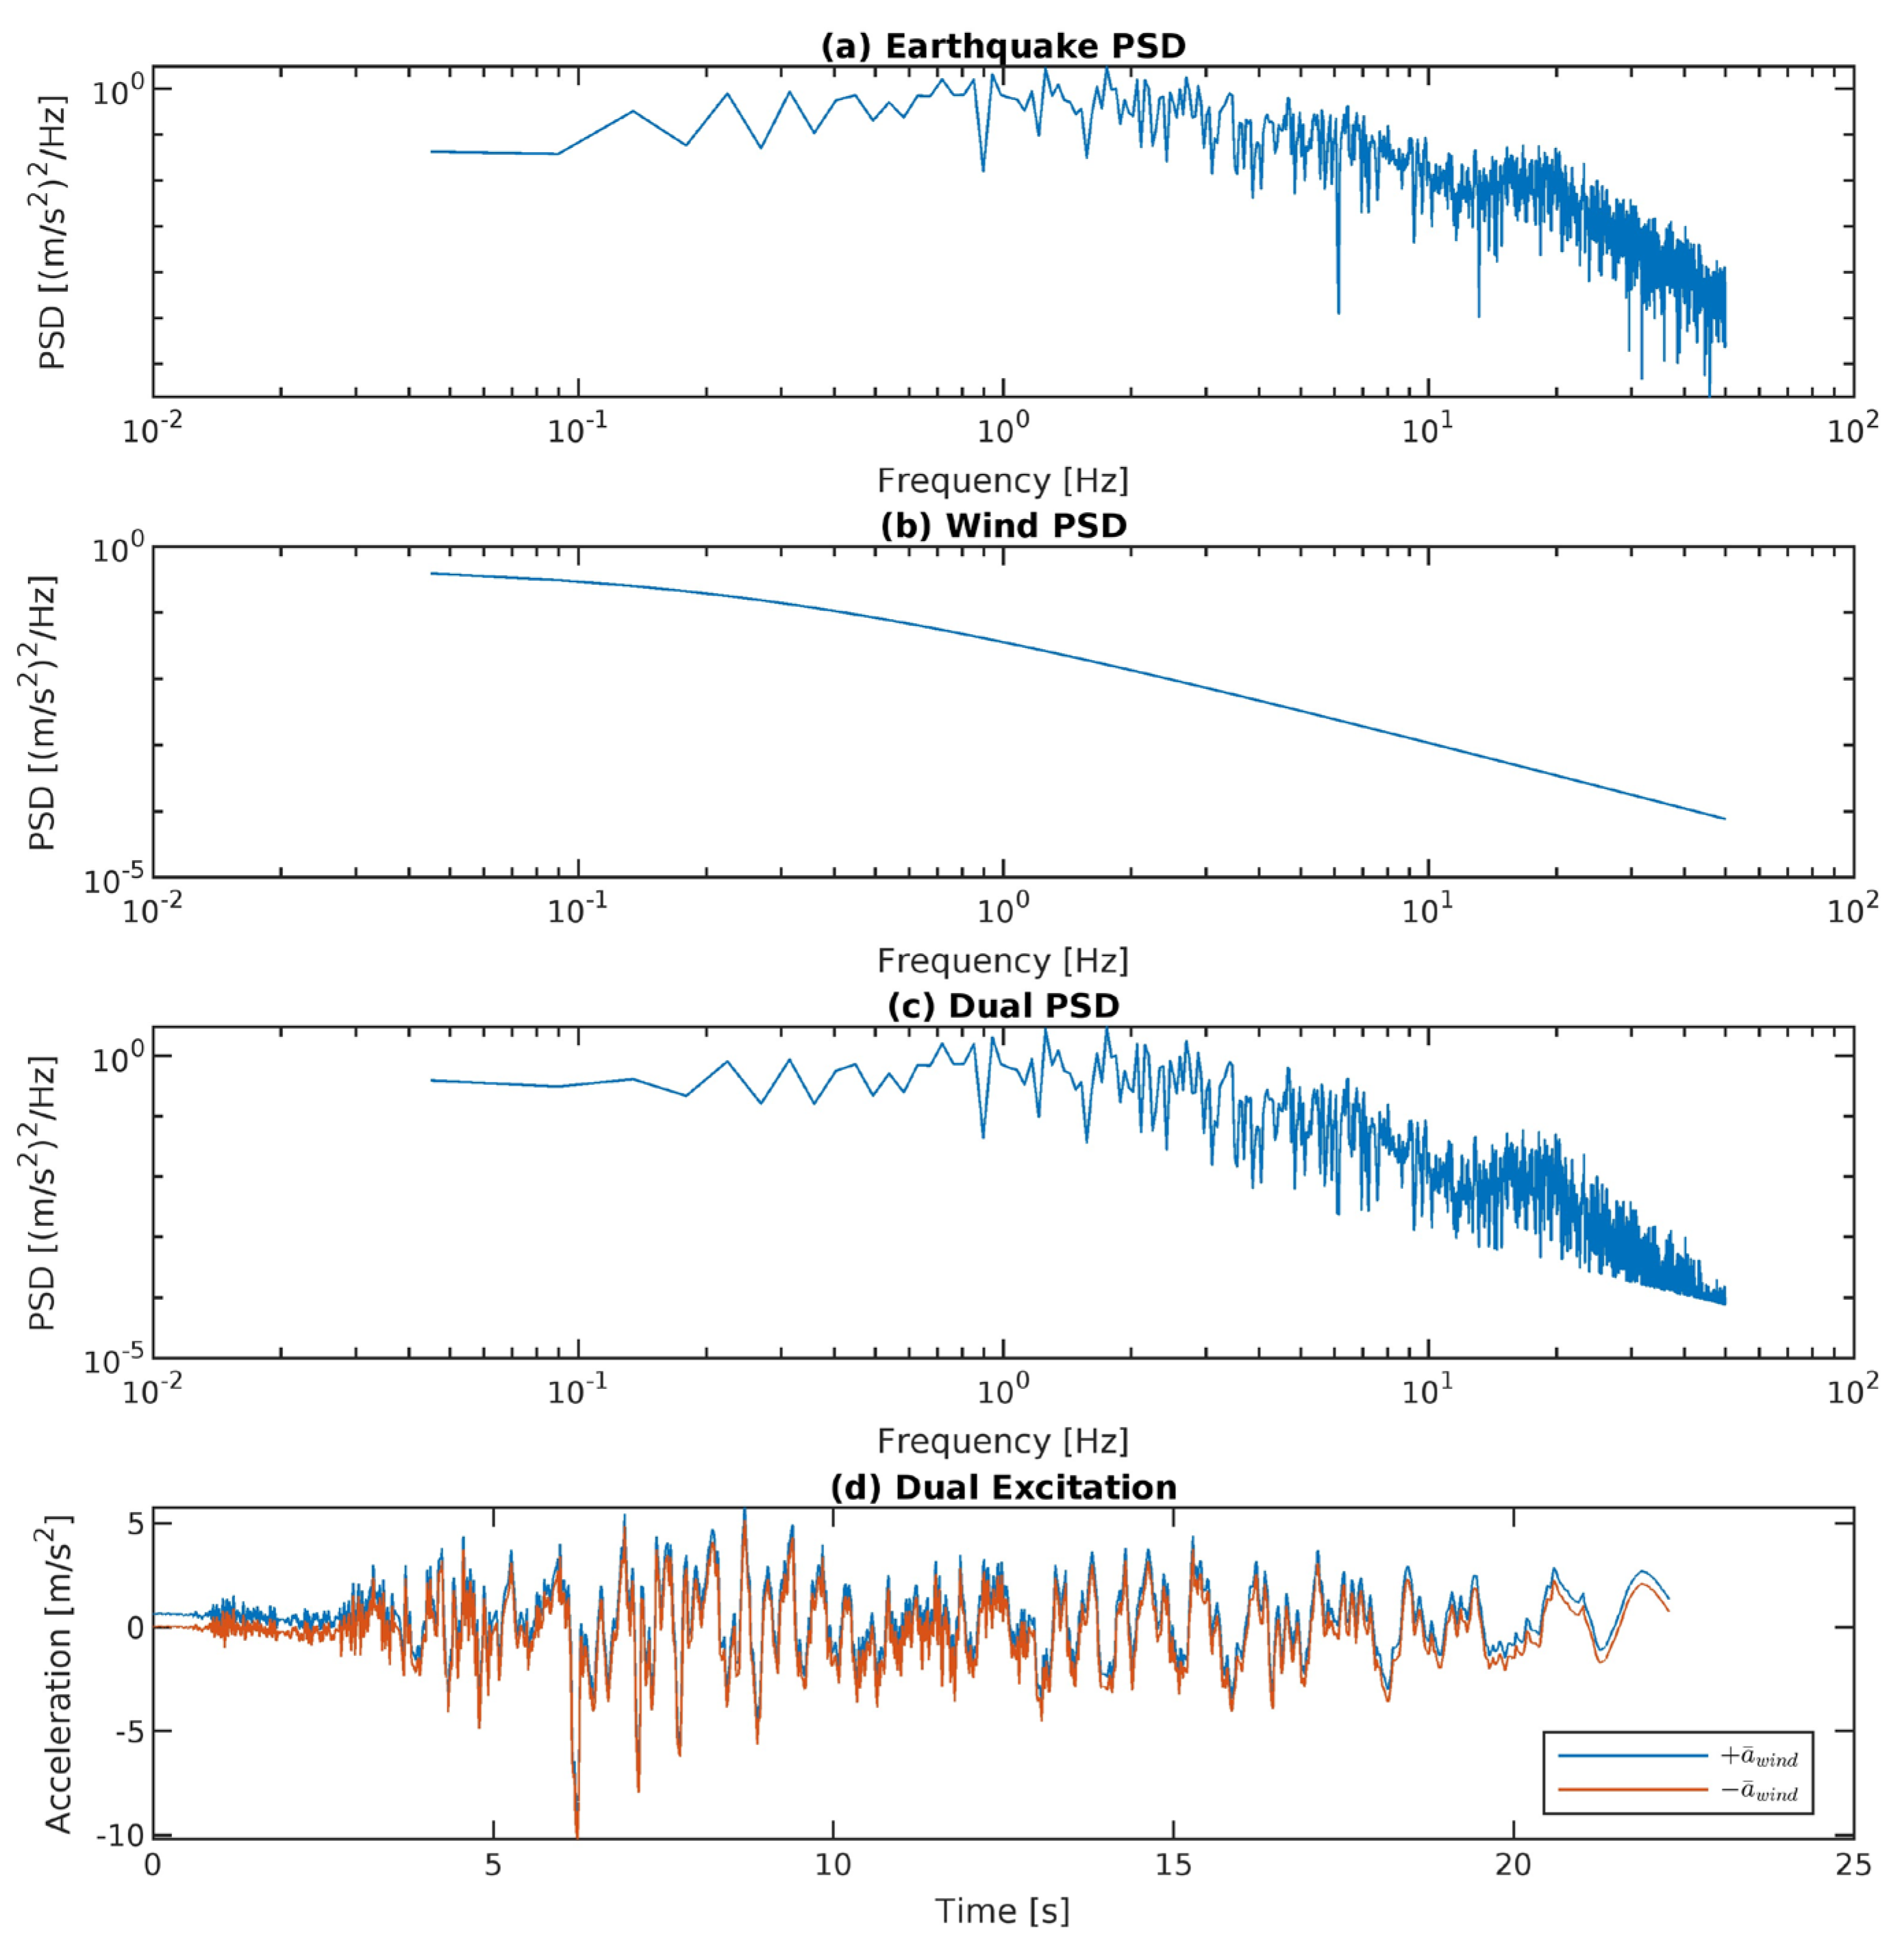
As an illustration, the power spectrum computed for a ground motion with a record sequence number (RSN) of 725 (Table A1), scaled using the response spectrum for the performance level of IO in Los Angeles, is shown in Figure 3a. The corresponding power spectrum for wind—using a basic wind speed of 41 m/s and applied to a hypothetical portal frame with 3.96 m height, 18 m2 along-wind surface area and 21,000 kg mass—is shown in Figure 3b. By using Equation (8), the dual earthquake–wind power spectrum is shown in Figure 3c. Applying IFFT to this spectrum and incorporating the steady component of wind using Equation (9), the resulting dual earthquake–wind excitations are shown in Figure 3d. Note that the plus and minus signs in Equation (9) lead to two excitations: one with added to and one with subtracted from . Therefore, for a given structure, two analyses need to be performed to determine which would result in a more severe condition.
6. Analysis Results for Moment Resisting Frame Responses to Dual Earthquake and Wind Hazards
The dual earthquake–wind excitations will now be applied to two steel frames. A three-story and a nine-story moment resisting frame (MRF) representing the typical low- and mid-rise buildings are to be analyzed. These frames were part of a study in the SAC Joint Venture [31]. The SAC Joint Venture was formed in mid-1994 with the specific goal of “investigating the damage to welded steel moment frame buildings in the 1994 Northridge earthquake and developing repair techniques and new design approaches to minimize damage to steel moment frame buildings in future earthquakes”. The frames designed and reported in this SAC project have since been used by a number of researchers as benchmark structures in their study of the dynamic responses of steel buildings. Detailed descriptions of these steel frames can be found in [31]. It should be noted that all the beams and columns used for these two frames are compact sections, so local buckling of flanges and webs will not occur though nonlinearities in the form of the P-delta effect and inelasticity will be considered in all the analyses.
Both frames were modeled as 2-D structures with three degrees of freedom per node using OpenSees (https://opensees.berkeley.edu) (accessed on 15 August 2023). To allow modeling of geometrical and material nonlinearities, nonlinear beam–column elements with fiber sections were used to model the columns and beams. Each member was discretized into 6 segments and the cross-sections of the W-shaped columns and beams were discretized into 48 fibers, with 2 layers of 8 fibers used for both the flanges and the web to capture the progression of inelastic behavior along the member and over the cross-section. The commonly used Steel01 material was used to represent the frame material with a bilinear and kinetic hardening ratio of 0.003. The elastic modulus is 200 GPa (29,000 ksi) and the design yield strengths for the beams and columns are 248 MPa (36 ksi) and 345 MPa (50 ksi), respectively. Seismic lumped masses were transferred from the beam to the floor level nodes. The base of the frames was modeled as fixed for the 3-story frame but pinned for the nine-story frame. Although the nine-story frame has a basement, the lateral translation at the ground level was restrained so the translations at the ground and basement levels were considered negligible. In this study, only the responses of the frames above ground were investigated. To avoid bi-axial bending, the moments at the end of one of the exterior bays for the nine-story frame were released.
Gravity load was incorporated in OpenSees to allow for the P-delta effect of gravity load from all the interior frames to be considered in the analysis. The gravity load consisted of two parts. One was from the tributary area associated with each moment resisting frame and was applied as vertically distributed load on the beams. The other was from the tributary area associated with the interior gravity frames and was applied to each story on a leaning column placed on one side of the moment frame and connected via rigid links to the frame. The axial loads applied to this leaning column were used to simulate the P-delta effect caused by gravity loads acting on these interior frames. The rigid links were modeled as truss elements. The leaning columns were modeled as very stiff elastic beam-column elements with pinned connections at the floor level. These leaning columns have no effect on the lateral stiffness of the moment frames. The pinned connection was modeled as a rotational spring with very small stiffness.
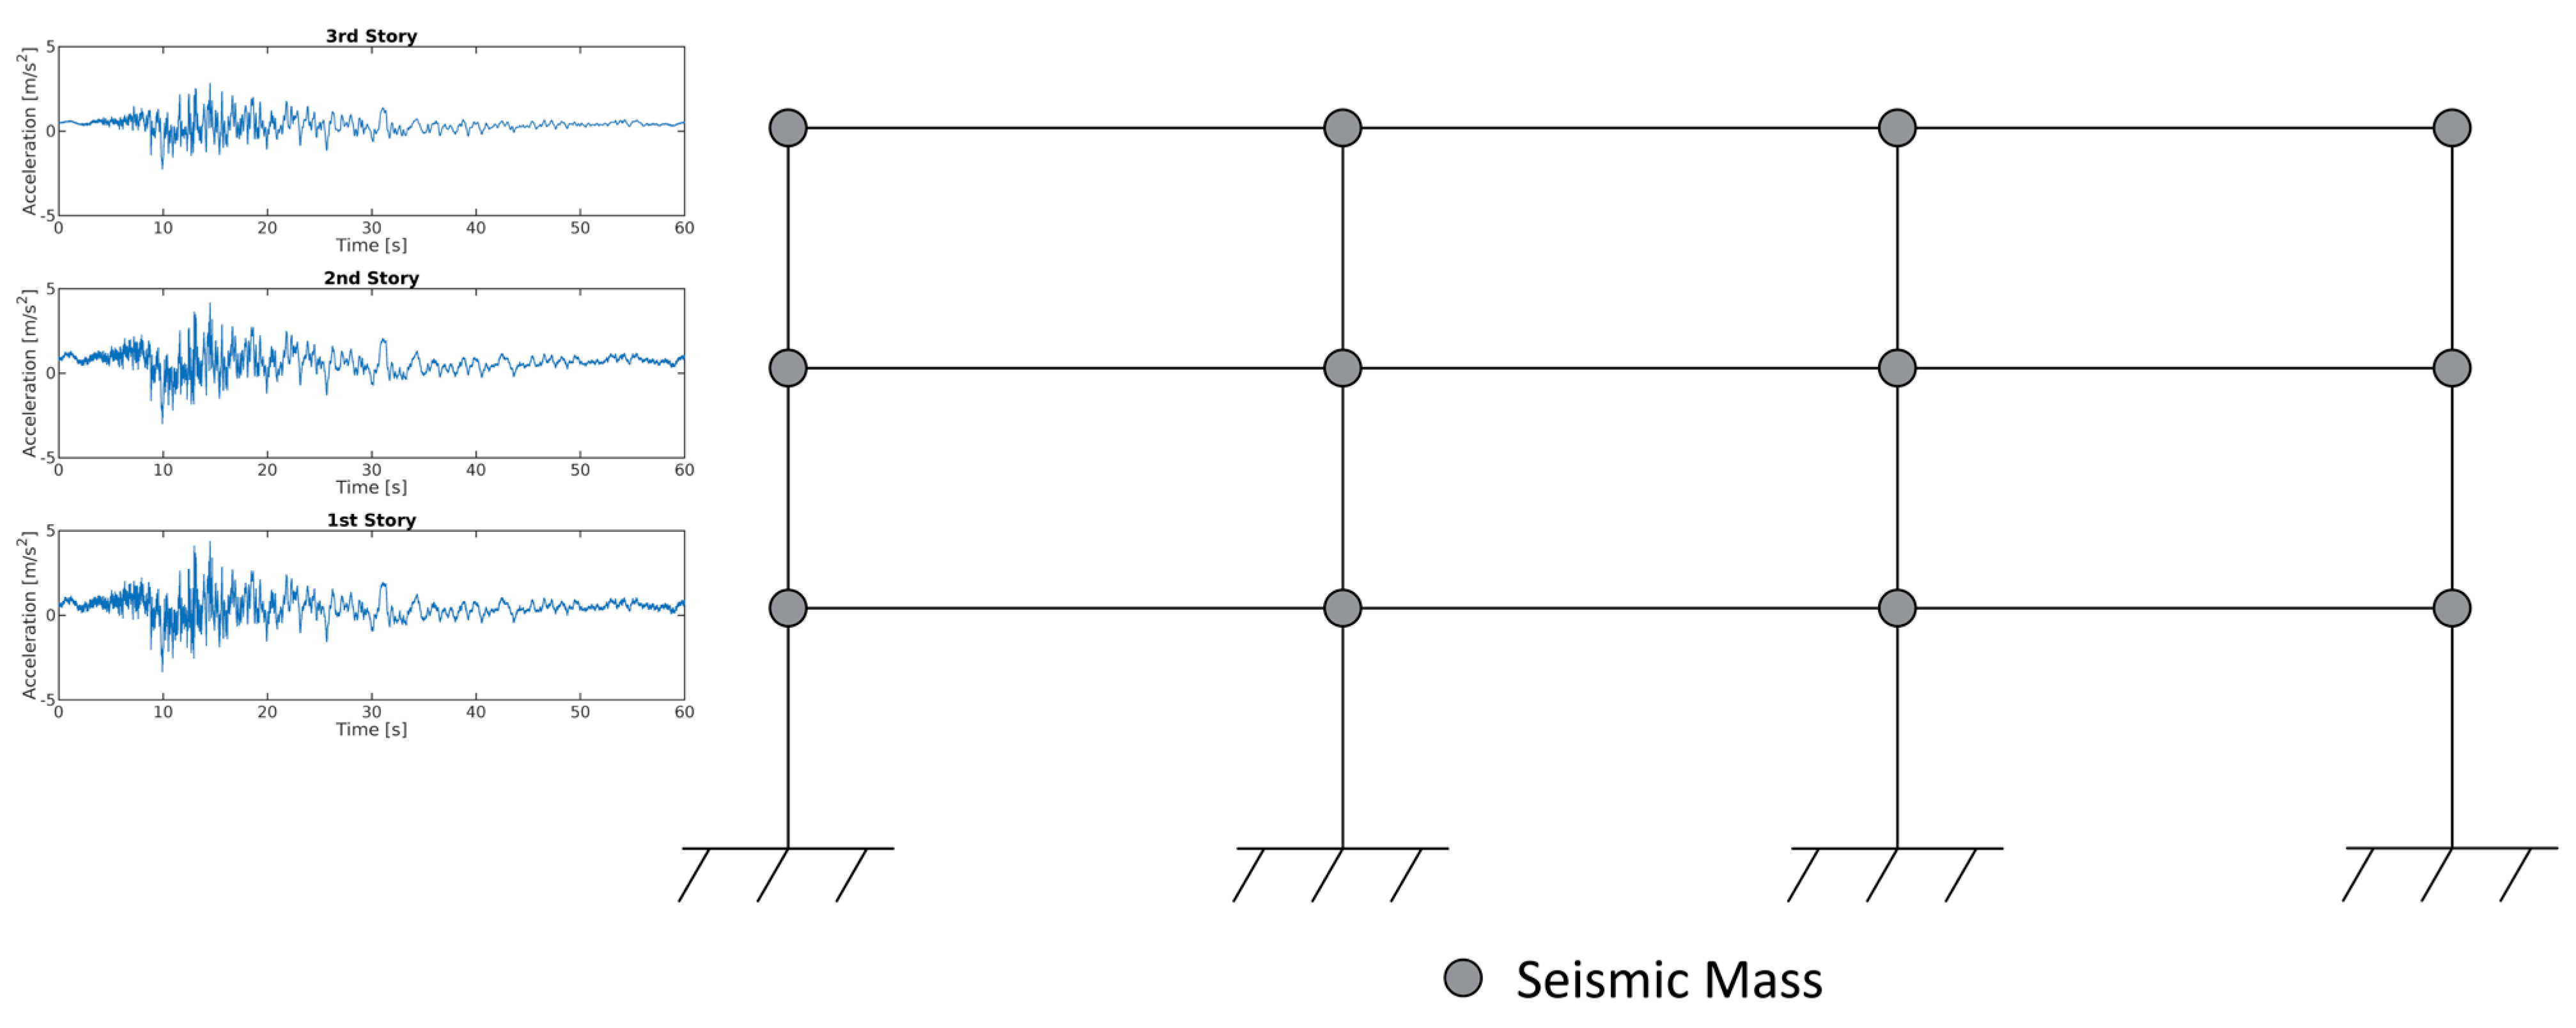
Since the power spectrum of wind changes with height, the dual excitations computed using the methodology described in the previous sections are story based. Each story is subject to a different time-history excitation applied to mass points of that story. All beam-to-column joints are considered mass points where the seismic lumped masses are placed. Figure 4 shows how the excitations vary from story to story for the three-story MRF.
The analysis was performed using the Newton algorithm and the Newmark-beta method with a tolerance of . Rayleigh damping was used, with a damping ratio of 5% assigned to the first and third modes of the structure. A 5% damping was used because the target spectra shown in Figure 2 and used to scale the ground motions were all based on 5% damping. Another 20 s zero excitation was added to the time-history loading, in order to capture the frame response after the dynamic excitation ceases.
6.1. Three-Story Frame
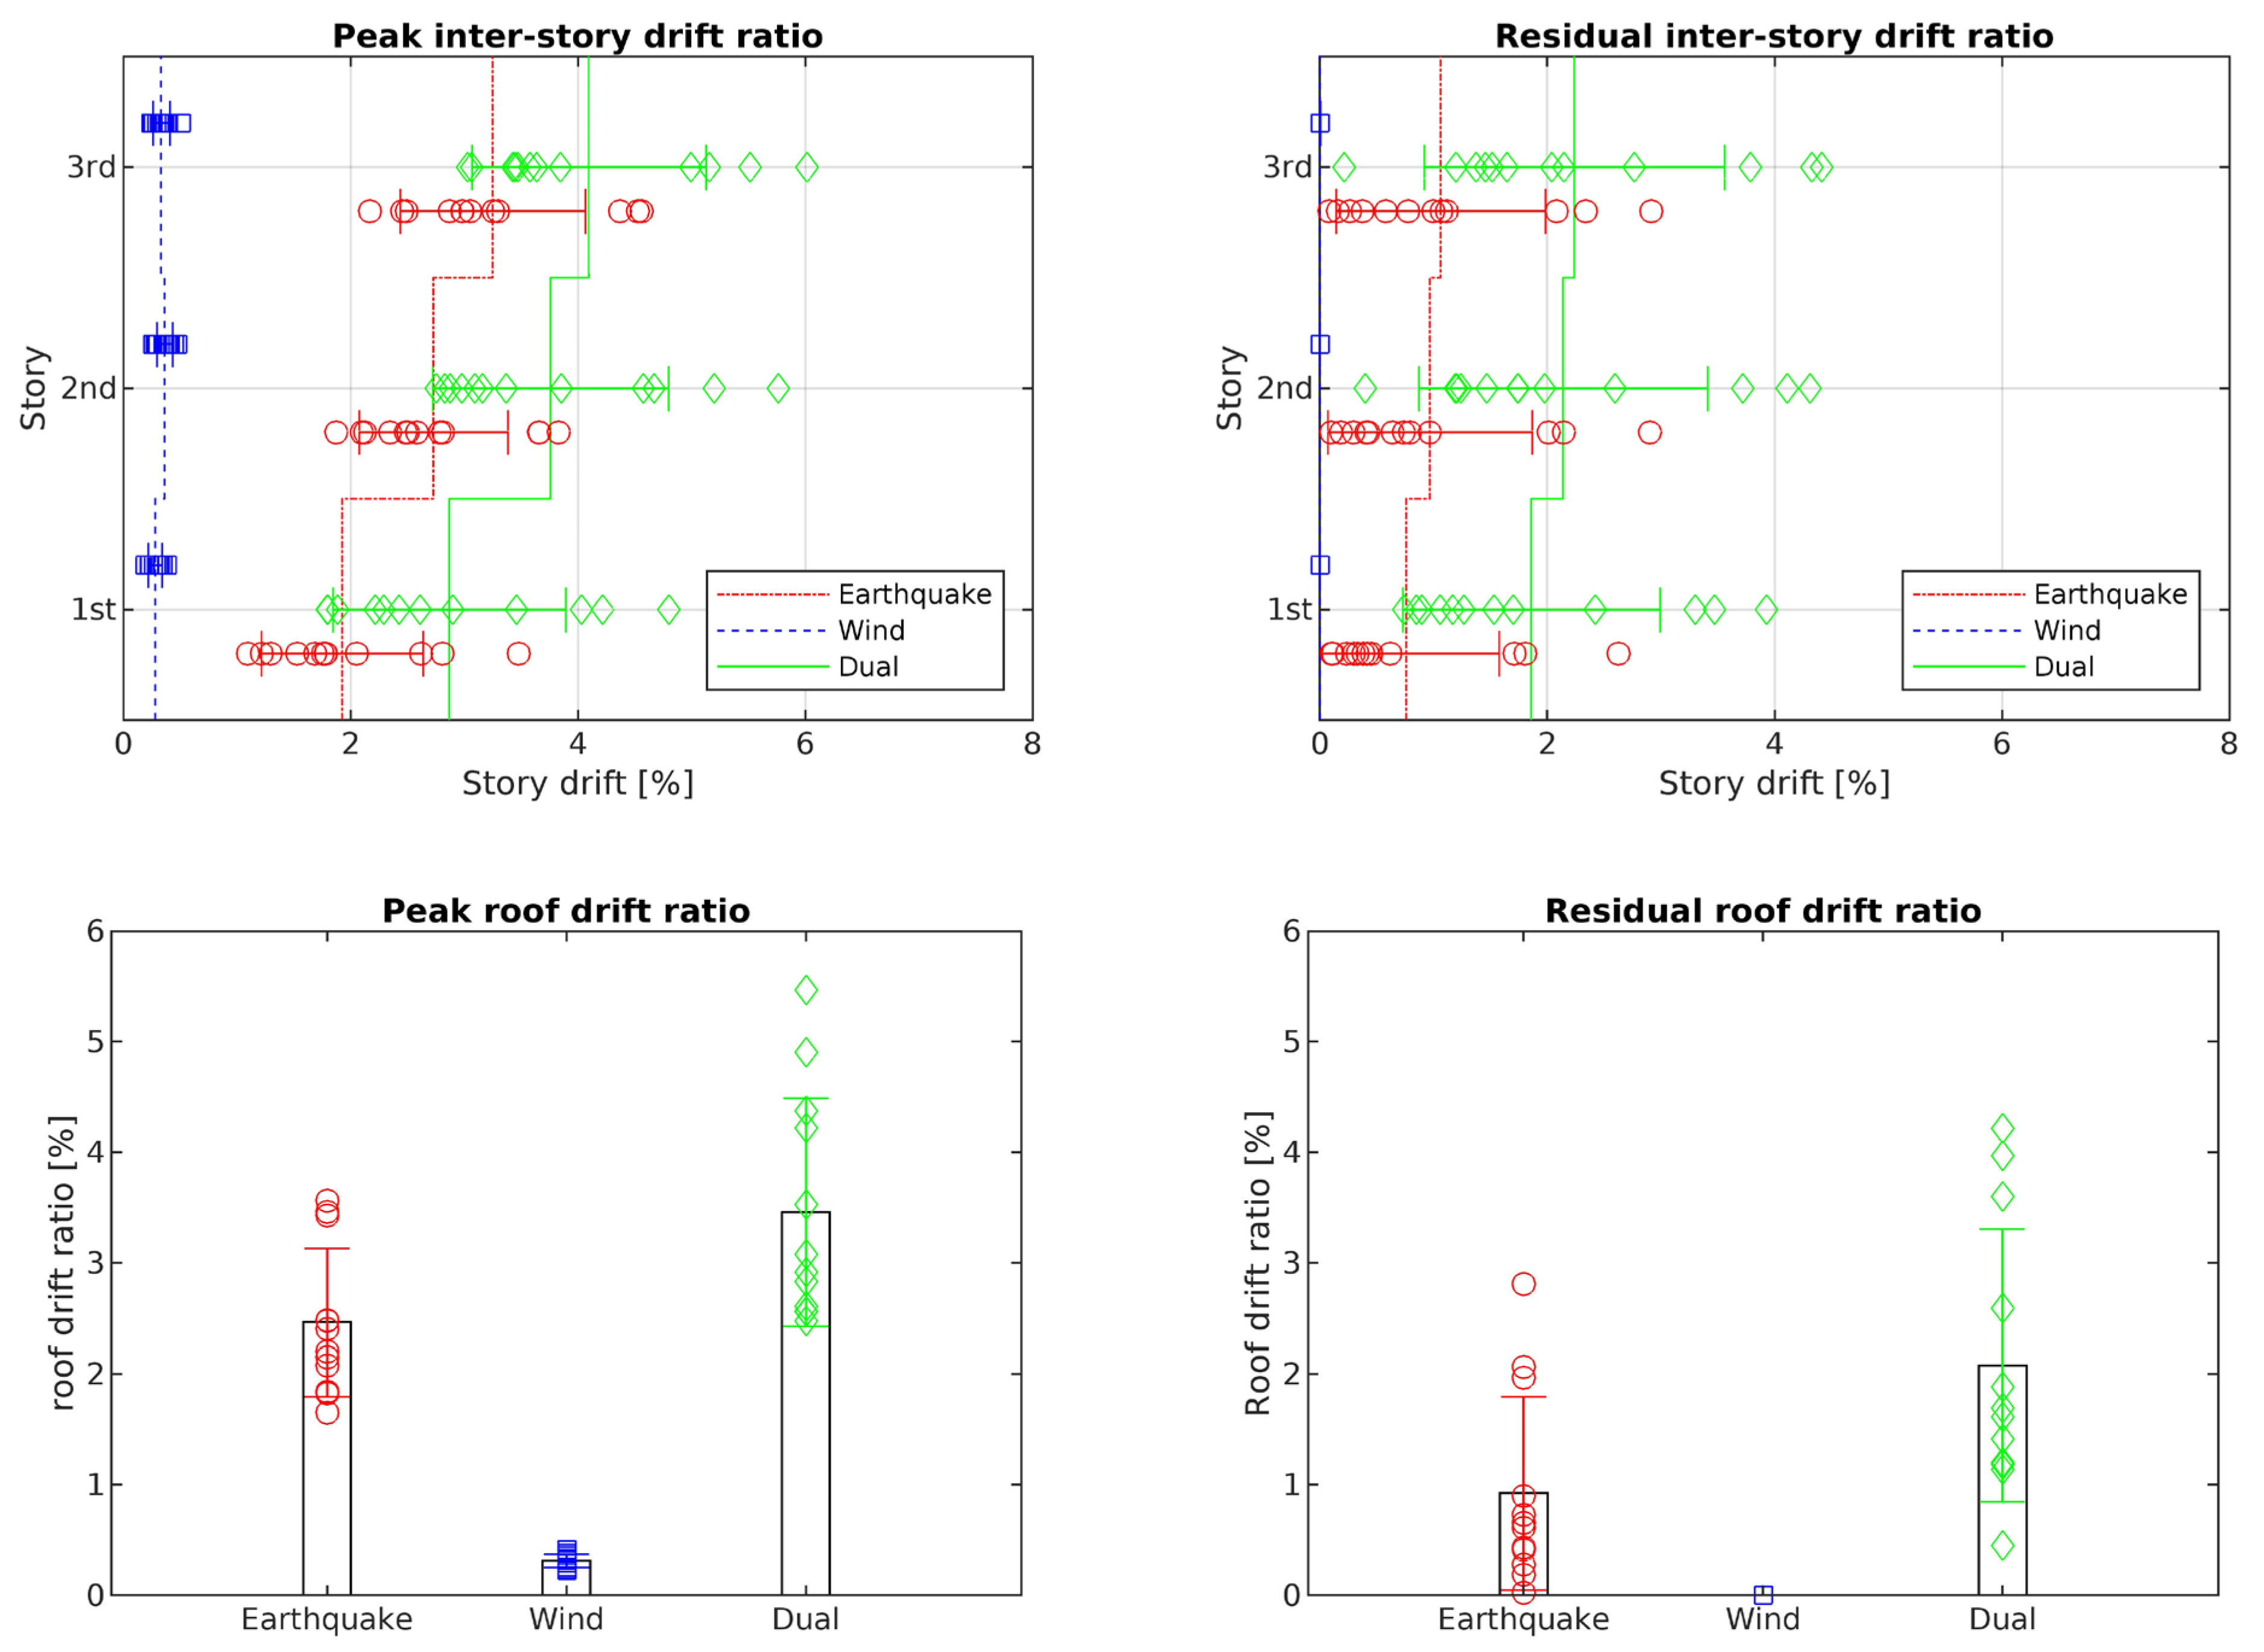
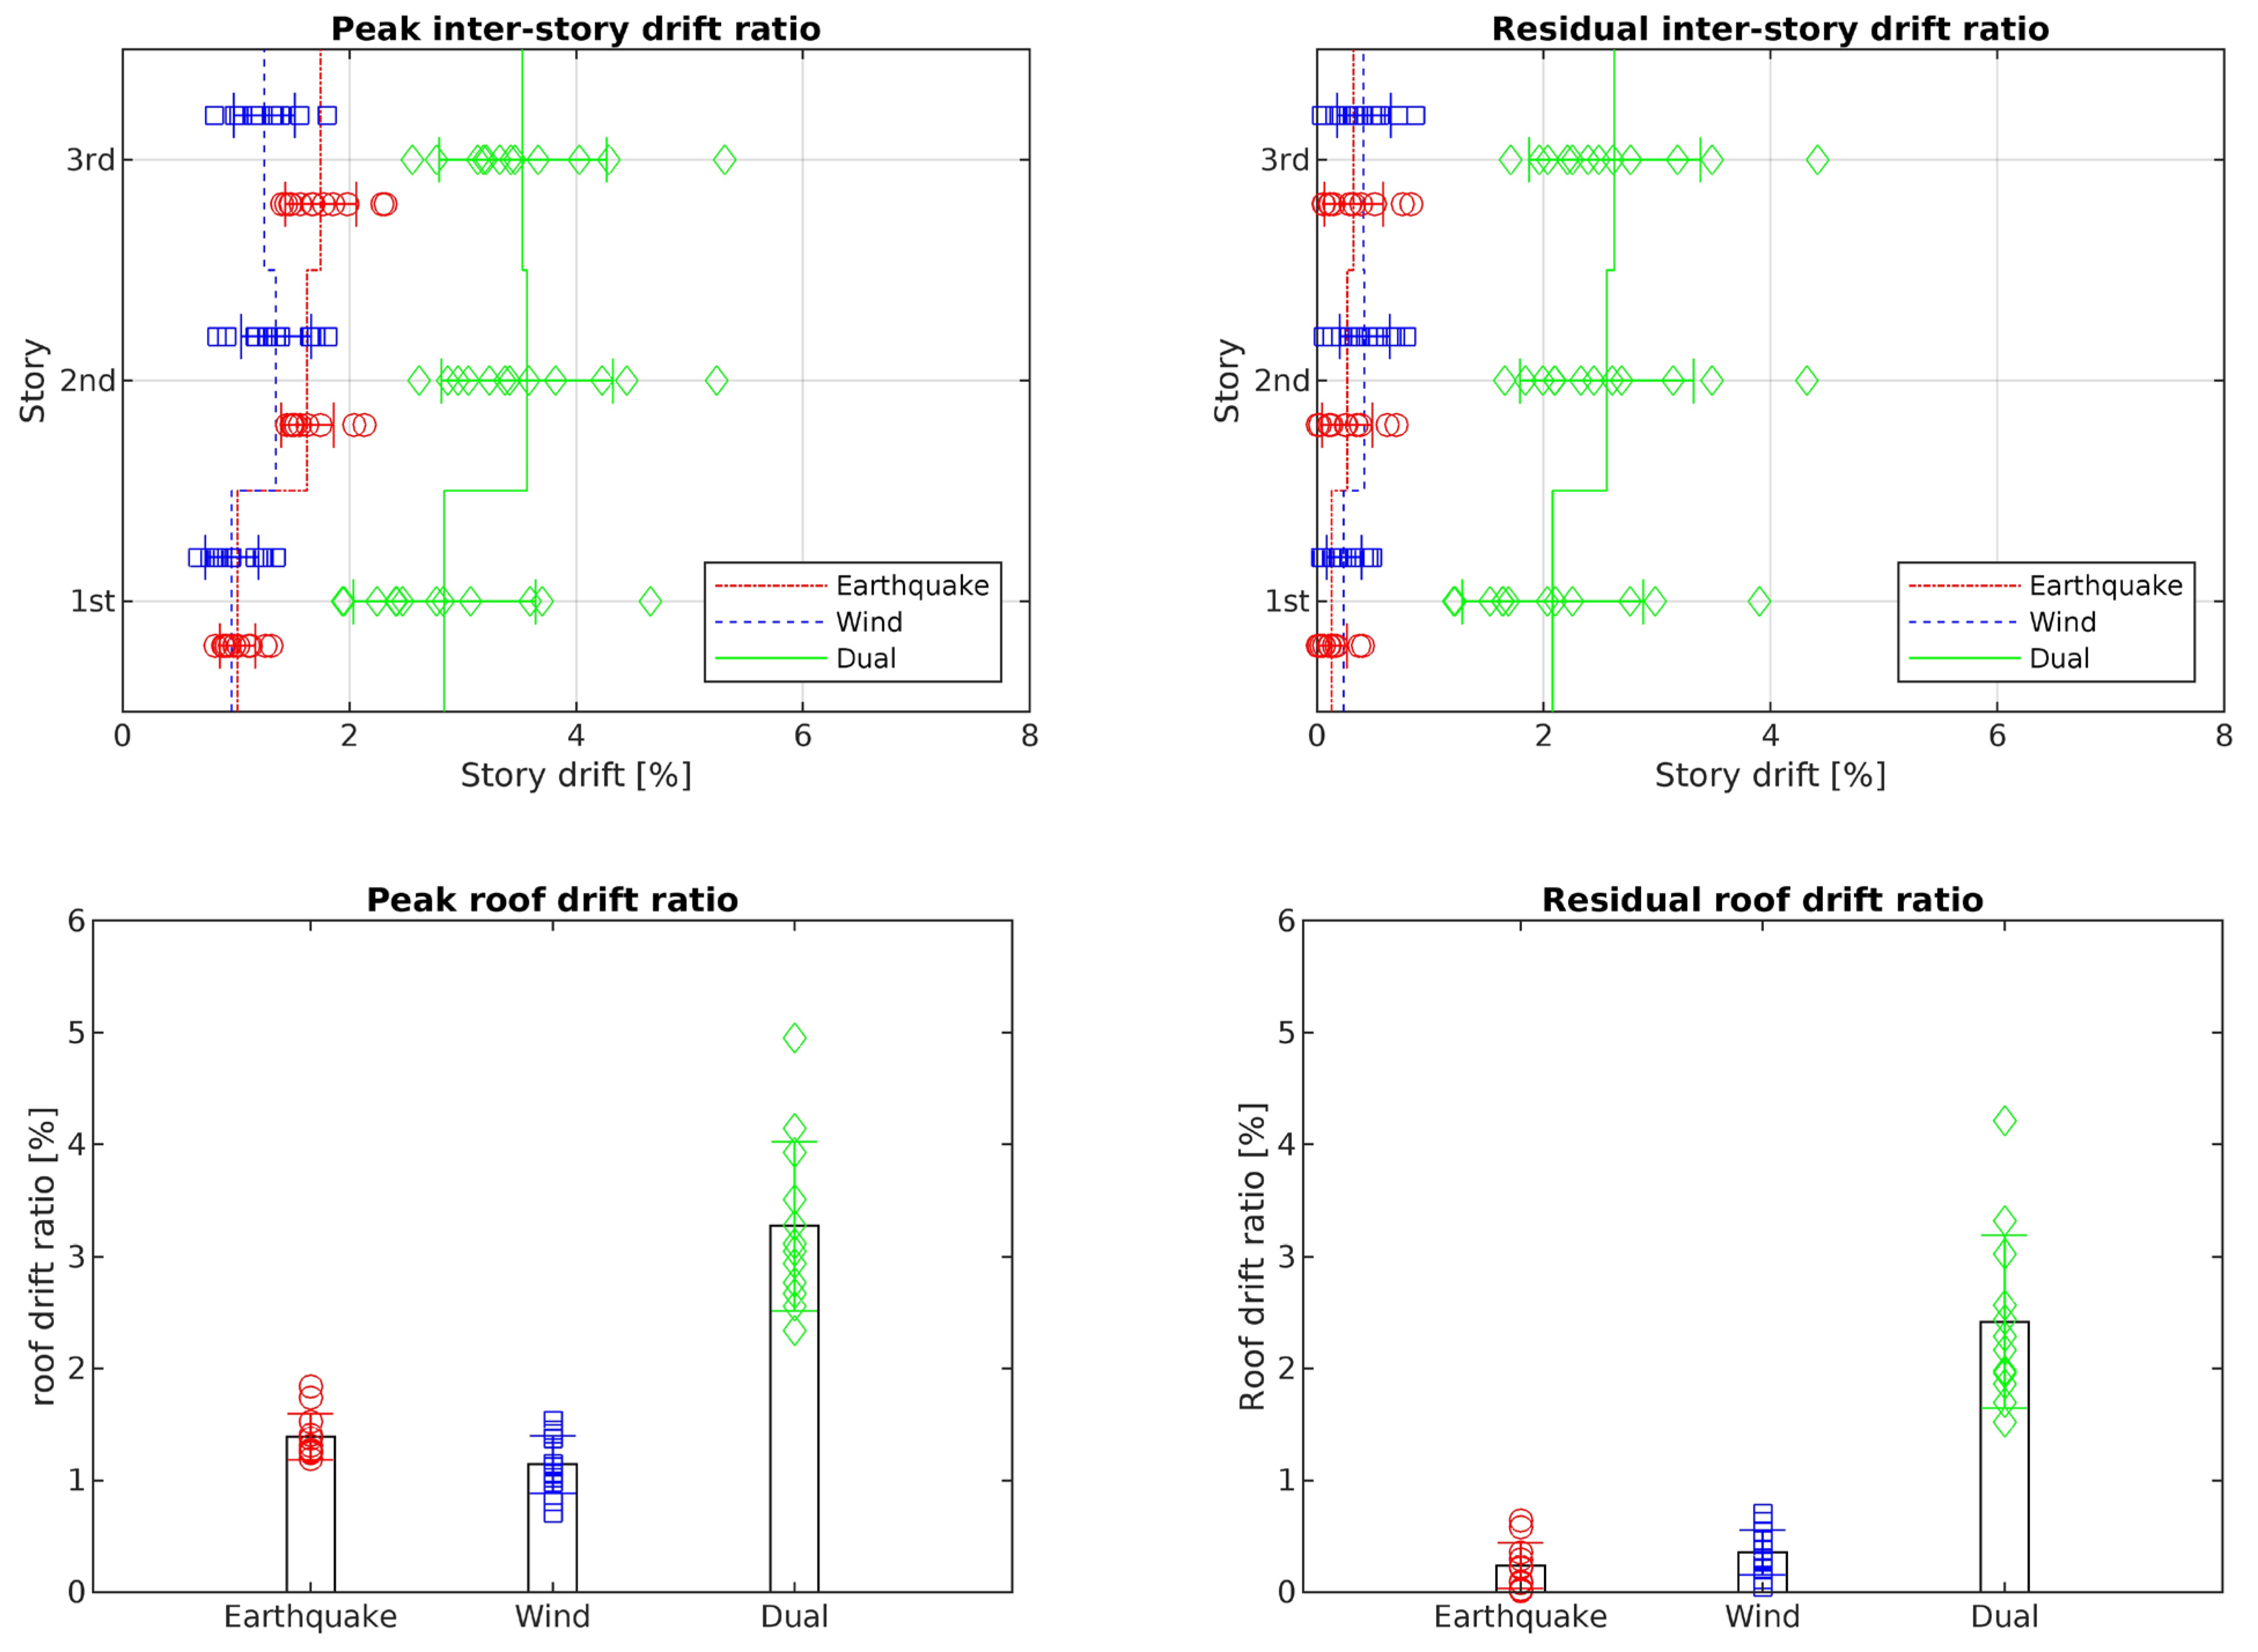
The analysis results for the peak and residual inter-story and roof drift ratios of the three-story frame subject to the 12 earthquake, wind and dual excitations in Los Angeles and Charleston are summarized in Figure 5, Figure 6, Figure 7 and Figure 8. The vertical lines in the figures represent the mean values of the 12 responses obtained using nonlinear time-history analysis, with earthquake responses shown by red circles, wind responses shown by blue squares, and dual responses shown by green diamonds. The standard deviations, shown in the form of error bars, were computed to show the variability or spread of the analysis results.
- Los Angeles:
Figure 5 shows the peak and residual inter-story and roof drift ratios of the three-story frame analyzed for IO in Los Angeles. The structure experienced a maximum mean peak inter-story drift of 3.25% in the top story due to earthquakes, 0.36% in the middle story due to wind, and 4.10% in the top story due to the dual excitations. The corresponding maximum mean residual inter-story drift ratios were 1.06%, 0% and 2.24%, respectively. As for the peak and residual roof drifts, the mean values were 2.47%, 0.31% and 3.46%, and 0.92%, 0% and 2.08% due to earthquake, wind and dual excitations, respectively.
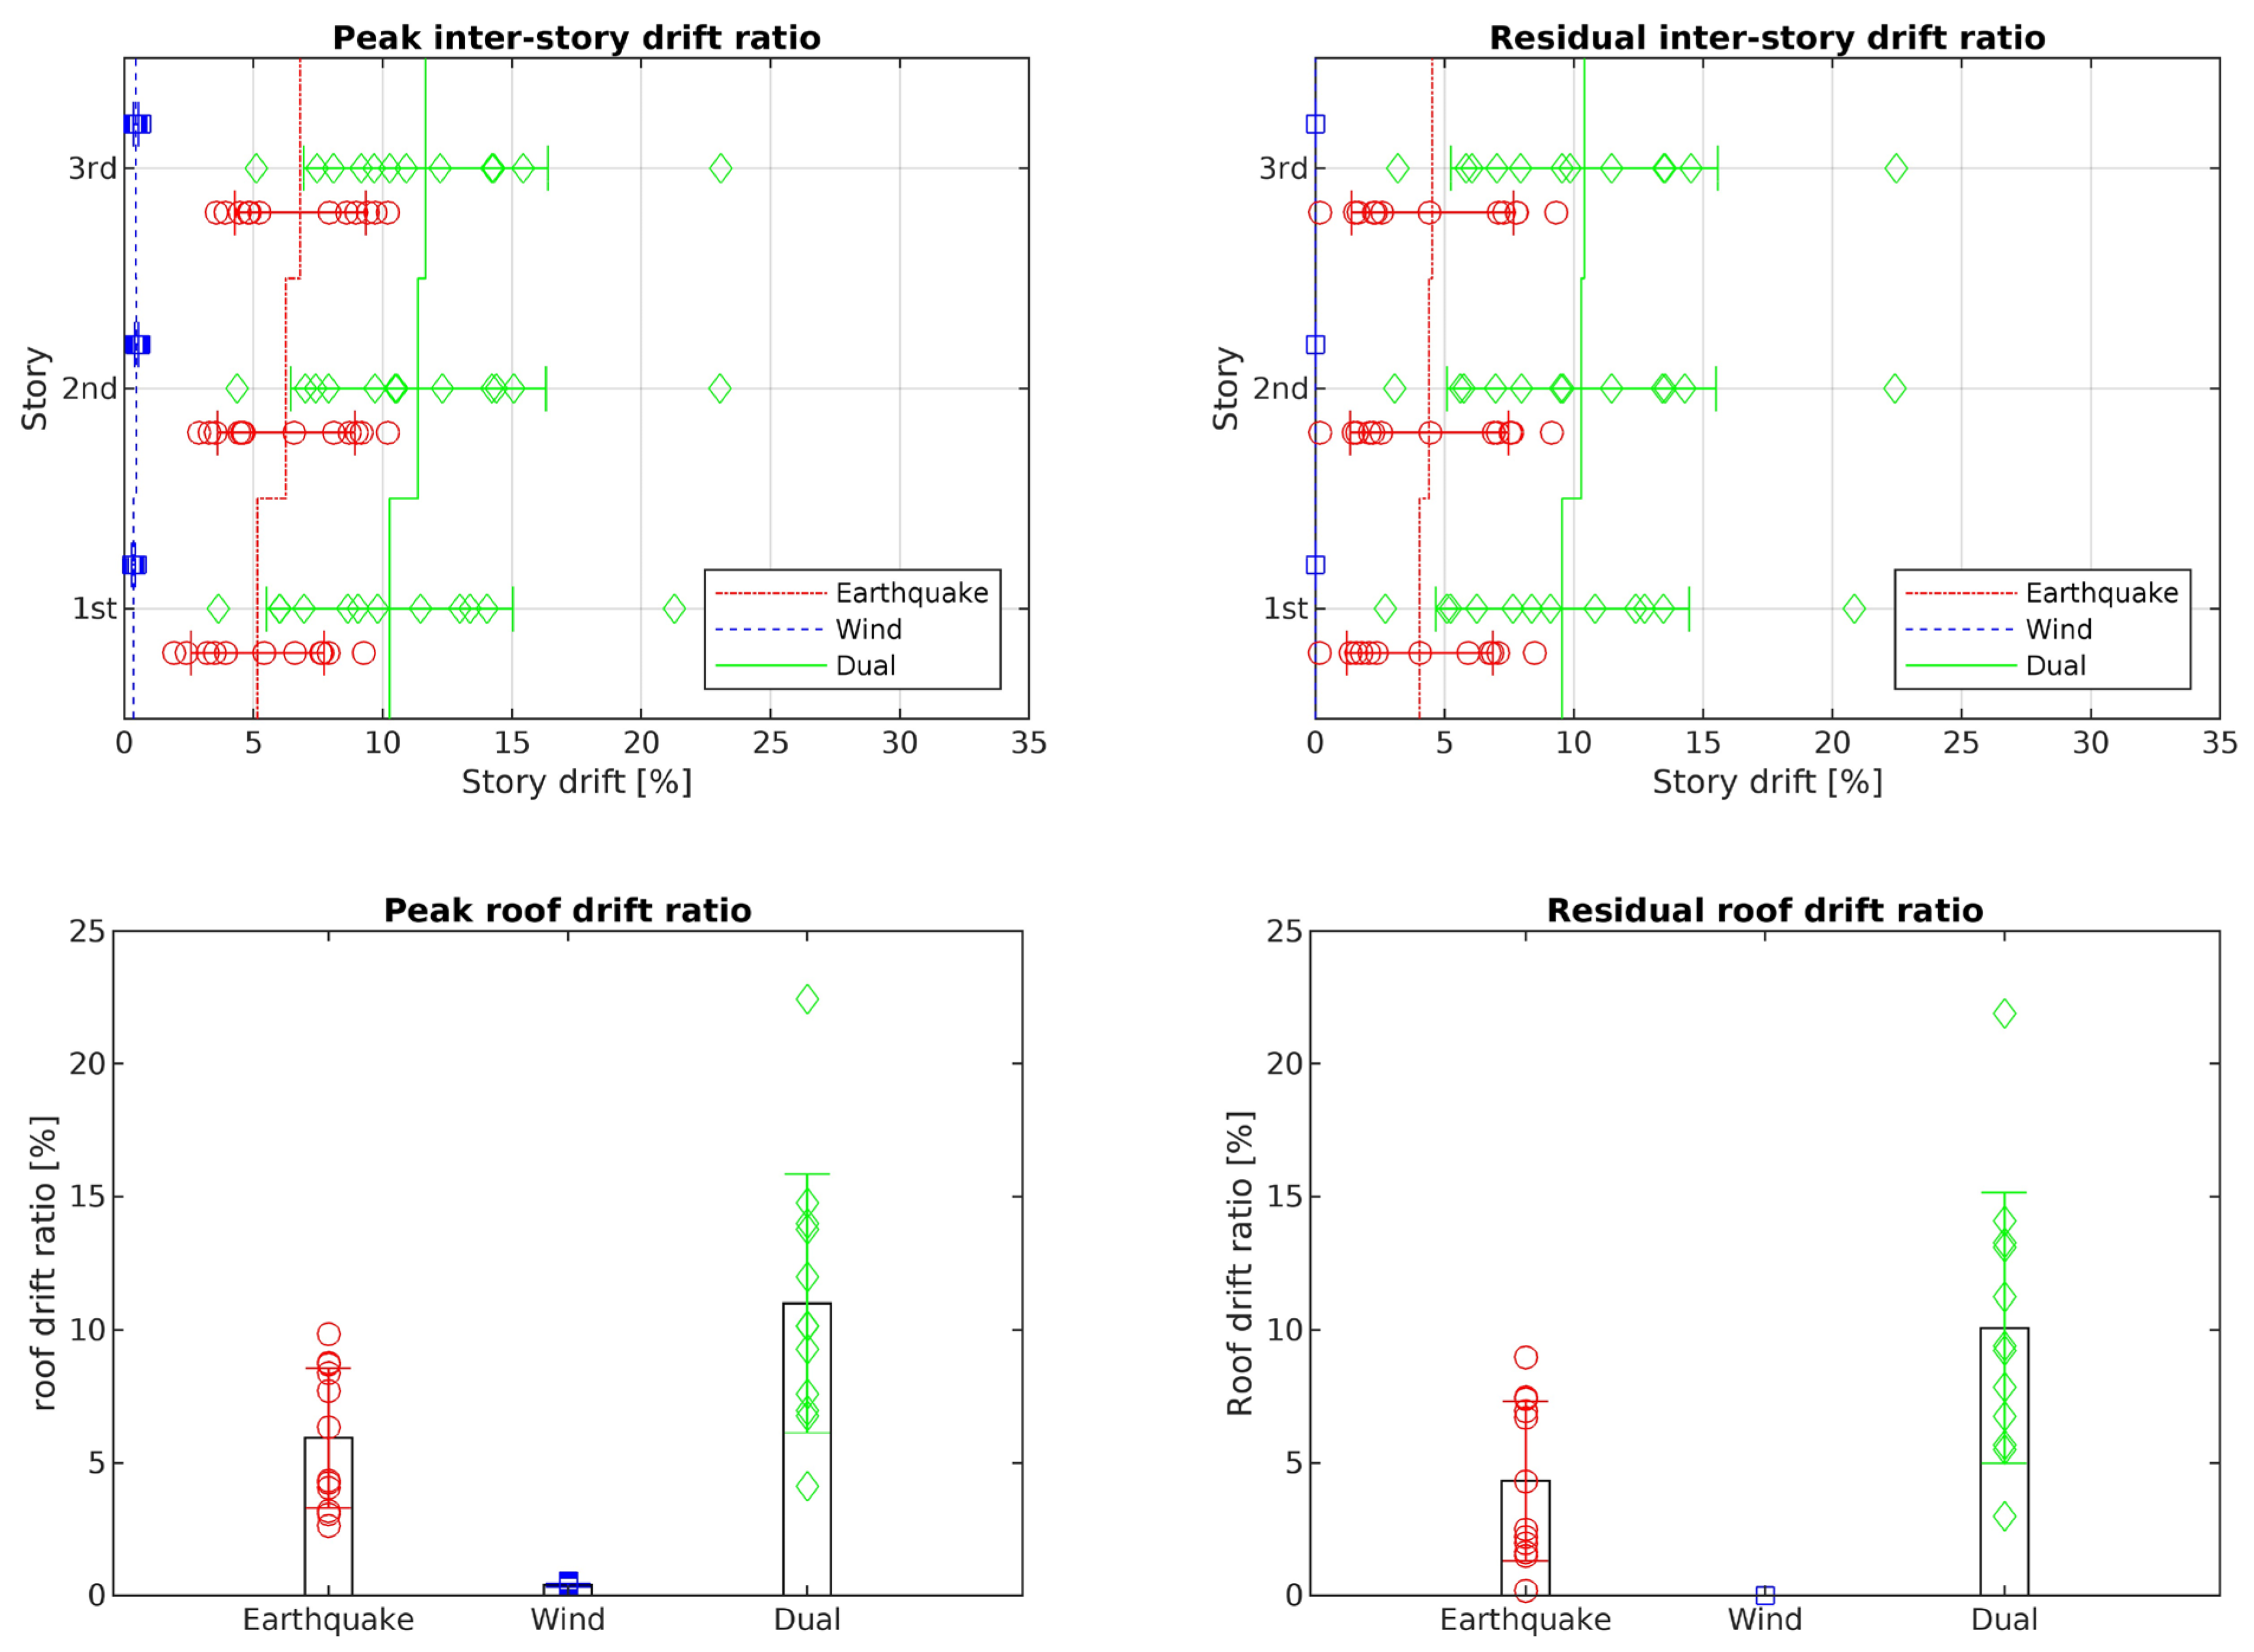
When the frame was analyzed for LS in Los Angeles, it can be seen from Figure 6 that the structure experienced maximum mean peak inter-story drift ratios of 6.80%, 0.47% and 11.65% and maximum mean residual inter-story drift ratios of 4.52%, 0% and 10.40% due to earthquake, wind and dual excitations, respectively.
The mean peak and residual roof drift ratios were 5.94% and 4.32% under earthquakes, 0.40% and 0% under wind, and 10.99% and 10.08% under the dual excitations.
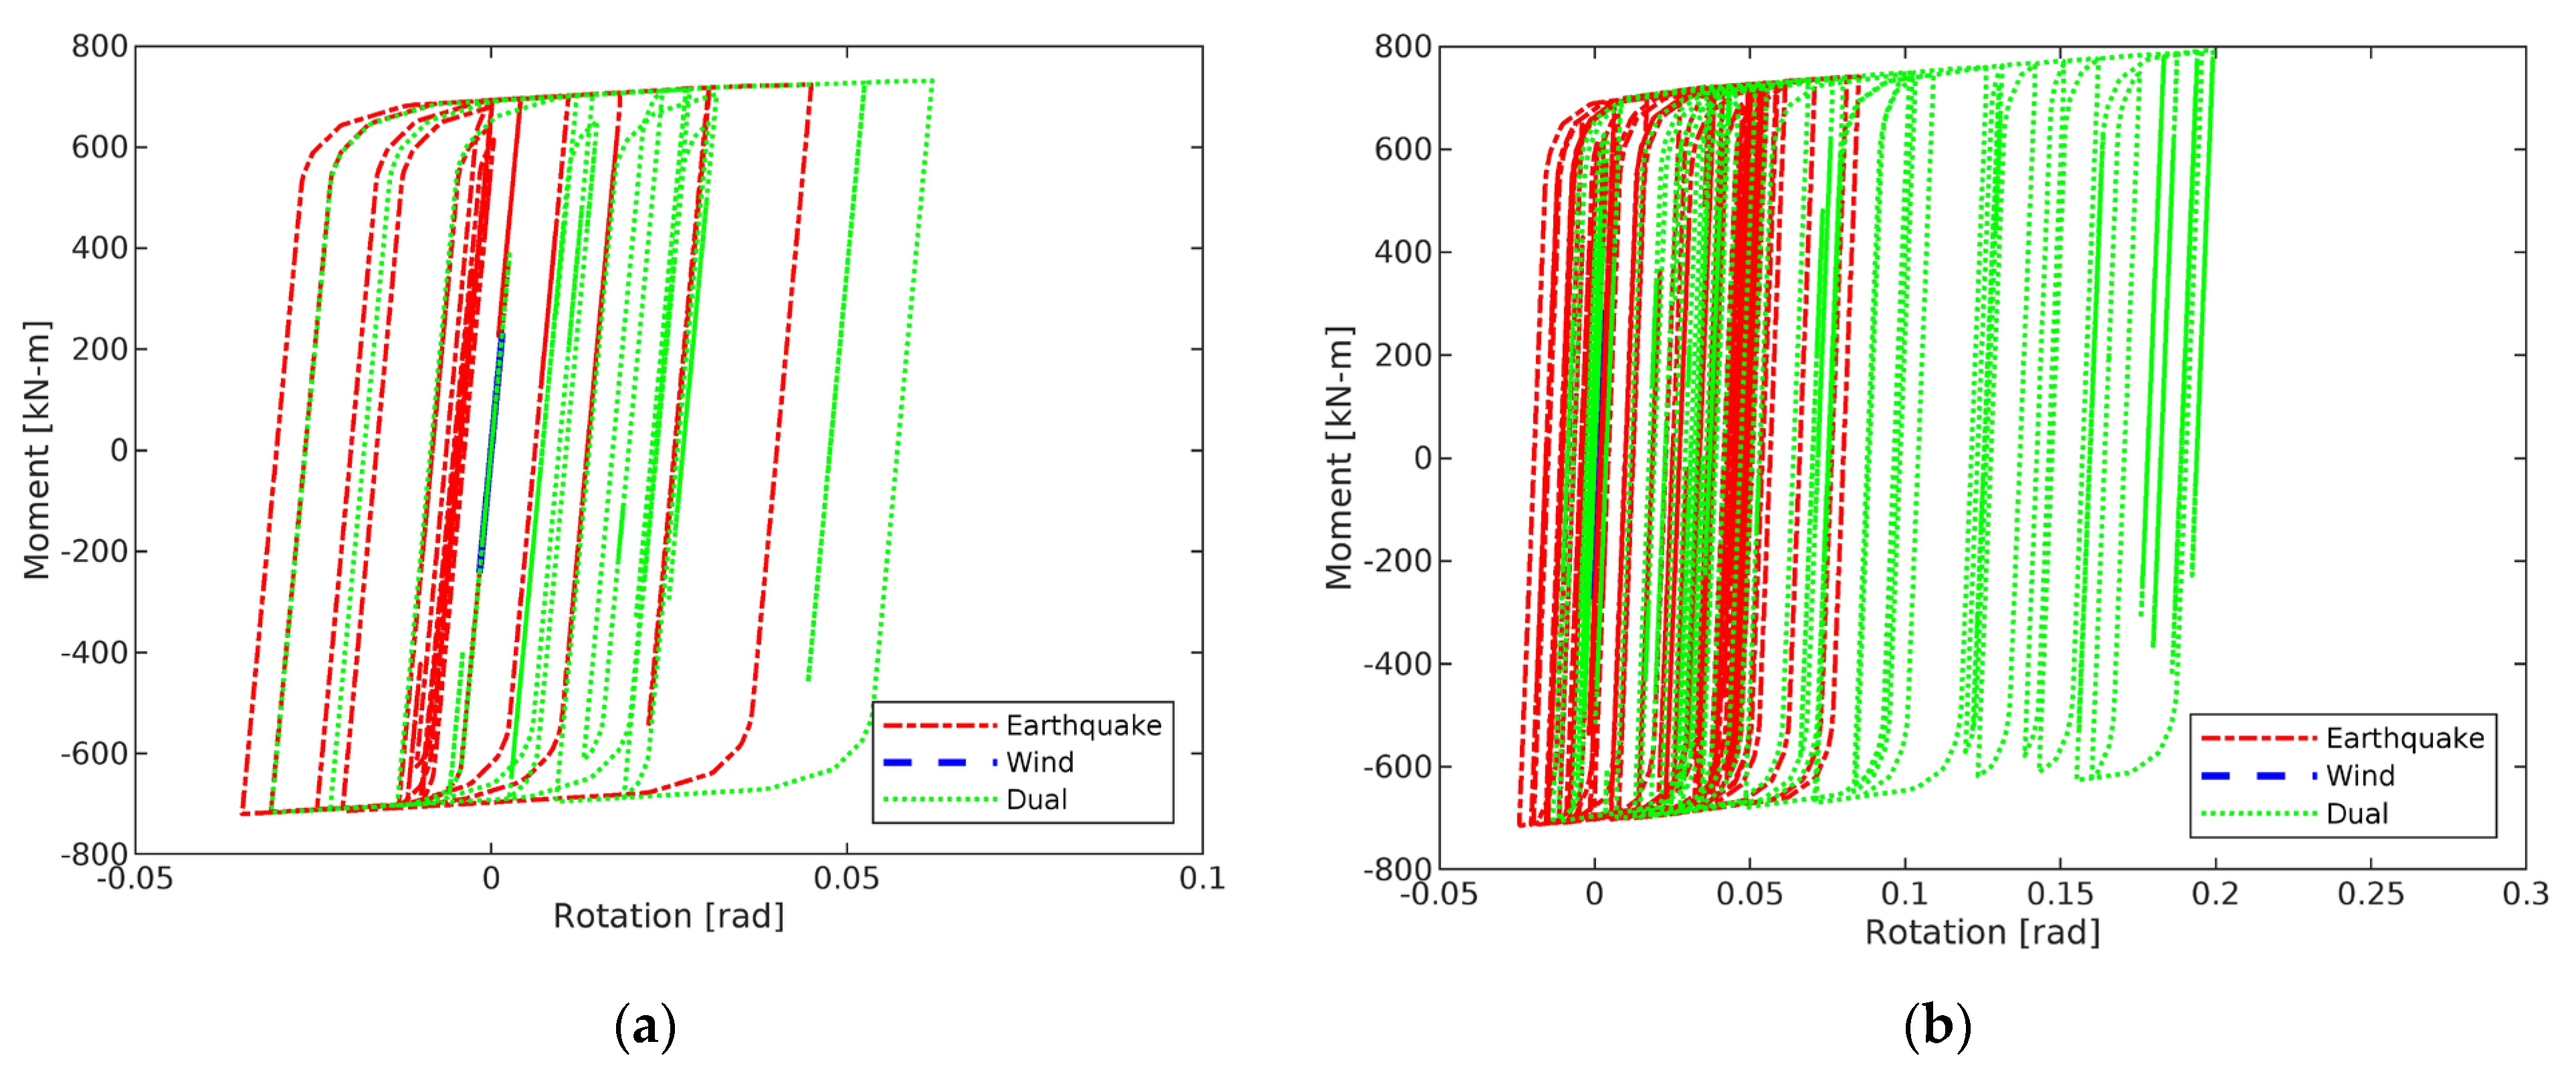
The results for this three-story frame in Los Angeles show that earthquakes are the more predominant hazard. Although wind itself does not cause any damage to the frame, the combined excitation indicates that the frame experiences deformations much larger than those subject to earthquakes only. If the structure is analyzed separately for these two hazards, the sum of the peak or residual responses cannot accurately represent the response of the combined excitation effect. After the structure experiences yielding, inelastic deformations will increase rapidly with the applied forces. To illustrate this, the moment-rotation hysteresis curves of a third-story beam for one typical loading case are shown in Figure 7. The increase in inelasticity due to the combined effects of wind and earthquake is clearly seen. This story is selected because from Figure 5 and Figure 6 it can be seen that this story experiences the largest story and roof drifts. Using the FEMA 356 drift limits given in Table 1, the frame is not considered satisfactory for either the IO or LS performance level.
- Charleston:
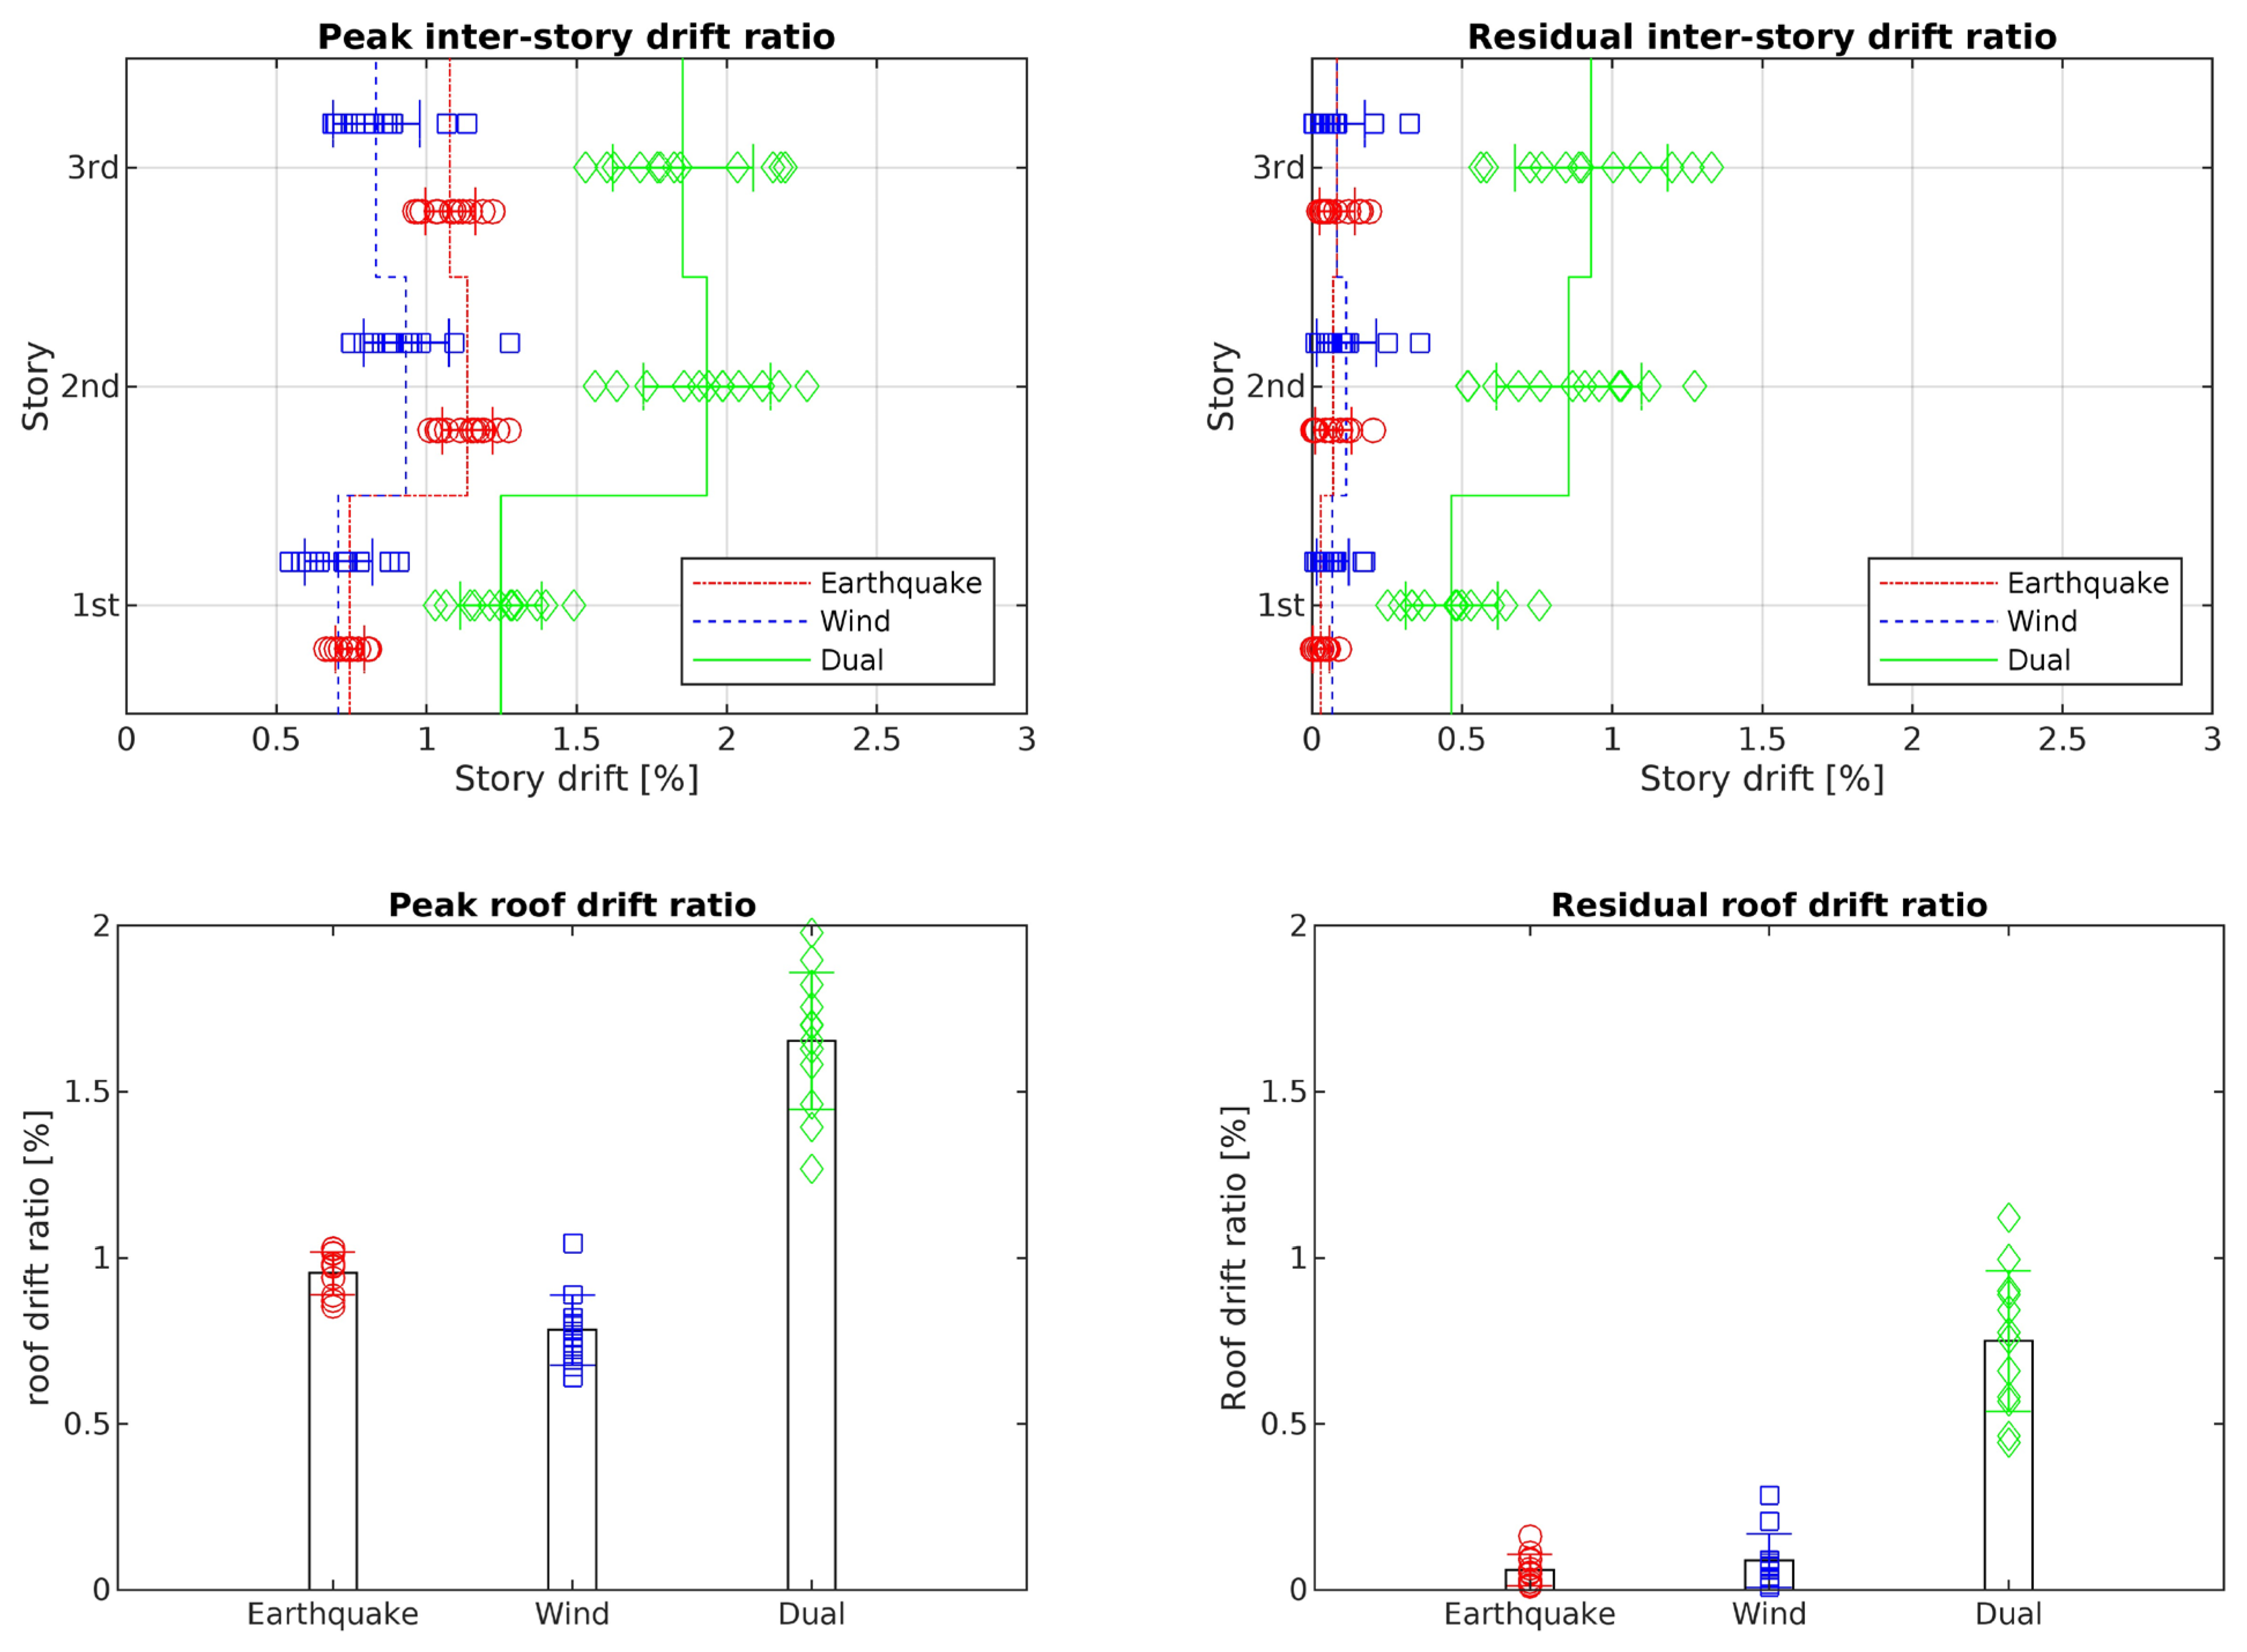
When the frame was analyzed for IO in Charleston, it can be seen from Figure 8 that the largest mean peak inter-story drift ratios occurred in the middle story and were equal to 1.14% under earthquakes, 0.93% under wind and 1.93% under the dual excitations. The largest mean residual inter-story drift ratios occurred in the upper stories and were equal to 0.083% under earthquakes, 0.11% under wind and 0.93% under the dual excitations.
The peak roof drift ratios were 0.96% under earthquakes, 0.78% under wind, and 1.65% under the dual excitations, while the corresponding residual roof drift ratios were 0.06%, 0.09% and 0.75%.
When the frame was analyzed for LS, Figure 9 shows that the frame in Charleston experienced maximum mean peak inter-story drift ratios of 1.75% in the top story under earthquakes, 1.35% in the middle story under wind and 3.57% in the middle story under the dual excitations. The maximum mean residual inter-story drifts were 0.32% in the top story under earthquakes, 0.42% in the middle story under wind, and 2.62% in the top story under the dual excitations. The mean peak and residual roof drift ratios were 1.39% and 0.24%, 1.14% and 0.36%, and 3.27% and 2.42% under earthquake, wind and dual excitations, respectively.
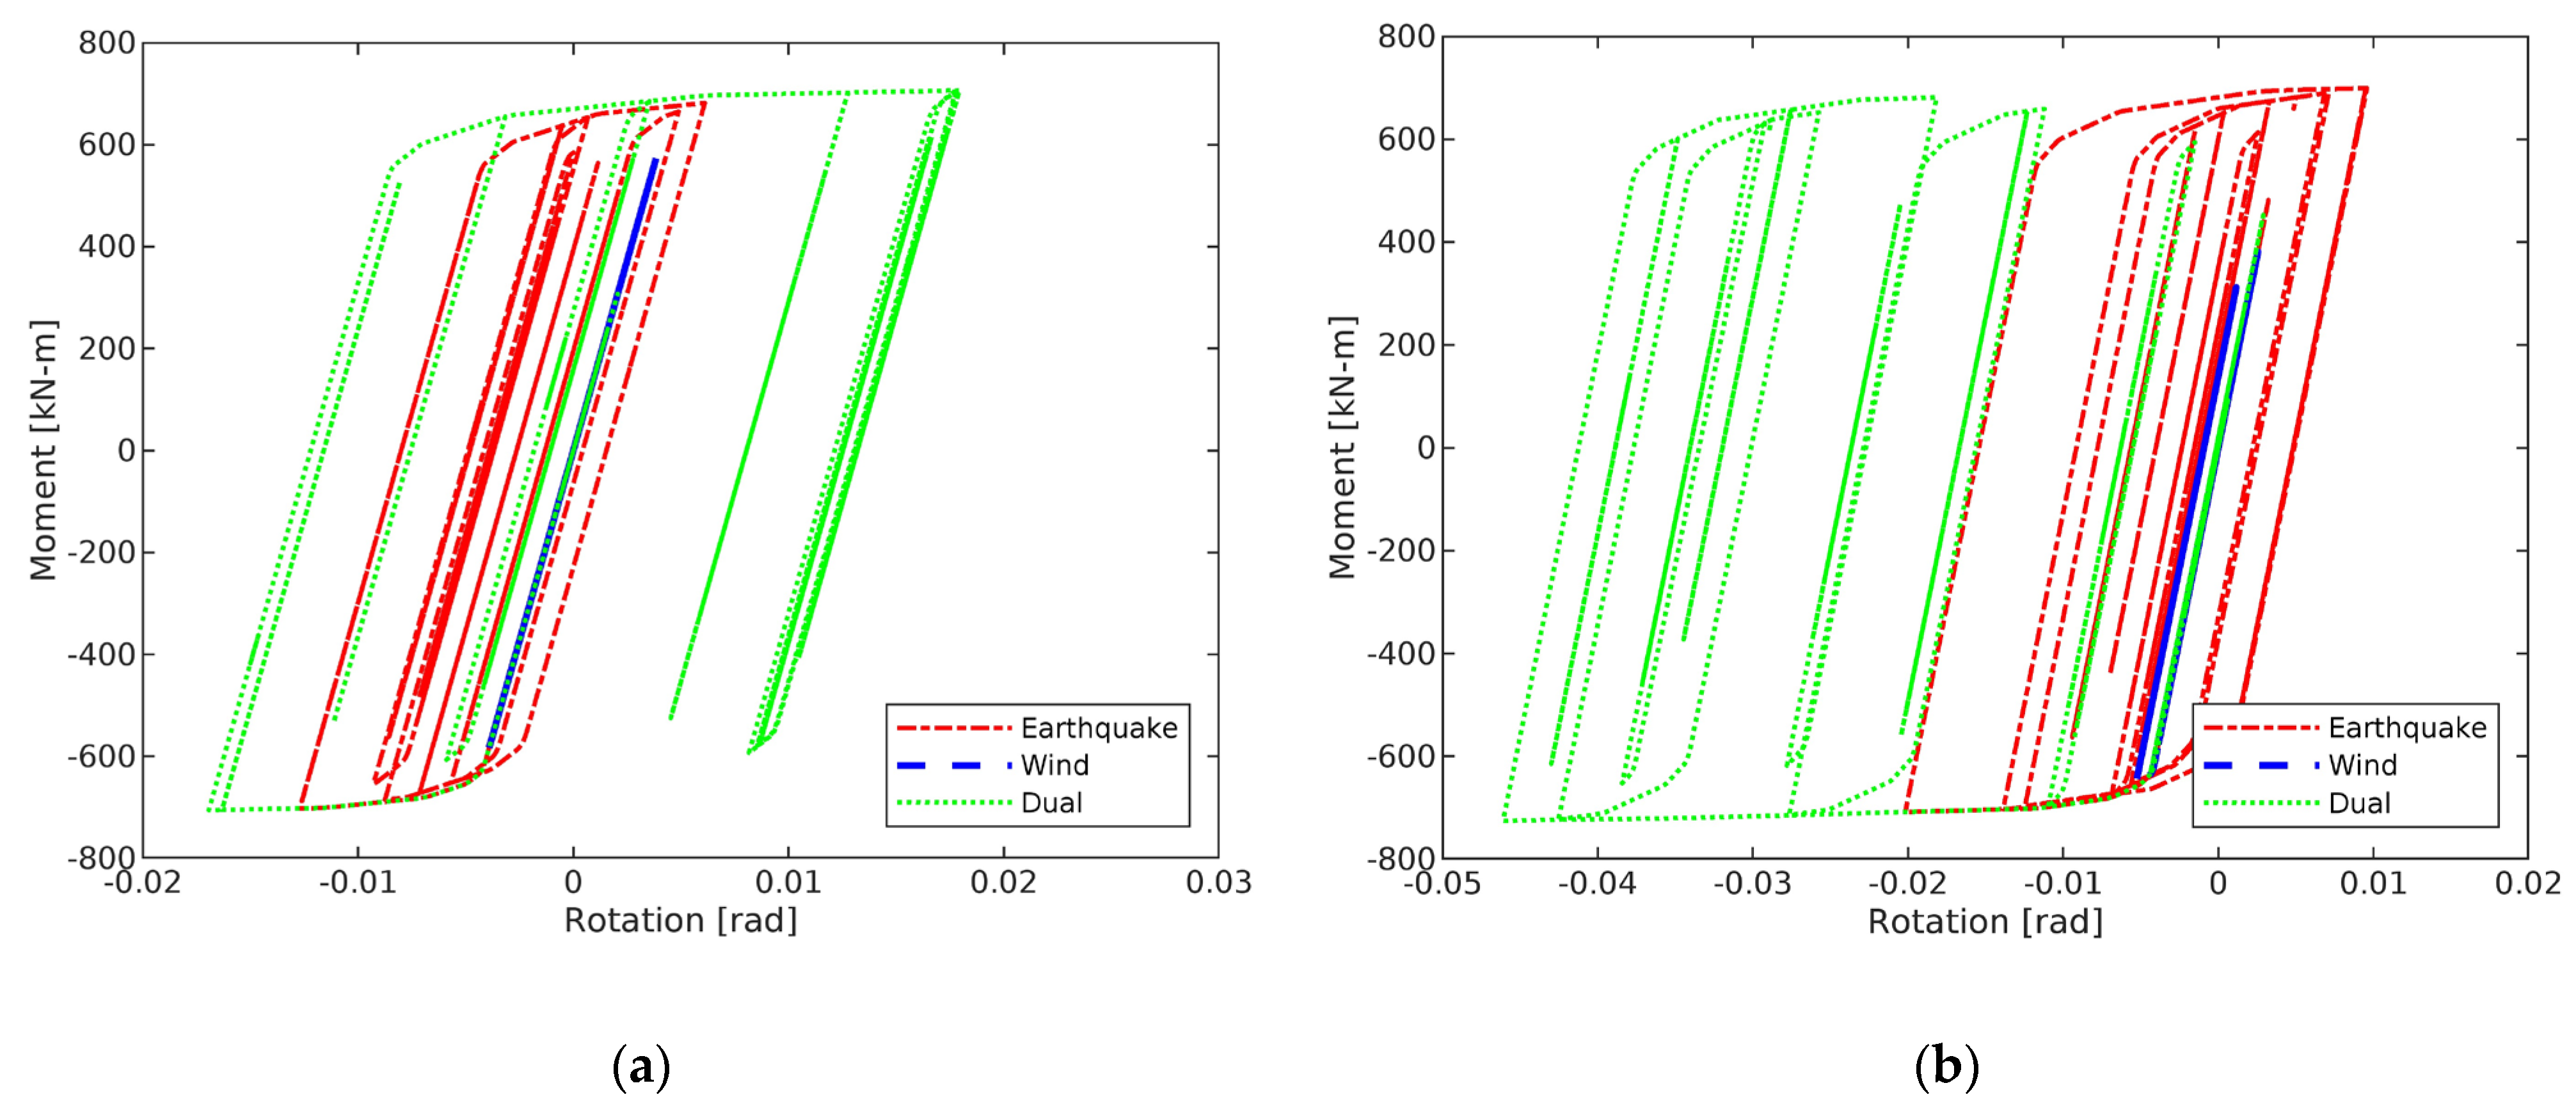
The results obtained for this three-story frame illustrate the importance of performing dual hazard design. When analyzed for LS, the frame is considered adequate when subject only to either earthquake or wind excitation. However, under the dual excitations, the frame’s responses are shown to have fallen outside the range of acceptability for both the inter-story and roof drift ratios. This is the result of an increase in inelastic deformations (as illustrated in Figure 10), where the hysteresis curves of a third-story beam for one typical loading case under the performance levels of IO and LS are shown. The inelastic response of the frame subject to the dual earthquake–wind excitations is seen to be larger than the sum of the earthquake and wind responses. This means that even if separate designs were performed for earthquake and wind only and the results were summed together, the structure would still potentially undergo damage when both hazards occur concurrently.
6.2. Nine-Story Frame
The nine-story frame was analyzed to demonstrate how the dual hazard effect would impact a typical mid-rise building. The analyses showed that this nine-story building in Los Angeles and Charleston would experience unacceptably large inelastic deformations under the dual excitations.
- Los Angeles:
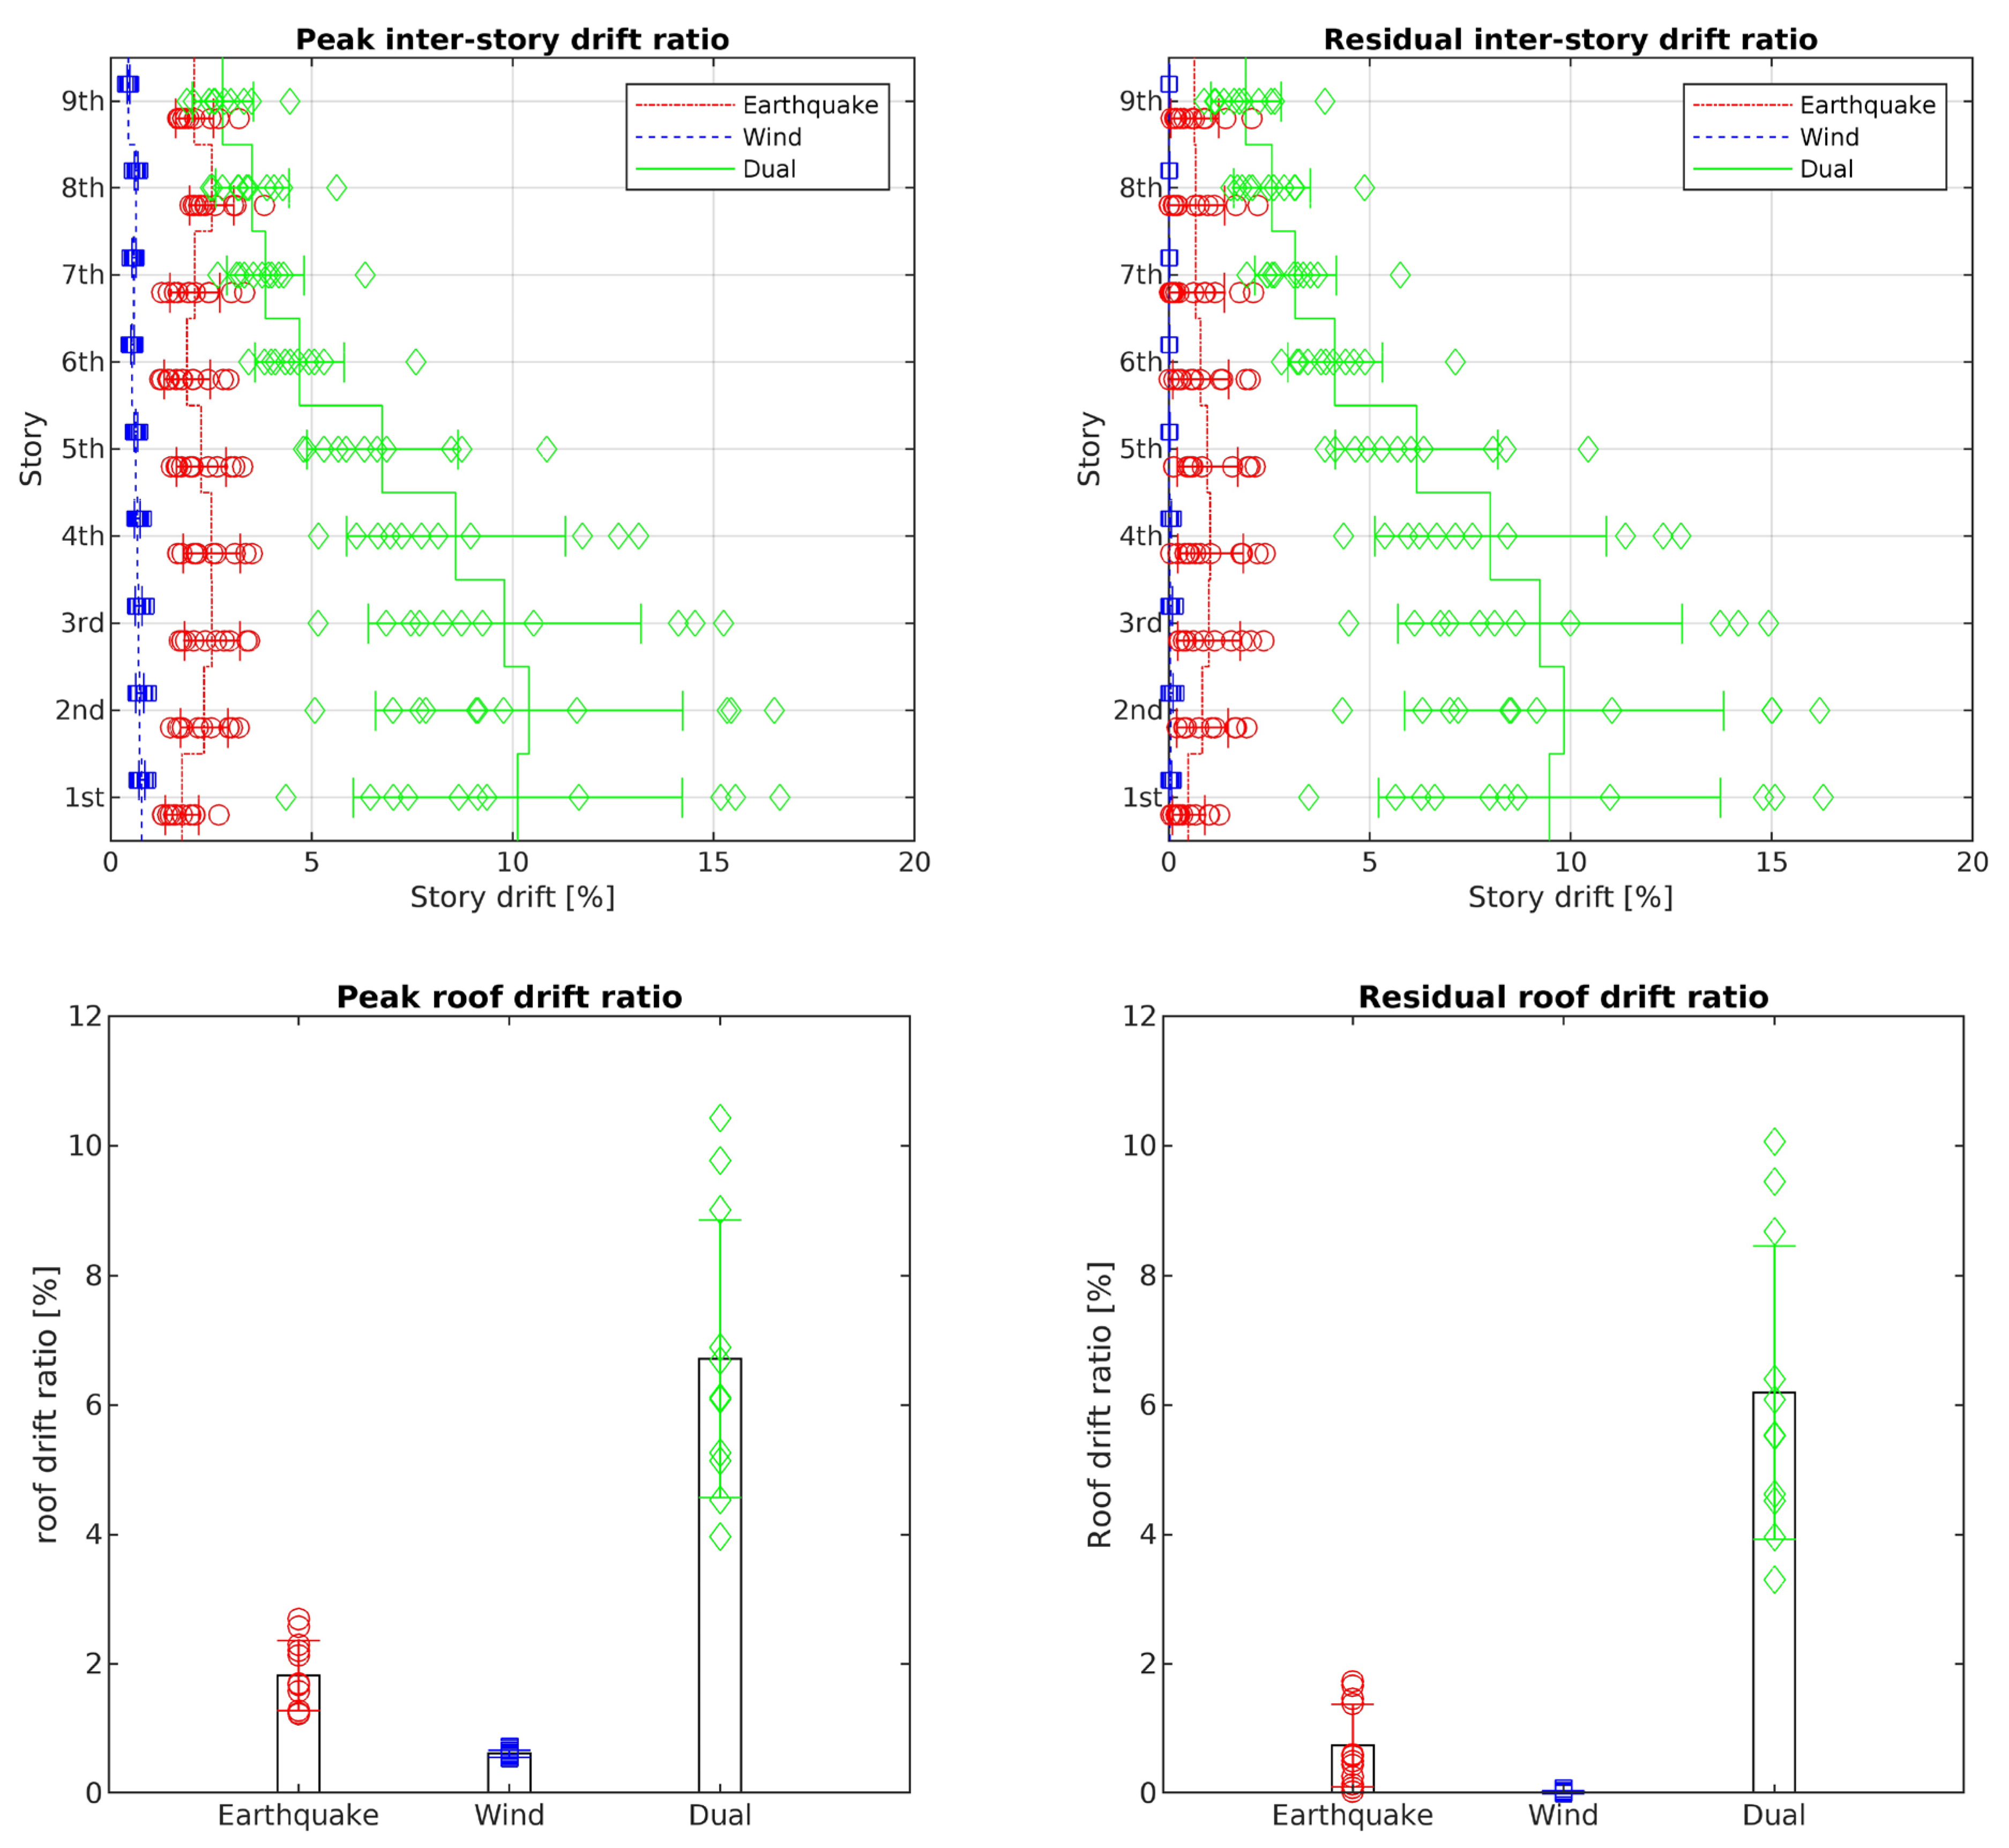
The frame located in Los Angeles could withstand earthquake or wind only, but under the dual excitations the mean peak and residual inter-story drifts became unsatisfactorily large for the performance level of IO, as shown in Figure 11. The maximum mean peak inter-story drift ratio was 2.52% in the third story under earthquakes, but it was only 0.77% in the first story under wind. The corresponding residual inter-story drift ratios were 1% under earthquakes and almost negligible under wind. However, the largest mean peak and residual inter-story drift ratios were 10.4% and 9.83% in the second story under the dual excitations. These inter-story drifts far exceeded those presented in Table 1. The mean peak roof drift ratios for this nine-story frame were 1.82% under earthquakes and 0.61% under wind load. The mean residual roof drift ratios were 0.74% under earthquakes and negligible under wind. However, the mean peak and residual roof drift ratios increased to 6.72% and 6.19% under the dual excitations.
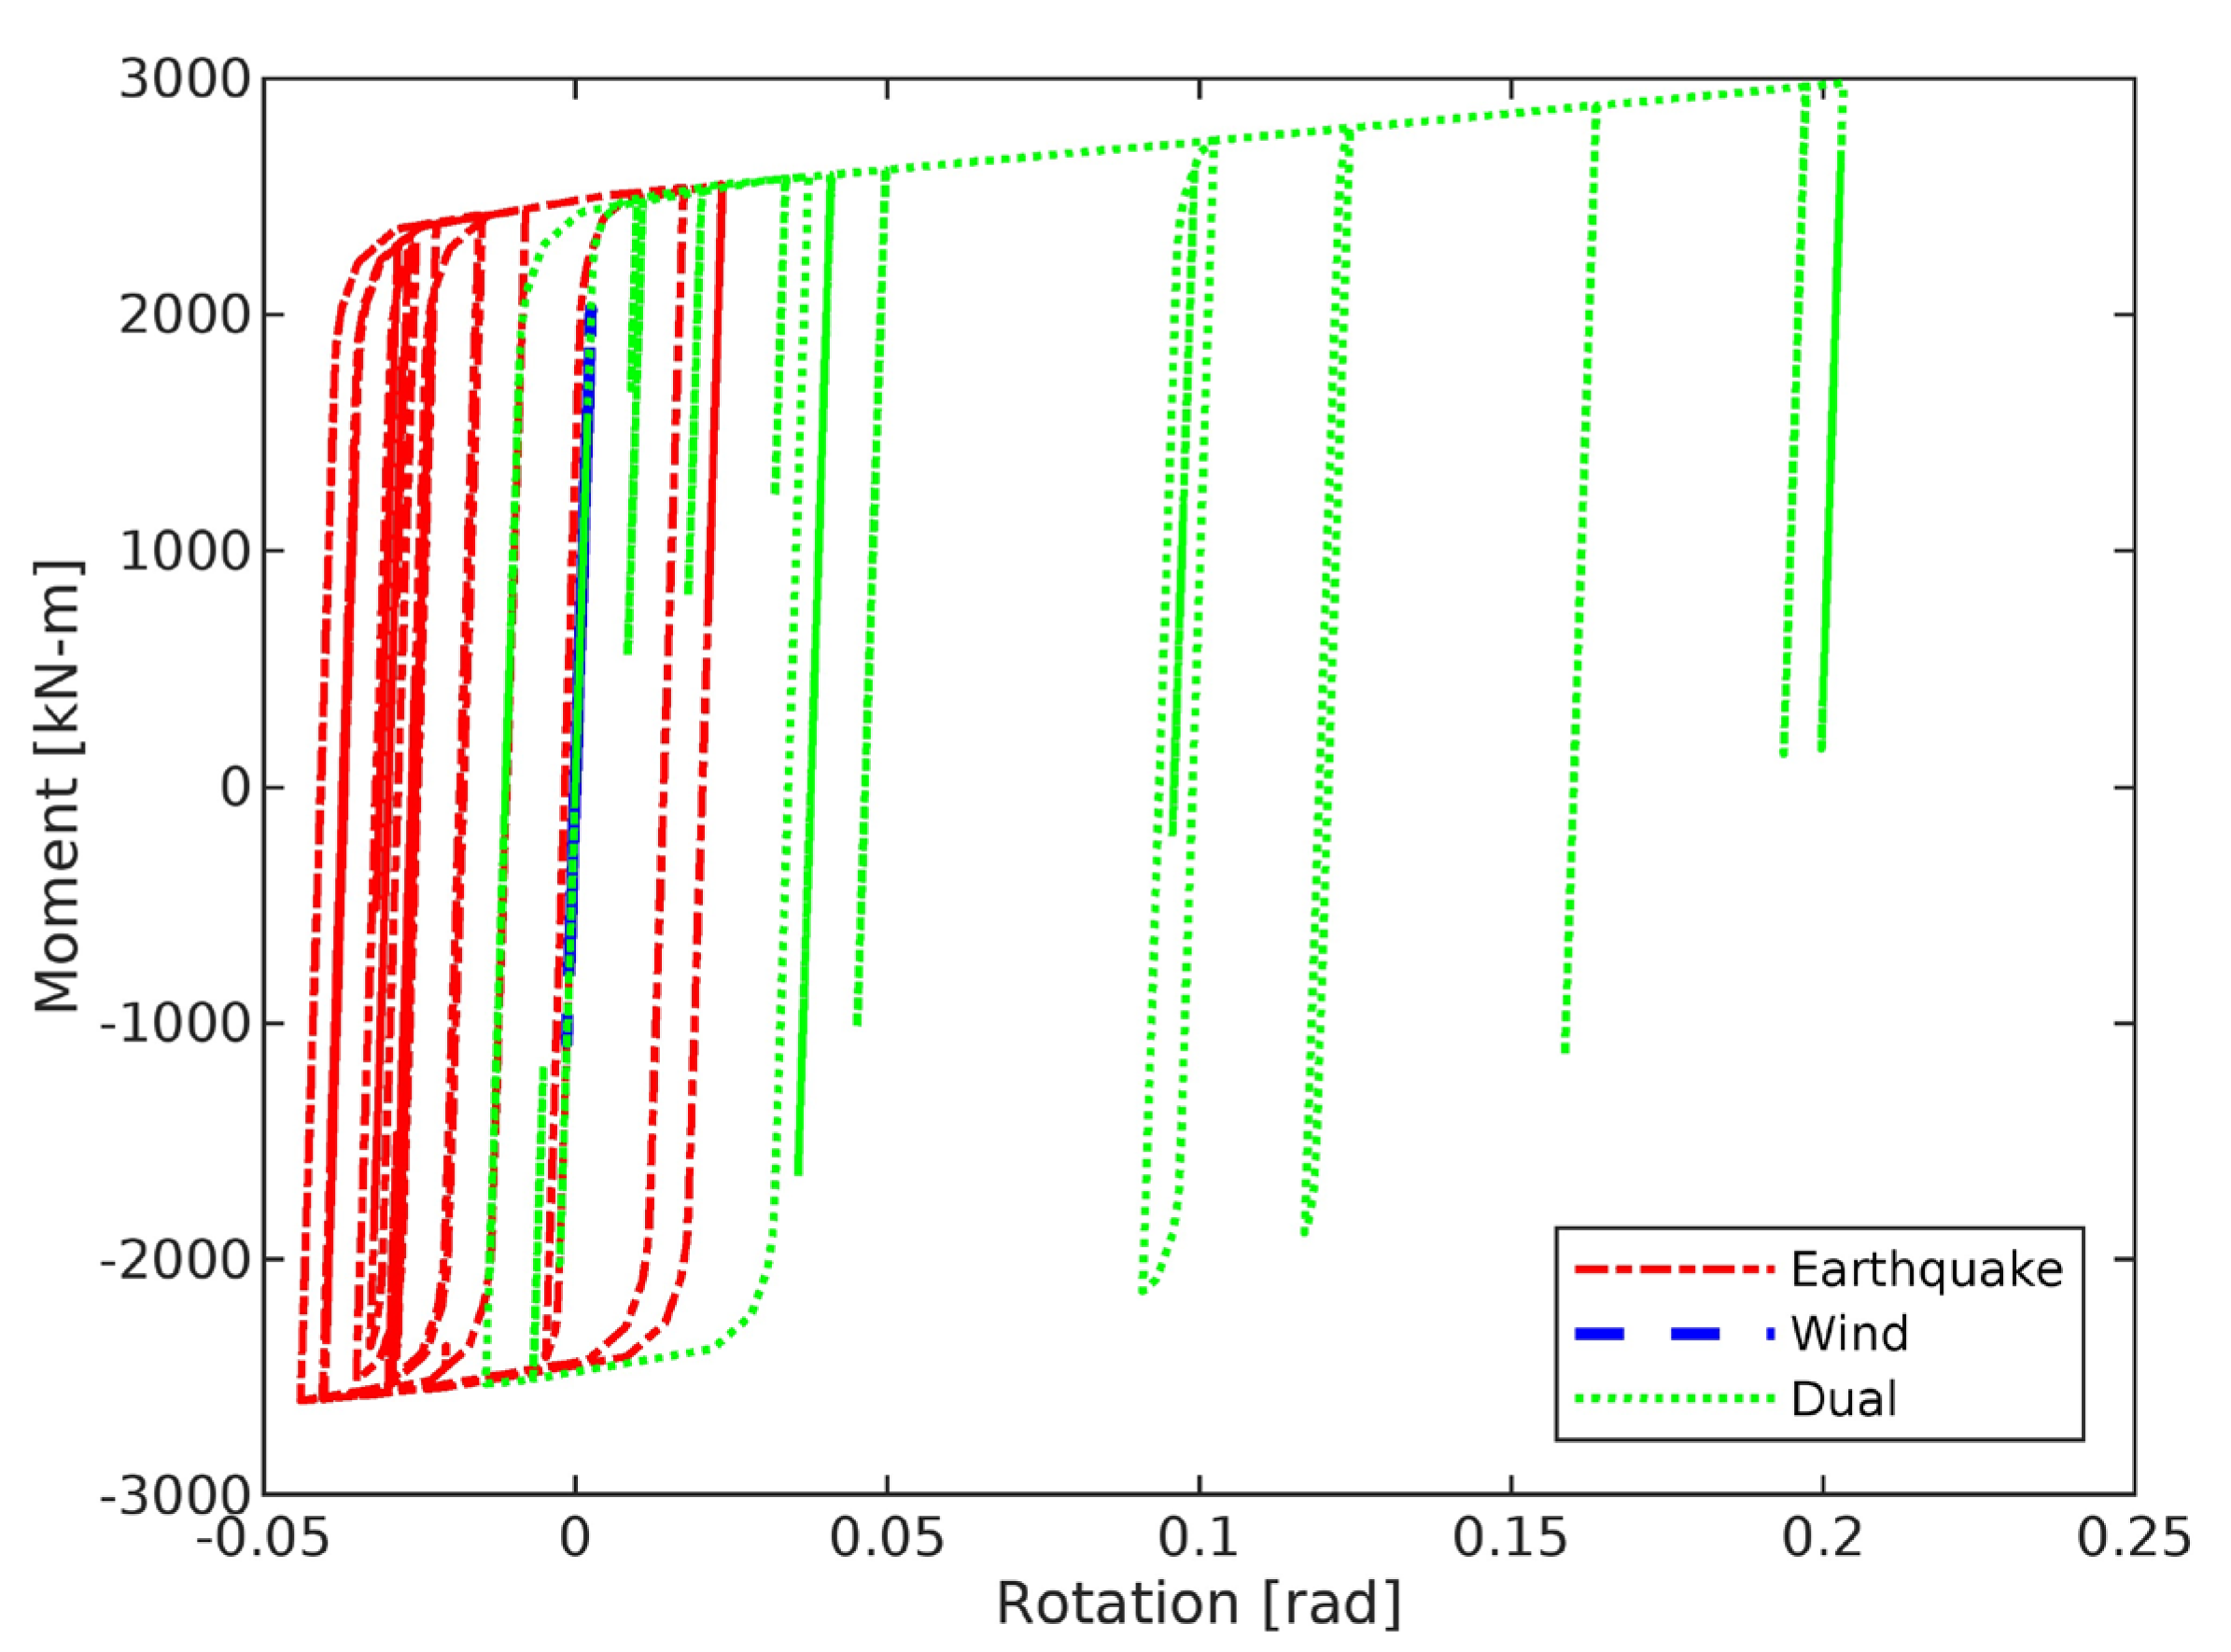
The noticeable increase in inter-story and roof drifts was the result of inelasticity. This is illustrated in Figure 12, where the moment–rotation hysteresis curves of a second-story beam under a typical loading case are shown. The second story was selected because it experienced the largest story drifts, as shown in Figure 11. As can be seen, the beam experienced much larger inelastic deformations under the dual loading than under just the earthquake or wind loading.
When analyzed for LS, the mean peak inter-story, residual inter-story, peak roof and residual roof drift ratios under earthquake excitation were 4.36%, 2.83%, 3.20% and 2.19%, respectively; under wind excitation, they were 1.08%, 0.35%, 0.78% and 0.14%. However, when analyzed for dual excitations, extremely large frame deflections occurred that resulted in a convergence problem for the frame. Note that this convergence problem occurred only when the full value of the excitation was used. No convergence problem was experienced when a reduced value of the excitation was used. From the results shown in Figure 11, it can be seen that wind by itself does not significantly contribute to the response of the frame but it increases the risk of structural failure due to excessive deformations when acting in conjunction with earthquakes, as inelastic deformations are exacerbated. Knowing that the effect of wind becomes more important as the height of the building increases, its effect on buildings—especially when combined with other hazards such as earthquakes—should be carefully taken into consideration even in regions of low wind hazard.
- Charleston:
When the frame in Charleston was analyzed for IO, the mean peak inter-story, residual inter-story, peak roof and residual roof drift ratios under earthquake excitation were determined to be 1.30%, 0.16%, 0.84% and 0.08%, respectively; under wind excitation, these values increased to 9.40% 8.70%, 4.92% and 4.38%. Under the dual excitations, the drift ratios were excessively large such that convergence became a problem in the analysis.
When the frame was analyzed for LS, the mean peak inter-story, residual inter-story, peak roof and residual roof drift ratios under earthquake excitation were 1.71%, 0.42%, 1.18% and 0.26%, respectively. However, excessively large deflections (that caused convergence problems) were encountered when the frame was analyzed for wind and dual excitations. The frame was therefore considered unsatisfactory under these loading conditions.
7. Modeling of Buckling-Restrained Braces
For frames that exceed the FEMA 356 [11] recommended drift limits given in Table 1, supplementary energy dissipation devices can be added to the MRFs. In this study, buckling-restrained braces (BRBs) were used.
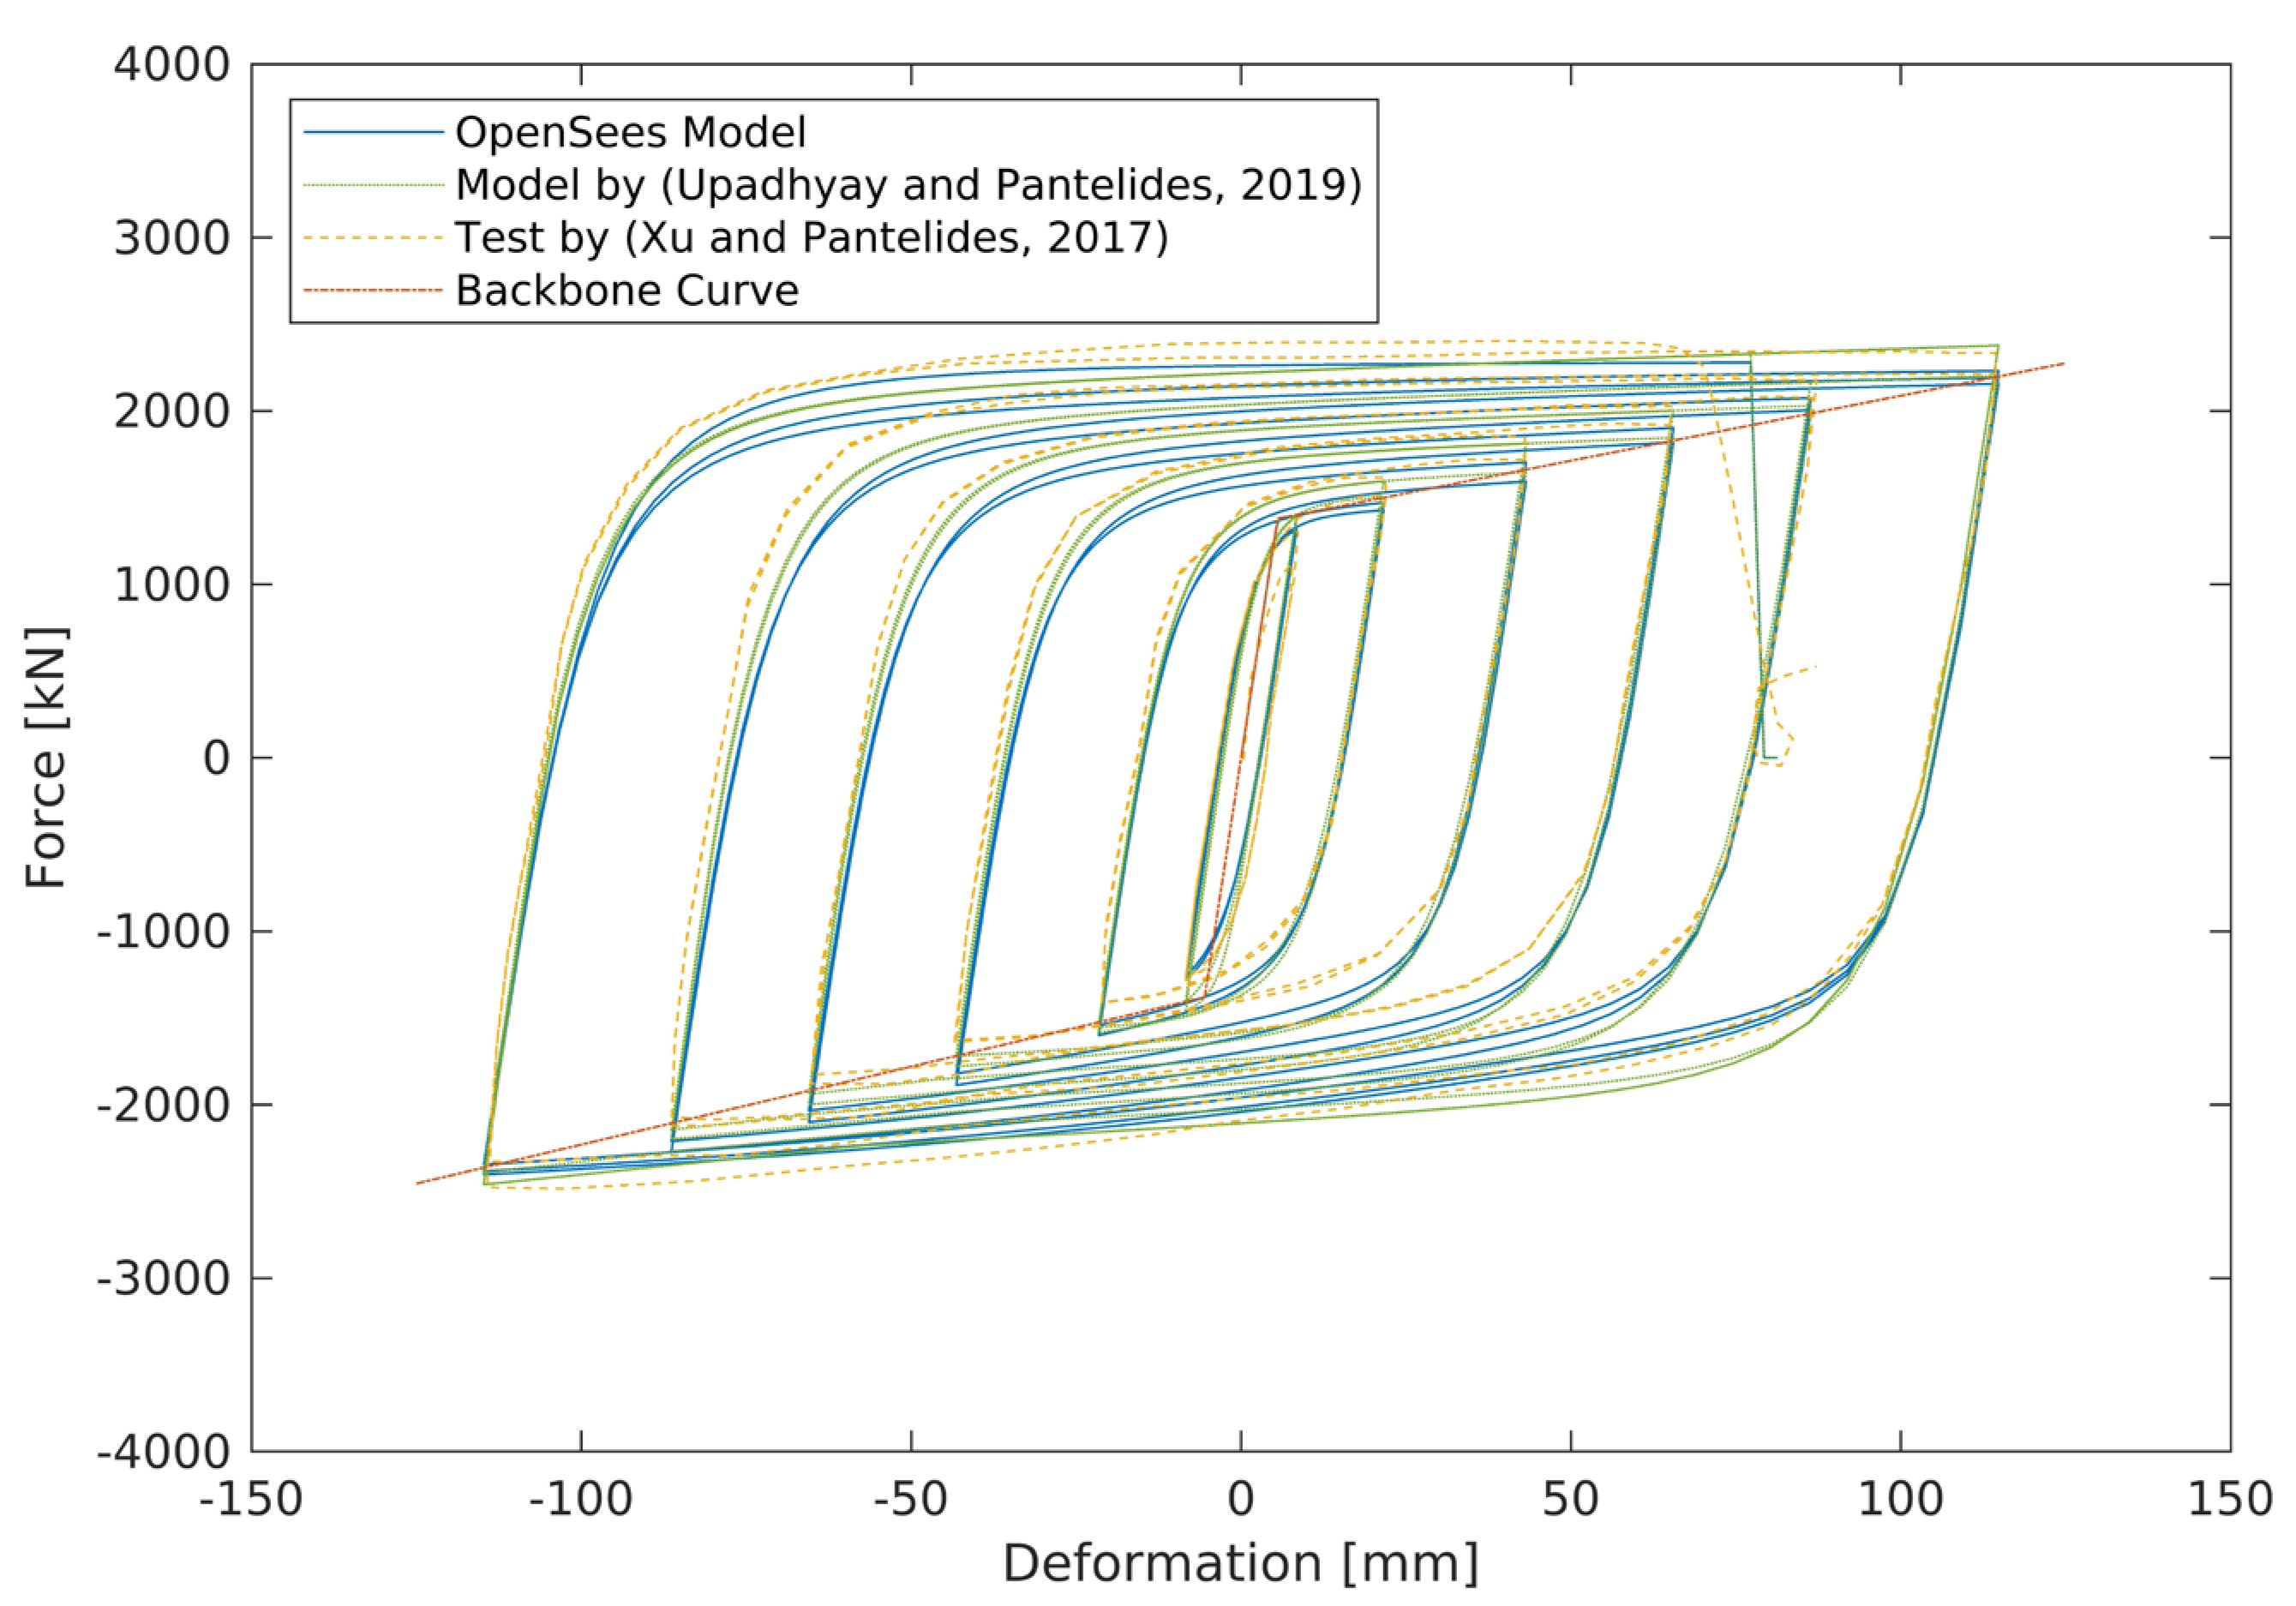
In the present research, BRB was modeled in OpenSees using a corotational truss element with a Steel4 material. Table 3 shows the parameters of this Steel4 material model used in the present study. The parameters were similar to those used in the Menegotto and Pinto [32] model, which was later modified and extended by Filippou et al. [33]. These parameters were calibrated by Zsarnóczay & Baker [34] and modified to match the cyclic response of BRBs modeled using Steel02 and Pinching4 materials by Upadhyay et al. [35] and the experimental data reported by Xu & Pantelides [36].
It should be noted that the use of Steel4 material allows the hysteretic behavior of the entire BRB member to be generated directly without having to model each component of the BRB using specific finite elements. Both the yielding of the steel core and the interaction between the steel core and the concrete-filled casing are implicitly accounted for when Steel4 material of OpenSees is used.
Figure 13 shows the force–displacement hysteresis loops generated using the Steel4 material with the parameters given in Table 3. The hysteresis loops obtained using OpenSees with Steel4 material are shown as solid blue lines. It can be seen that they compared well with those modeled by Upadhyay et al. [35] (shown as dotted green lines) and the experimental results obtained by Xu & Pantelides [36] (shown as dashed yellow lines).
8. Energy-Based Design of Buckling-Restrained Braced Frames
In this section, the design of BRBs using an energy-based concept is presented. The frames equipped with these BRBs will then be analyzed using time-history analysis to show how the use of BRBs can drastically reduce frame drifts under the dual earthquake–wind excitations.
8.1. Energy Capacity of a BRB
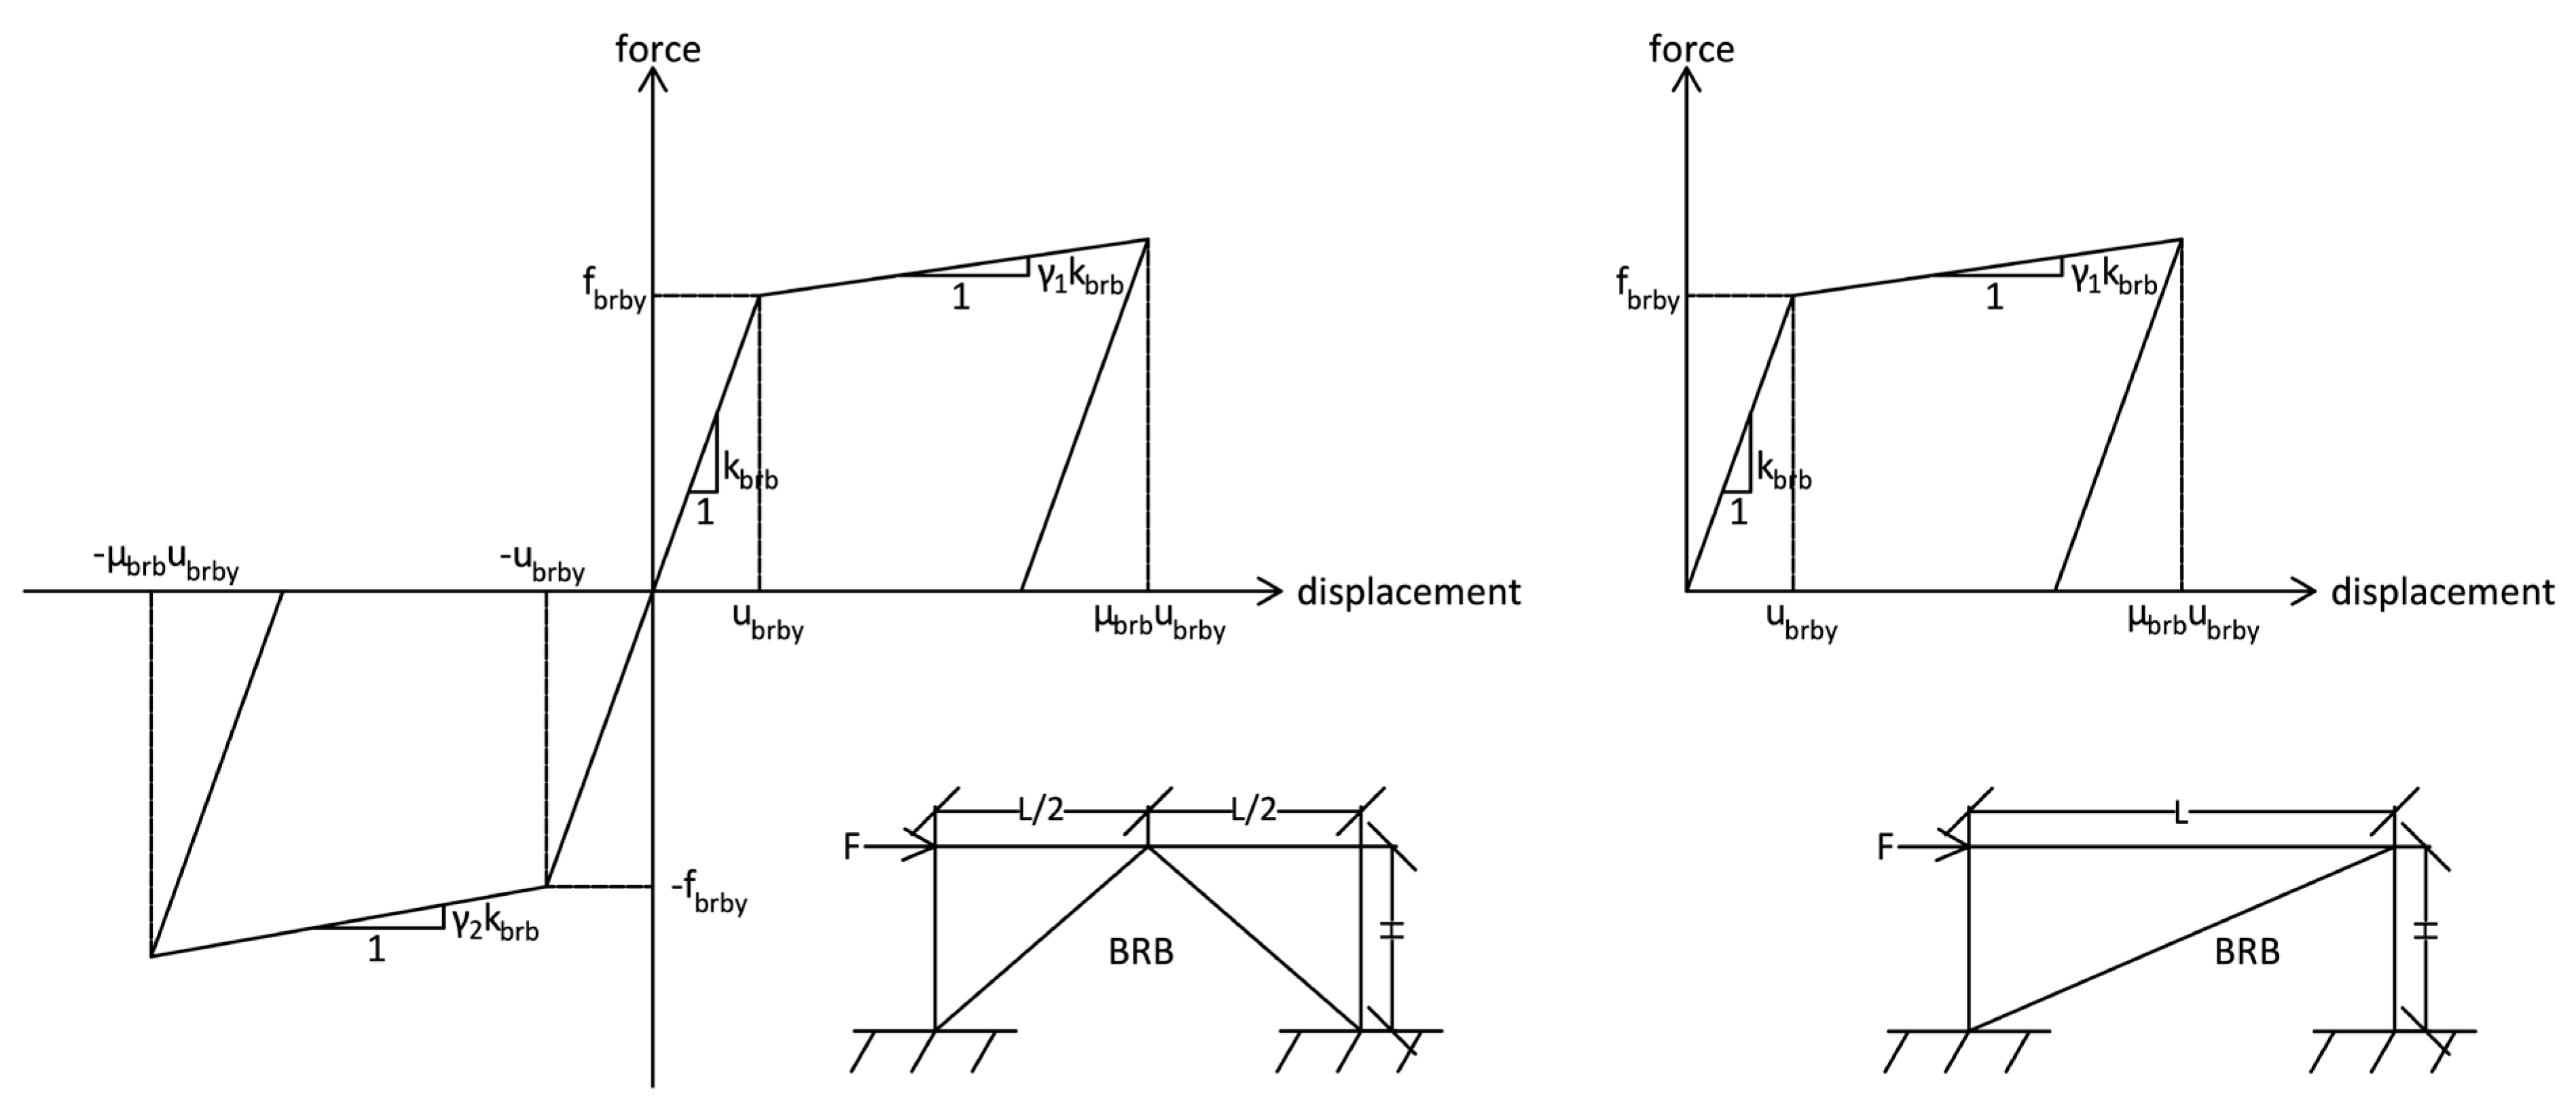
The dashed-dotted orange lines shown in Figure 13 are the skeleton curves of the BRB. The skeleton curves representing the force–displacement relationships of two commonly used configurations of BRB are shown in Figure 14. For the chevron BRB, regardless of the direction of the applied lateral force, one BRB is under tension and the other is under compression, and so both partake in dissipating energy. For the diagonal BRB, it is either under tension or compression depending on the direction of the lateral force (the lateral force in the figure is applied from left to right so the diagonal BRB is under tension). As a result, the amount of energy that can be dissipated is smaller. However, when the ratio of bay width to story height is small, the diagonal configuration is often used because it is more economical and easier to erect.
The story-based capacity of the chevron BRB is computed as the sum of the strain energy and hysteretic energy, obtained as the area under the force–displacement plots, i.e.,
where is the story level; and are the strain and hysteretic energies of the BRB, respectively; is the cross-section area of the BRB yielding core; is the material yield strength; (in Table 3) is the BRB elastic modulus; is the BRB length; is the BRB ductility; and and are the nondimensional BRB tensile and compressive hardening ratios, determined from Figure 13 to be 0.03 and 0.036, respectively. and can be calculated using the equations:
where is the target (axial) displacement of the BRB; is the yield displacement of the BRB; is the maximum story drift ratio; and and are the bay width and story height, respectively.
If the chevron BRB is replaced by a diagonal BRB, the capacity becomes:
where , , and are the strain energy, hysteretic energy, ductility and length of the diagonal BRB, respectively. In applying Equations (11)–(16), a consistent set of units should be used. For example, if Newton (N) is used as the force unit and meter (m) is used as the length unit, the units for energy, cross-section area, material yield strength and elastic modulus will be N-m, m2, N/m2 and N/m2, respectively.
8.2. Energy Demand from the Dual Hazards
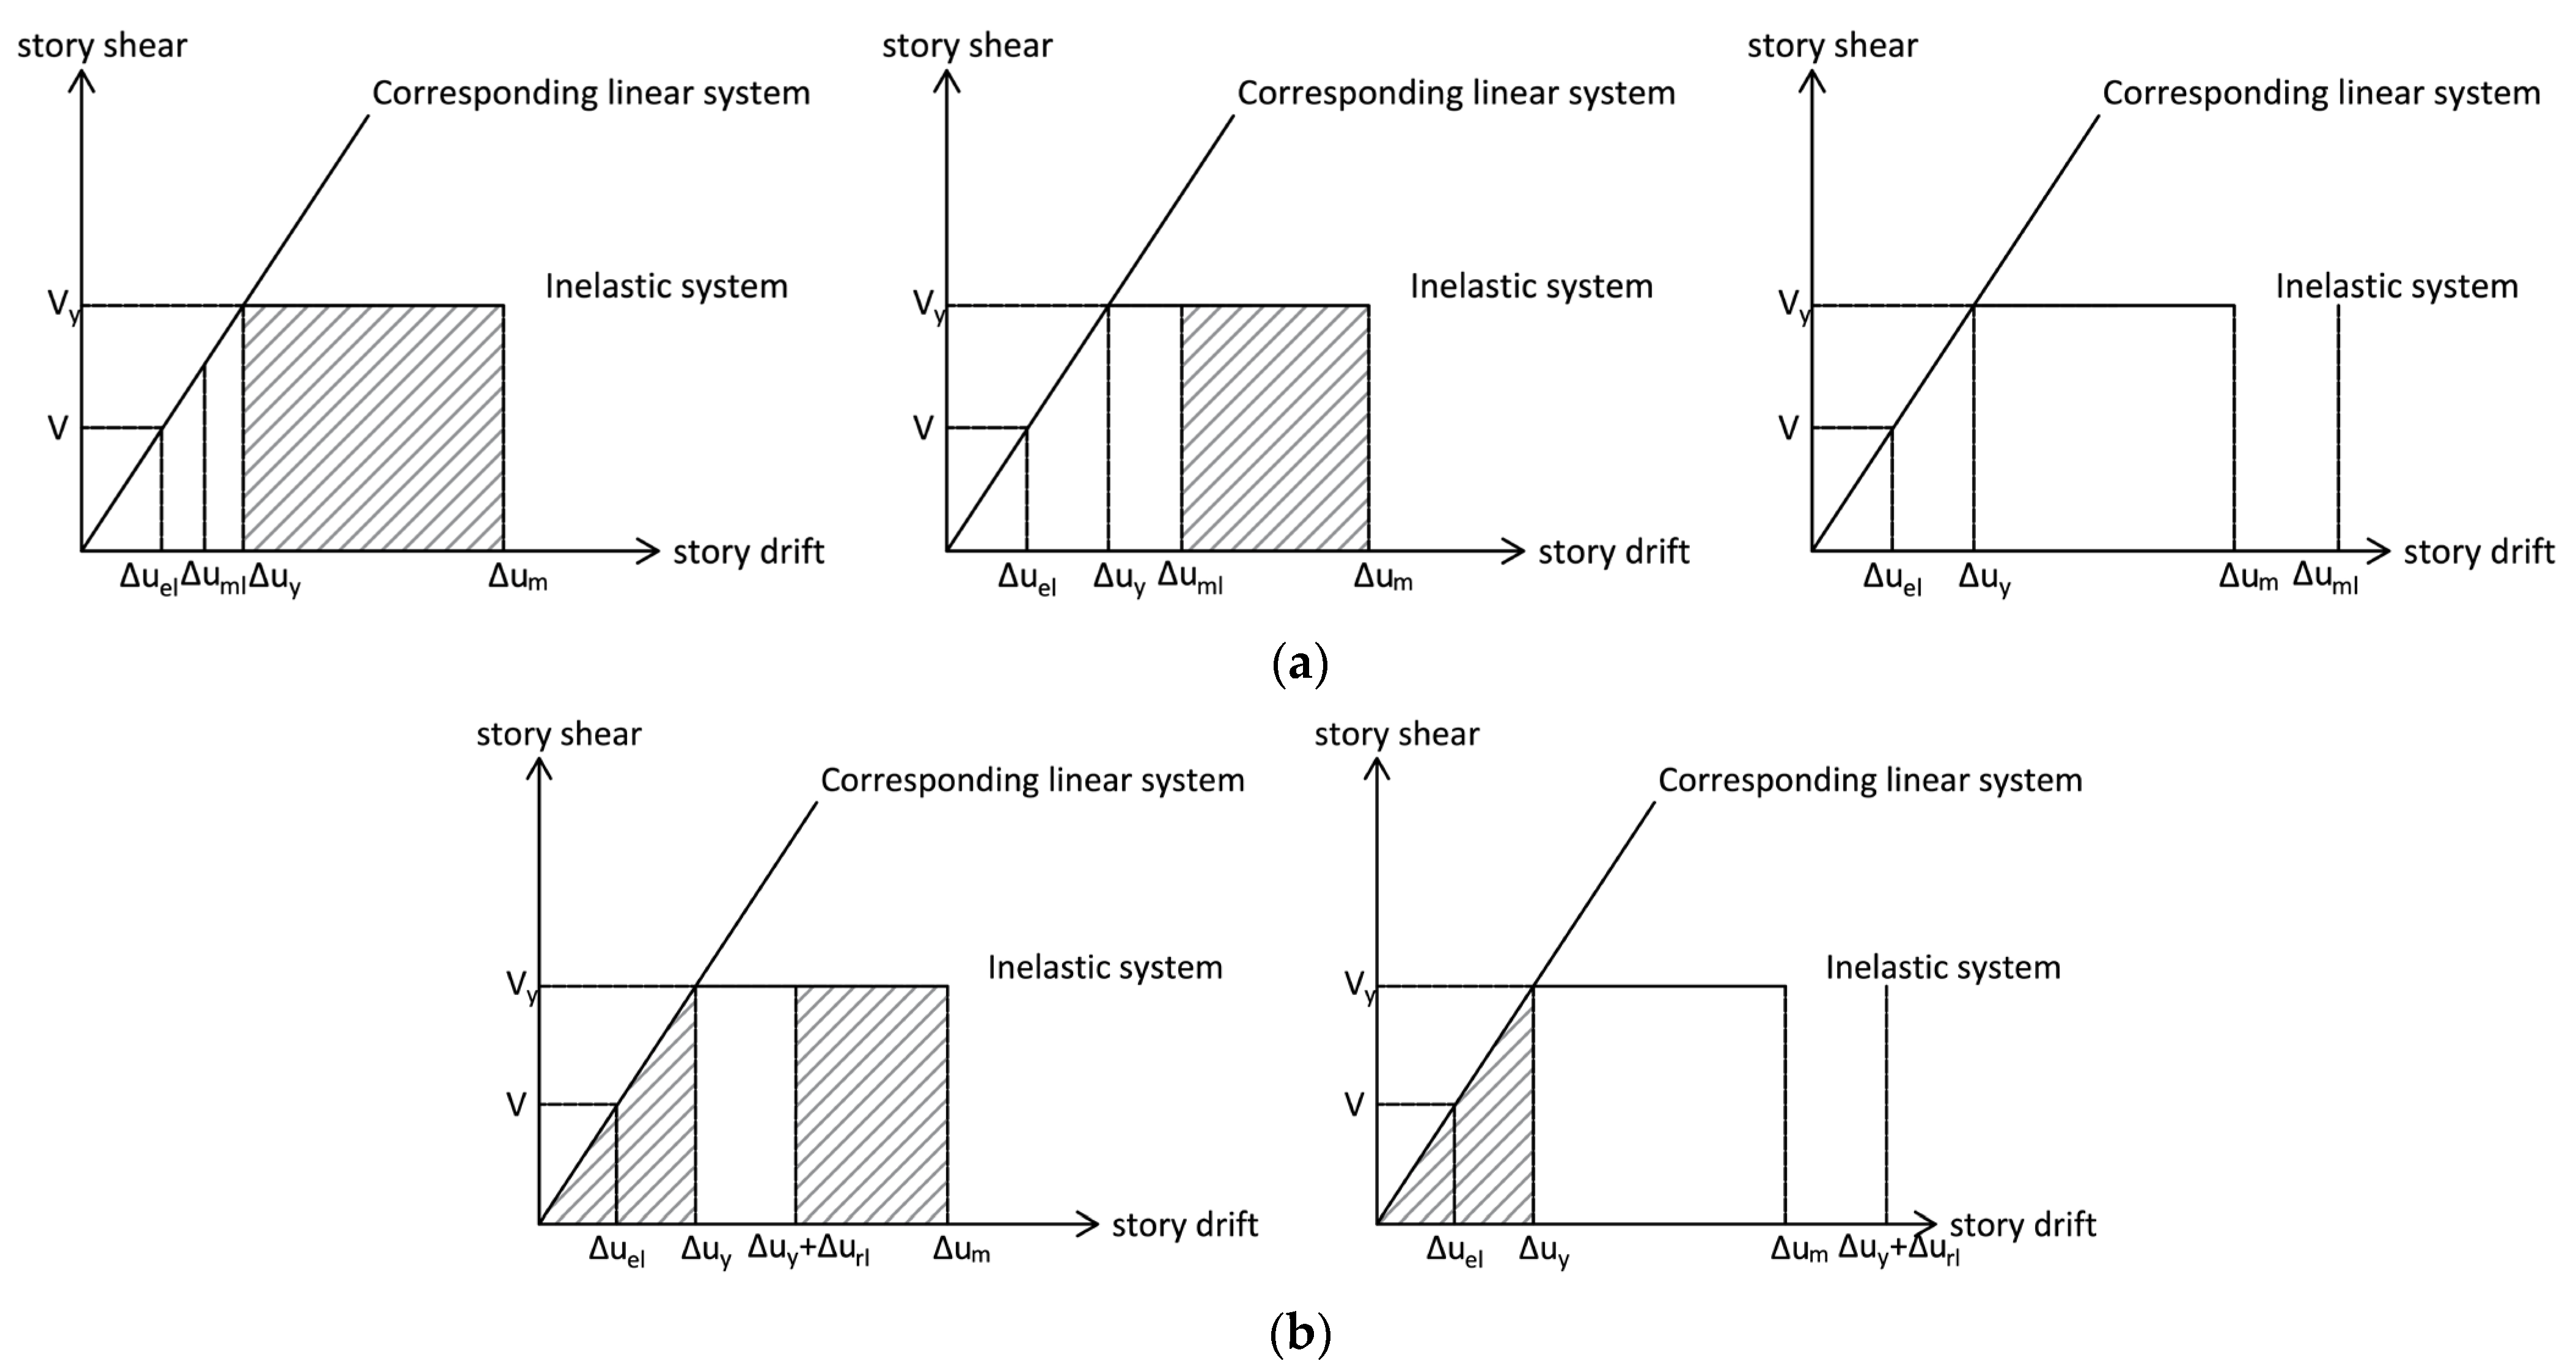
To determine the energy demand, the idealized elastic–plastic force–displacement relationships of a typical moment frame (as shown in Figure 15) can be used. The input energy in excess of what the frame can withstand is the energy demand for the BRB. This energy demand is shown by the cross-hatched area in the figure.
The energy demand (i.e., the cross-hatched areas in Figure 15) for story can be calculated as
where and denote the energy demand based on the maximum (peak) drift limit and residual drift limit, respectively, given by
where is the nondimensional overstrength factor; is the elastic story shear; is the equivalent lateral force applied at story ; is the nondimensional importance factor; is the inelastic inter-story drift; is the nondimensional deflection amplification factor; is the elastic inter-story drift that corresponds to ; is the inter-story drift that corresponds to yielding; is the frame ductility; and are the maximum (peak) and residual inter-story drifts, respectively, in which is the story height; and and are the peak and residual inter-story drift limits. After BRBs are installed in a MRF, the frame becomes a braced frame, and with reference to Table 1, is 0.5% for the performance level of IO and 1.5% for the performance level of LS, whereas is negligible (i.e., near zero) for IO and 0.5% for LS.
The factors , and are dependent on the type of structure. For intermediate moment frames [37] often used in seismic design, = 3 and = 4; and for risk category III structures, = 1.25. In applying Equations (17)–(19), a consistent set of units should be used. If Newtons and meters are used as the force and displacement units, respectively, then both and will have unit of N-m.
8.3. Proposed Energy-Based Design Procedure for BRB
Although some general guidelines for the design of BRBs are available [38], their actual design is considered proprietary by BRB manufacturers and has not been codified. However, the selection of the proper BRB for use often involves specifying the bay width and story height as well as determining the cross-section area of the yielding core of the BRB. The design procedure proposed herein uses the energy-balanced approach and calculates the required cross-section area of the BRB yielding core by equating its energy dissipation capacity with the energy demand from the dual excitations. The proposed energy-based BRB design procedure uses the equivalent lateral force approach [1,16] and is outlined as follows:
- Step 1: Construct elastic response spectra for the dual excitations.Pseudo (or spectral) acceleration response spectra (often expressed in m/s2 or in terms of acceleration due to gravity, g) are plots of pseudo accelerations Sa against system periods T (in seconds). These spectra can be constructed for the dual excitations using software such as Bispec, SeismoSoft, OpenSees, etc.
- Step 2: Run a modal analysis to obtain (or estimate) the fundamental period for the intermediate moment frame.
- Step 3: Calculate the base shear using the equation
- Step 4: Determine the equivalent lateral force (ELF) and story shear at story using the equation:
The story shear force at the -th floor can be calculated from the equation:
- Step 5: Perform a linear static analysis on the intermediate moment resisting frame subject to this ELF and determine its maximum inter-story displacement response . The maximum displacement response of the frame accounting for inelasticity can be estimated using the equation:
- Step 6: Use the energy equation to determine the required BRB cross-section area for each story. The required BRB yielding core area can be obtained by equating Equation (11) or Equation (14) with Equation (17) and solving for to give
As before, a consistent set of units (e.g., N for force and m for length) should be used in applying Equations (20)–(28).
9. Analysis Results for Buckling-Restrained-Braced-Frame Responses to Dual Earthquake and Wind Hazards
The multi-story moment frames analyzed in Section 6 for the dual hazards do not always satisfy the FEMA 356 [11] seismic-performance-based design drift criteria given in Table 1. In this section, chevron BRBs are designed for these frames so their peak and residual inter-story drift ratios will fall within or near the FEMA 356 [11] recommended limits. Chevron BRBs are used because of their higher energy-dissipation efficiency and because of the relatively large bay width to story height ratios for these frames. The design details for the required BRB’s yielding core cross-section area for each story of these two frames are given in Table A3, Table A4, Table A5, Table A6, Table A7, Table A8, Table A9 and Table A10 in Appendix A. These cross-section sizes were selected based on the availability of BRBs from manufacturers such as the Seismic Bracing Company (https://www.thesbcllc.com) (accessed on 1 September 2023). The design is based on both IO and LS to ensure that the final design will satisfy both performance levels in accordance with performance-based seismic design for category III structures.
9.1. Three-Story Frame
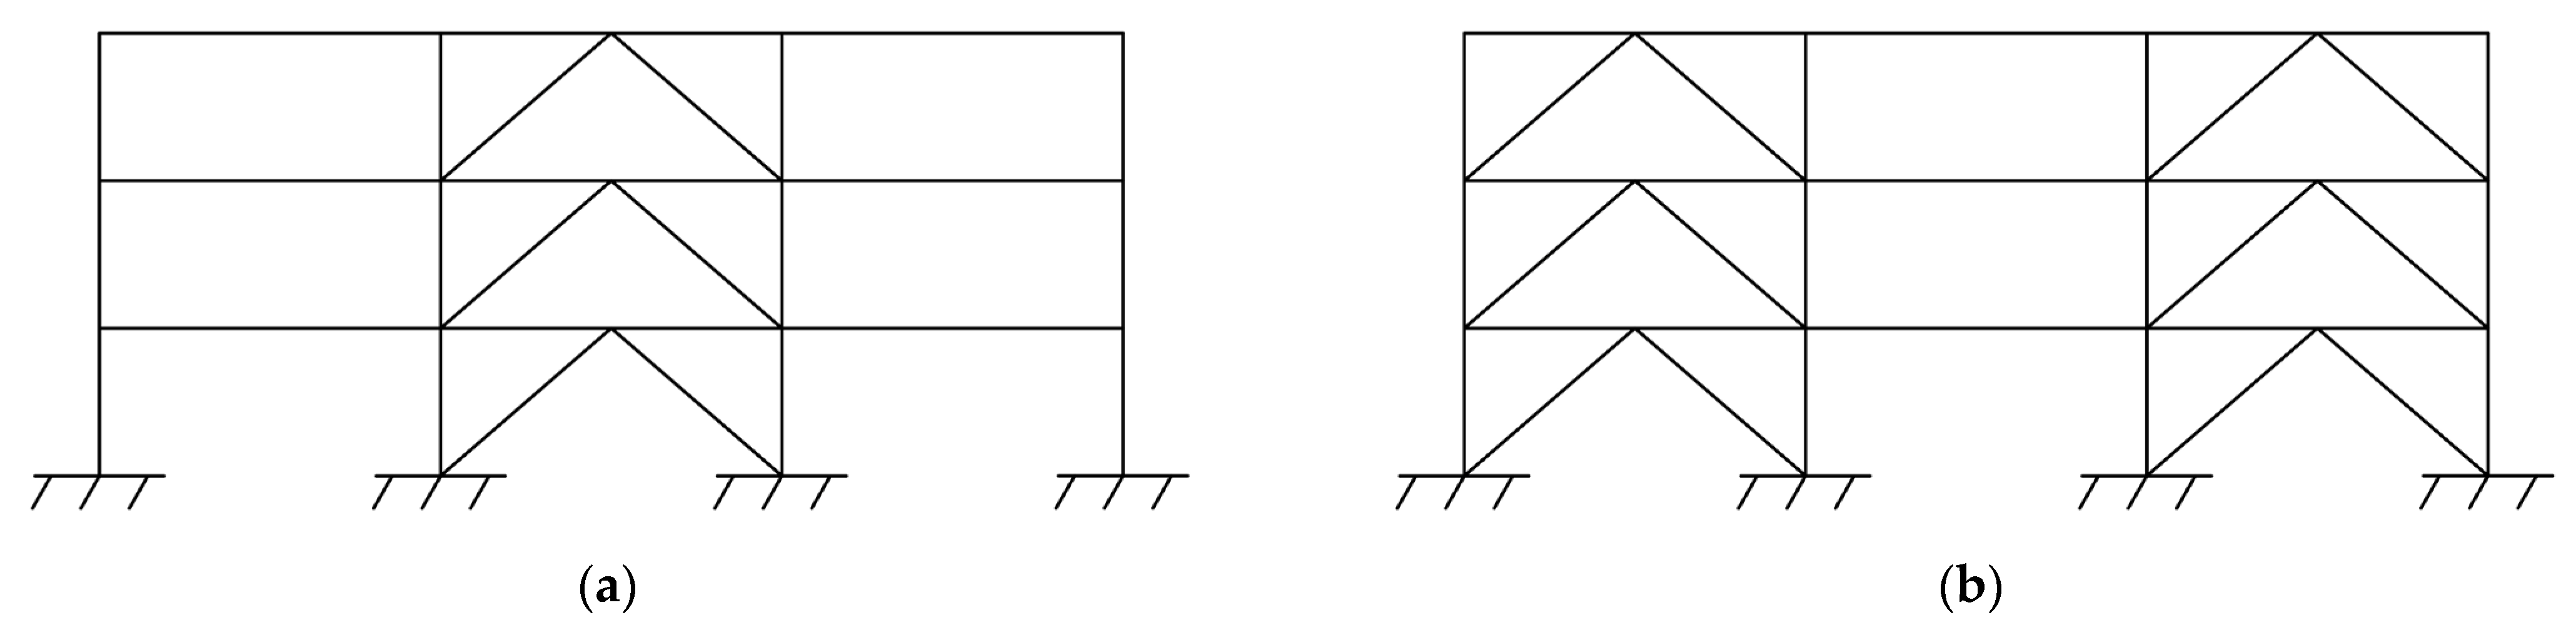
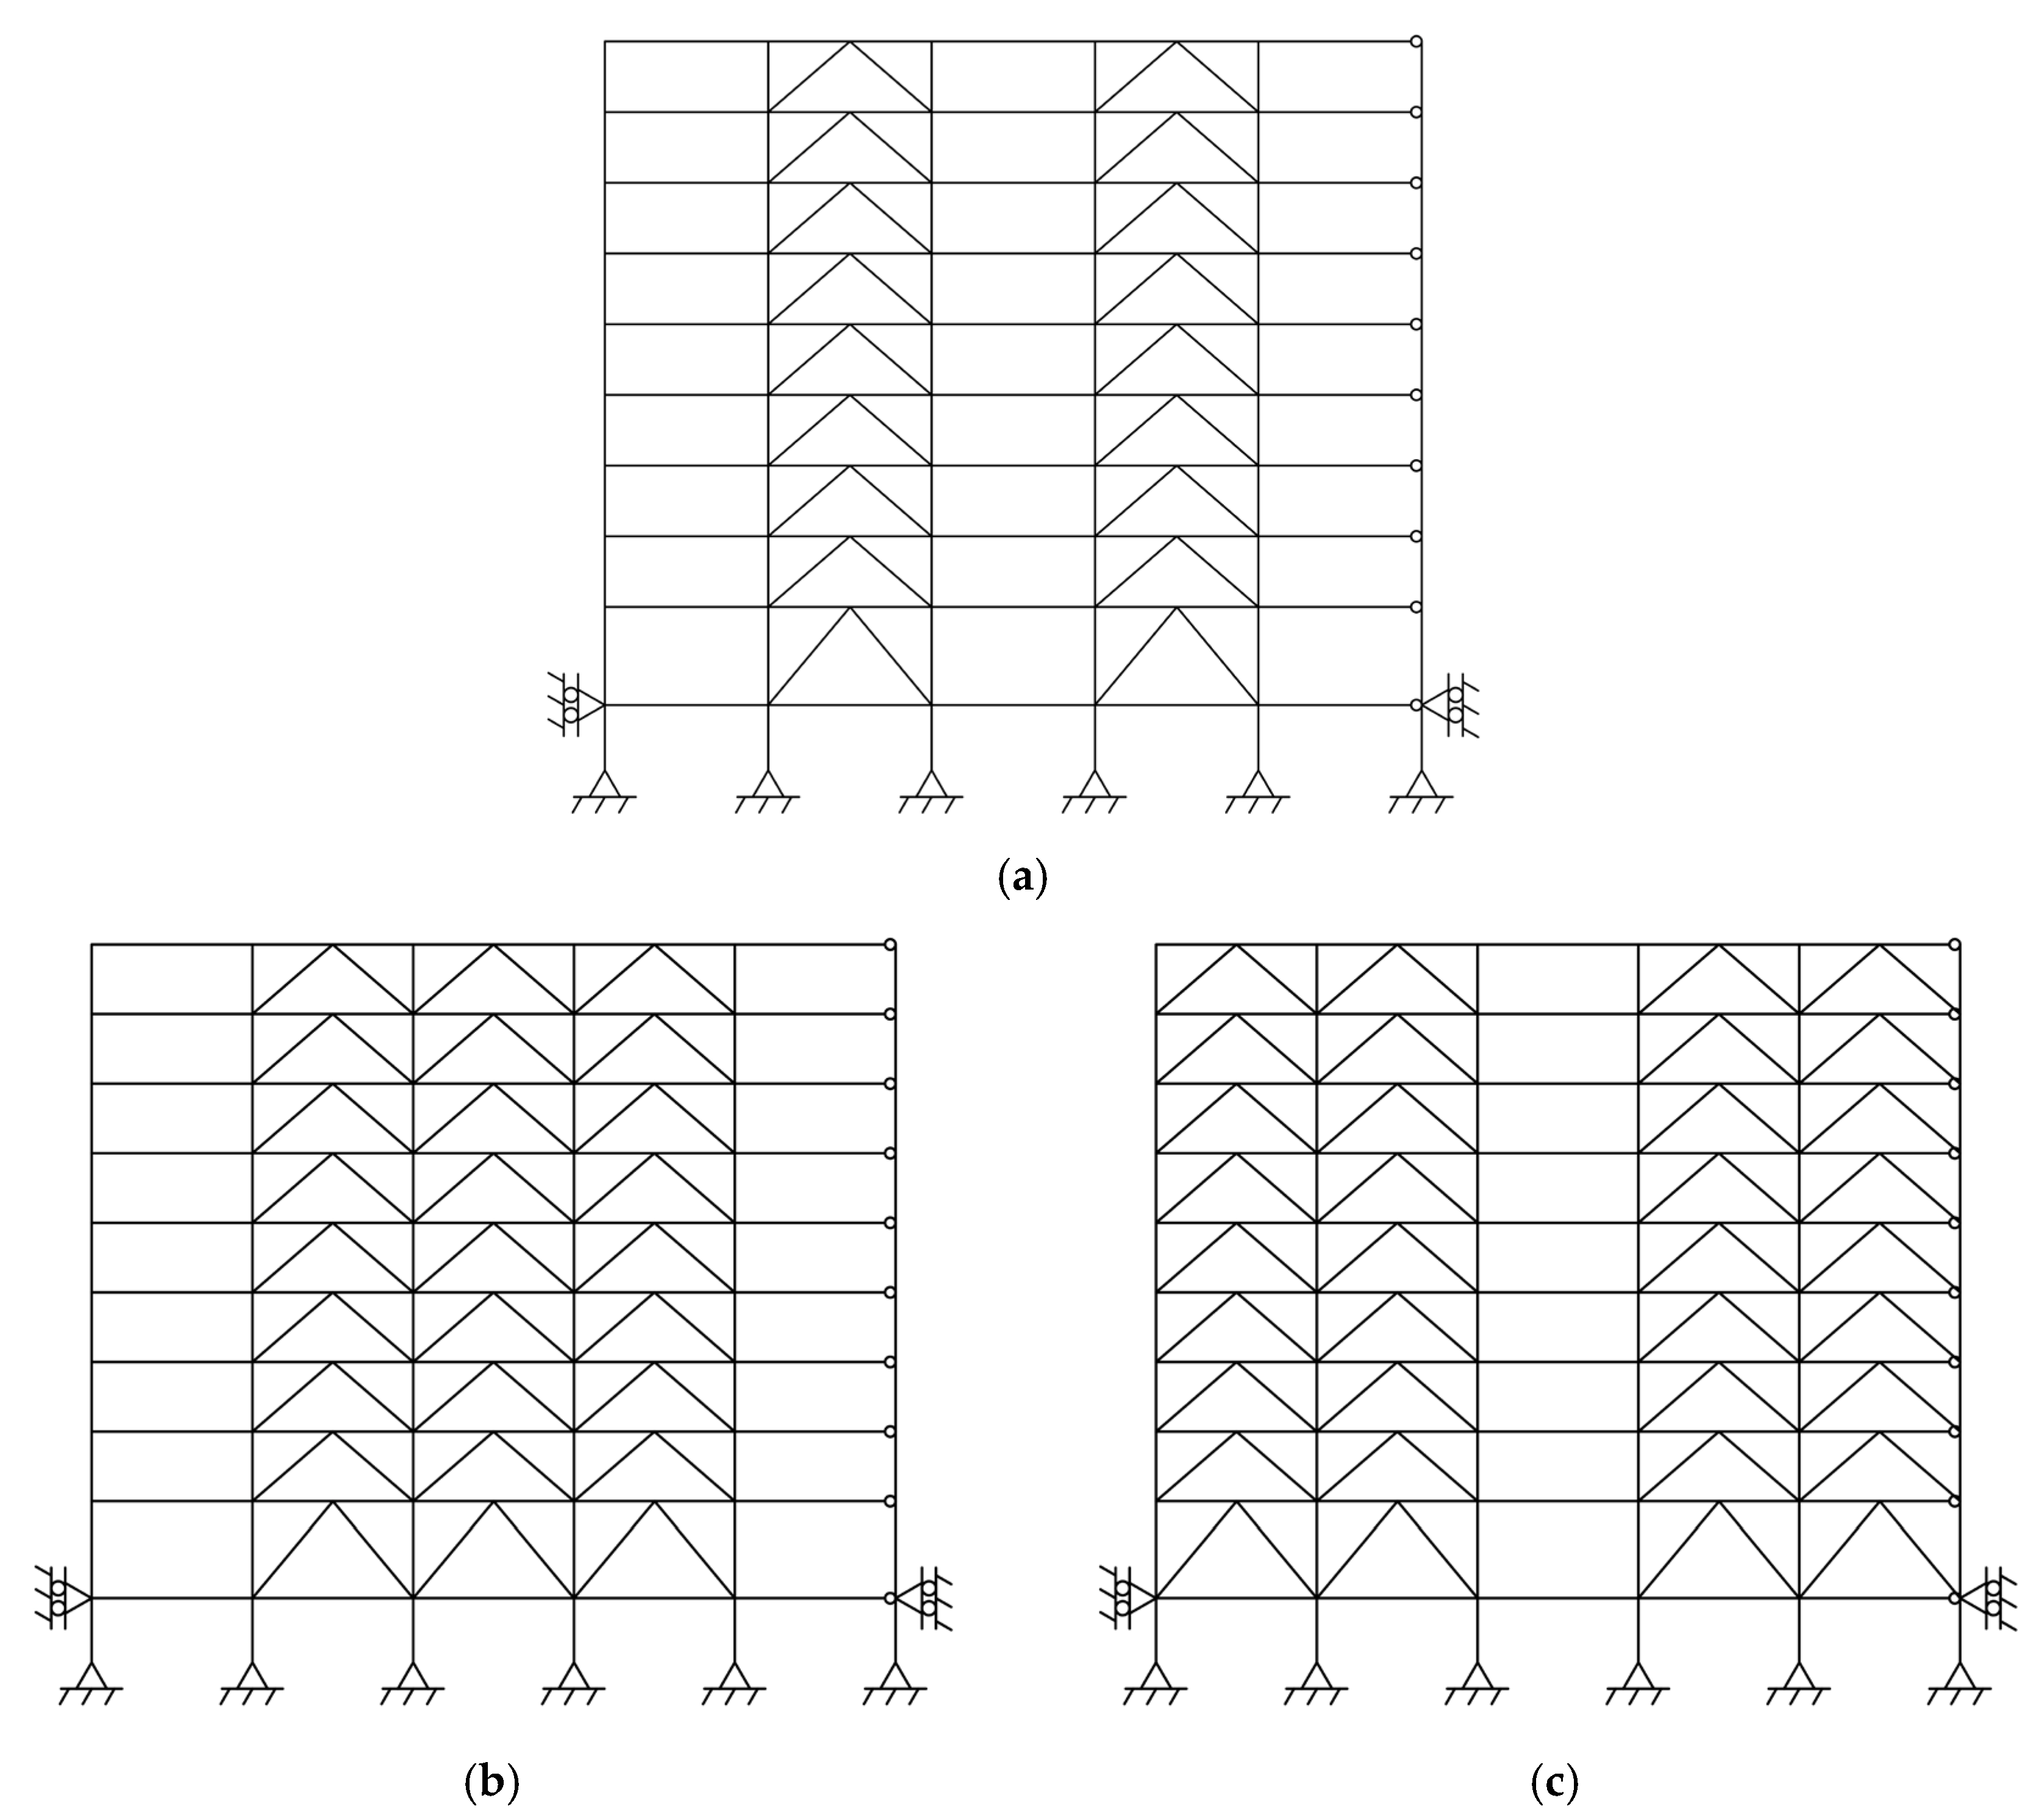
For simplicity and to maintain a certain level of uniformity, only one BRB size was selected for use in the three-story frame, although the computed BRB sizes vary from story to story. This one size was obtained by taking the average of the cross-section areas of the BRB yielding steel core computed for each of the three stories. The final designs and arrangements of BRBs for the three-story BRBFs in Los Angeles and Charleston, for the performance levels of IO and LS, are summarized in Table 4 and Figure 16. For Los Angeles, the calculated BRB area was relatively large and so more BRBs needed to be used. To accommodate these BRBs, they need to be placed in two bays. As for Charleston, the required BRB area was small enough that placement of these BRBs in just one bay was adequate.
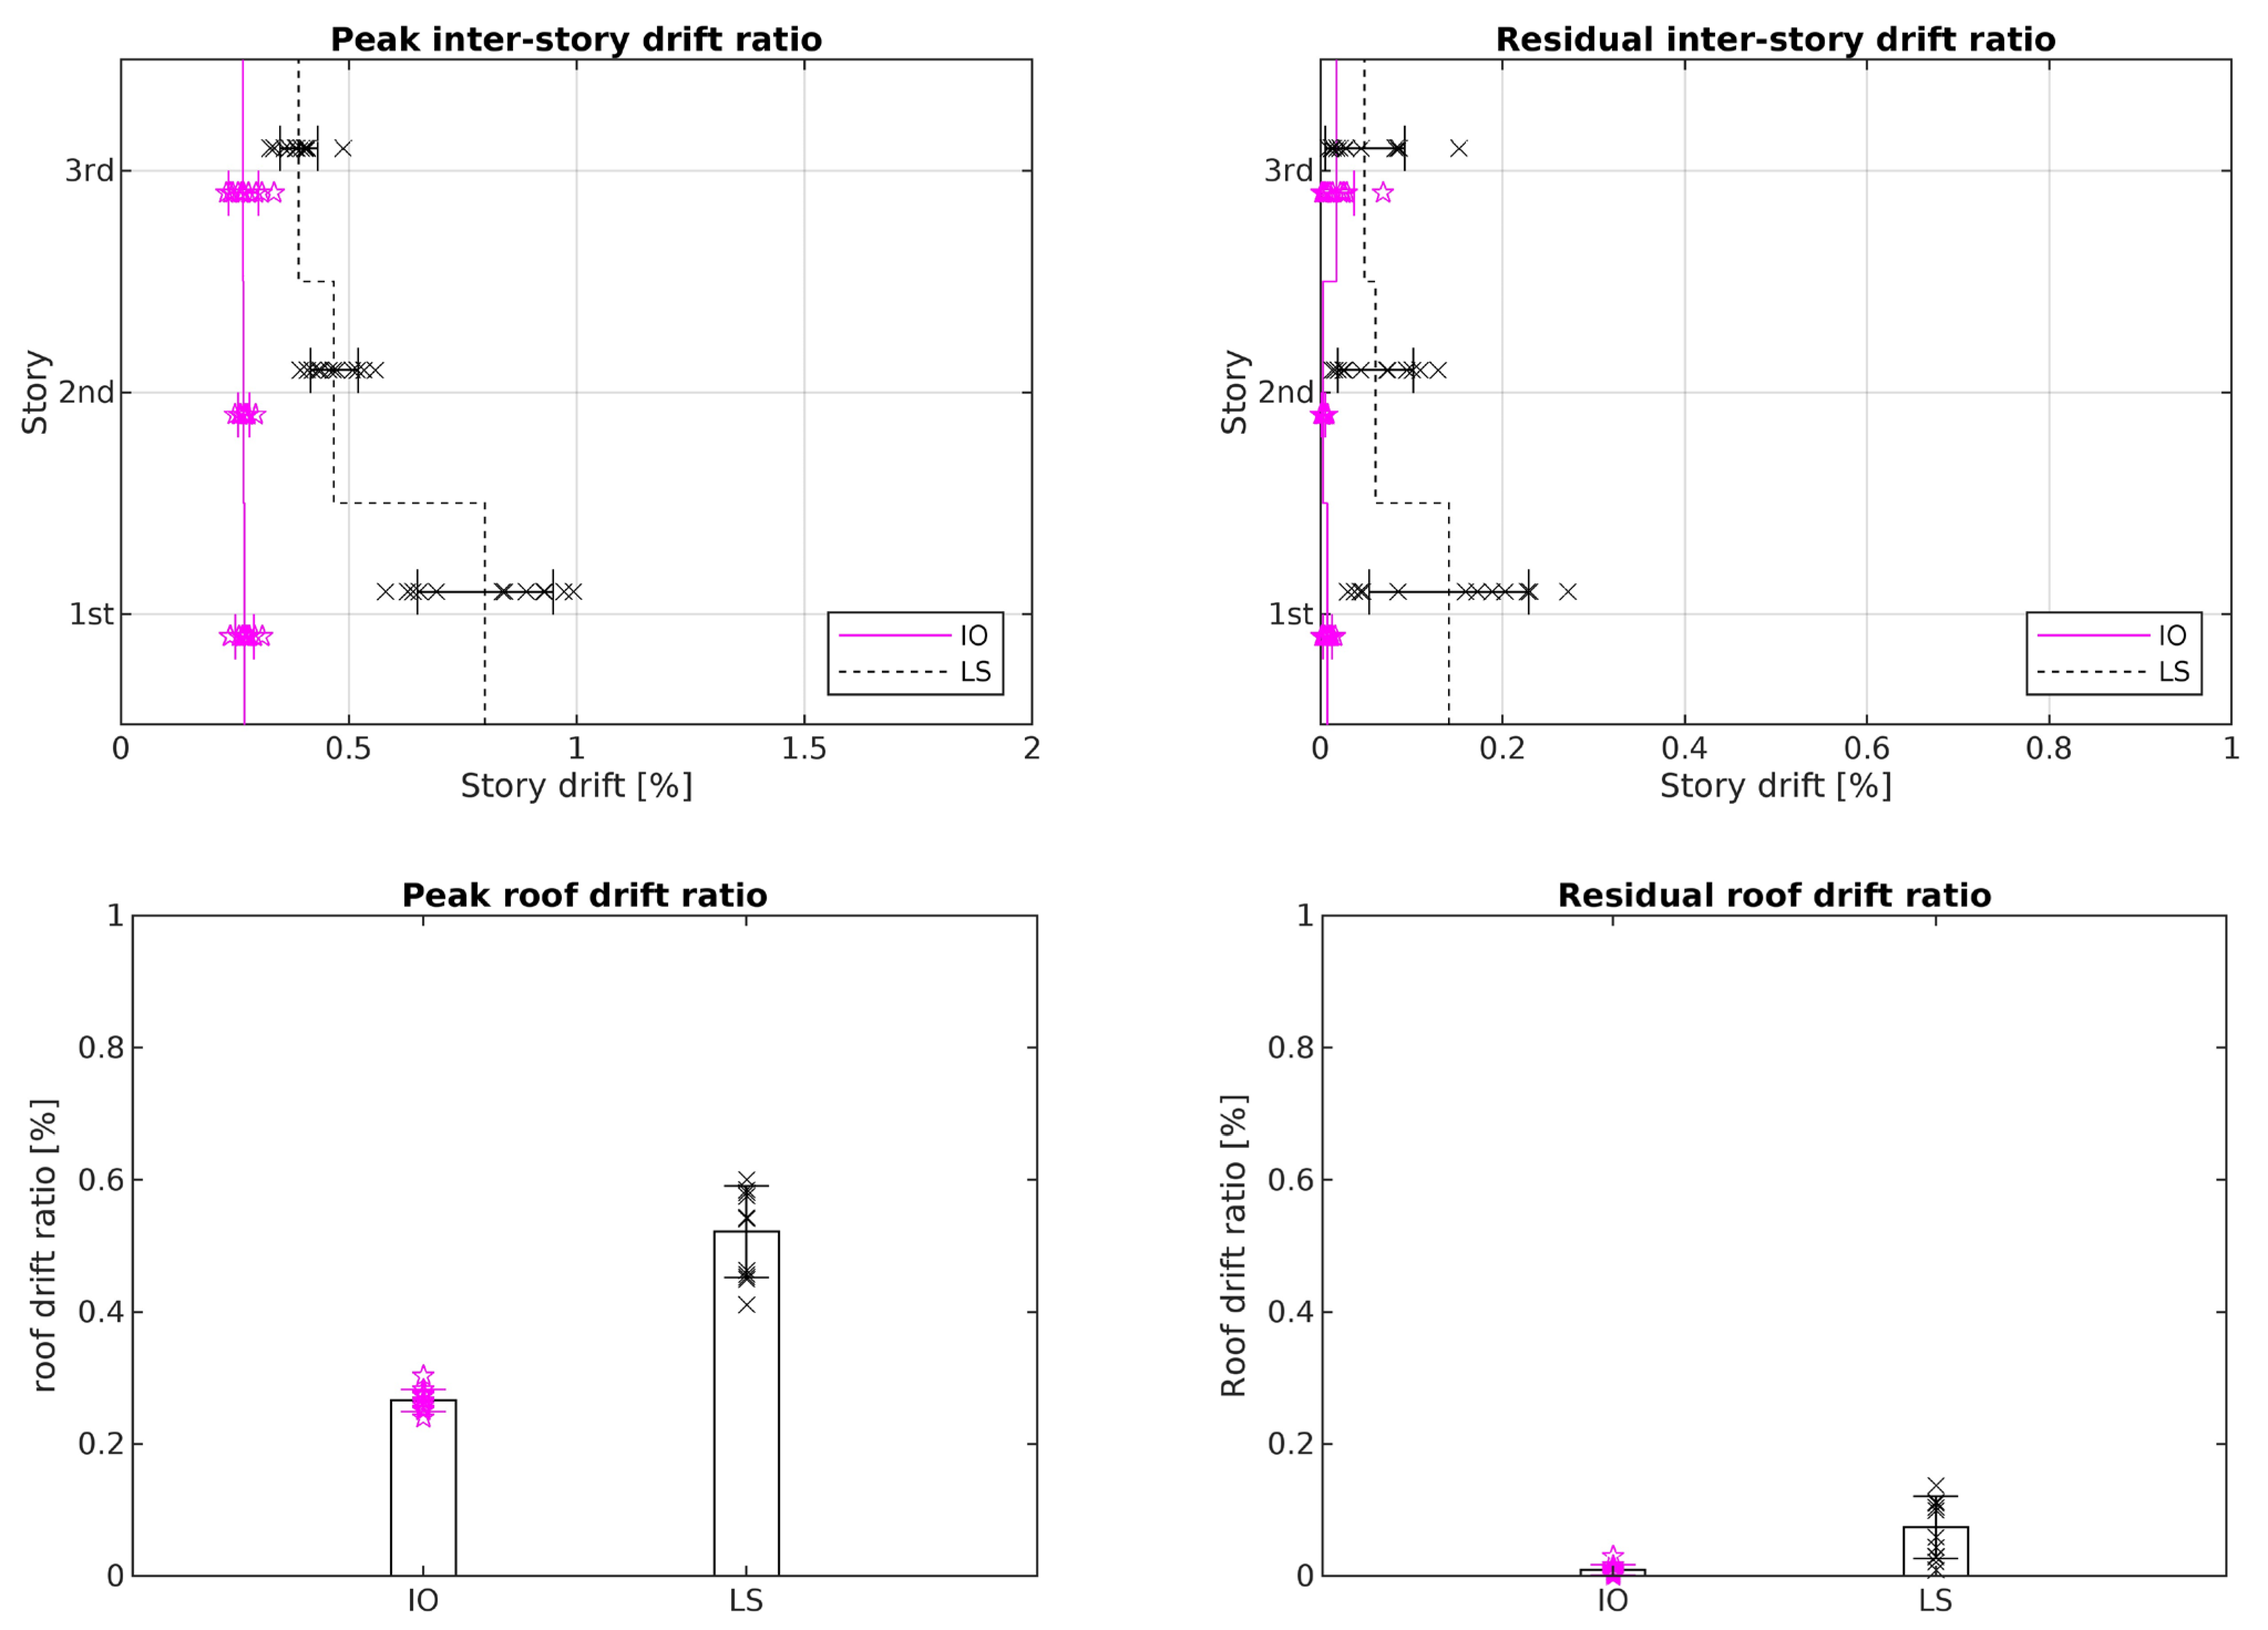
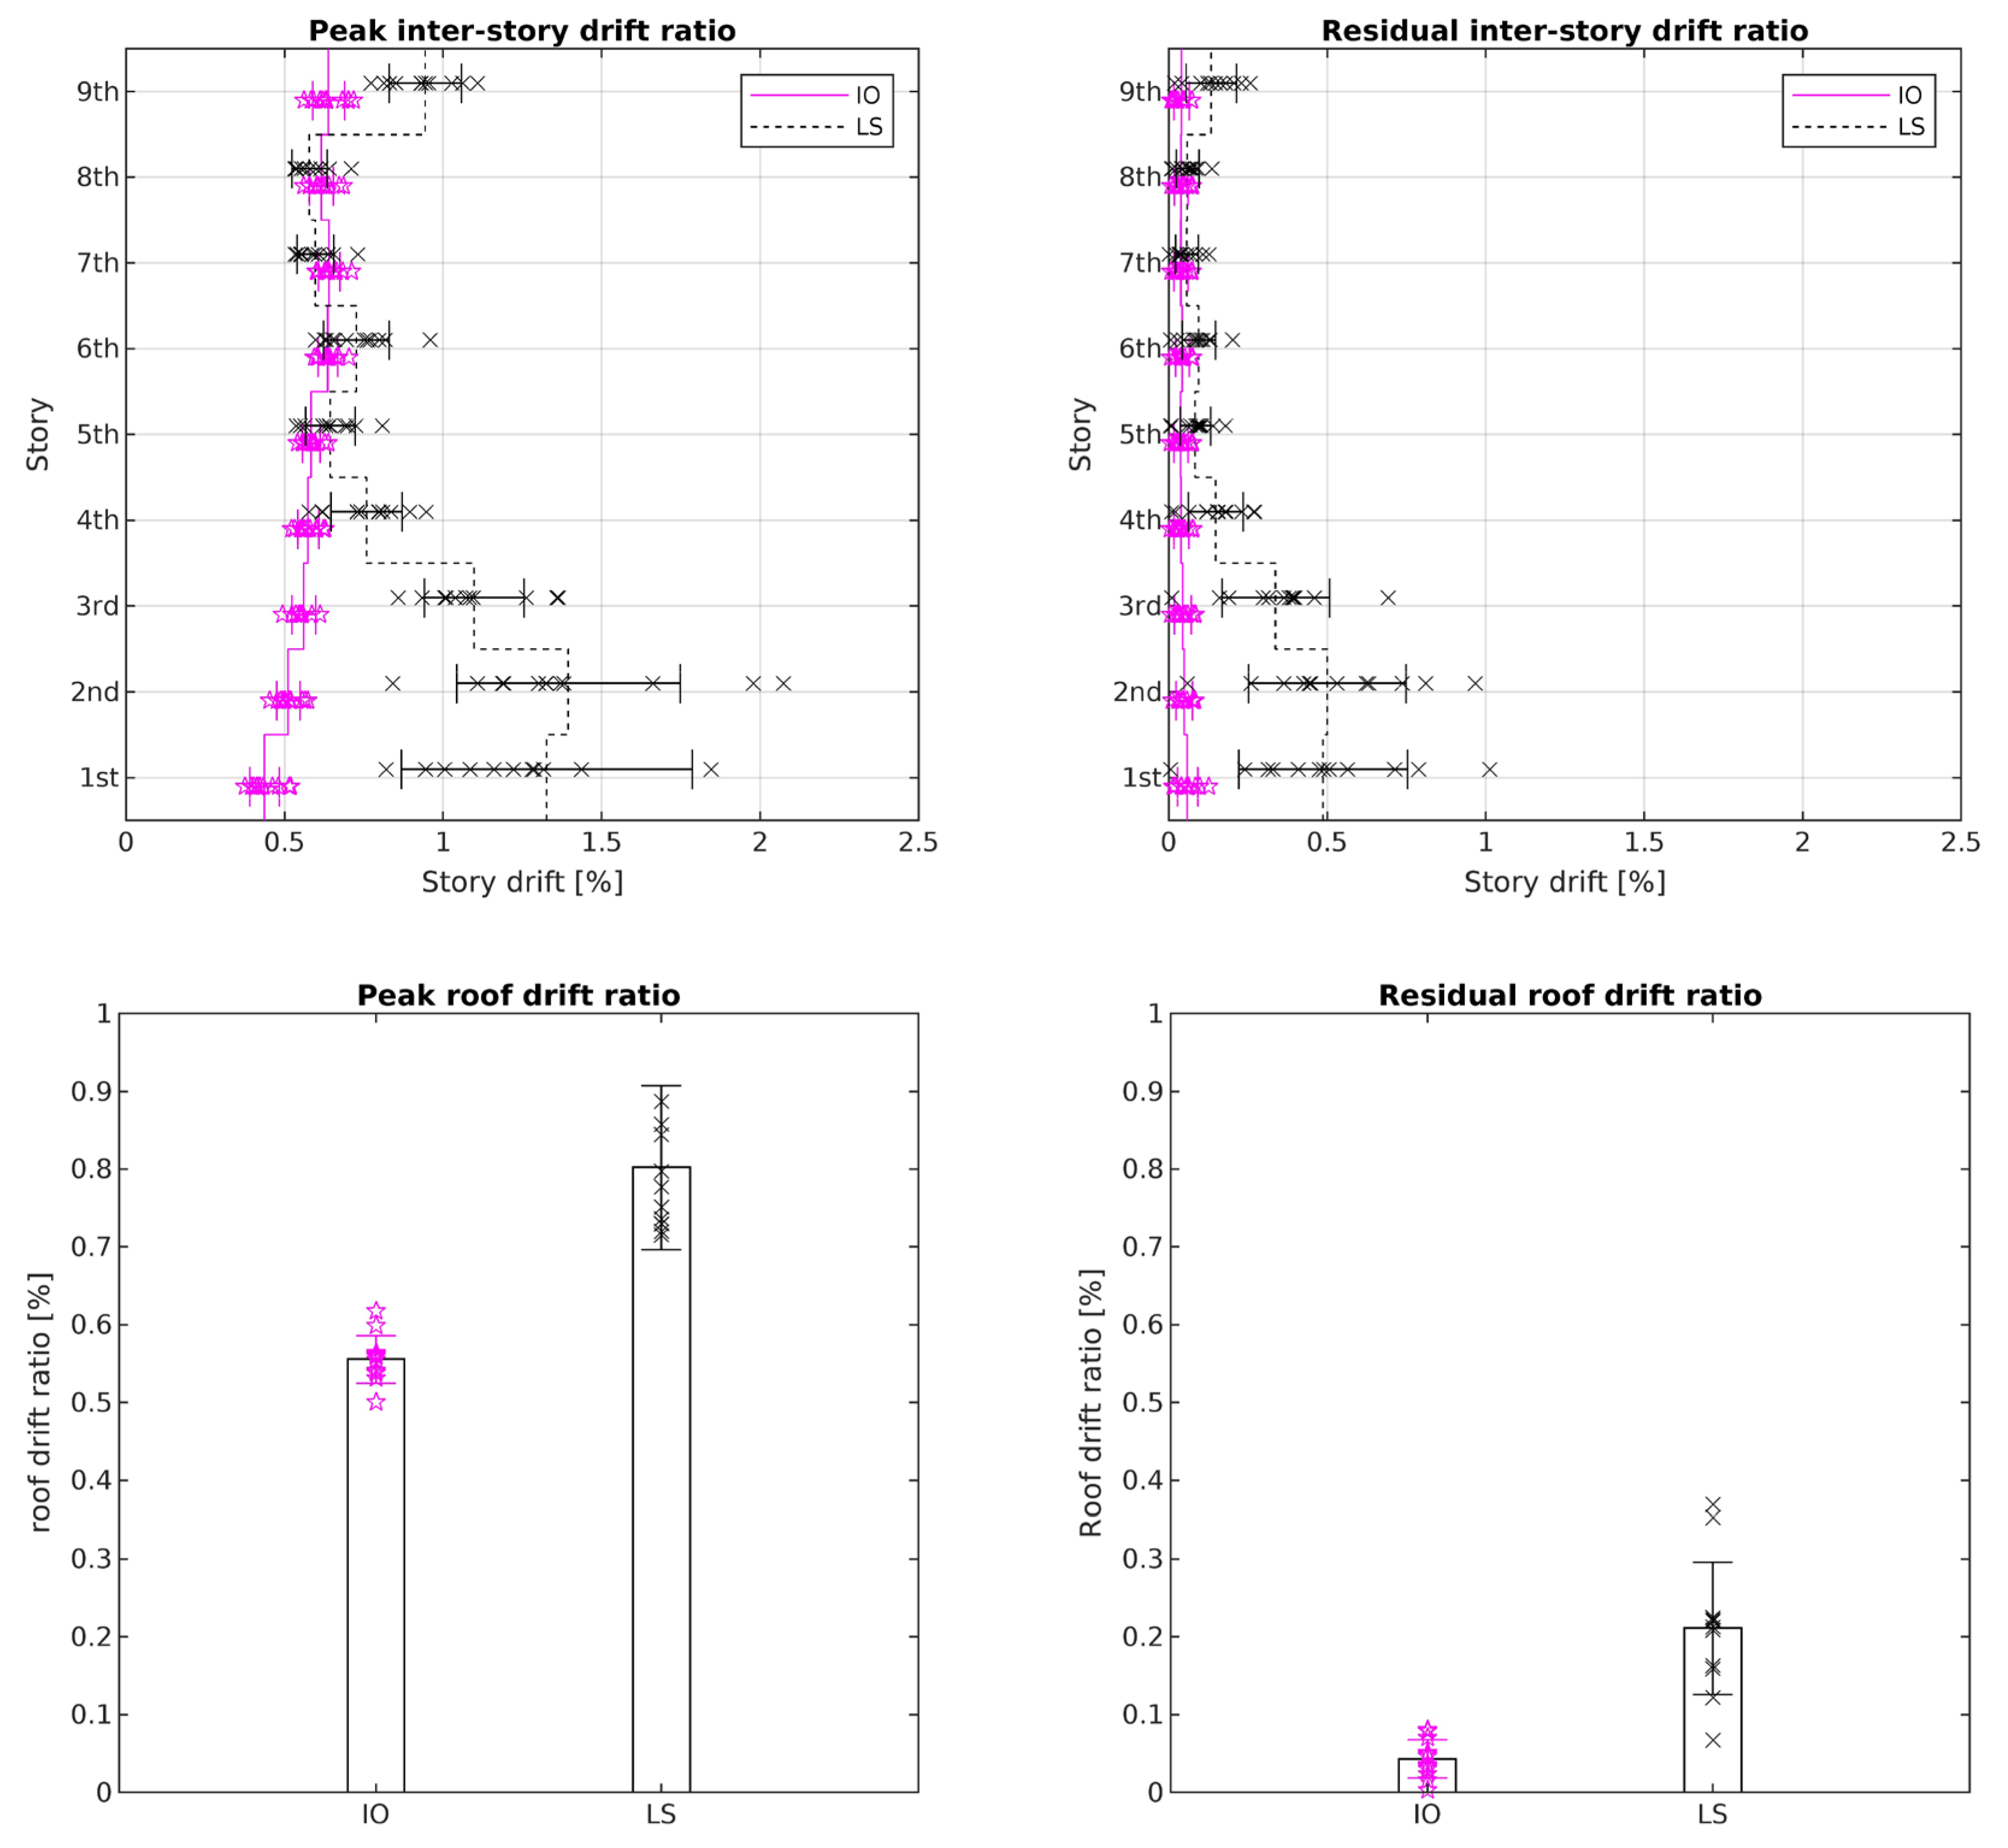
The analysis results for the peak and residual inter-story and roof drift ratios of the three-story BRBF are shown in Figure 17. The solid magenta lines represent results obtained for the BRBF designed for IO while the dashed black lines depict the results for the LS design. It can be seen that both the inter-story and roof drift ratios of the BRBF in Los Angeles decrease noticeably from those of the MRF, so much so that the frame now satisfies the FEMA 356 recommended deflection criteria for both the performance levels of IO and LS. The mean peak inter-story and roof drift ratios of the BRBF designed for IO are now 0.27% and 0.27%, and for LS they are 0.80% and 0.52%, respectively. The mean residual inter-story and residual roof drift ratios for IO are both very small (≈0.01%), indicating that the frame behaves more or less elastically with no permanent deformations after the dual hazards. As for performance level of LS, the residual inter-story and residual roof drift ratios are 0.14% and 0.06%, respectively, which are also quite small.
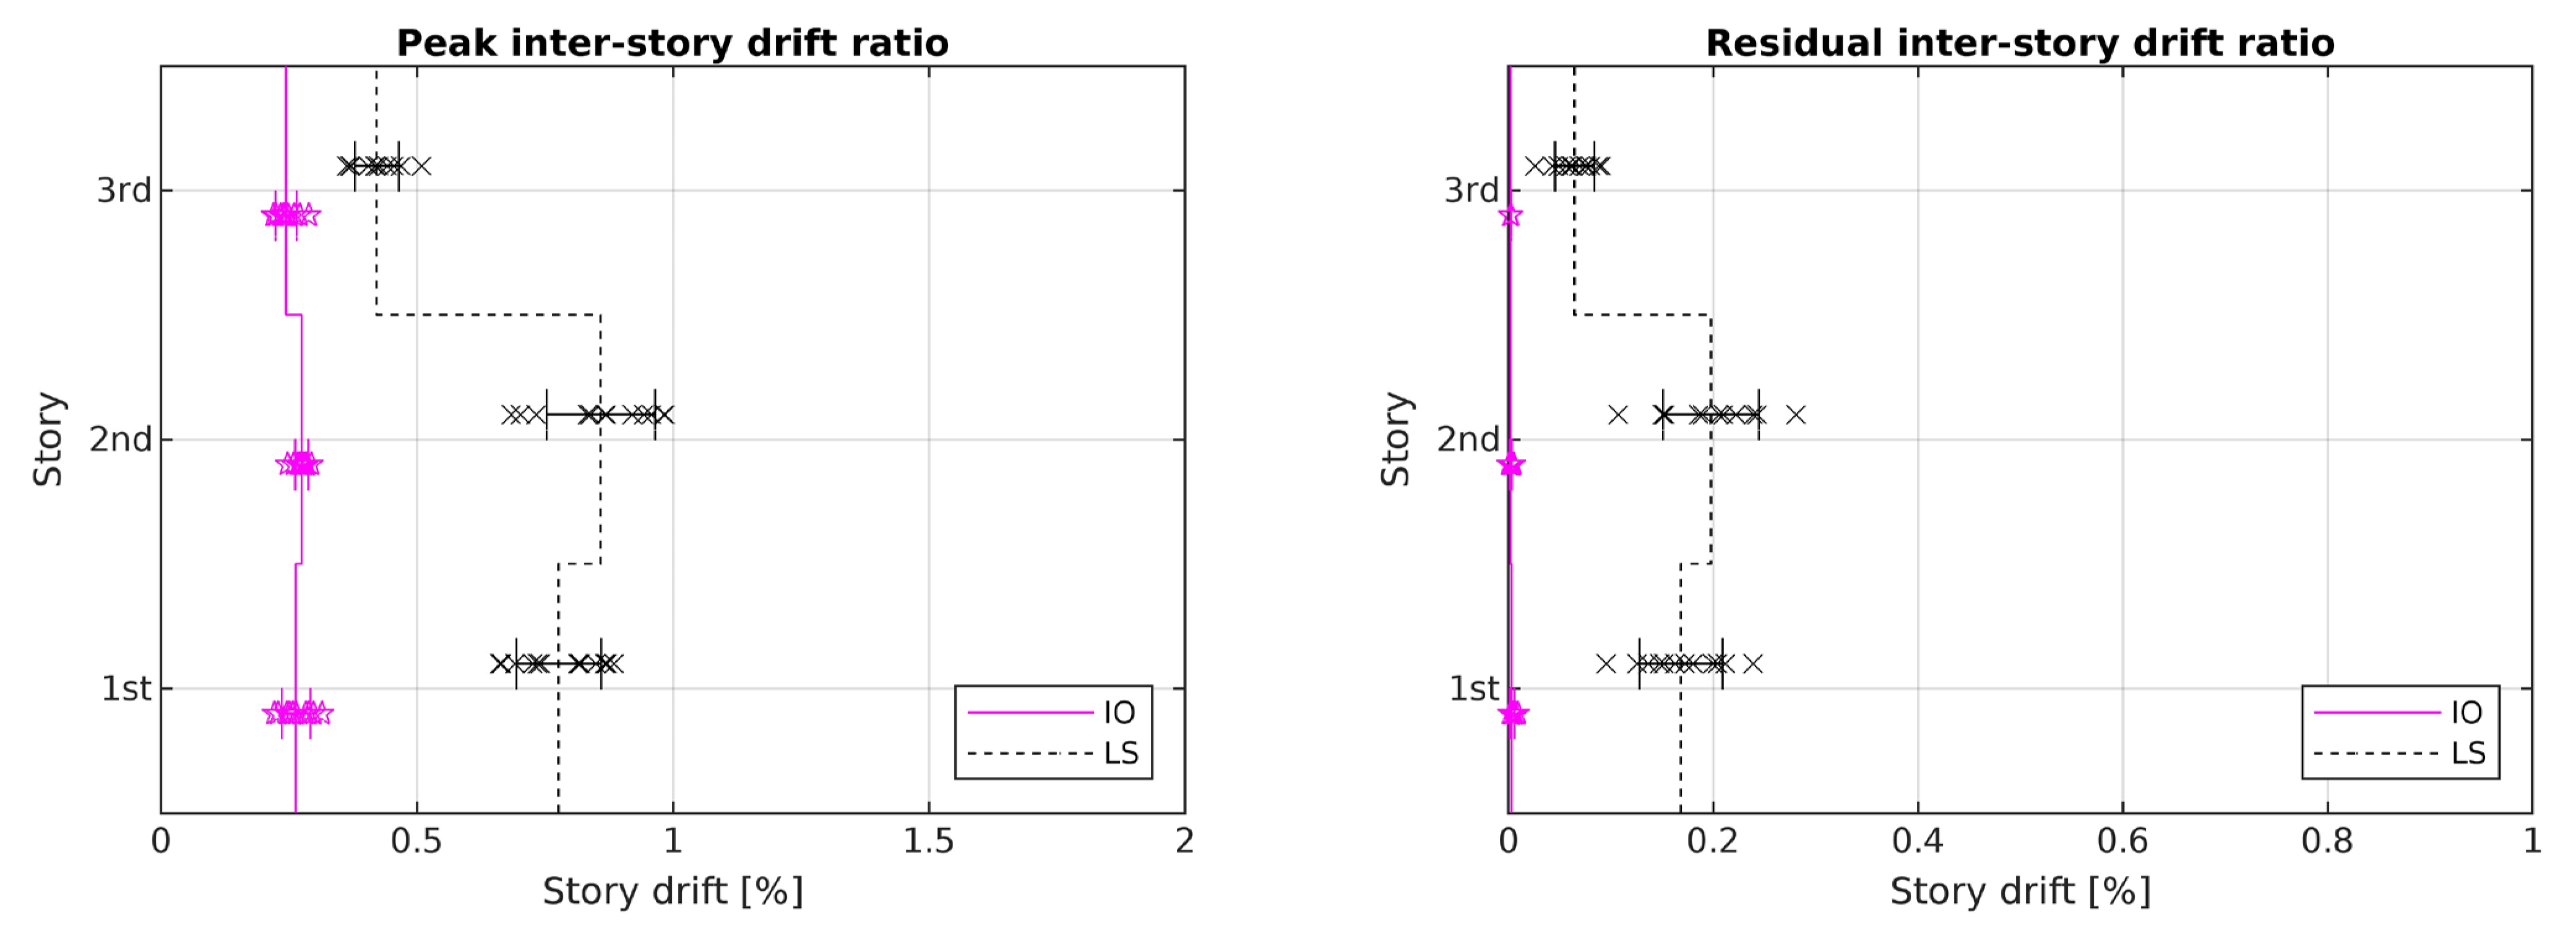
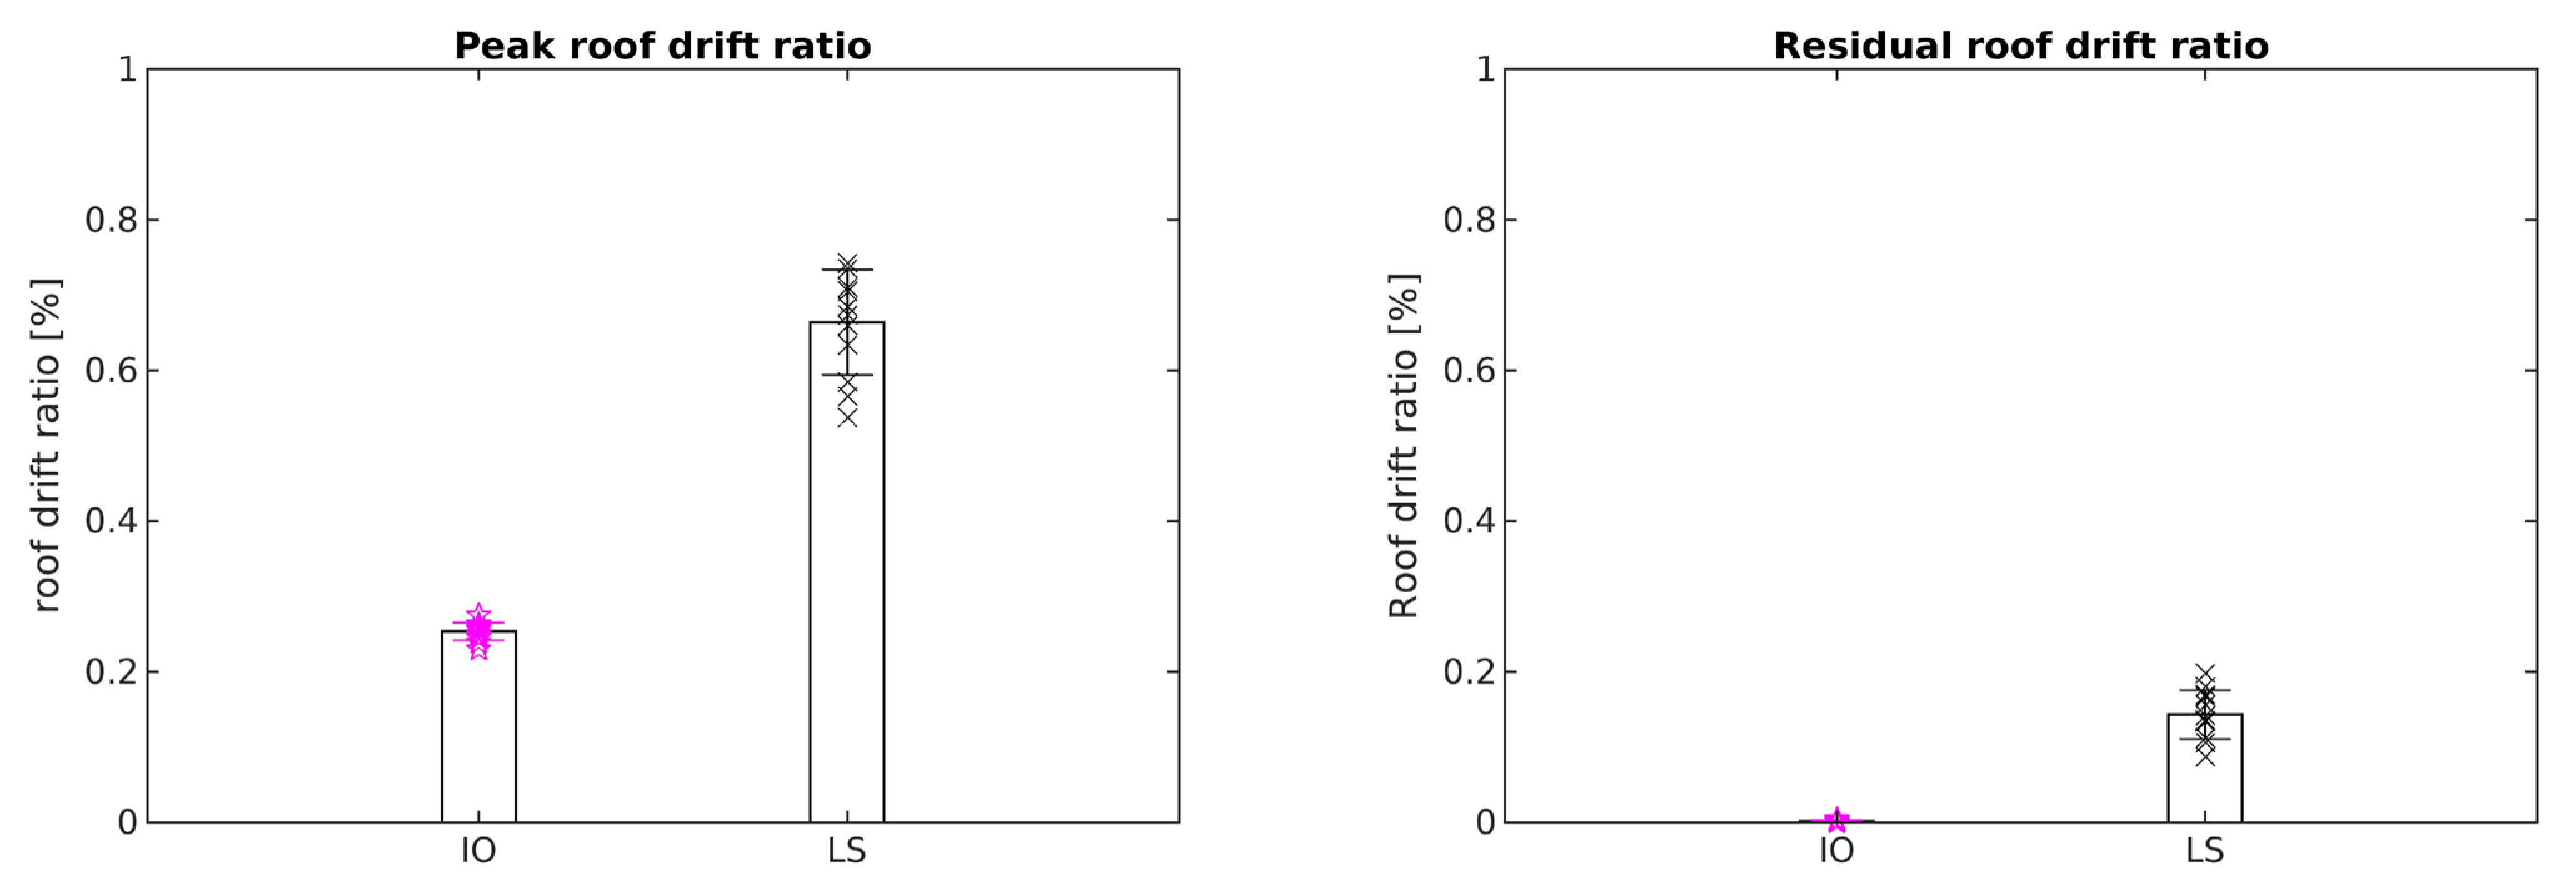
The peak and residual inter-story and roof drift responses of the BRBF in Charleston are shown in Figure 18. The addition of BRBs helps reduce drifts in the design for LS, especially in the top story. This is because the BRB used for the frame was based on the average of the required BRB bracing core areas computed for all three stories, and the required BRB area for the top story was smaller than this average value. It can be seen that the mean peak and residual inter-story drift ratios of the BRBF were 0.27% and negligible (≈ 0%) for the performance level of IO, and 0.86% and 0.2% for the performance level of LS; meanwhile, the mean peak and residual roof drift ratios were 0.25% and ≈0% for IO, and 0.66% and 0.14% for LS.
The proposed BRB design method results in a relatively conservative design for the three-story BRBF. The selected BRB was larger than what was required for the top story, and so the drift ratios of this story were noticeably decreased, especially at the LS performance level when larger drift limits were allowed.
9.2. Nine-Story Frame
For the nine-story frame, four different sizes of BRBs were used. The analysis showed that the top and bottom stories required the smallest and largest BRB cross-section areas, respectively, so each was accorded a specific BRB size. The BRB sizes computed for the second to fifth floors did not vary appreciably and so one BRB size—obtained by taking the average of these BRB areas—was used. Similarly, a single BRB size for the sixth to eighth stories was selected based on the average of the required BRB areas for these stories. The final designs and placements of BRBs for the nine-story BRBF in Los Angeles and Charleston for the performance levels of IO and LS are summarized in Table 5 and Figure 19. Depending on the required BRB sizes, their placement in a symmetric pattern from two to four bays of the frame (as shown in Figure 16) is recommended.
Time-history analysis results for the nine-story frame in LA are given in Figure 20. It can be seen that the mean peak inter-story and roof drift ratios of 0.64% and 0.56% for the BRBF designed for IO are somewhat larger than the FEMA-recommended drift limit of 0.5%. On the other hand, the frame designed for LS, which was shown earlier to not be able to survive the combined actions of the earthquake and wind hazards, is now able to withstand the dual excitations with the addition of BRBs. The mean peak inter-story and roof drift ratios are 1.33% and 0.80%, and the mean residual inter-story and roof drift ratios are 0.5% and 0.21%, respectively. Therefore, they all satisfy the FEMA-recommended drift limits for LS.
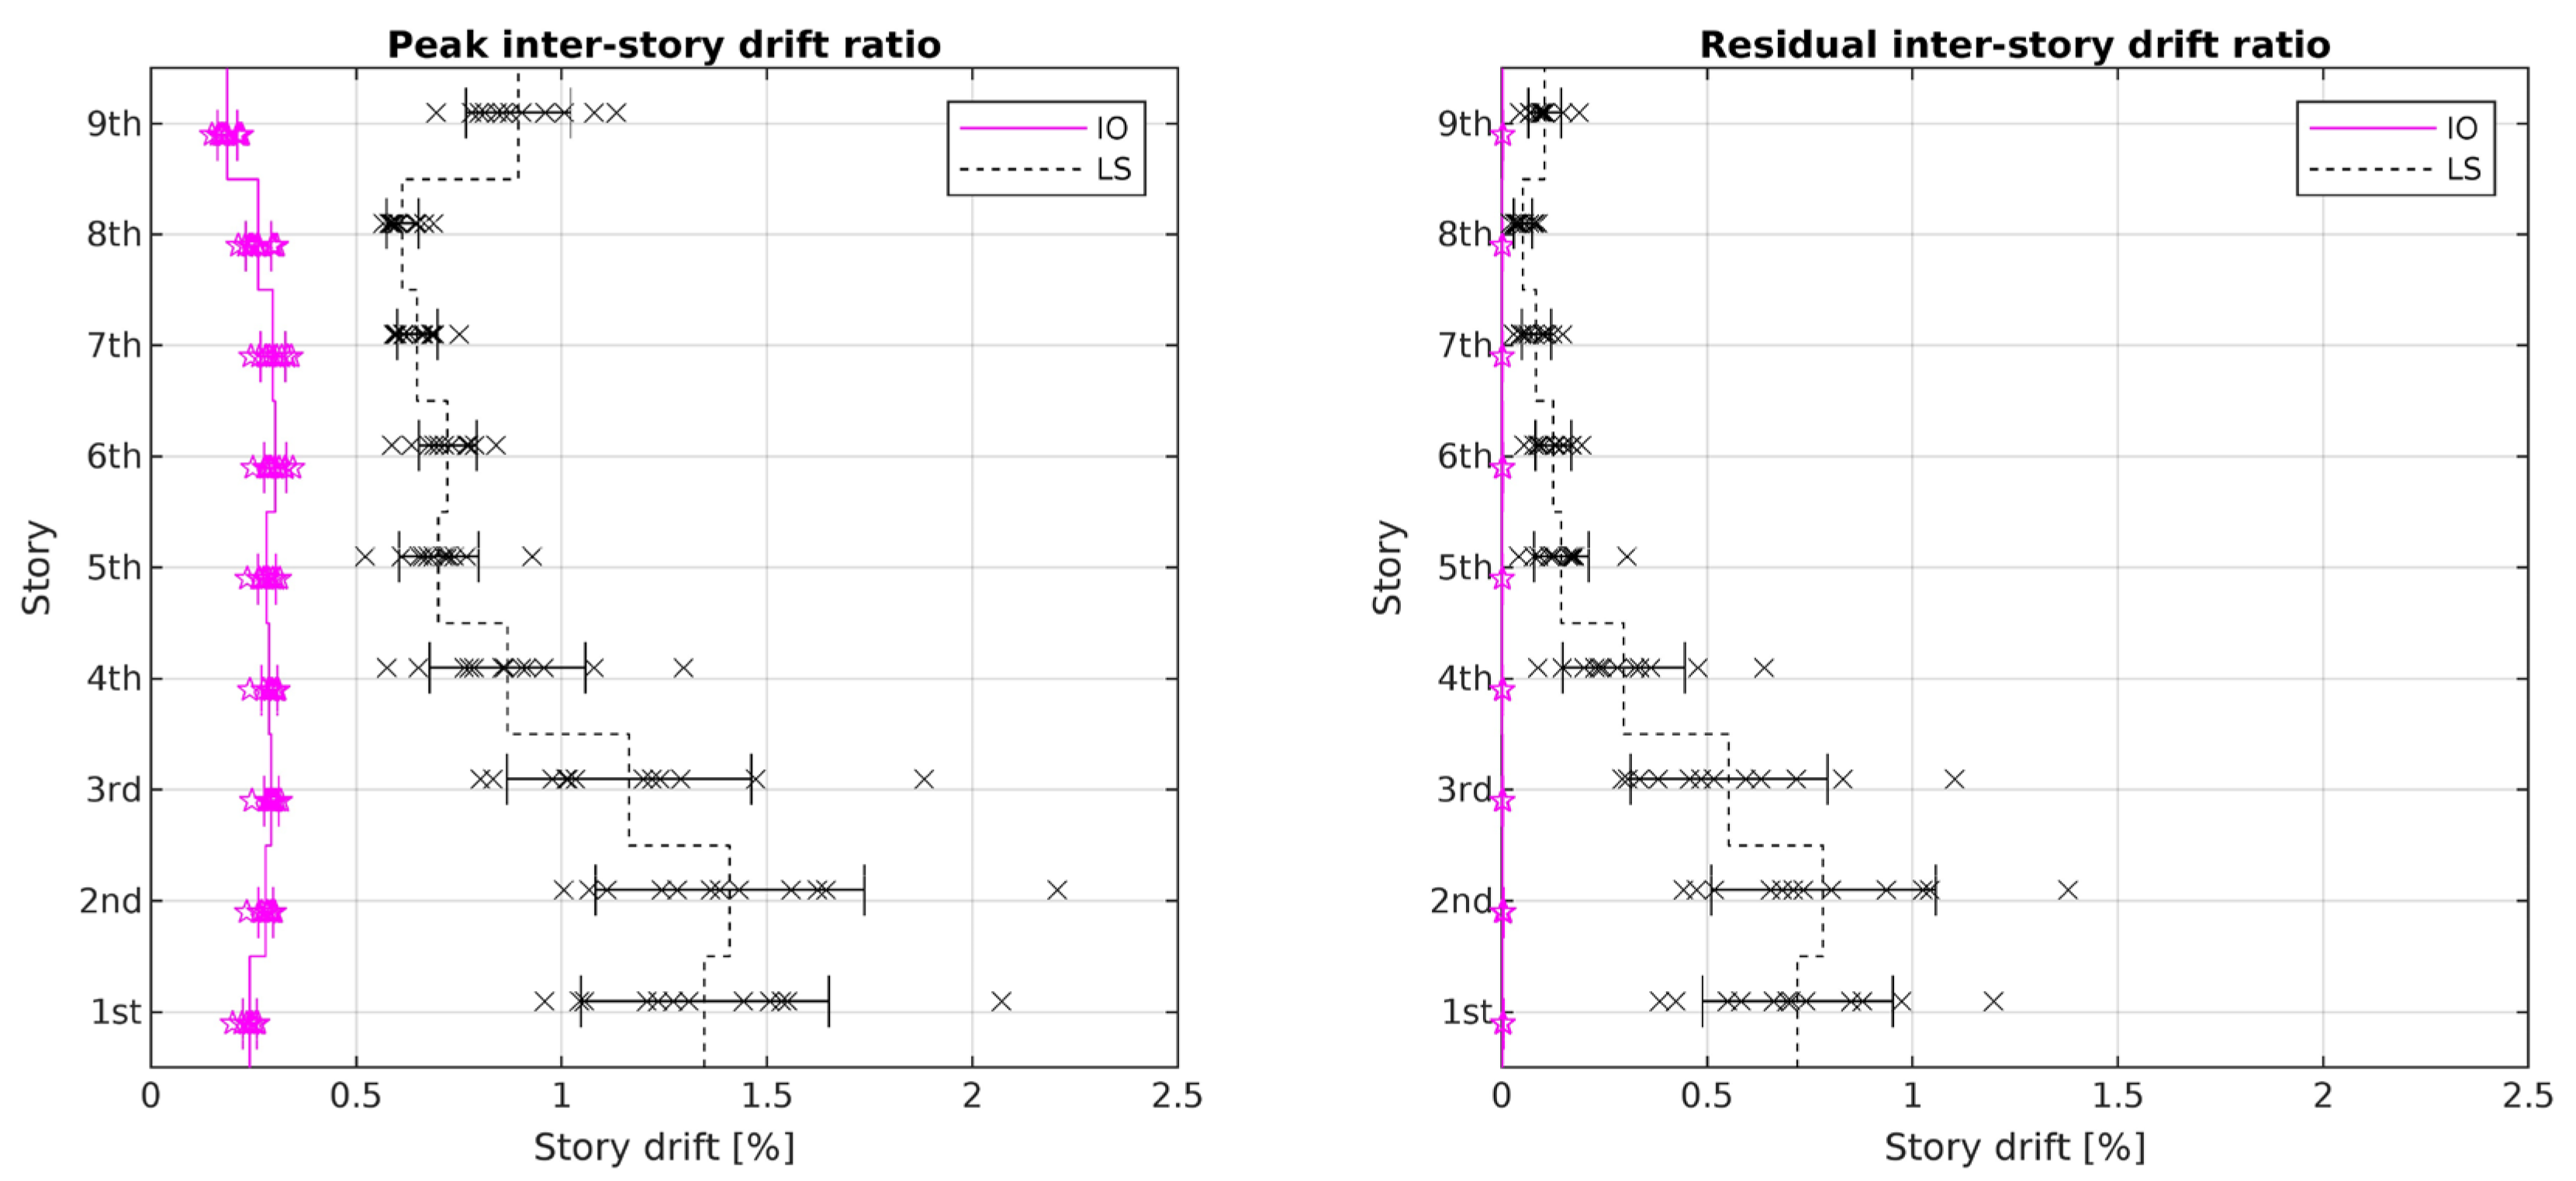
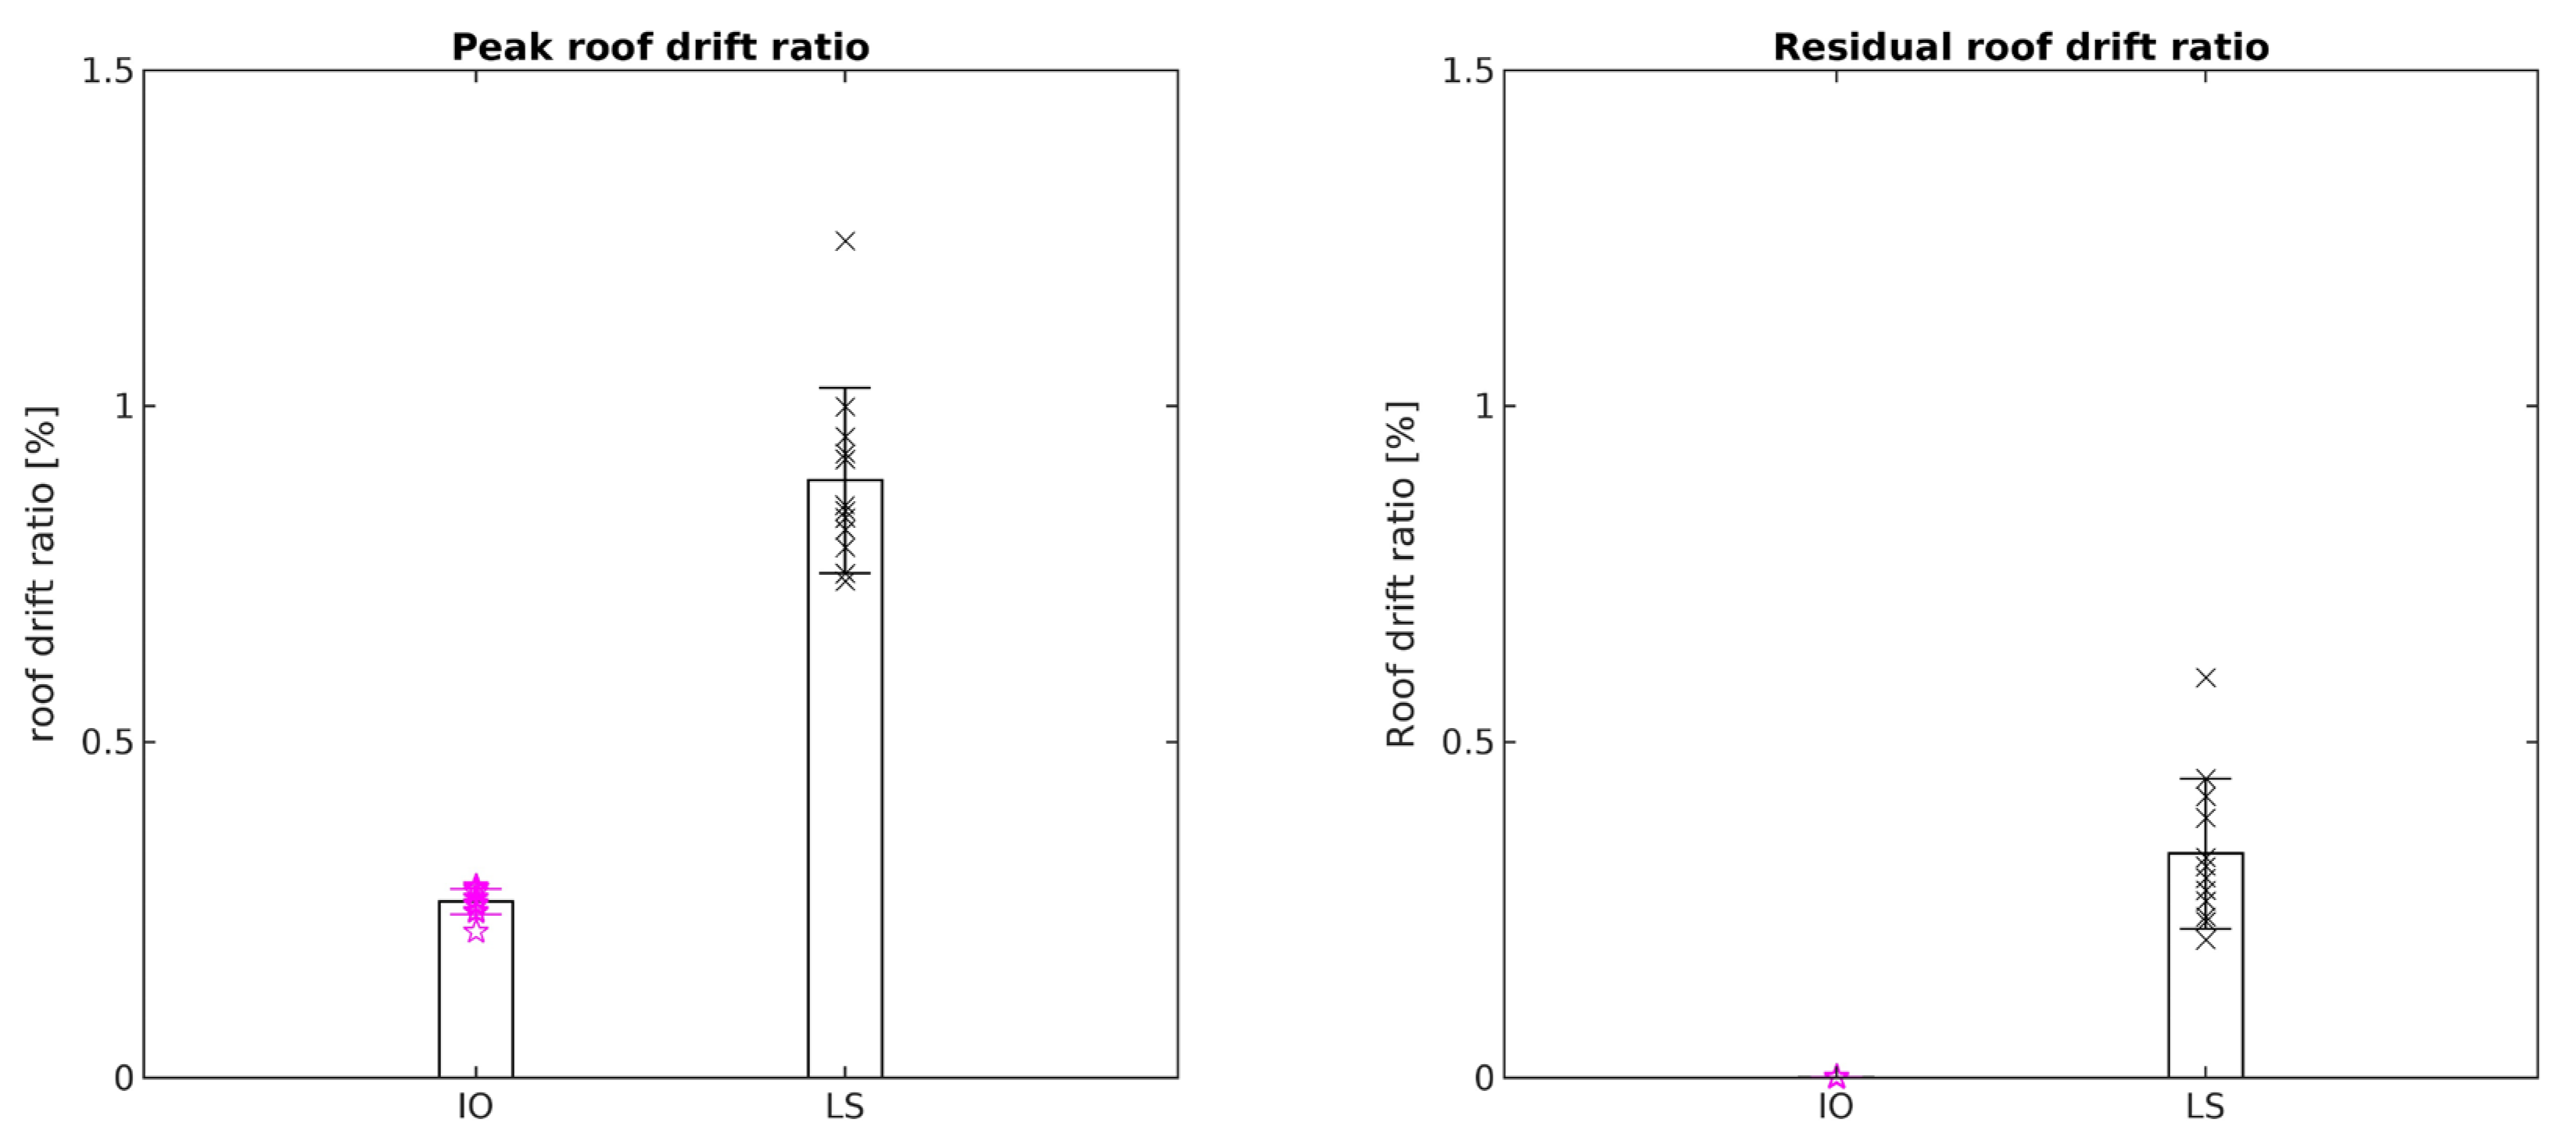
For the nine-story BRBF located in Charleston, it can be seen from Figure 21 that the mean peak inter-story drift ratios are 0.30% for the IO design and 1.41% for the LS design. However, for the bottom three stories, their mean residual inter-story drift ratios for the LS design exceed the FEMA-recommended drift limit of 0.5%. Note that the drift ratio computed for one of the 12 ground motions is much larger than the others. This causes the mean story drift to increase. As for the mean peak and residual roof drift ratios, their values are 0.26% and ≈0% for IO, and 0.89% and 0.33% for LS, respectively. These all fall below the FEMA-recommended drift limits for the design under the performance levels of IO and LS.
10. Results and Discussion
The analysis results presented earlier in Figure 5, Figure 6, Figure 8, Figure 9, Figure 17 and Figure 18 for the three-story moment resisting frame (MRF) and buckling-restrained braced frame (BRBF) and in Figure 11, Figure 20 and Figure 21 for the nine-story MRF and BRBF are summarized in Table 6, Table 7, Table 8 and Table 9.
In Table 6, the analysis results for the mean peak and residual inter-story and roof drift ratios of the three-story steel frame located in Los Angeles and Charleston under the performance levels of IO and LS are presented. The corresponding analysis results for the nine-story frame are given in Table 7. As can be seen, the drift ratios due to the dual earthquake–wind hazards for the nine-story frame are noticeably higher than those for the three-story frame because wind load increases as the height of a building increases. For cases that are marked with the letter C, frame deflections were so large that convergence became a problem, signifying incipient failure of the frame. Furthermore, it can be seen that the dynamic responses of the frames subjected to dual excitations cannot be obtained by summing their respective dynamic responses due to earthquakes and wind excitations only. This is because when one of the hazards causes inelasticity to occur in the frame, the effect will be exacerbated when both hazards occur concurrently (as depicted in Figure 10 and Figure 12).
In Table 8 and Table 9, the analysis results for the mean peak and residual inter-story and roof drift ratios of the three-story and nine-story steel frames in Los Angeles and Charleston under the performance levels of IO and LS are compared for the MRF and BRBF, i.e., before and after the addition of BRBs. As can be seen, a noticeable decrease in drifts is observed after the addition of BRBs. In particular, the nine-story frame that experiences excessive deformations (large enough to cause collapse without the BRBs) is able to withstand the dual hazards after BRBs are installed.
It should be noted that the present study is focused only on the serviceability (IO) and safety (LS) aspects of these frames when subject to the dual earthquake–wind hazards. Material, fabrication and installation costs of the BRBs are not considered since cost analysis is not part of the present study. It is, however, perceivable that the BRBF frames will cost more and the construction times for these frames will be longer.
11. Summary and Conclusions
Traditionally, engineers design buildings with a focus on just a single hazard—earthquake or wind—based on the geographic location and the building’s risk category. However, designing structures for one dominant hazard without considering the other could result in an unsafe design, especially when both hazards happen to occur concurrently. Designers interested in investigating the effect of both earthquakes and wind on structural behavior often resort to performing the analyses and designs for earthquake and for wind separately. Moreover, the design for wind often treats wind as a static load when its effect is dynamic in nature.
In the present study, a dual hazard spectrum that allows engineers to consider both the static effect of wind as well as the dynamic effects of earthquakes and wind is proposed. This dual earthquake–wind power spectrum is obtained by combining the earthquake and wind power spectral densities using the SRSS combination rule as shown in Equation (8). Using this dual hazard spectrum, time-varying dual hazard excitations can then be generated using Equation (9) and used to determine whether the design is adequate under the effect of dual excitations.
For buildings that do not satisfy the drift requirements, buckling restrained braces (BRBs) are added as supplementary energy-dissipation devices. An energy-based procedure using the well-known equivalent lateral force approach in seismic design is proposed for the design of these BRBs. When applied to two multistory frames, it was shown that the proposed procedure successfully reduced the peak and residual inter-story and roof drift ratios to below or near the FEMA 356 [11] recommended drift limits.
Based on the results of the present study, the following conclusions can be made.
- When compared to results obtained for earthquake only or wind only excitation, the two steel frames used in the present study were shown to experience peak and residual inter-story and roof drift ratios that were noticeably higher under the dual earthquake–wind excitations.
- From Table 6 and Table 7, it can be seen that dynamic responses due to the combined earthquake–wind dual excitations cannot be obtained just by adding the dynamic responses due to earthquake only and wind only excitations. This is because of the presence of inelasticity. Once the structure experiences yielding, inelastic deformations will increase rapidly with the applied forces (as illustrated in Figure 10 and Figure 12).
- By retrofitting these frames with BRBs using the proposed energy-based design methodology presented in Section 8, the drift ratios of these frames were drastically reduced, and they all fell below or came very close to the FEMA 356 drift limits.
Author Contributions
Conceptualization, E.M.L.; methodology, T.S. and E.M.L.; validation, T.S. and E.M.L.; formal analysis, T.S.; investigation: T.S.; resources, E.M.L.; data curation, T.S.; writing—original draft, T.S.; writing—review and editing, E.M.L.; visualization, T.S.; supervision, E.M.L.; project administration, E.M.L. All authors have read and agreed to the published version of the manuscript.
Funding
This research received no external funding.
Data Availability Statement
All data generated and analyzed during this study are included in this published article.
Acknowledgments
Funding, in the form of a research fellowship provided by the Graduate School of Syracuse University to the first author, is deeply appreciated.
Conflicts of Interest
Taonian Shan is an employee of Creighton Manning Engineering. The authors declare no conflicts of interest.
List of Abbreviations
| ASCE | American Society of Civil Engineers |
| BRB | Buckling Restrained Brace |
| BRBF | Buckling-Restrained-Braced Frame |
| DBE | Design Based Earthquakes |
| EDP | Engineering Demand Parameters |
| ELF | Equivalent Lateral Force |
| FEMA | Federal Emergency Management Agency |
| FFT | Fast Fourier Transform |
| IBC | International Building Code |
| IFFT | Inverse Fast Fourier Transform |
| IO | Immediate Occupancy |
| LS | Life Safety |
| MCE | Maximum Considered Earthquakes |
| MRF | Moment Resisting Frame |
| PSD | Power Spectral Density |
| RSN | Record Sequence Number |
| SEI | Structural Engineering Institute |
| SRSS | Square Root of the Sum of Squares |
Appendix A

Table A1.
Selected ground motion records for site class CD.
| RSN | Event | Year | Station Name | Magnitude | Vs30 (m/s) |
|---|---|---|---|---|---|
| 100 | “Hollister-03” | 1974 | “San Juan Bautista_ 24 Polk St” | 5.14 | 336 |
| 187 | “Imperial Valley-06” | 1979 | “Parachute Test Site” | 6.53 | 347 |
| 280 | “Trinidad” | 1980 | “Rio Dell Overpass-FF” | 7.2 | 312 |
| 292 | “Irpinia_ Italy-01” | 1980 | “Sturno (STN)” | 6.9 | 382 |
| 313 | “Corinth_ Greece” | 1981 | “Corinth” | 6.6 | 361 |
| 725 | “Superstition Hills-02” | 1987 | “Poe Road (temp)” | 6.54 | 317 |
| 832 | “Landers” | 1992 | “Amboy” | 7.28 | 383 |
| 1119 | “Kobe_ Japan” | 1995 | “Takarazuka” | 6.9 | 312 |
| 1762 | “Hector Mine” | 1999 | “Amboy” | 7.13 | 383 |
| 2093 | “Nenana Mountain_ Alaska” | 2002 | “TAPS Pump Station #09” | 6.7 | 383 |
| 5865 | “El Mayor-Cucapah_ Mexico” | 2010 | “Palm Springs Airport” | 7.2 | 312 |
| 6911 | “Darfield_ New Zealand” | 2010 | “HORC” | 7 | 326 |
Table A2.
Selected ground motion records for site class DE.
| RSN | Event | Year | Station Name | Magnitude | Vs30 (m/s) |
|---|---|---|---|---|---|
| 26 | “Hollister-01” | 1961 | “Hollister City Hall” | 5.6 | 198.8 |
| 35 | “Northern Calif-06” | 1967 | “Hollister City Hall” | 5.2 | 198.8 |
| 163 | “Imperial Valley-06” | 1979 | “Calipatria Fire Station” | 6.53 | 206 |
| 314 | “Westmorland” | 1981 | “Brawley Airport” | 5.9 | 209 |
| 462 | “Morgan Hill” | 1984 | “Hollister City Hall” | 6.19 | 198.8 |
| 718 | “Superstition Hills-01” | 1987 | “Imperial Valley Wildlife” | 6.22 | 179.0 |
| 1931 | “Anza-02” | 2001 | “El Centro Array #10” | 4.92 | 203 |
| 1992 | “Gulf of California” | 2001 | “Calipatria Fire Station” | 5.7 | 206 |
| 4100 | “Parkfield-02_ CA” | 2004 | “Parkfield-Cholame 2WA” | 6 | 173.0 |
| 4462 | “L’Aquila_ Italy” | 2009 | “Avezzano” | 6.3 | 199.0 |
| 180 | “Imperial Valley-06” | 1979 | “El Centro Array #5” | 6.53 | 206 |
| 726 | “Superstition Hills-02” | 1987 | “Salton Sea Wildlife Refuge” | 6.54 | 191.1 |
Table A3.
BRB design of the three-story frame in Los Angeles for IO.
| Story | ||||||||
|---|---|---|---|---|---|---|---|---|
| 3 | 0.941 | 0.261 | 5101 | 5075 | 0.557 | 2121 | 416 | 616 |
| 2 | 0.952 | 0.264 | 4694 | 4724 | 0.312 | 1189 | 647 | 960 |
| 1 | 0.946 | 0.263 | 4694 | 4694 | 0.1305 | 497 | 505 | 750 |
Table A4.
BRB design of the three-story frame in Los Angeles for LS.
| Story | ||||||||
|---|---|---|---|---|---|---|---|---|
| 3 | 1.422 | 0.395 | 5101 | 5089 | 0.558 | 3205 | 857 | 337 |
| 2 | 1.435 | 0.398 | 4694 | 4723 | 0.312 | 1792 | 1331 | 523 |
| 1 | 1.426 | 0.396 | 4694 | 4694 | 0.1303 | 749 | 908 | 357 |
Table A5.
BRB design of the three-story frame in Charleston for IO.
| Story | ||||||||
|---|---|---|---|---|---|---|---|---|
| 3 | 0.435 | 0.1207 | 5101 | 4223 | 0.513 | 1017 | 96.7 | 143 |
| 2 | 0.523 | 0.1453 | 4694 | 4678 | 0.342 | 679 | 169.1 | 251 |
| 1 | 0.525 | 0.1458 | 4694 | 4694 | 0.1445 | 286 | 136.8 | 203 |
Table A6.
BRB design of the three-story frame in Charleston for LS.
| Story | ||||||||
|---|---|---|---|---|---|---|---|---|
| 3 | 0.625 | 0.1735 | 5101 | 4380 | 0.521 | 1452 | 127.5 | 50 |
| 2 | 0.732 | 0.2033 | 4694 | 4722 | 0.338 | 943 | 223 | 88 |
| 1 | 0.728 | 0.2021 | 4694 | 4694 | 0.1413 | 394 | 162.5 | 64 |
Table A7.
BRB design of the nine-story frame in Los Angeles for IO.
| Story | ||||||||
|---|---|---|---|---|---|---|---|---|
| 9 | 0.433 | 0.1202 | 5248 | 5247 | 0.273 | 1482 | 222 | 330 |
| 8 | 0.456 | 0.1265 | 4856 | 5108 | 0.215 | 1168 | 502 | 744 |
| 7 | 0.453 | 0.1257 | 4856 | 5077 | 0.1681 | 914 | 621 | 921 |
| 6 | 0.450 | 0.1249 | 4856 | 5043 | 0.1271 | 691 | 631 | 936 |
| 5 | 0.446 | 0.1240 | 4856 | 5007 | 0.0916 | 498 | 763 | 1131 |
| 4 | 0.443 | 0.1231 | 4856 | 4968 | 0.0618 | 336 | 792 | 1174 |
| 3 | 0.439 | 0.1220 | 4856 | 4924 | 0.0376 | 205 | 801 | 1187 |
| 2 | 0.435 | 0.1208 | 4856 | 4875 | 0.01930 | 104.9 | 770 | 1143 |
| 1 | 0.433 | 0.1203 | 4954 | 4954 | 0.00707 | 38.4 | 1138 | 1440 |
Table A8.
BRB design of the nine-story frame in Los Angeles for LS.
| Story | ||||||||
|---|---|---|---|---|---|---|---|---|
| 9 | 0.690 | 0.1918 | 5248 | 5245 | 0.275 | 2368 | 483 | 190 |
| 8 | 0.717 | 0.1991 | 4856 | 5039 | 0.213 | 1840 | 1146 | 450 |
| 7 | 0.714 | 0.1982 | 4856 | 5016 | 0.1674 | 1443 | 1387 | 545 |
| 6 | 0.710 | 0.1973 | 4856 | 4993 | 0.1267 | 1093 | 1342 | 527 |
| 5 | 0.707 | 0.1963 | 4856 | 4967 | 0.0915 | 789 | 1665 | 654 |
| 4 | 0.703 | 0.1952 | 4856 | 4939 | 0.0619 | 533 | 1712 | 672 |
| 3 | 0.698 | 0.1939 | 4856 | 4907 | 0.0378 | 326 | 1716 | 674 |
| 2 | 0.693 | 0.1925 | 4856 | 4871 | 0.01943 | 167.5 | 1617 | 635 |
| 1 | 0.691 | 0.1919 | 4954 | 4954 | 0.00712 | 61.4 | 2437 | 816 |
Table A9.
BRB design of the nine-story frame in Charleston for IO.
| Story | ||||||||
|---|---|---|---|---|---|---|---|---|
| 9 | 0.252 | 0.0699 | 5248 | 3879 | 0.205 | 875 | 81.1 | 120 |
| 8 | 0.403 | 0.1119 | 4856 | 5744 | 0.245 | 1049 | 262 | 389 |
| 7 | 0.392 | 0.1088 | 4856 | 5583 | 0.1879 | 803 | 362 | 537 |
| 6 | 0.380 | 0.1054 | 4856 | 5411 | 0.1385 | 592 | 384 | 569 |
| 5 | 0.366 | 0.1018 | 4856 | 5224 | 0.0971 | 415 | 470 | 698 |
| 4 | 0.352 | 0.0978 | 4856 | 5019 | 0.0634 | 271 | 490 | 727 |
| 3 | 0.336 | 0.0934 | 4856 | 4794 | 0.0372 | 159.1 | 495 | 734 |
| 2 | 0.319 | 0.0886 | 4856 | 4546 | 0.01829 | 78.1 | 475 | 705 |
| 1 | 0.341 | 0.0946 | 4954 | 4954 | 0.00718 | 30.7 | 702 | 889 |
Table A10.
BRB design of the nine-story frame in Charleston for LS.
| Story | ||||||||
|---|---|---|---|---|---|---|---|---|
| 9 | 0.354 | 0.0984 | 5248 | 4022 | 0.214 | 1233 | 100.9 | 40 |
| 8 | 0.531 | 0.1474 | 4856 | 5576 | 0.240 | 1382 | 366 | 144 |
| 7 | 0.518 | 0.1440 | 4856 | 5447 | 0.1849 | 1064 | 485 | 191 |
| 6 | 0.505 | 0.1403 | 4856 | 5307 | 0.1370 | 788 | 483 | 190 |
| 5 | 0.490 | 0.1362 | 4856 | 5155 | 0.0966 | 556 | 613 | 241 |
| 4 | 0.474 | 0.1318 | 4856 | 4987 | 0.0635 | 366 | 631 | 248 |
| 3 | 0.456 | 0.1268 | 4856 | 4798 | 0.0376 | 216 | 631 | 248 |
| 2 | 0.436 | 0.1212 | 4856 | 4585 | 0.01860 | 107.0 | 591 | 232 |
| 1 | 0.462 | 0.1283 | 4954 | 4954 | 0.00724 | 41.7 | 895 | 300 |
References
- ASCE/SEI 7-22; Minimum Design Loads and Associated Criteria for Buildings and Other Structures. American Society of Civil Engineers: Reston, VA, USA, 2022. Available online: https://ascelibrary.org/doi/book/10.1061/9780784415788 (accessed on 1 July 2023).
- Fan, W.; McGuire, J.J.; de Groot-Hedlin, C.D.; Hedlin, M.A.H.; Coats, S.; Fiedler, J.W. Stormquakes. Geophys. Res. Lett. 2019, 46, 12909–12918. [Google Scholar] [CrossRef]
- Duthinh, D.; Simiu, E. Safety of structures in strong winds and earthquakes: Multihazard considerations. J. Struct. Eng. 2010, 136, 330–333. [Google Scholar] [CrossRef]
- Crosti, C.; Duthinh, D.; Simiu, E. Risk consistency and synergy in multihazard design. J. Struct. Eng. 2011, 137, 844–849. [Google Scholar] [CrossRef]
- Aly, A.M. Design of buildings for wind and earthquake. In Proceedings of the 2014 World Congress on Advances in Civil, Environmental, and Materials Research, ACEM14, Busan, Republic of Korea, 24–28 August 2014. [Google Scholar]
- Aly, A.M.; Abburu, S. On the design of high-rise buildings for multihazard: Fundamental differences between wind and earthquake demand. Shock. Vib. 2015, 2015, 148681. [Google Scholar] [CrossRef]
- Thilakarathna, S.N.; Anwar, N.; Norachan, P.; Naja, F.A. The effect of wind loads on the seismic performance of tall buildings. Athens J. Technol. Eng. 2018, 5, 251–276. [Google Scholar] [CrossRef]
- Mazza, F.; Vulcano, A. Control of the earthquake and wind dynamic response of steel-framed buildings by using additional braces and/or viscoelastic dampers. Earthq. Eng. Struct. Dyn. 2011, 40, 155–174. [Google Scholar] [CrossRef]
- Kwag, S.; Gupta, A.; Baugh, J.; Kim, H.-S. Significance of multi-hazard risk in design of buildings under earthquake and wind loads. Eng. Struct. 2021, 243, 112623. [Google Scholar] [CrossRef]
- Roy, T.; Saito, T.; Matsagar, V. Multihazard framework for investigating high-rise base-isolated buildings under earthquakes and long-duration winds. Earthq. Eng. Struct. Dyn. 2010, 50, 1334–1357. [Google Scholar] [CrossRef]
- FEMA 356; Prestandard and Commentary for the Seismic Rehabilitation of Buildings. Federal Emergency Management Agency: Washington, DC, USA, 2010.
- Fujimoto, M.; Wada, A.; Saeki, E.; Watanabe, A.; Hitomi, Y. A study on the unbonded brace encased in buckling-restraining concrete and steel tubes. J. Struct. Constr. Eng. 1988, 34B, 249–258. (In Japanese) [Google Scholar]
- Fujimoto, M.; Wada, A.; Saeki, E.; Watanabe, A.; Hitomi, Y. A study on brace enclosed in buckling-restrained mortar and steel Tubes (Part 1). In Annual Research Meeting Architectural Institute of Japan; Architectural Institute of Japan: Tokyo, Japan, 1988. (In Japanese) [Google Scholar]
- Fujimoto, M.; Wada, A.; Saeki, E.; Watanabe, A.; Hitomi, Y. A study on brace enclosed in buckling-restrained mortar and steel tubes (Part 2). In Annual Research Meeting Architectural Institute of Japan; Architectural Institute of Japan: Tokyo, Japan, 1988. (In Japanese) [Google Scholar]
- Zhou, Y.; Shao, H.; Cao, Y.; Lui, E.M. Application of buckling-restrained braces to earthquake-resistant design of buildings: A review. Eng. Struct. 2021, 246, 112991. [Google Scholar] [CrossRef]
- International Building Code; International Code Council: Washington DC, USA, 2024.
- Holmes, J.D.; Bekele, S. Wind Loading of Structures, 4th ed.; CRC Press: Boca Raton, FL, USA, 2021. [Google Scholar] [CrossRef]
- Kubo, Y. Structure Configuration Based on Wind Engineering, 2nd ed.; Chapter 13, Handbook of Structural Engineering; Chen, W.F., Lui, E.M., Eds.; CRC Press: Boca Raton, FL, USA, 2005. [Google Scholar]
- Martinez-Vazquez, P. Wind design spectra for generalisation. Wind. Struct. 2020, 30, 155–163. [Google Scholar] [CrossRef]
- Von Kármán, T. Progress in the statistical theory of turbulence. Proc. Natl. Acad. Sci. USA 1948, 34, 530–539. [Google Scholar] [CrossRef] [PubMed]
- Davenport, A.G. The spectrum of horizontal gustiness near the ground in high winds. J. R. Meteorol. Soc. 1961, 87, 194–211. [Google Scholar] [CrossRef]
- Harris, R.I. The nature of the wind. In The Modern Design of Wind-Sensitive Structures; Construction Industry Research and Information Association: Chicago, IL, USA, 1971. [Google Scholar]
- Hino, M. Spectrum of gusty wind. In Proceedings of the Third International Conference on Wind Effects on Buildings and Structures, Tokyo, Japan, 26–28 February 1971; pp. 69–77. [Google Scholar]
- Kaimal, J.C.; Wyngaard, J.C.; Izumi, Y.; Coté, O.R. Spectral characteristics of surface-layer turbulence. J. R. Meteorol. Soc. 1972, 98, 563–589. [Google Scholar] [CrossRef]
- Simiu, E. Wind spectra and dynamic alongwind response. J. Struct. Div. 1974, 100, 1897–1910. [Google Scholar] [CrossRef]
- Safak, E.; Foutch, D.A. Vibration of Buildings under Random Wind Loads; Civil Engineering Studies SRS-480; University of Illinois: Urbana-Champaign, IL, USA, 1980; Available online: http://hdl.handle.net/2142/14087 (accessed on 1 July 2023).
- Solari, G. Wind response spectrum. J. Eng. Mech. 1989, 115, 2057–2073. [Google Scholar] [CrossRef]
- Jang, J.-J.; Lee, Y.-L. A study of along wind speed power spectrum for Taiwan area. J. Mar. Sci. Technol. 1998, 6, 2522. [Google Scholar] [CrossRef]
- Mihanović, A.; Nikolić, Ž.; Smoljanović, H. Response spectrum of the Jugo wind force. Int. J. Eng. Model. 2008, 1, 33–41. [Google Scholar]
- Kaimal, J.C.; Finnigan, J.J. Spectra and Cospectra Over Flat Uniform Terrain. In Atmospheric Boundary Layer Flows; Oxford University Press: Oxford, UK, 1994. [Google Scholar] [CrossRef]
- SAC. SAC Steel Project Memorandum. 1994. Available online: https://www.sacsteel.org (accessed on 1 July 2023).
- Menegotto, M.; Pinto, P.E. Method of Analysis of Cyclically Loaded RC Plane Frames including Changes in Geometry and Non-Elastic Behavior of Elements under Normal Force and Bending; Preliminary Report IABSE; IABSE: Manchester, UK, 1973; Volume 13. [Google Scholar]
- Filippou, F.C.; Popov, E.P.; Bertero, V.V. Effects of Bond Deterioration on Hysteretic Behavior of Reinforced Concrete Joints; Report EERC 83-19; Earthquake Engineering Research Center, University of California: Berkeley, CA, USA, 1983. [Google Scholar]
- Zsarnóczay, A.; Baker, J.W. Using model error in response history analysis to evaluate component calibration methods. Earthq. Eng. Struct. Dyn. 2020, 49, 175–193. [Google Scholar] [CrossRef]
- Upadhyay, A.; Pantelides, C.P.; Ibarra, L. Residual drift mitigation for bridges retrofitted with buckling restrained braces or self centering energy dissipation devices. Eng. Struct. 2019, 199, 109663. [Google Scholar] [CrossRef]
- Xu, W.; Pantelides, C.P. Strong-axis and weak-axis buckling and local bulging of buckling-restrained braces with prismatic core plates. Eng. Struct. 2017, 153, 279–289. [Google Scholar] [CrossRef]
- ANSI/AISC 341-22; Seismic Provisions for Structural Steel Buildings. American Institute of Steel Construction: Chicago, IL, USA, 2022.
- Kersting, R.A.; Fahnestock, L.A.; Lopez, W.A. Seismic Design of Steel Buckling-Restrained Braced Frames: A Guide for Practicing Engineers; National Institute of Standards and Technology: Gaithersburg, MD, USA, 2015; p. NIST GCR 15-917-34. [Google Scholar] [CrossRef]
Figure 1.
Procedure of generating the dual earthquake–wind hazard power spectrum and time domain excitation function.
Figure 1.
Procedure of generating the dual earthquake–wind hazard power spectrum and time domain excitation function.

Figure 2.
Target spectra (5% damping).

Figure 3.
(a) Power spectrum of a scaled earthquake (RSN 725), (b) power spectrum for wind with 41 m/s basic wind speed, (c) dual earthquake–wind power spectrum and (d) dual earthquake–wind excitations for the performance level of IO in Los Angeles.
Figure 3.
(a) Power spectrum of a scaled earthquake (RSN 725), (b) power spectrum for wind with 41 m/s basic wind speed, (c) dual earthquake–wind power spectrum and (d) dual earthquake–wind excitations for the performance level of IO in Los Angeles.

Figure 4.
Story-based time-history excitations and seismic lumped masses used for the three-story MRF.
Figure 4.
Story-based time-history excitations and seismic lumped masses used for the three-story MRF.

Figure 5.
Peak and residual inter-story and roof drift ratios of the three-story MRF in Los Angeles, analyzed for IO.
Figure 5.
Peak and residual inter-story and roof drift ratios of the three-story MRF in Los Angeles, analyzed for IO.

Figure 6.
Peak and residual inter-story and roof drift ratios of the three-story MRF in Los Angeles, analyzed for LS.
Figure 6.
Peak and residual inter-story and roof drift ratios of the three-story MRF in Los Angeles, analyzed for LS.

Figure 7.
Hysteresis curves of a third story beam for the three-story frame in Los Angeles under the performance level of (a) IO and (b) LS.
Figure 7.
Hysteresis curves of a third story beam for the three-story frame in Los Angeles under the performance level of (a) IO and (b) LS.

Figure 8.
Peak and residual inter-story and roof drift ratios of the three-story MRF in Charleston, as analyzed for IO.
Figure 8.
Peak and residual inter-story and roof drift ratios of the three-story MRF in Charleston, as analyzed for IO.

Figure 9.
Peak and residual inter-story and roof drift ratios of the three-story MRF in Charleston, as analyzed for LS.
Figure 9.
Peak and residual inter-story and roof drift ratios of the three-story MRF in Charleston, as analyzed for LS.

Figure 10.
Hysteresis curves of a third-story beam for the three-story frame in Charleston under the performance level of (a) IO and (b) LS.
Figure 10.
Hysteresis curves of a third-story beam for the three-story frame in Charleston under the performance level of (a) IO and (b) LS.

Figure 11.
Peak and residual inter-story roof drift ratios of the nine-story MRF in Los Angeles, as analyzed for IO.
Figure 11.
Peak and residual inter-story roof drift ratios of the nine-story MRF in Los Angeles, as analyzed for IO.

Figure 12.
Hysteresis curves of a second-story beam for the nine-story frame in Los Angeles under the performance level of IO.
Figure 12.
Hysteresis curves of a second-story beam for the nine-story frame in Los Angeles under the performance level of IO.

Figure 13.
Validation of the OpenSees model.

Figure 14.
Force–displacement relationship of a chevron and a diagonal BRB under one cycle of loading and unloading.
Figure 14.
Force–displacement relationship of a chevron and a diagonal BRB under one cycle of loading and unloading.

Figure 15.
Force–displacement relationships of an inelastic frame and the corresponding elastic frame: (a) energy demand based on maximum drift limit, and (b) energy demand based on residual drift limit.
Figure 15.
Force–displacement relationships of an inelastic frame and the corresponding elastic frame: (a) energy demand based on maximum drift limit, and (b) energy demand based on residual drift limit.

Figure 16.
Placement of BRBs for the three-story BRBF: (a) one-bay BRBF and (b) two-bay BRBF.

Figure 17.
Peak and residual inter-story and roof drift ratios of the three-story BRBF in Los Angeles.
Figure 17.
Peak and residual inter-story and roof drift ratios of the three-story BRBF in Los Angeles.

Figure 18.
Peak and residual inter-story and roof drift ratios of the three-story BRBF in Charleston.
Figure 18.
Peak and residual inter-story and roof drift ratios of the three-story BRBF in Charleston.


Figure 19.
Placement of BRBs for the nine-story BRBF: (a) two-bay BRBF, (b) three-bay BRBF and (c) four-bay BRBF.
Figure 19.
Placement of BRBs for the nine-story BRBF: (a) two-bay BRBF, (b) three-bay BRBF and (c) four-bay BRBF.

Figure 20.
Peak and residual inter-story and roof drift ratios of the nine-story BRBF in Los Angeles.
Figure 20.
Peak and residual inter-story and roof drift ratios of the nine-story BRBF in Los Angeles.

Figure 21.
Peak and residual inter-story roof drift ratios of the nine-story BRBF in Charleston.


Table 1.
Drift limits for IO and LS [11].
Table 1.
Drift limits for IO and LS [11].
| Steel Frame Type | Immediate Occupancy (IO) | Life Safety (LS) | ||
|---|---|---|---|---|
| Peak Drift | Residual Drift | Peak Drift | Residual Drift | |
| Moment frames | 0.7% | Negligible | 2.5% | 1% |
| Braced frames | 0.5% | Negligible | 1.5% | 0.5% |
Table 2.
Basic wind speed (in m/s) at 10 m above ground.
| Los Angeles | Charleston | |
|---|---|---|
| Immediate Occupancy (IO) | 41 | 62 |
| Life Safety (LS) | 46 | 72 |
Table 3.
Parameters used for Steel4 material to model BRB in the OpenSees model.
| Parameters | Tension | Compression |
|---|---|---|
| Initial (elastic) stiffness of BRB, | ||
| Stiffness modification factor, | 1.39 | 1.39 |
| Elastic modulus of steel, | 200 GPa | 200 GPa |
| Yield strength of BRB steel core, | ||
| Material overstrength factor, | 1.11 | 1.11 |
| Yield strength of steel, | 248 MPa | 248 MPa |
| Kinematic hardening ratio, | 0.5% | 2.5% |
| Shape parameter *, | 26 | 26 |
| Shape parameter *, | 0.91 | 0.89 |
| Shape parameter *, | 0.10 | 0.02 |
| Initial hardening ratio for isotropic materials, | 0.25% | 0.6% |
| Saturated hardening ratio for isotropic materials, | 0.01% | 0.03% |
| Intersection point between and , | 0.8 | 0.3 |
| Isotropic transition parameter, | 3.0 | 3.0 |
| Length of the yield plateau, | 1.0 | 1.0 |
| Ultimate strength of BRB steel core, | ||
| Kinematic hardening to perfectly plastic transition parameter, | 2.0 | 2.0 |
* These are parameters to control the exponential transition from linear to kinematic hardening asymptote.
Table 4.
Final design of the three-story BRBF.
| Model | Configuration | |
|---|---|---|
| Los Angeles for IO | 387 | 2-bay |
| Los Angeles for LS | 206 | 2-bay |
| Charleston for IO | 206 | 1-bay |
| Charleston for LS | 71 | 1-bay |
Table 5.
Final design of the nine-story BRBF.
| Model | Configuration | ||||
|---|---|---|---|---|---|
| Story | 1st | 2nd–5th | 6th–8th | 9th | |
| Los Angeles for IO | 84 | 219 | 310 | 361 | 4-bay |
| Los Angeles for LS | 65 | 181 | 232 | 284 | 3-bay |
| Charleston for IO | 42 | 168 | 245 | 310 | 3-bay |
| Charleston for LS | 21 | 90 | 123 | 155 | 2-bay |
Table 6.
Comparison of drift ratios for single and dual hazards for the three-story frame without BRBs.
Table 6.
Comparison of drift ratios for single and dual hazards for the three-story frame without BRBs.
| City | Performance Level | Hazard | Peak Inter-Story | Residual Inter-Story | Peak Roof | Residual Roof |
|---|---|---|---|---|---|---|
| Los Angeles | IO | Earthquake | 3.25% | 1.06% | 2.47% | 0.92% |
| Wind | 0.36% | ≈0% | 0.31% | ≈0% | ||
| Dual | 4.10% | 2.24% | 3.46% | 2.08% | ||
| LS | Earthquake | 6.80% | 4.52% | 5.94% | 4.32% | |
| Wind | 0.47% | ≈0% | 0.40% | ≈0% | ||
| Dual | 11.63% | 10.40% | 10.99% | 10.08% | ||
| Charleston | IO | Earthquake | 1.14% | 0.083% | 0.96% | 0.06% |
| Wind | 0.93% | 0.11% | 0.78% | 0.09% | ||
| Dual | 1.93% | 0.93% | 1.65% | 0.75% | ||
| LS | Earthquake | 1.75% | 0.32% | 1.39% | 0.24% | |
| Wind | 1.35% | 0.42% | 1.14% | 0.36% | ||
| Dual | 3.57% | 2.62% | 3.27% | 2.42% |
Table 7.
Comparison of drift ratios for single and dual hazards for the nine-story frame without BRBs.
Table 7.
Comparison of drift ratios for single and dual hazards for the nine-story frame without BRBs.
| City | Performance Level | Hazard | Peak Inter-Story | Residual Inter-Story | Peak Roof | Residual Roof |
|---|---|---|---|---|---|---|
| Los Angeles | IO | Earthquake | 2.52% | 1.00% | 1.82% | 0.74% |
| Wind | 0.77% | ≈0% | 0.61% | ≈0% | ||
| Dual | 10.4% | 9.83% | 6.72% | 6.19% | ||
| LS | Earthquake | 4.36% | 2.83% | 3.20% | 2.19% | |
| Wind | 1.08% | 0.35% | 0.78% | 0.14% | ||
| Dual | C * | C * | C * | C * | ||
| Charleston | IO | Earthquake | 1.30% | 0.16% | 0.84% | 0.08% |
| Wind | 9.40% | 8.70% | 4.92% | 4.38% | ||
| Dual | C * | C * | C * | C * | ||
| LS | Earthquake | 1.71% | 0.41% | 1.18% | 0.26% | |
| Wind | C * | C * | C * | C * | ||
| Dual | C * | C * | C * | C * |
* The letter C denotes convergence problems due to excessive frame deflections.
Table 8.
Comparison of drift ratios before and after the addition of BRBs for the three-story frame.
Table 8.
Comparison of drift ratios before and after the addition of BRBs for the three-story frame.
| City | Performance Level | Frame Type | Peak Inter-Story | Residual Inter-Story | Peak Roof | Residual Roof |
|---|---|---|---|---|---|---|
| Los Angeles | IO | MRF | 4.10% | 2.24% | 3.46% | 2.08% |
| BRBF | 0.27% | 0.01% | 0.27% | 0.01% | ||
| LS | MRF | 11.65% | 10.40% | 10.99% | 10.08% | |
| BRBF | 0.80% | 0.14% | 0.52% | 0.06% | ||
| Charleston | IO | MRF | 1.93% | 0.93% | 1.65% | 0.75% |
| BRBF | 0.27% | ≈0% | 0.25% | ≈0% | ||
| LS | MRF | 3.57% | 2.62% | 3.27% | 2.42% | |
| BRBF | 0.86% | 0.20% | 0.66% | 0.14% |
Table 9.
Comparison of drift ratios before and after the addition of BRBs for the nine-story frame.
| City | Performance Level | Frame Type | Peak Inter-Story | Residual Inter-Story | Peak Roof | Residual Roof |
|---|---|---|---|---|---|---|
| Los Angeles | IO | MRF | 10.40% | 9.83% | 6.72% | 6.19% |
| BRBF | 0.64% | 0.05% | 0.56% | 0.05% | ||
| LS | MRF | C * | C * | C * | C * | |
| BRBF | 1.33% | 0.50% | 0.80% | 0.21% | ||
| Charleston | IO | MRF | C * | C * | C * | C * |
| BRBF | 0.30% | ≈0% | 0.26% | ≈0% | ||
| LS | MRF | C * | C * | C * | C * | |
| BRBF | 1.41% | 0.76% | 0.89% | 0.33% |
* The letter C denotes convergence problems due to excessive frame deflections.
Disclaimer/Publisher’s Note: The statements, opinions and data contained in all publications are solely those of the individual author(s) and contributor(s) and not of MDPI and/or the editor(s). MDPI and/or the editor(s) disclaim responsibility for any injury to people or property resulting from any ideas, methods, instructions or products referred to in the content. |
© 2024 by the authors. Licensee MDPI, Basel, Switzerland. This article is an open access article distributed under the terms and conditions of the Creative Commons Attribution (CC BY) license (https://creativecommons.org/licenses/by/4.0/).
Share and Cite
MDPI and ACS Style
Shan, T.; Lui, E.M. Energy-Based Design of Buckling-Restrained Steel Braced Frames for Concurrent Occurrences of Earthquake and Wind. CivilEng 2024, 5, 343-377. https://doi.org/10.3390/civileng5020018
AMA Style
Shan T, Lui EM. Energy-Based Design of Buckling-Restrained Steel Braced Frames for Concurrent Occurrences of Earthquake and Wind. CivilEng. 2024; 5(2):343-377. https://doi.org/10.3390/civileng5020018
Chicago/Turabian StyleShan, Taonian, and Eric M. Lui. 2024. "Energy-Based Design of Buckling-Restrained Steel Braced Frames for Concurrent Occurrences of Earthquake and Wind" CivilEng 5, no. 2: 343-377. https://doi.org/10.3390/civileng5020018