1. Introduction
The management of critical infrastructures, including railroads, dams, bridges, airfields, ranges, and inland navigation facilities, poses ongoing challenges for the US Army. As an essential component of the Department of Defense (DoD), the military is responsible for maintaining over 1500 miles of railroad tracks across the US and abroad. These tracks operated by the US Army have unique maintenance and management requirements due to factors such as lower speeds, specialized DoD cargoes, and frequent use. Consequently, regular monitoring and inspection of military tracks are necessary to ensure the safe transportation of DoD freight [
1].
The trackbed, composed of railroad ties and track ballast, plays a crucial role in maintaining railroad infrastructure. Railroad ties distribute loads to the track ballast and subgrade. While traditional railroad ties are constructed from wood, materials like prestressed concrete, steel, and plastic composites are also employed [
2]. Track ballast refers to uniformly graded coarse aggregate packed between, below, and around the crossties. The primary functions of ballast are to provide structural support for train loads and facilitate water drainage to prevent vegetation interference. Repetitive dynamic loading, vibrations, temperature fluctuations, and water presence lead to ballast deterioration. As ballast deteriorates, it gradually accumulates finer materials that fill the void spaces, a process known as fouling [
3]. Fouling occurs due to ballast aggregate breakage, coal dust spillage from moving trains, and the migration of subgrade particles. As the level of fouling increases in the ballast and sub-ballast layers, greater amounts of water are retained, leading to track instability caused by excessive pore water pressure [
4].
Manual GPR data interpretation has drawbacks and limitations that can impact its accuracy and efficiency. It is subjective and dependent on the interpreter’s expertise, leading to variations in results. Human errors, such as misidentifications and oversight, can occur. Manual interpretation is time-consuming, especially for large datasets, and may result in selective coverage, which misses important information. Additionally, a lack of standardization makes comparing studies difficult. Ultimately, manual interpretation may not provide precise quantitative measurements and can be costly due to the need for skilled personnel [
5].
This research introduces the “Non-Destructive Test Pro” (NDTPro) tool, designed to automate the reading and interpretation of GPR images to identify ballast fouling to address these limitations. GPR is a widely used method in near-surface geophysics that eliminates the need for excavation or drilling. It detects electrical discontinuities in the shallow subsurface (<50 m) through the generation, transmission, propagation, reflection, and reception of high-frequency electromagnetic pulses [
6]. GPR’s ability to penetrate the subsurface and capture detailed information makes it a powerful tool for understanding subsurface properties [
7]. Utilizing the NDTPro automates the inspection process of analyzing GPR data, improving the efficiency and accuracy of ballast condition assessment.
To summarize, this paper endeavors to address the critical research question, “How can maintenance practices be optimized to guarantee the safe and reliable operation of rail tracks through the identification of ballast fouling issues?” The study sets out with specific objectives to answer this: to surpass the challenges of manual GPR data analysis by implementing automation in the reading and interpretation of GPR images. This research proposed a tool that aims to pinpoint ballast fouling with enhanced precision and efficiency, thereby significantly refining the assessment of ballast conditions.
2. Literature Review
This literature review outlines significant efforts aimed at enhancing the interpretation of GPR data spanning various fields. Several key studies stand out for their contributions to automatic interpretation methods and data processing techniques, which are relevant to the development of the NDTPro tool. The following is a summary of these key studies.
Zhang et al. (2015) stated that inspection of railroad ballast is vital for rail safety, yet advanced technologies like GPR have not been fully adapted for this purpose due to complex scattering properties and data processing challenges. The study introduced an unsupervised method using Hilbert transform and Renyi entropy analysis to detect key areas in the ballast layer to address this. Laboratory and field tests confirmed the effectiveness of this algorithm in efficiently processing GPR data for improved inspection outcomes [
8]. Another study by Liu et al. (2023) stated that GPR detects internal conditions, aiding in the quantitative assessment of pavement structure. The maintenance of semi-rigid base pavement relies on thorough inspection and monitoring. The study corrected modulus discrepancies, demonstrated temperature correlations, and established a strain-loading relationship model (R2 > 0.95). This study addressed the reliability issues and supports performance prediction for asphalt pavement [
9]. A study by Lippitt and Zhang (2018) showed that Unmanned Aerial Systems (UAS), particularly the ones that can hold GPR, have the potential to revolutionize remote sensing. These platforms offer unique capabilities that can impact remote sensing models and communication. While UAS unlocks novel remote sensing possibilities, challenges such as managing increased data volume and regulatory limitations require attention, underscoring the need for focused research priorities [
10].
Manataki et al. (2021) examined the challenges and limitations in the interpretation of GPR data for archaeological prospection. They discussed integrated interpretation approaches using B-scans and C-scans, attribute analysis, fusion techniques, and deep learning (DL) algorithms for automatic interpretation. The authors also presented and discussed the application of Convolutional Neural Networks (CNNs) for classifying GPR data, contributing to the advancement of DL-based automatic interpretation methods [
11].
Another study by Zhou et al. (2018) introduced an automatic model for interpreting GPR B-scan images. The proposed model consisted of several components: a preprocessing method, the open-scan clustering algorithm (OSCA), the parabolic fitting-based judgment (PFJ) method, and the restricted algebraic-distance-based fitting (RADF) algorithm. The PFJ method further validated whether these clusters exhibited hyperbolic characteristics. The OSCA and PFJ methods worked together to classify and segment hyperbolic point clusters. Finally, the validated point clusters were fitted using RADF, which solves fitting problems with constraints related to the hyperbolic central axis. The proposed model could automatically and efficiently extract information from GPR B-scan images by combining these methods. Experimental evaluations using both simulated and real-world datasets demonstrated the effectiveness of the model [
12].
An article by Travassos et al. (2021) provided a review of the application of Artificial Neural Networks (ANNs) and machine learning (ML) techniques in the interpretation of GPR data. The primary objectives of these post-processing methods were the detection, location, and characterization of targets with minimal false alarms. The review highlighted the basic approaches in GPR data interpretation and focused on achieving the first two objectives, i.e., target detection and localization. ANNs and ML methods have played a crucial role in advancing GPR data interpretation by enabling imaging and diagnosis approaches rather than just locating and testing [
13].
Shao et al. (2010) addressed the challenges of processing and interpreting GPR signals. While GPR has found extensive applications, its signal analysis typically requires skilled users. To overcome this limitation, the authors proposed an automatic classification system that utilizes magnitude spectrum amplitudes and support vector machines (SVM) to categorize GPR signals. The system’s successful differentiation of GPR signals from various materials highlighted its potential for improving the processing and interpretation of GPR data [
14].
Another research conducted by Qin et al. (2021) focused on the automatic recognition of tunnel lining elements from GPR images using deep convolutional networks and data augmentation techniques. This research highlighted how manual interpretation of GPR data can be inefficient and prone to recognition errors, specifically with large volumes of data. The study introduced a deep learning-based method that utilized the Mask R-CNN framework, incorporating ResNet101 with FPN for feature extraction, RPN for generating candidate regions, fully connected layers for detecting steel ribs and voids, and an FCN for segmenting the initial lining area. Synthetic GPR images were created using the FDTD method and DCGAN for data augmentation to enhance the network’s recognition performance. Test results indicated the feasibility of the recognition network [
15].
The research conducted by Xie et al. (2013) focused on developing an automatic recognition algorithm for GPR images of voids in reinforced concrete structures. Their work showed how traditional interpretation methods of GPR data, which are labor-intensive and time-consuming, can be improved through automation. The researchers began by creating synthetic GPR images using the Finite-Difference Time-Domain method. However, the presence of multiple waves caused by steel bars posed a challenge in identifying the target echo signals from the forward modeling images. To address this, the researchers utilized the predictive deconvolutional method to suppress these interfering waves, resulting in improved outcomes. Next, the study proposed the use of the SVM algorithm for automatic void recognition in GPR images. The automatic identification process consisted of four steps: collecting training data, extracting features from GPR images, building the SVM model, and automatically identifying the voids. The results demonstrated that the proposed method effectively locates the voids’ cover depths and lateral ranges and how the trained SVM model performs favorably when synthetic GPR images with noise (up to 5%) are used [
16].
Hou et al. (2022) provided a comprehensive review of GPR activities in civil infrastructures, with a specific focus on data analysis and applications. The review began by briefly discussing GPR system data collection and the complexities of signals in both simulated and real scenes. It then examined the main signal processing techniques utilized for GPR data interpretation. The article further categorized the latest GPR surveys based on four application domains: bridges, road pavements, underground utilities, and urban subsurface risks. Finally, the review highlighted open challenges and concluded that more work needs to be done in the area of automatic interpretation of GPR imaging [
17].
Liu et al. (2023) presented a mask region-based convolutional neural network (R-CNN) designed to automatically detect and segment small cracks in asphalt pavement using GPR. The study conducted simulations and field detections to identify crack features in GPR images and to establish the relationship between crack width and area. The results demonstrated high precision, F1 score, mean intersection-over-union (mIoU) values, and impressive processing speed. The research marked significant progress in accurately detecting and characterizing internal vertical cracks in asphalt pavement using non-destructive testing with GPR [
18].
Guo et al. (2022) utilized GPR to differentiate between fatigue cracks and reflective cracks in highway pavement. By analyzing the amplitude variation of diffracted GPR waves, the researchers successfully determined the locations of fatigue cracks and reflective cracks extending to the road surface. The direct ground wave’s amplitude curves offered intuitive indications of crack top locations and allowed for qualitative comparisons of crack widths. Furthermore, the study observed that diffraction hyperbolas exhibited similar shapes and patterns for both types of cracks with bottoms at different locations, but their amplitudes differed significantly. The researchers applied their findings to successfully identify crack locations and corresponding types through field GPR data interpretation on a highway pavement in China. The results demonstrated the effectiveness of their approach in detecting cracks for highway pavement rehabilitation. This research provided valuable insights for targeted treatment measures based on crack type and location, contributing to more efficient and precise maintenance efforts [
19].
In their 2023 study, Liu and Gu proposed a combined approach using accelerated testing, non-destructive testing, and laboratory tests to evaluate pavement performance and conservation measures. They subjected a full-scale asphalt pavement section with semi-rigid bases to one million load cycles using a large mobile load simulator (MLS66). The results showed significant changes in material and structural properties, but GPR inspection showed no abnormal signals in the asphalt surface and base layers. Only areas where the sensor was buried showed arcuate changes in the asphalt conditions. These findings provided valuable insights for timely asphalt pavement maintenance in Jiangsu province and hold relevance for pavement maintenance practices worldwide [
20].
Based on the available literature, it can be inferred that the automatic interpretation of GPR imaging remains an area that is not fully developed, particularly in the context of assessing railroad tracks. The existing research in this field suggests that there is still room for advancements and improvements in automating the interpretation process, specifically for GPR data related to railroad track assessment. To further advance the automatic interpretation of GPR imaging in railroad track assessment, this research focuses on developing a new tool that can effectively extract information related to the fouling index from GPR images.
3. NDTPro Development
A tool with a fully graphical interface is developed to analyze the GPR signal and determine the fouling condition. The flow chart of the tool is shown in
Figure 1.
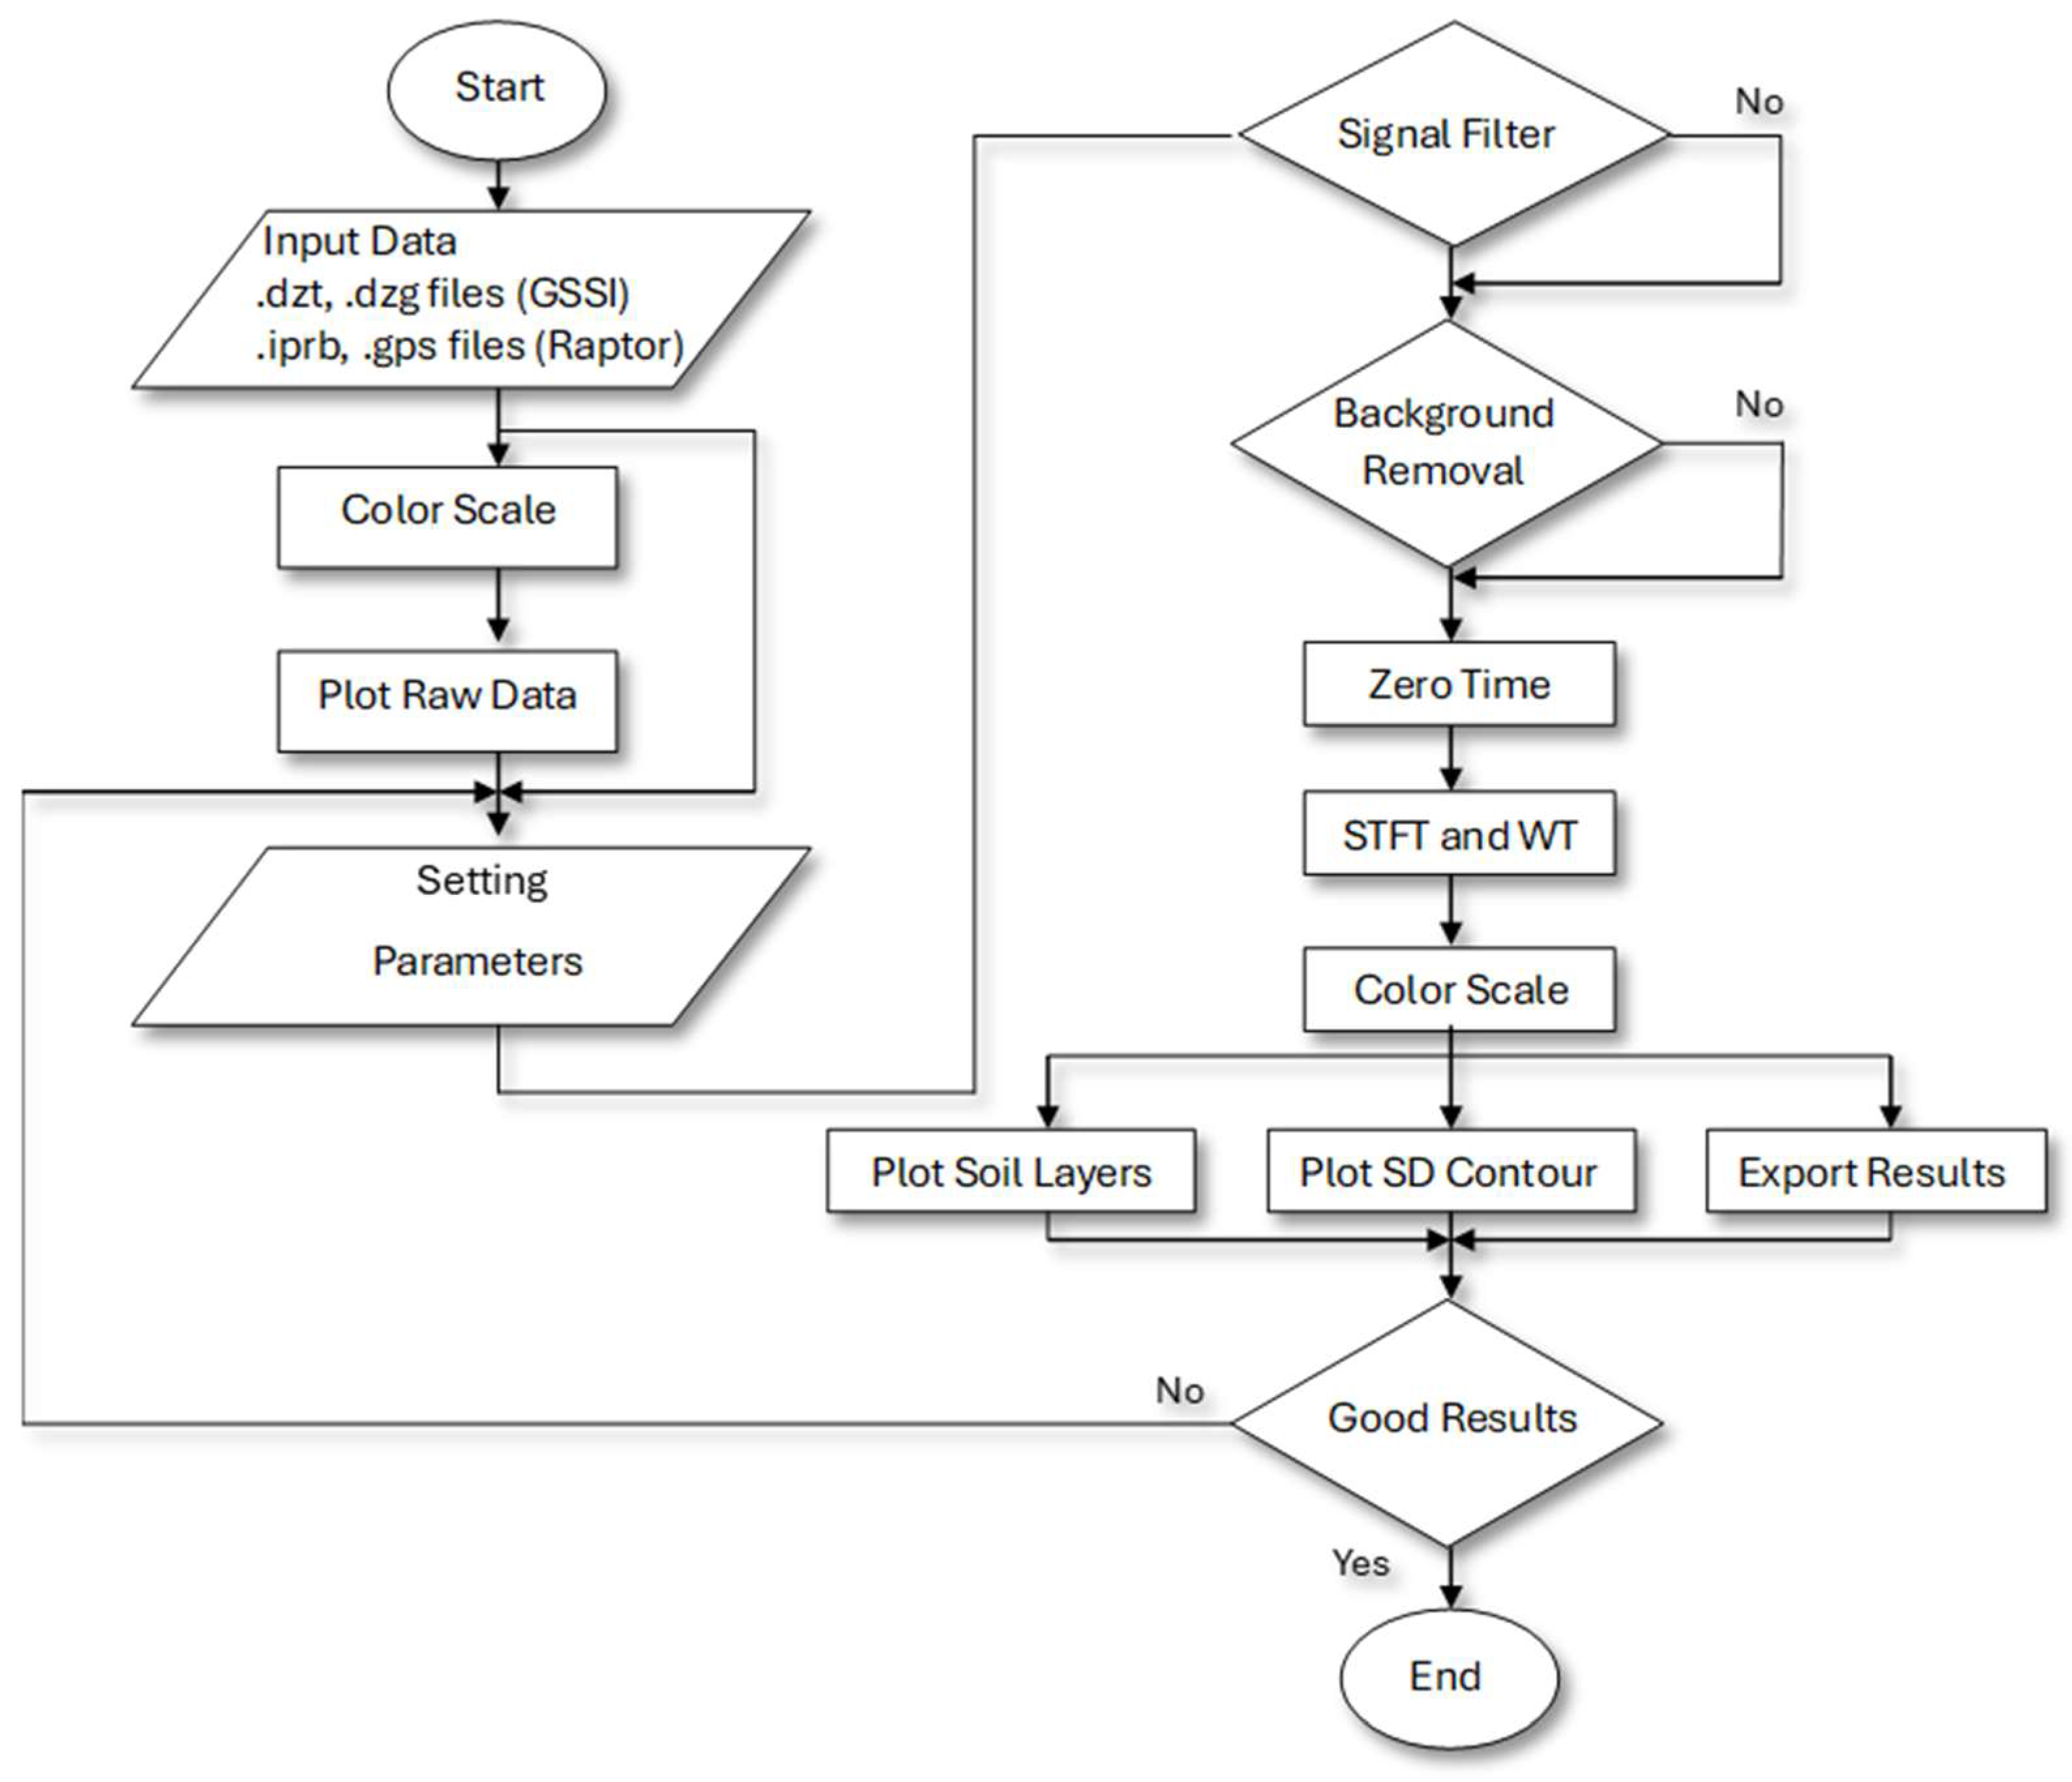
Figure 1 illustrates a flowchart for the NDTPro tool’s operational procedure. The sequence initiates with “Input Data”, which involves the utilization of various file types, such as “.dzt” and “.dzg” files associated with GSSI GPR equipment, alongside “.irpb” and “.gps” files associated with Raptor GPR system. Subsequently, a “Color Scale” is selected or applied to enhance data visualization. Following this, the “Plot Raw Data” step involves the graphical representation of the GPR data, typically as radargrams. Next, “Setting Parameters” entails configuring or choosing parameters pertinent to GPR data analysis. At the “Signal Filter” juncture, a decision is made on whether signal filtering is requisite. If affirmed, “Background Removal” is conducted to eliminate noise or extraneous patterns, thereby clarifying the signal. The process then adjusts the “Zero Time”, which calibrates the point at which the radar signal begins subsurface penetration. Advanced analysis techniques such as “STFT and WT”, referring to Short-Time Fourier Transform and Wavelet Transform, respectively, are employed for in-depth signal examination. Another “Color Scale” assessment is made, possibly to fine-tune it post-data processing. This is followed by “Plot Soil Layers”, where the interpreted stratification of soil, as discerned from radar reflections, is depicted. “Plot SD Contour” is another plotting step, likely illustrating data variability or certainty. The penultimate step is “Export Results”, where the refined and assessed data is prepared for dissemination or additional scrutiny. The process reaches a decision point, “Good Results”, to evaluate the adequacy of outcomes. If the results meet the requisite standards, the procedure concludes with the “End”; otherwise, it implies a potential loop back to an earlier phase for further adjustment.
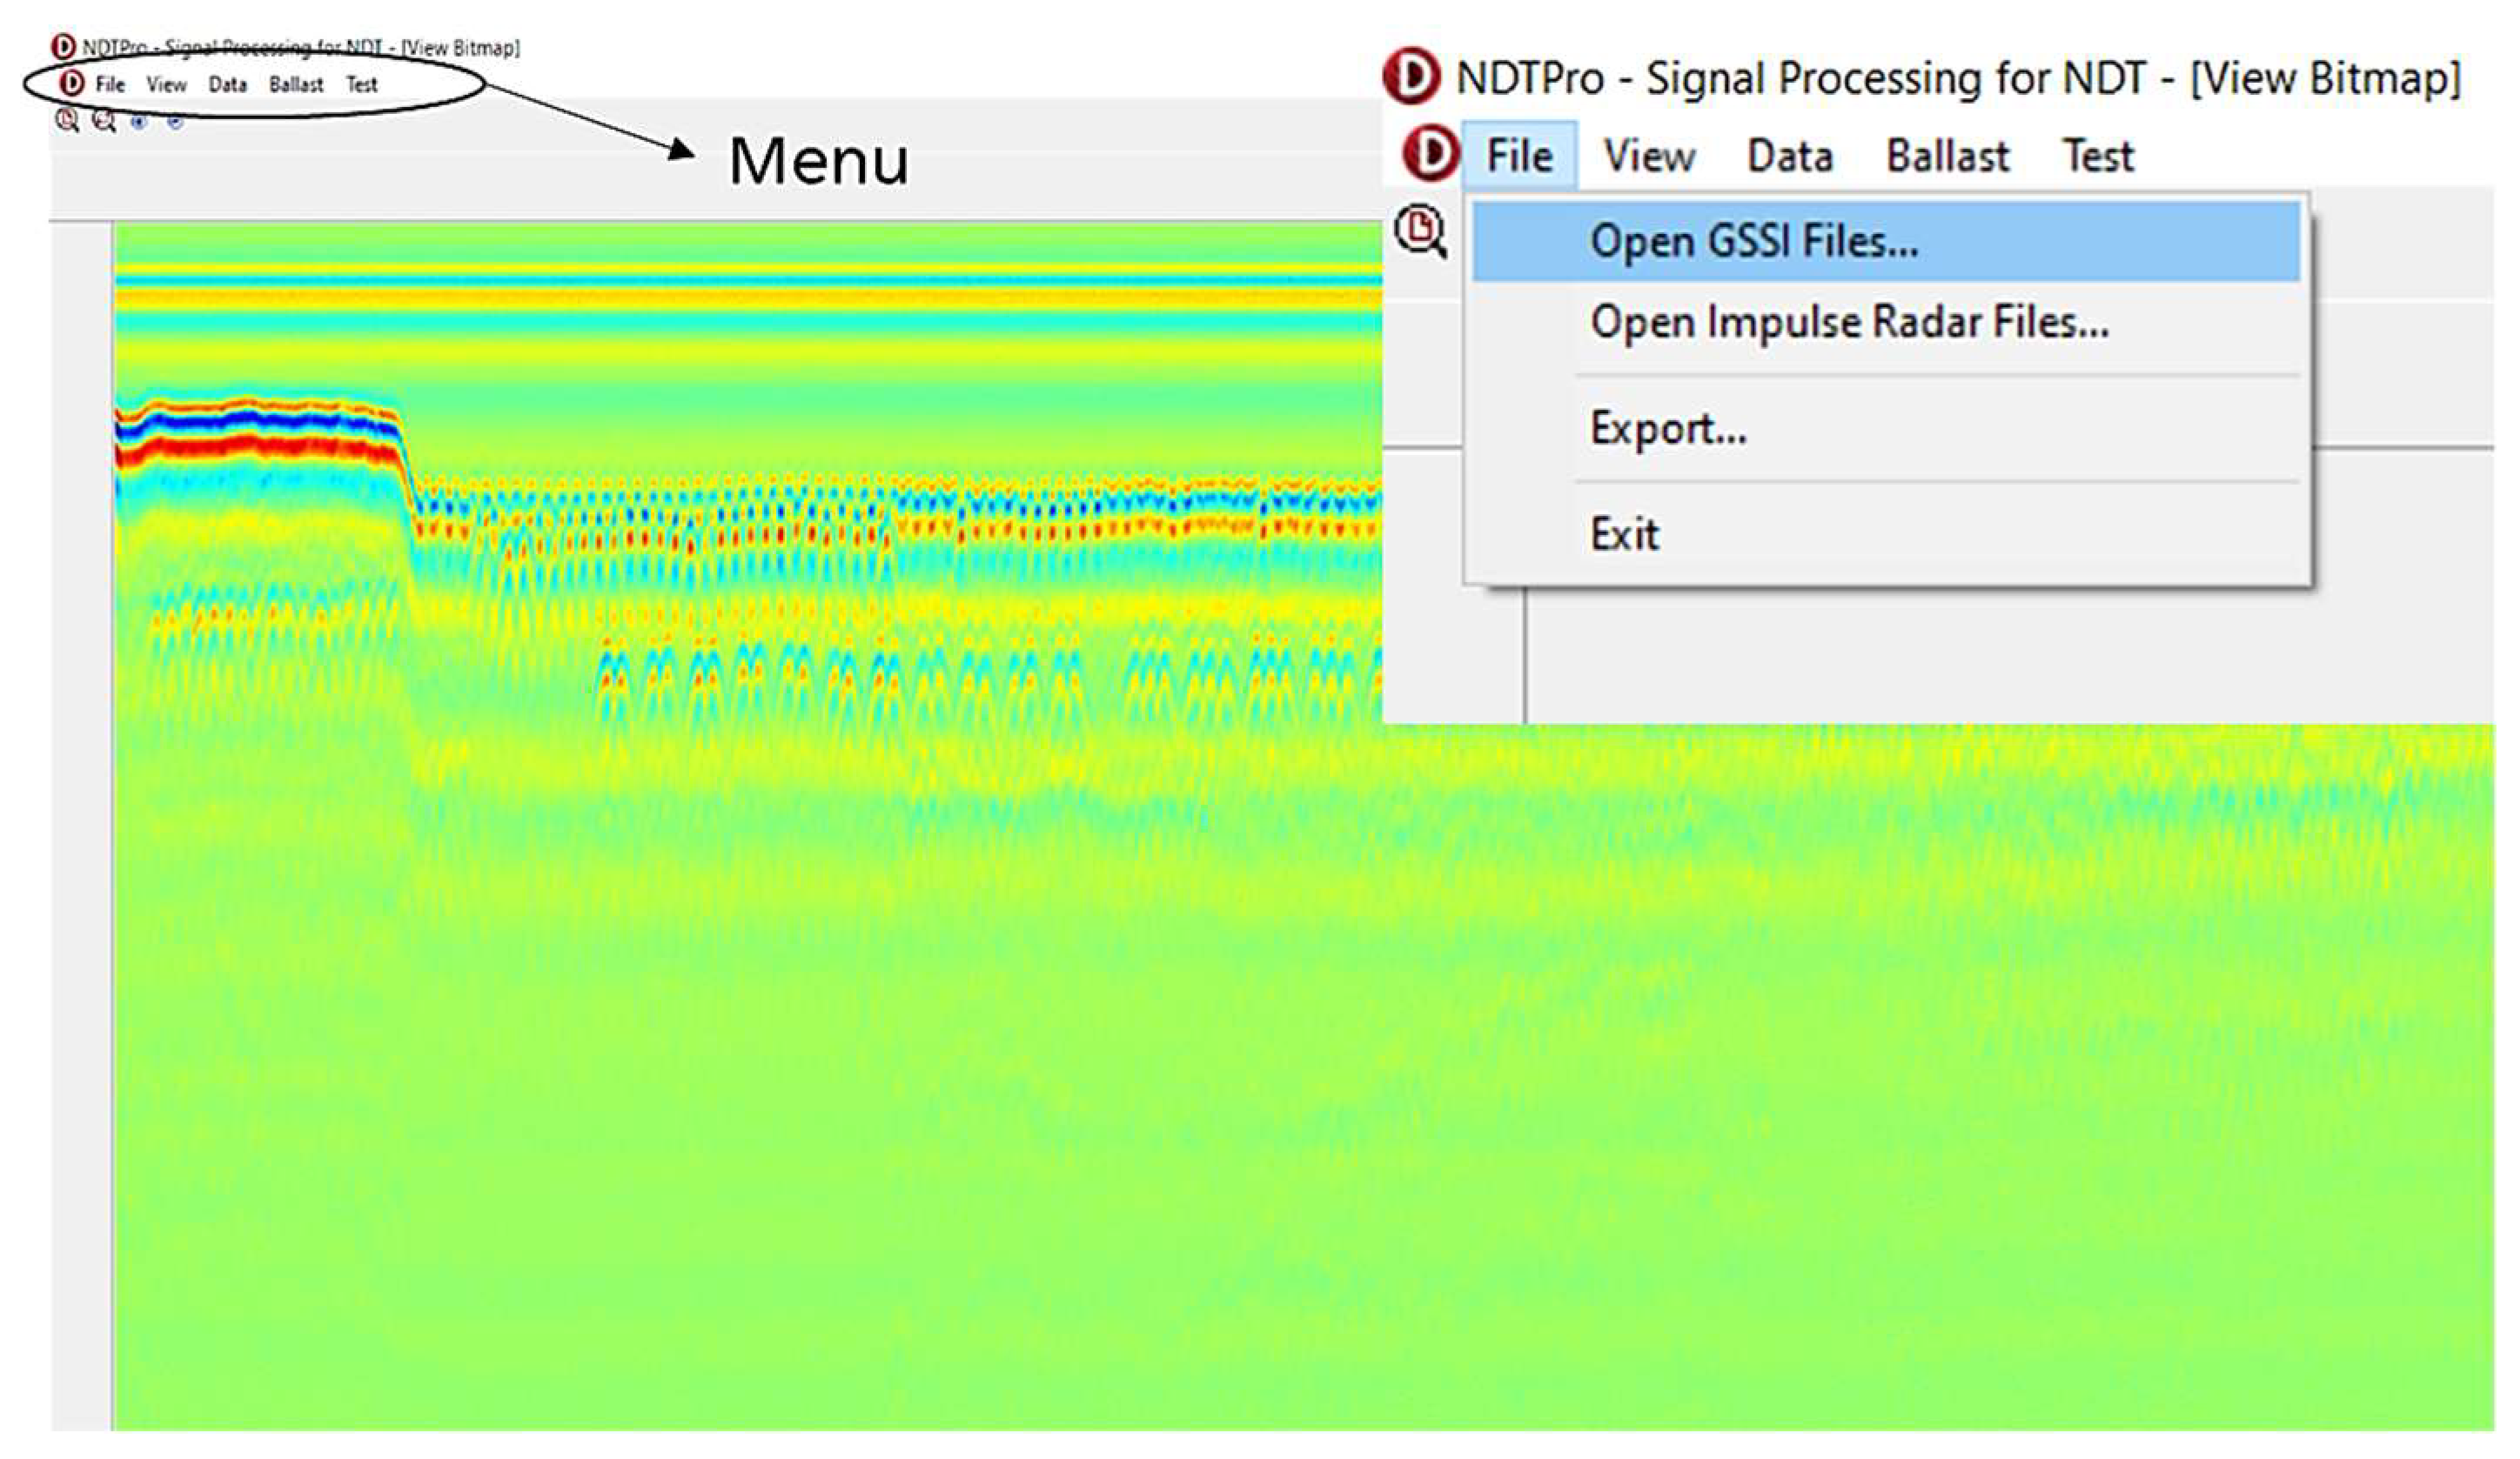
Figure 2 shows the NDTPro tool graphical interface.
The tool utilized STFT and WT to determine the fouling level of the ballast. STFT preserves time and frequency data, depicting frequency changes over time in GPR signals [
21]. WT enables local analysis in the time-frequency domain, highlighting aspects like frequency, trends, breakdown points, and discontinuities. The signal’s fluctuation level indicates electromagnetic wave scattering intensity [
22]. More signal fluctuation implies higher scattering. It also reflects ballast fouling. Standard deviation (SD) values from STFT and WT gauge signal fluctuation and provide insights into scattering intensity under different ballast fouling conditions. The program shows the fouling level result in the standard deviation of STFT and WT amplitudes in mapping color. The next subsections will explain the utilization of STFT, WT, and SD in detail.
3.1. Short-Time Fourier Transform (STFT)
In signal processing, the Fourier Transform is a fundamental tool used to analyze the signal’s frequency spectrum. However, traditional Fourier Transform methods lose temporal information during the transformation process, making analyzing signals that vary over time, such as GPR data, challenging. STFT overcomes this limitation by preserving both time and frequency information, allowing for the examination of how the frequency spectrum changes over time in the GPR signal. This is achieved by applying a window function (WF) to small segments of the signal and then performing the Fourier Transform on each segment. The information on frequency spectrum change with time is obtained using the following equation [
23]:
where
x is the GPR signal,
t is the time variable,
is the time index,
ω is the radial frequency variable,
w is the WF, and STFT is the frequency energy at time
t and frequency
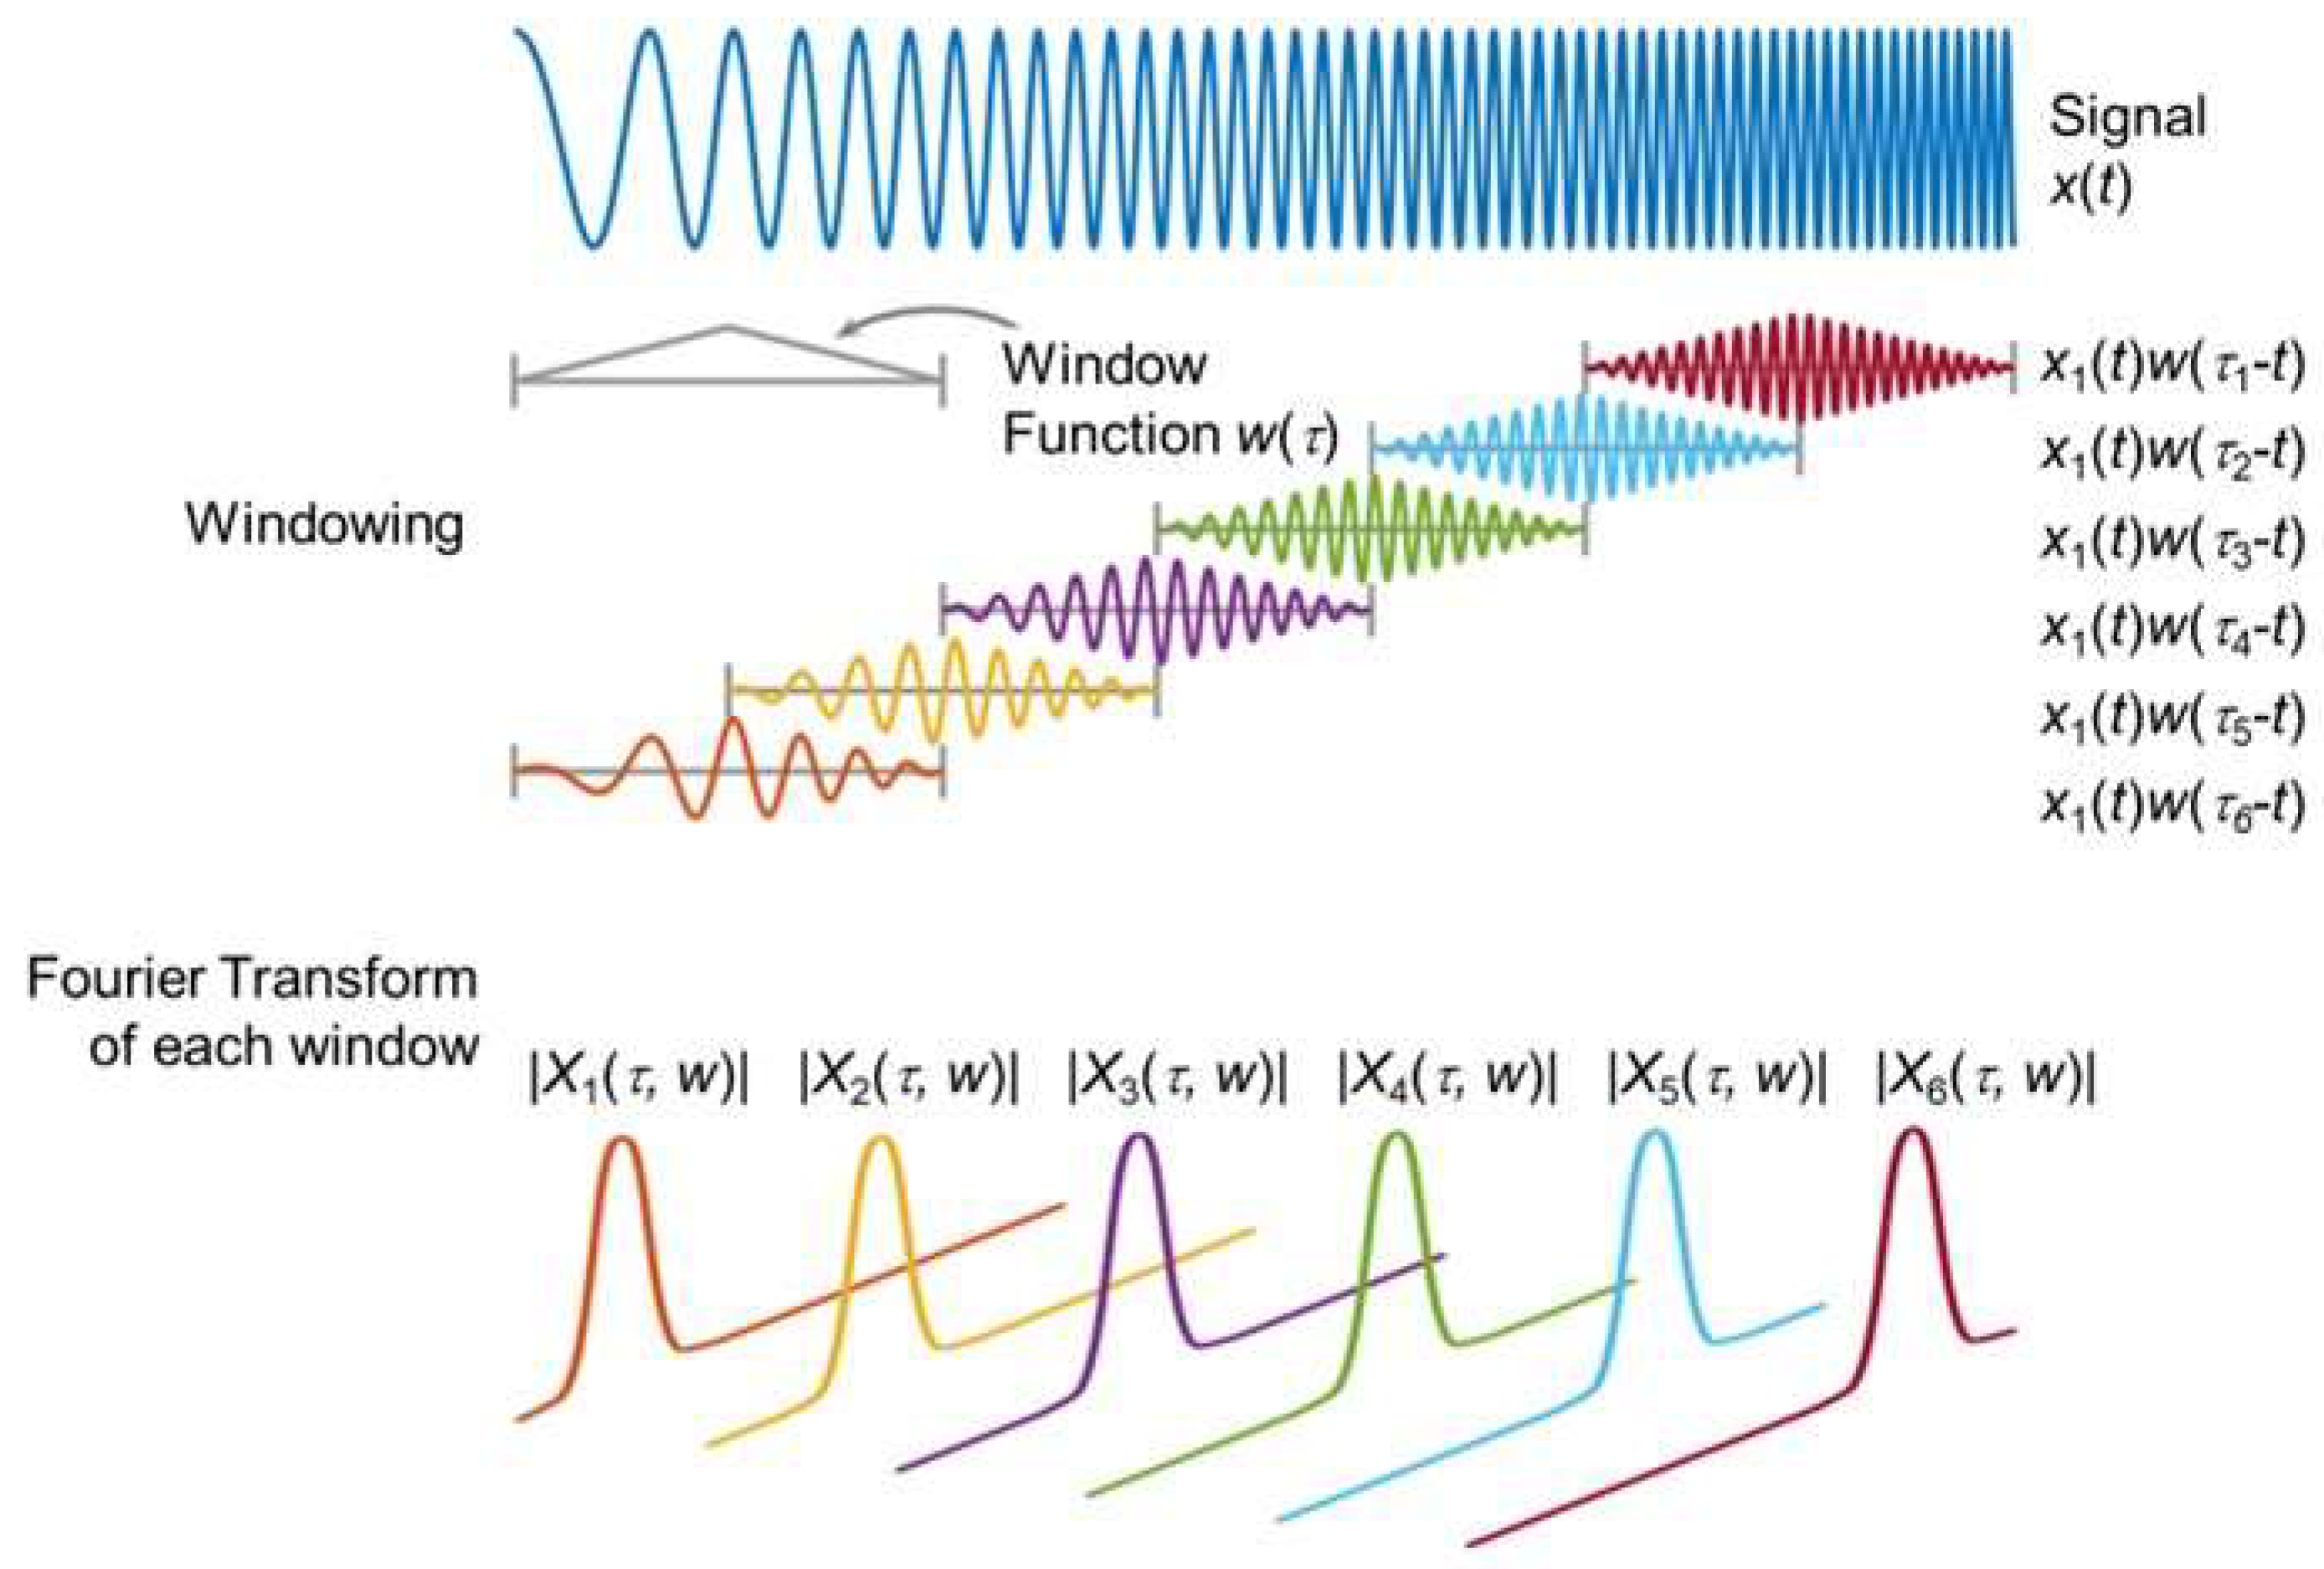
ω. An example to illustrate the working of STFT is presented in
Figure 3 [
23]. The frequency of the representative signal varies with time, and as a result, a regular Fourier Transform is inefficient in determining the frequency spectrum of the signal with high accuracy. With the use of the STFT, the signal is divided into finite windows of time, as shown in the figure. This process is known as windowing. The windowed signal, when multiplied by the WF, creates the short time signal, and the Fourier Transform of this short signal produces the frequency spectrum of the short time window. The time window is then shifted to the next time point while maintaining an overlap with the previous window. This results in the preservation of frequencies over each time window, which would have otherwise been lost under the use of a full Fourier Transform. The choice of size of the time window determines the resolution of the STFT. Shorter windows enable classifying a greater number of frequencies of the signal but make the process computationally expensive.
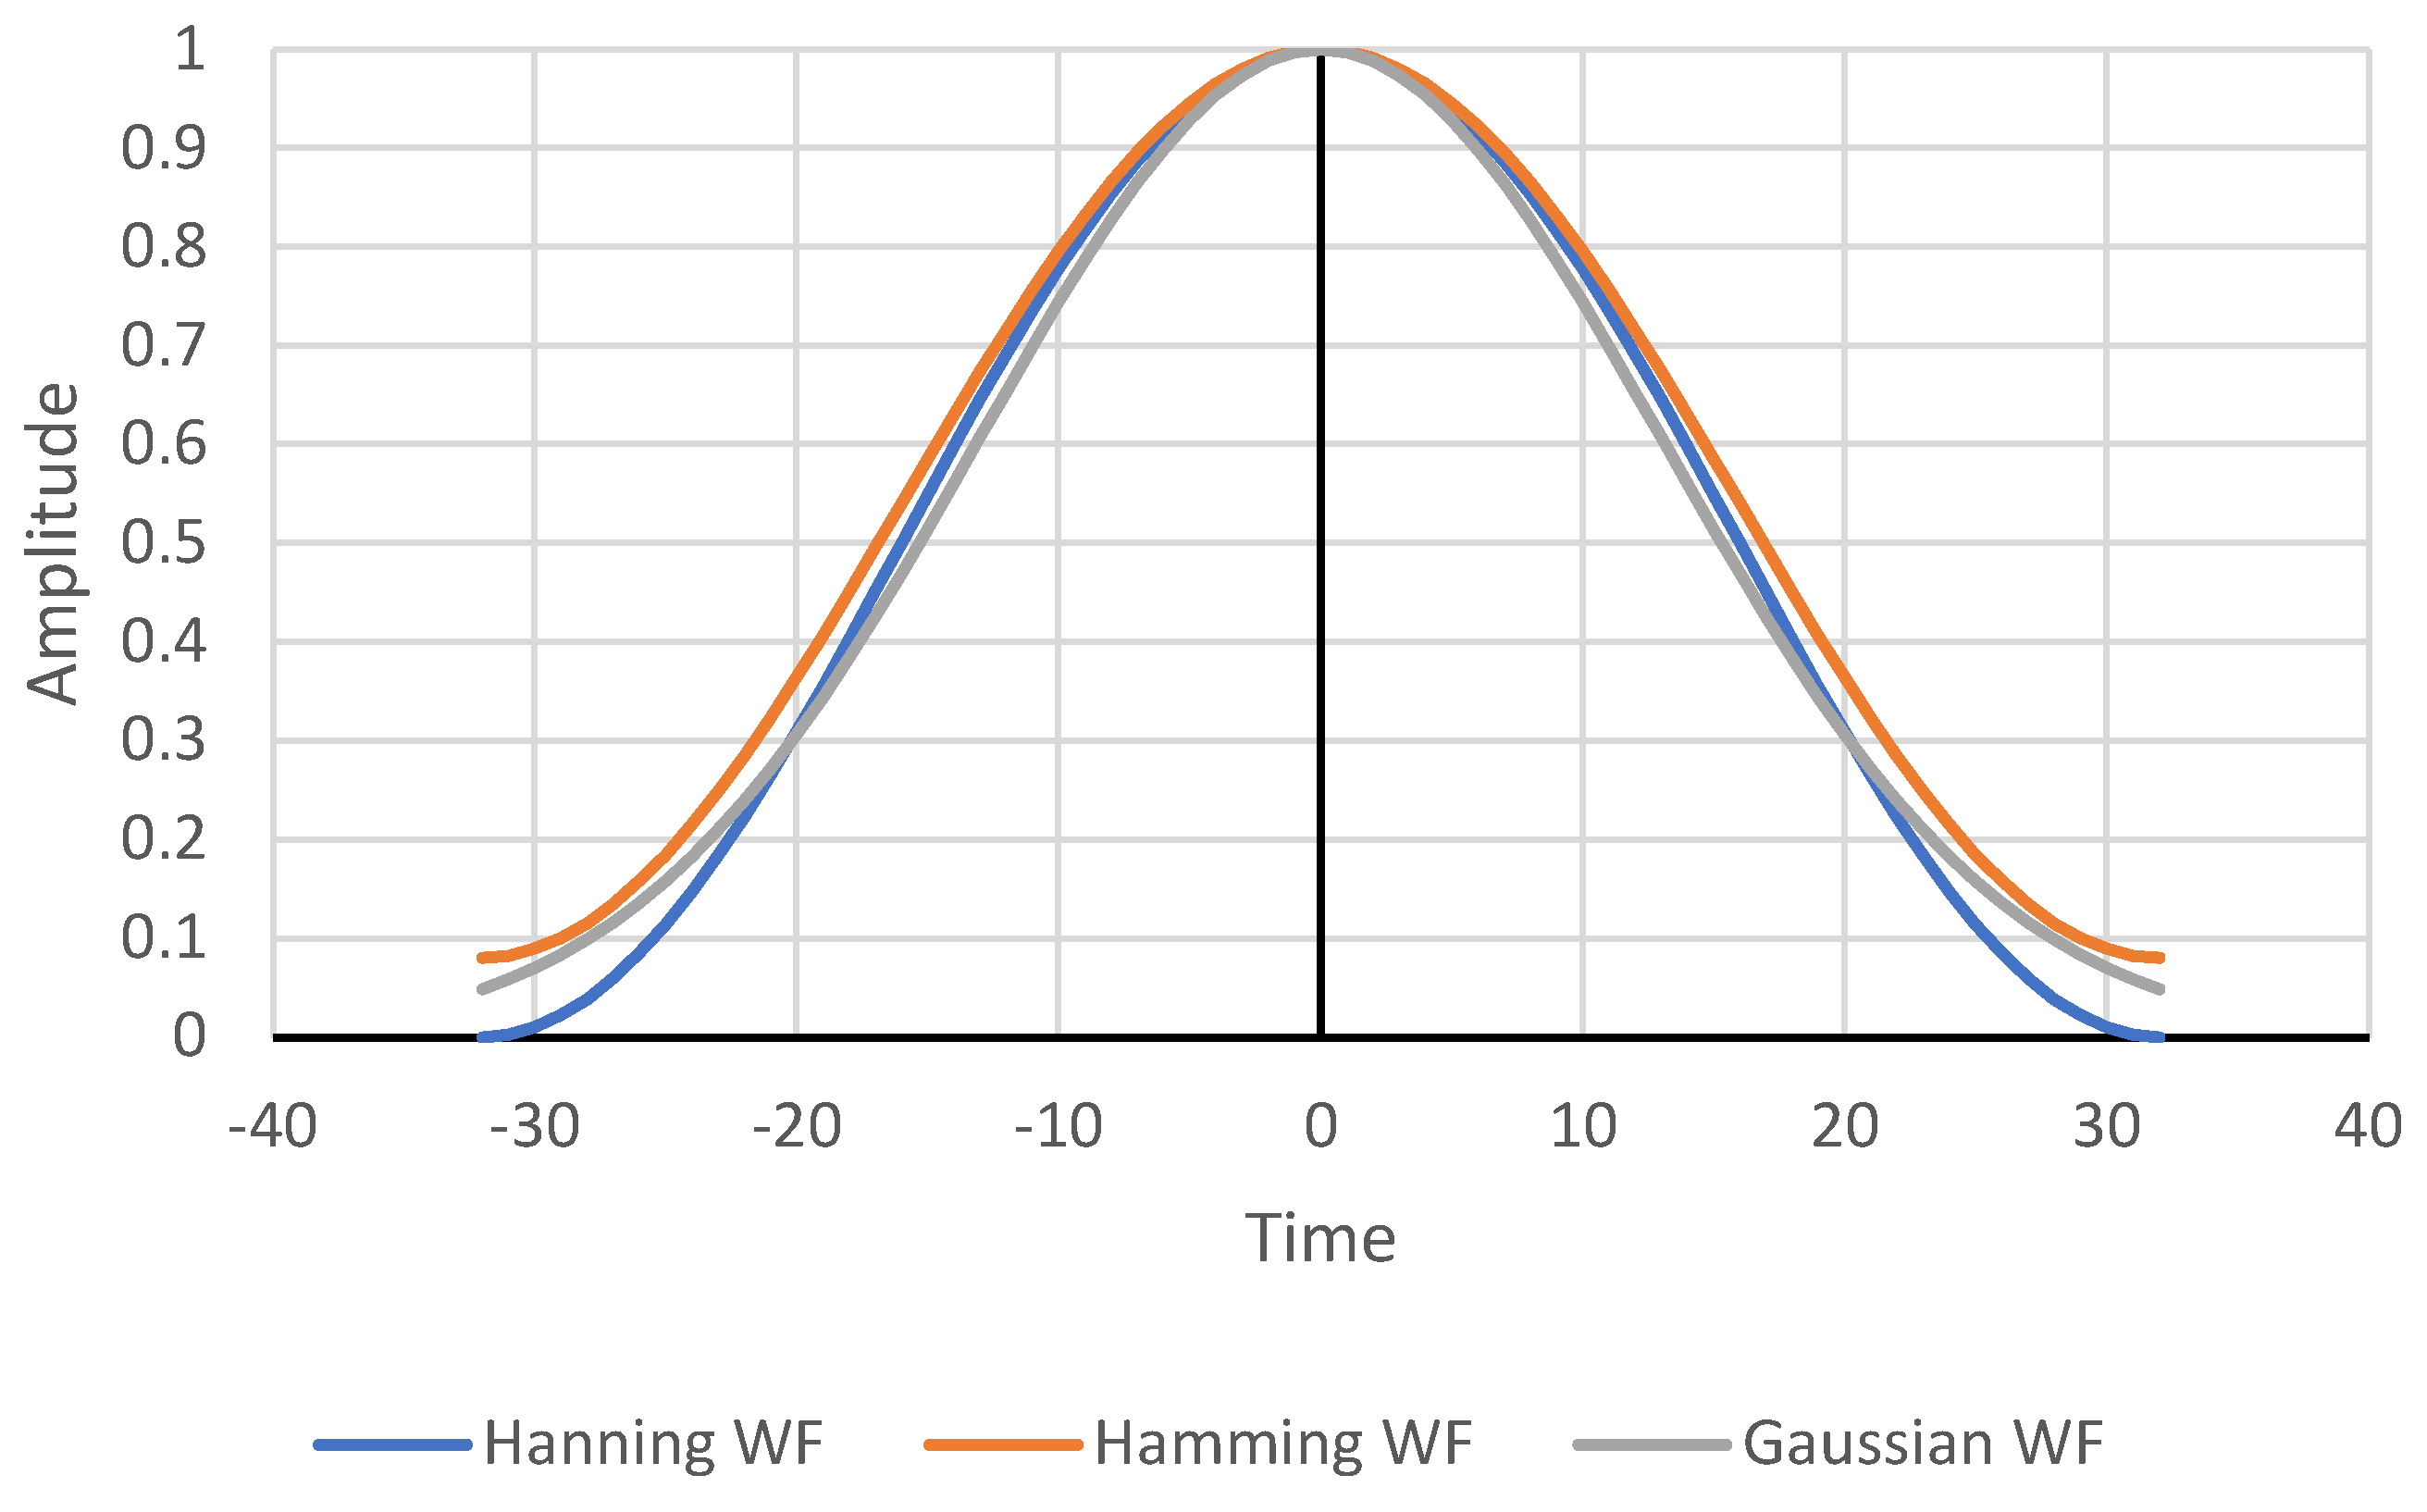
The WFs play a crucial role in the STFT analysis and are usually non-negative, smooth, and “bell-shaped” curves. Once STFT is calculated, it can be plotted against t and ω to visualize the frequency energy at different times and frequencies. Commonly used window functions include the Hanning, Hamming, and Gaussian functions, each with its own distinct characteristics. For instance, the Hanning window function is known for reducing spectral leakage by applying smooth tapering at the edges. These common WFs are presented in the following equations.
Hanning’s window function [
23]:
Hamming window function [
23]:
Gaussian window function [
23]:
where
N is window size;
n varies from −(
N − 1)/2 to (
N − 1)/2. All three window functions are plotted in
Figure 4.
While STFT provides valuable insights into the time-frequency characteristics of the GPR signal, it has limitations in achieving high resolution due to fixed resolutions across all frequencies and times. To address this limitation and enhance resolution, STFT can be complemented with WT, as discussed further below.
3.2. Wavelet Transform (WT)
WT is a multiresolution signal processing technique with adjustable window length and covers any range of frequency that overcomes the shortcoming of STFT. The key advantage is that it can perform local analysis in the time-frequency domain, revealing signal aspects such as frequency, trends, and discontinuities. There are a variety of wavelets available which can be selected according to the application. WT operates by superimposing short-duration wavelets onto the signal, decomposing it into a more interpretable form. This method has proven effective in analyzing periodic, noisy, intermittent, and transient signals [
24]. Continuous WT is an effective method for time-frequency analysis. Particularly, the Morlet wavelet mimics the incident wave effectively and was chosen as the mother wavelet for GPR data analysis. Thus, the complex Morlet function is selected, and its mathematical expression is given as follows [
24]:
where
ω is the central frequency,
t is the time, and
s is the bandwidth. The continuous complex Wavelet Transform oan arbitrary function
f (
t) is expressed as follows [
24]:
where
τ is the dilation factor. The phase angle
φ (
τ) of the
W (
τ) is computed as follows [
24]:
where
and
are real and imaginary parts of the
W (
τ). The frequency of the Morlet function can be obtained as antenna frequency. The bandwidth can be simply computed as follows [
24]:
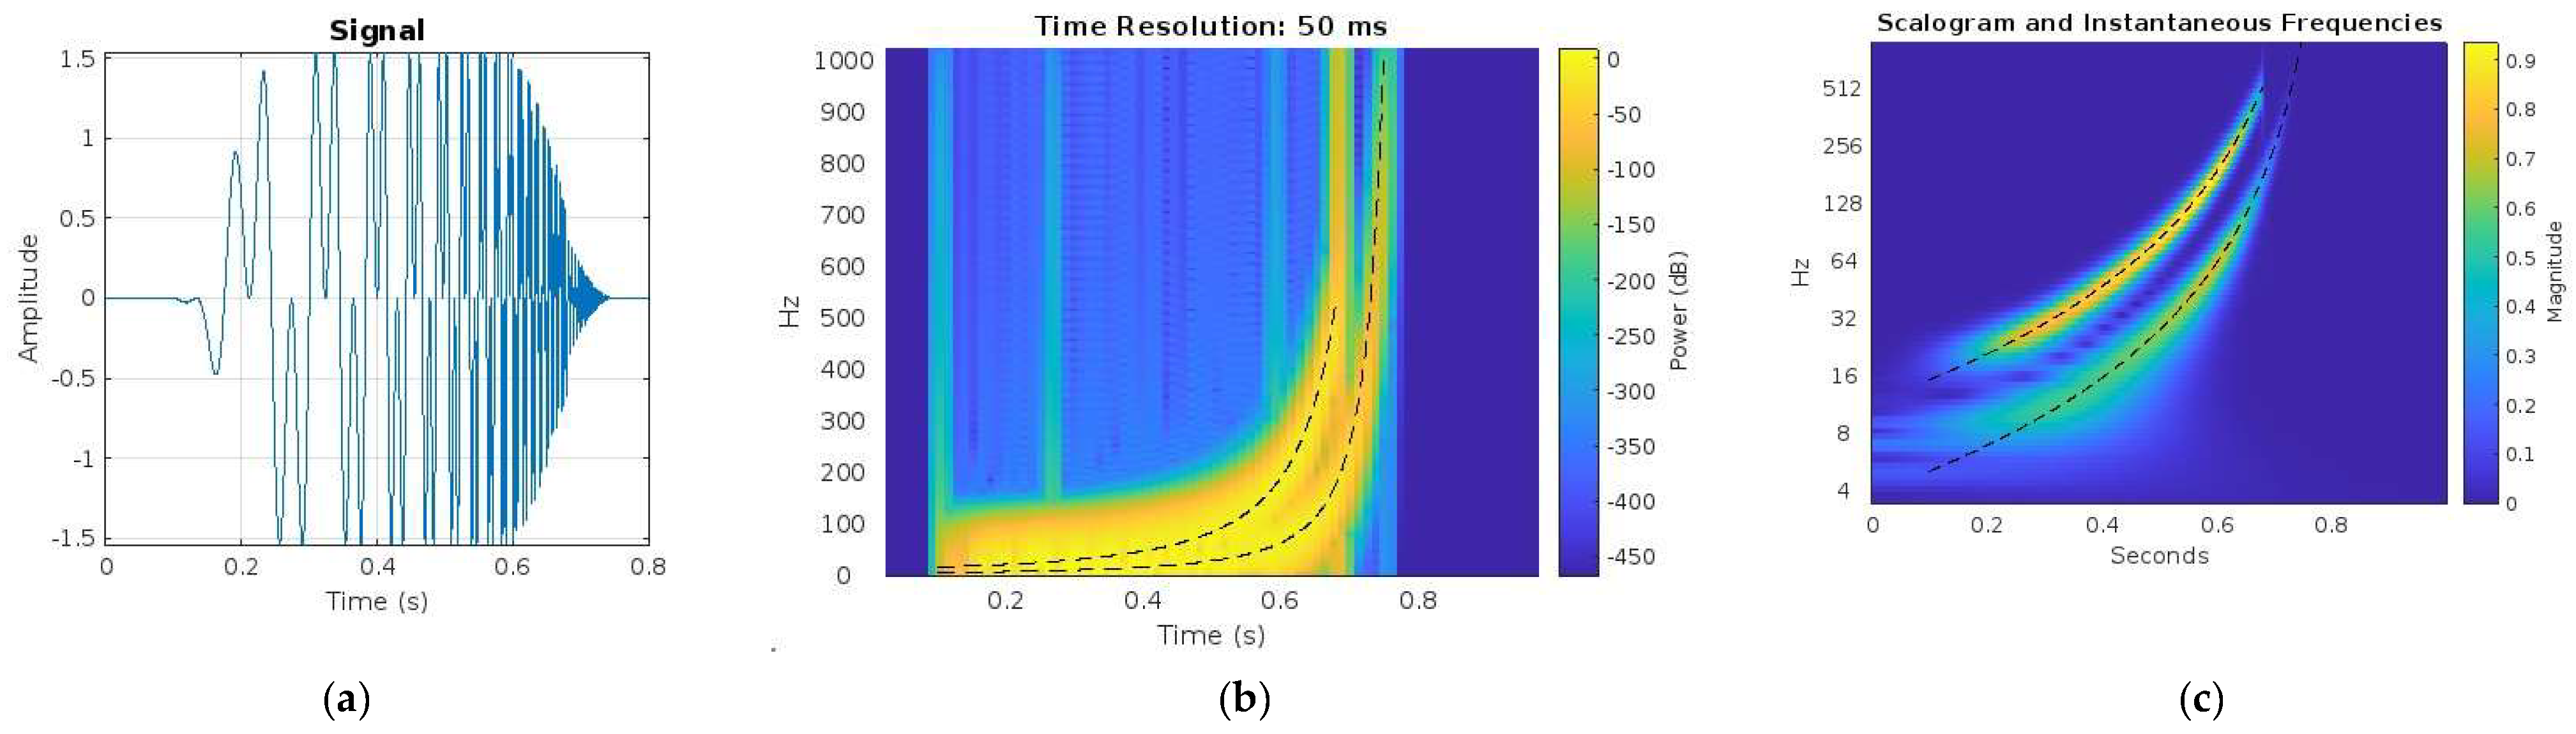
A comparison of STFT and Wavelet Transform for a signal is shown in
Figure 5. The signal shown in
Figure 5a has time-dependent frequency variations. The frequency spectrum for this signal using the STFT and Wavelet Transformation are shown in
Figure 5b,c, respectively. It can be observed that the Wavelet Transform can capture the instantaneous frequencies of the signal with time much more accurately.
3.3. Standard Deviation (SD)
The level of fluctuation represents the scattering intensity of the electromagnetic wave. The more the signal fluctuates, the more intense the scattering is. The fluctuation level of the signal also reflects the fouling level of the ballast. The SD value of the STFT and WT can be used to evaluate the fluctuation level of the signal, and thus, the scattering intensity for ballast under different fouling conditions can be obtained. Standard deviation can be calculated as follows [
24]:
where
where
is spectrum amplitude,
is the average amplitude, and
m is the number of data points.
3.4. NDTPro Tool Optimization
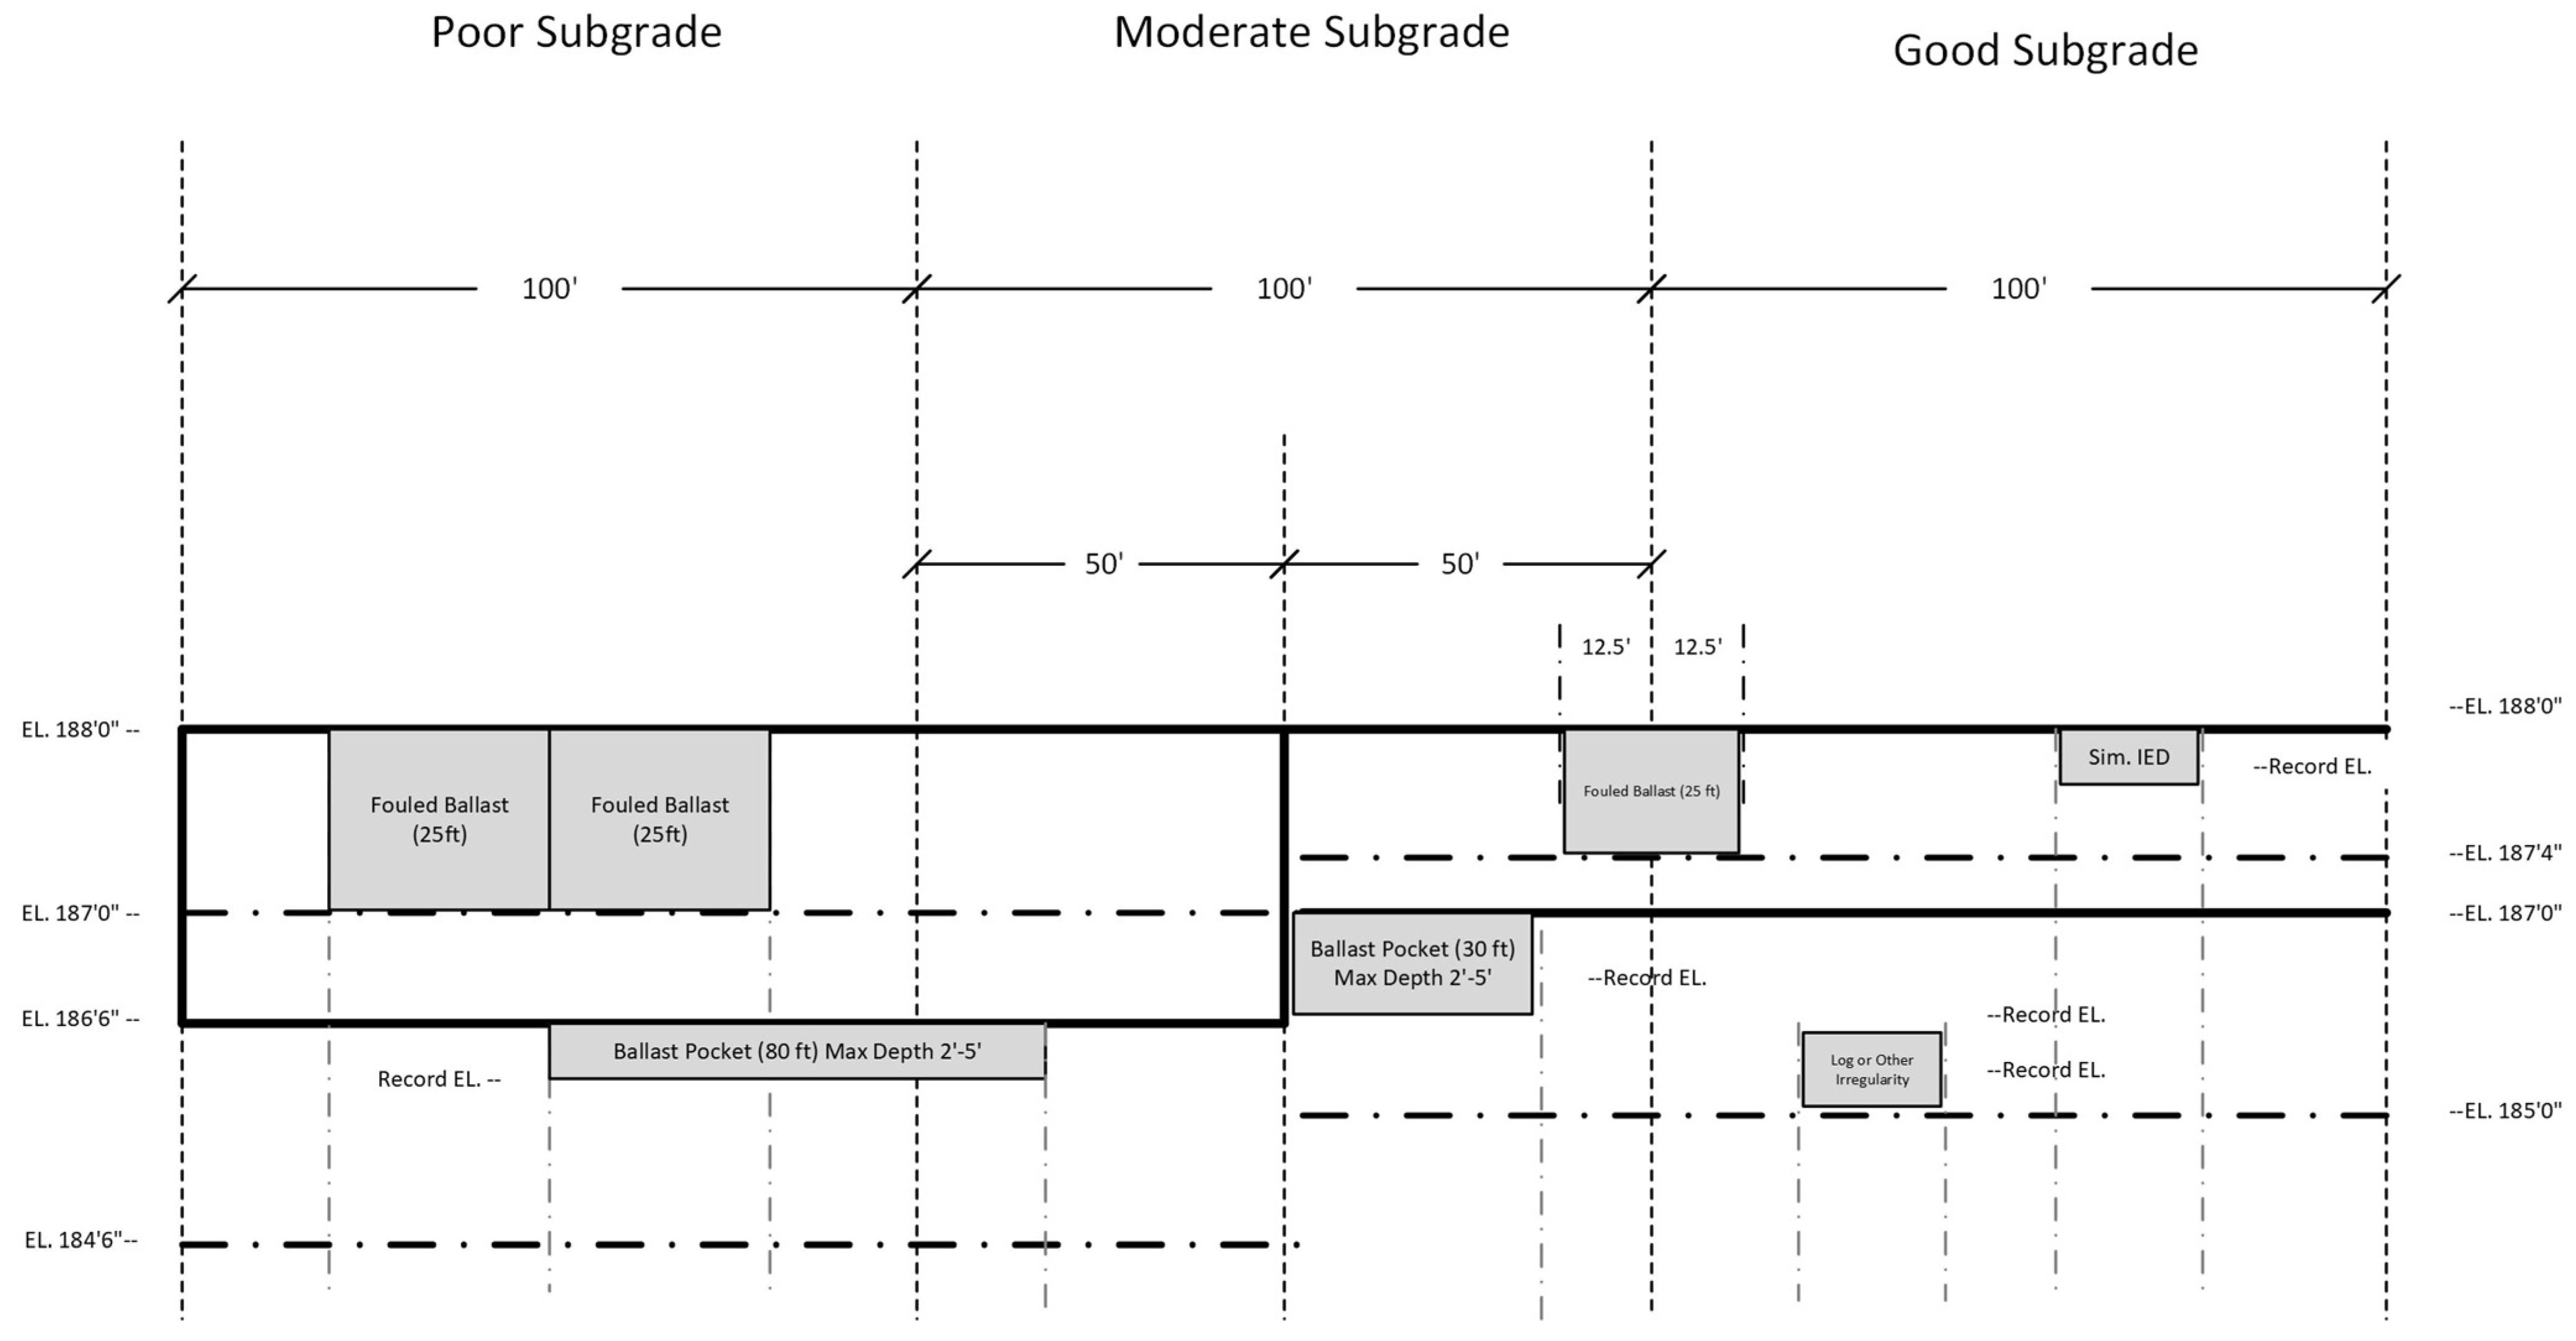
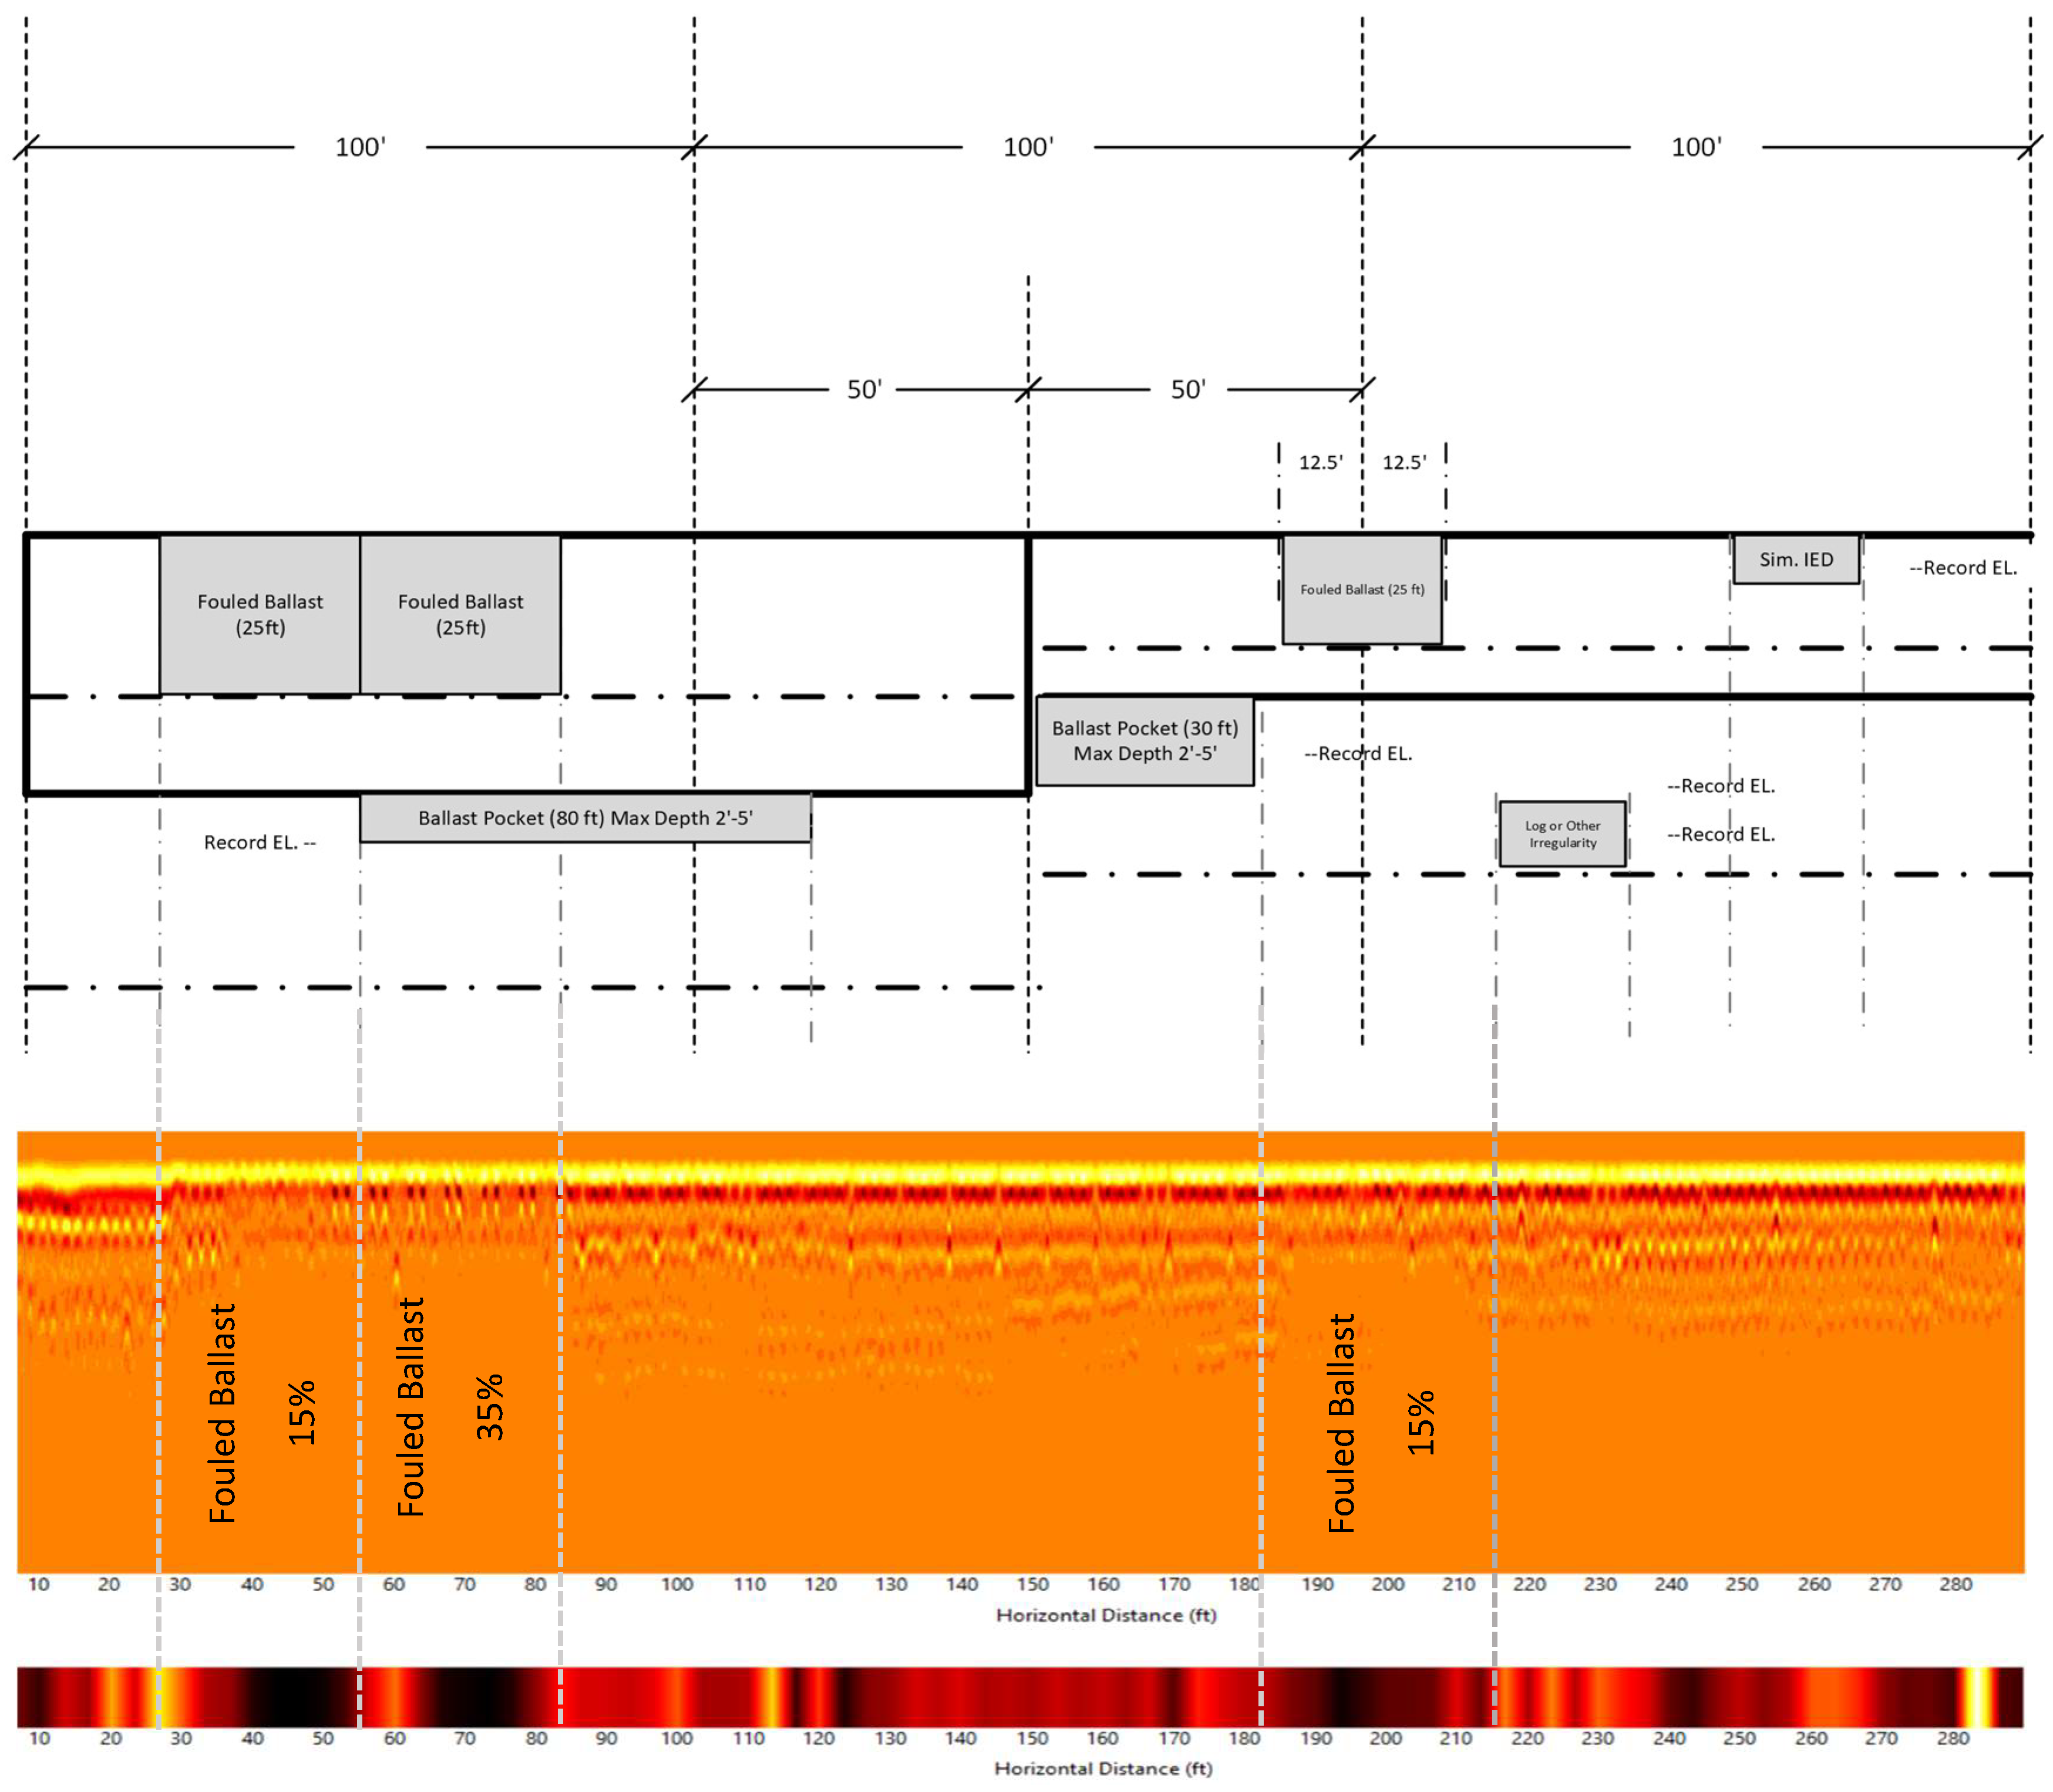
GPR scanning was performed at The US Army Engineer Research and Development Center (ERDC) test track facility (ETTF) in Vicksburg, Mississippi, to optimize the tool. The ETTF consists of a 300 ft long track segment of varying ballast and sub-ballast thickness, pre-planned fouled ballast sections, and artificially manufactured ballast pockets. The ERDC test track facility is divided into three sections, with properties and details of each section provided in
Figure 6. Ten moisture sensors were installed at different locations to monitor the humidity of the ballast bed. Both hi-rail and push-cart-based methods were used for the data collection.
The information provided in
Figure 6 and the relative dielectric constant of the track sub-sections have been used to calibrate the GPR. Moreover, a linear referencing calibration process has been performed in a laboratory setting to calibrate the GPR. Known distances were marked on the pavements, and repeated travels were made to establish constants for the software to use to correlate the distance traveled with the GPR output.
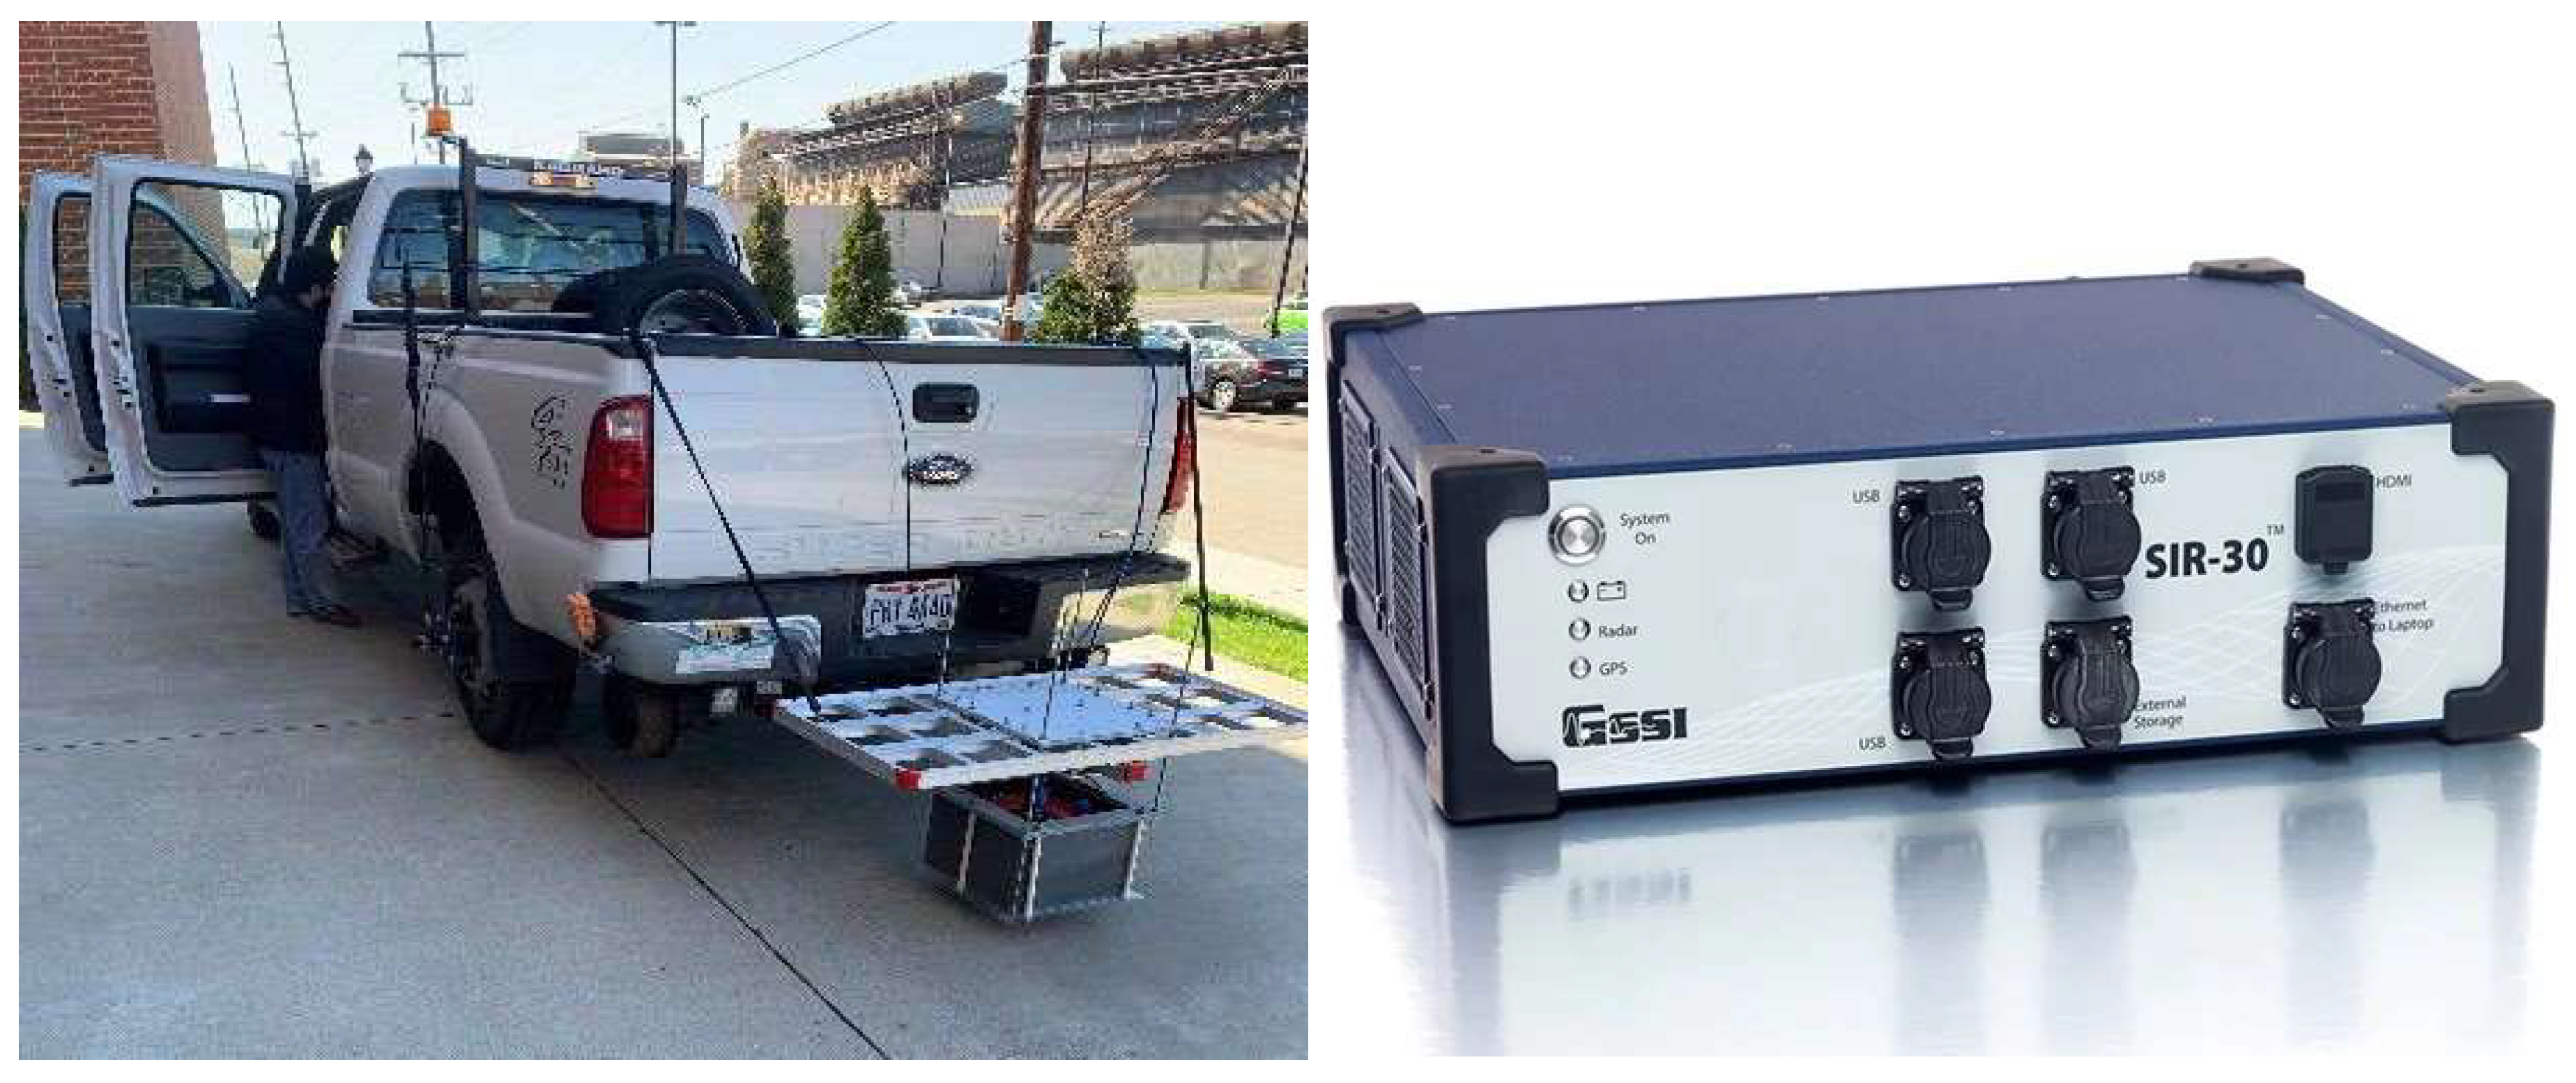
Table 1 and
Figure 7 show a summary of the equipment used.
The data collection was conducted with parameters presented in
Table 2 and
Table 3 based on the configurations of the GSSI GPR equipment. The effects of those parameters on the results of the analyses are considered to optimize the software. A total of 45 data sets for all antennas were collected in about 8 h.
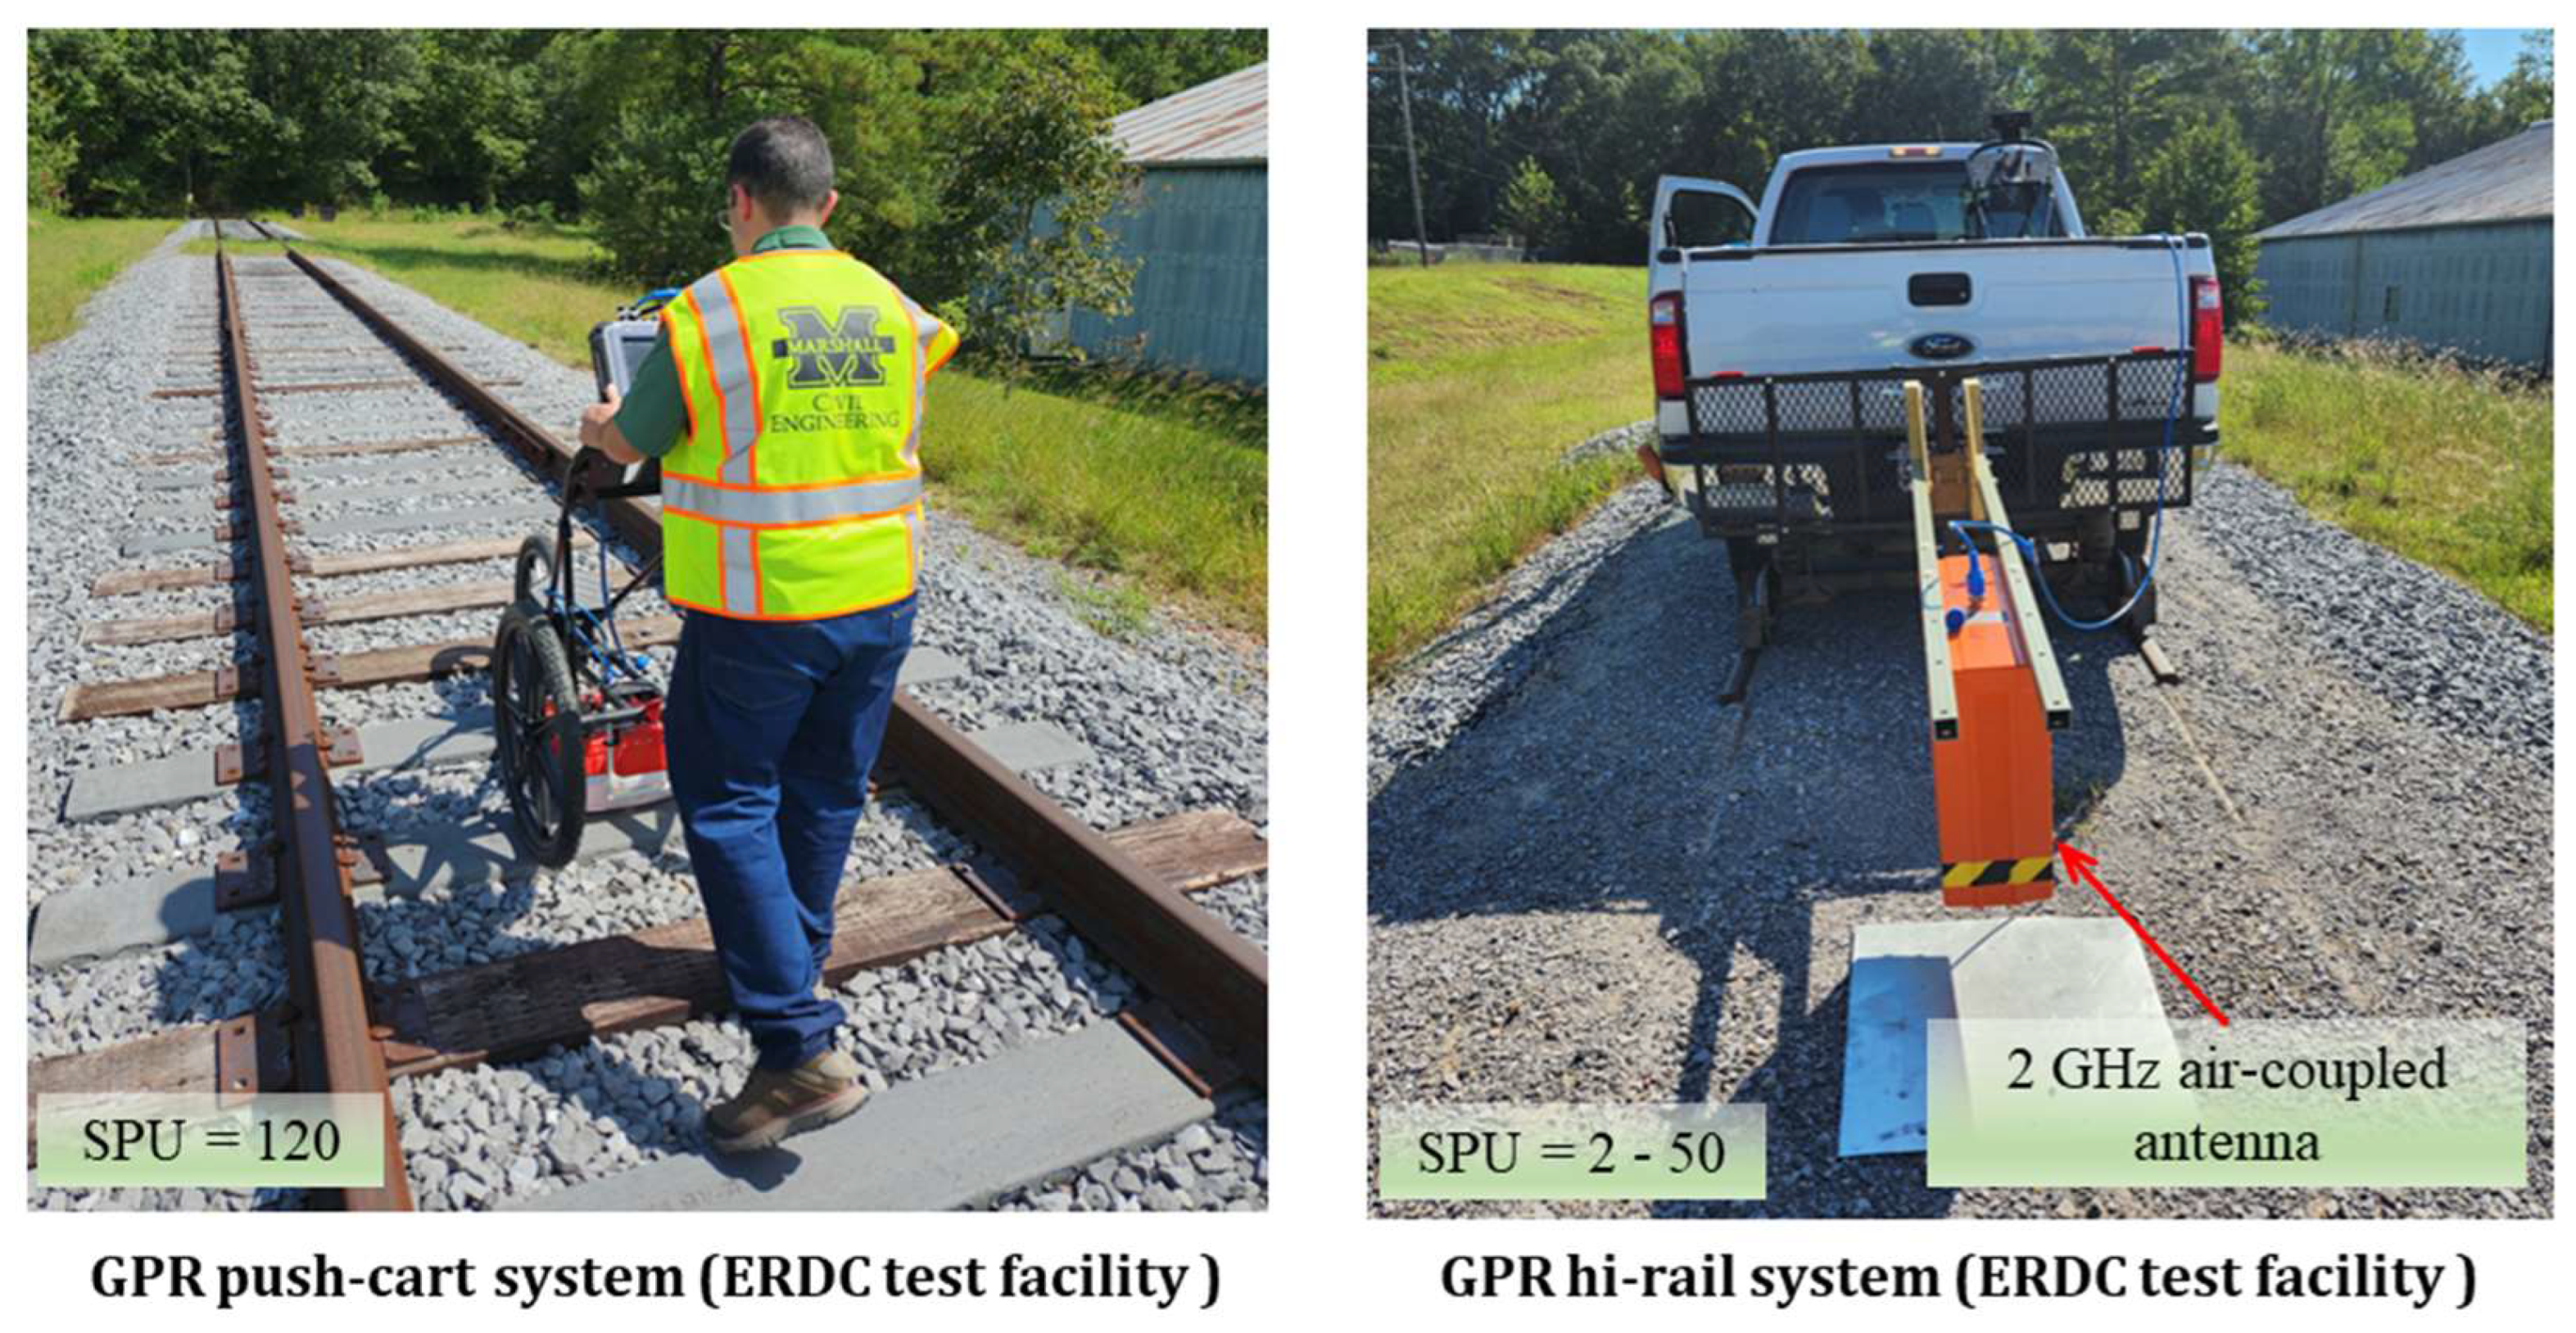
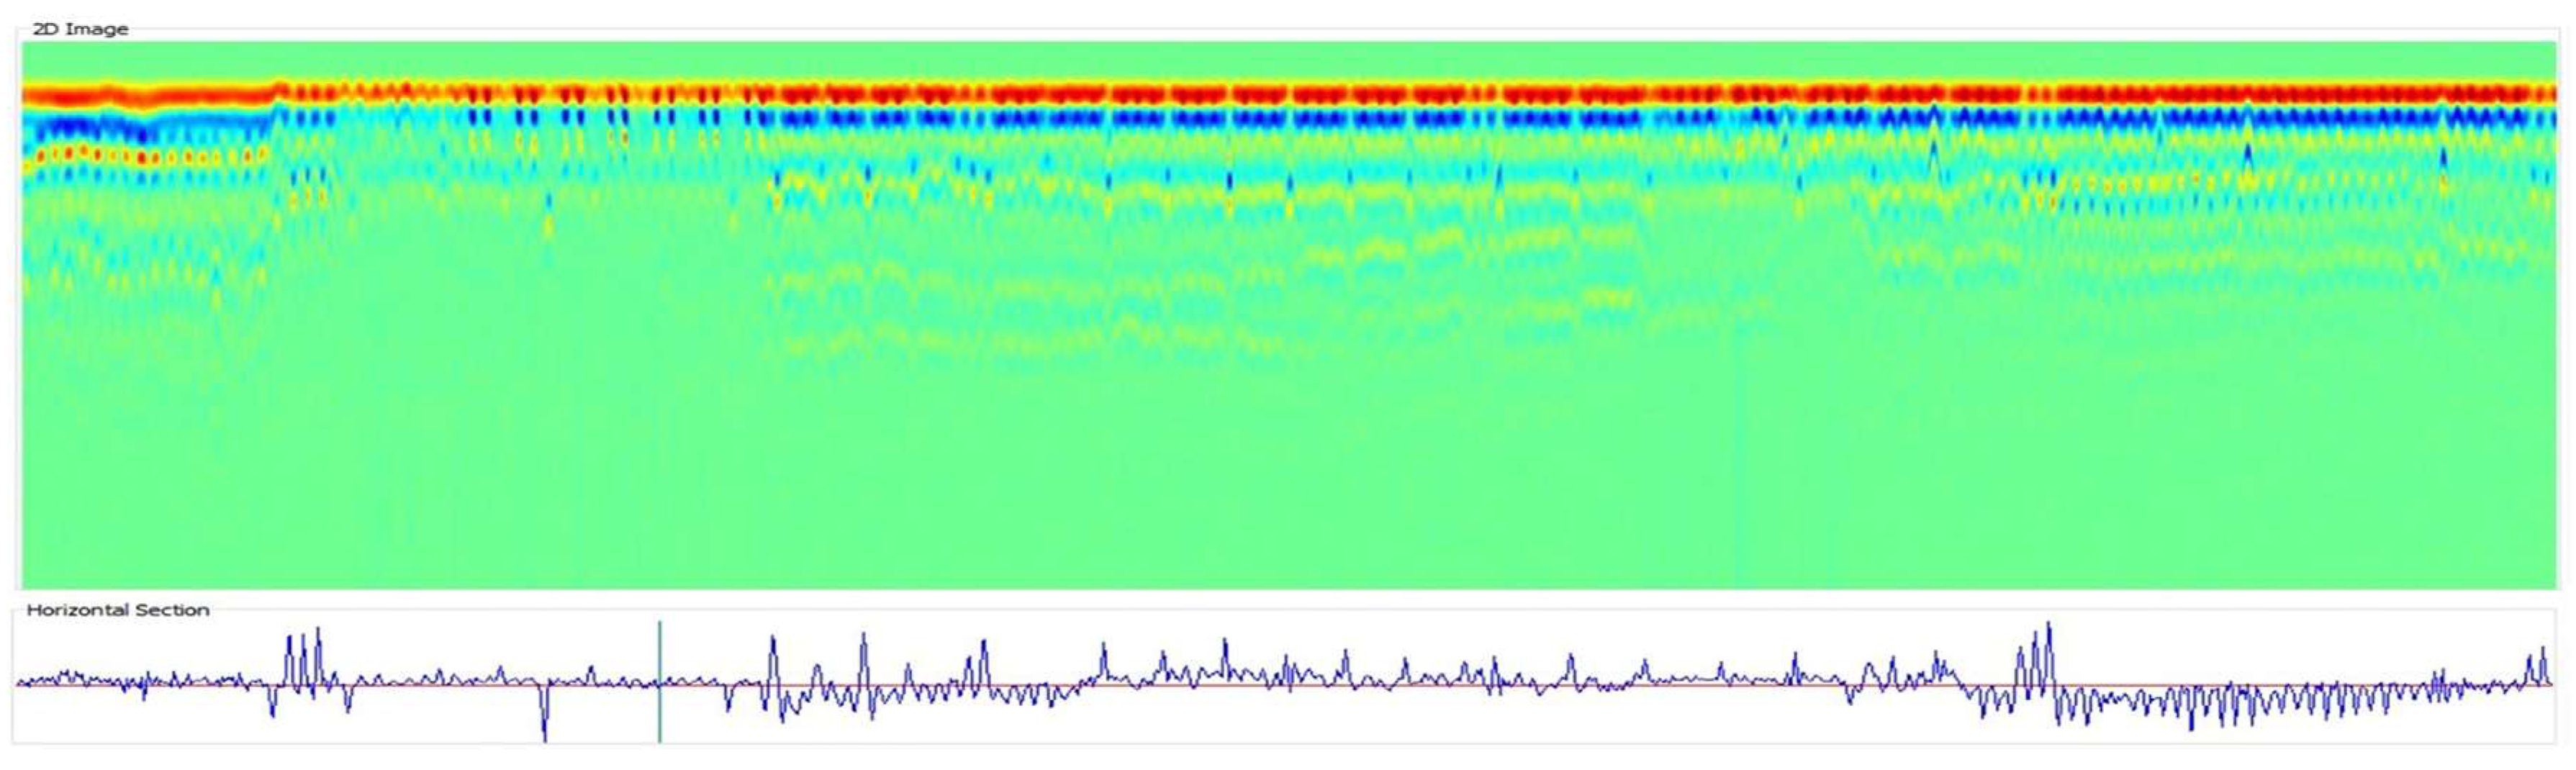
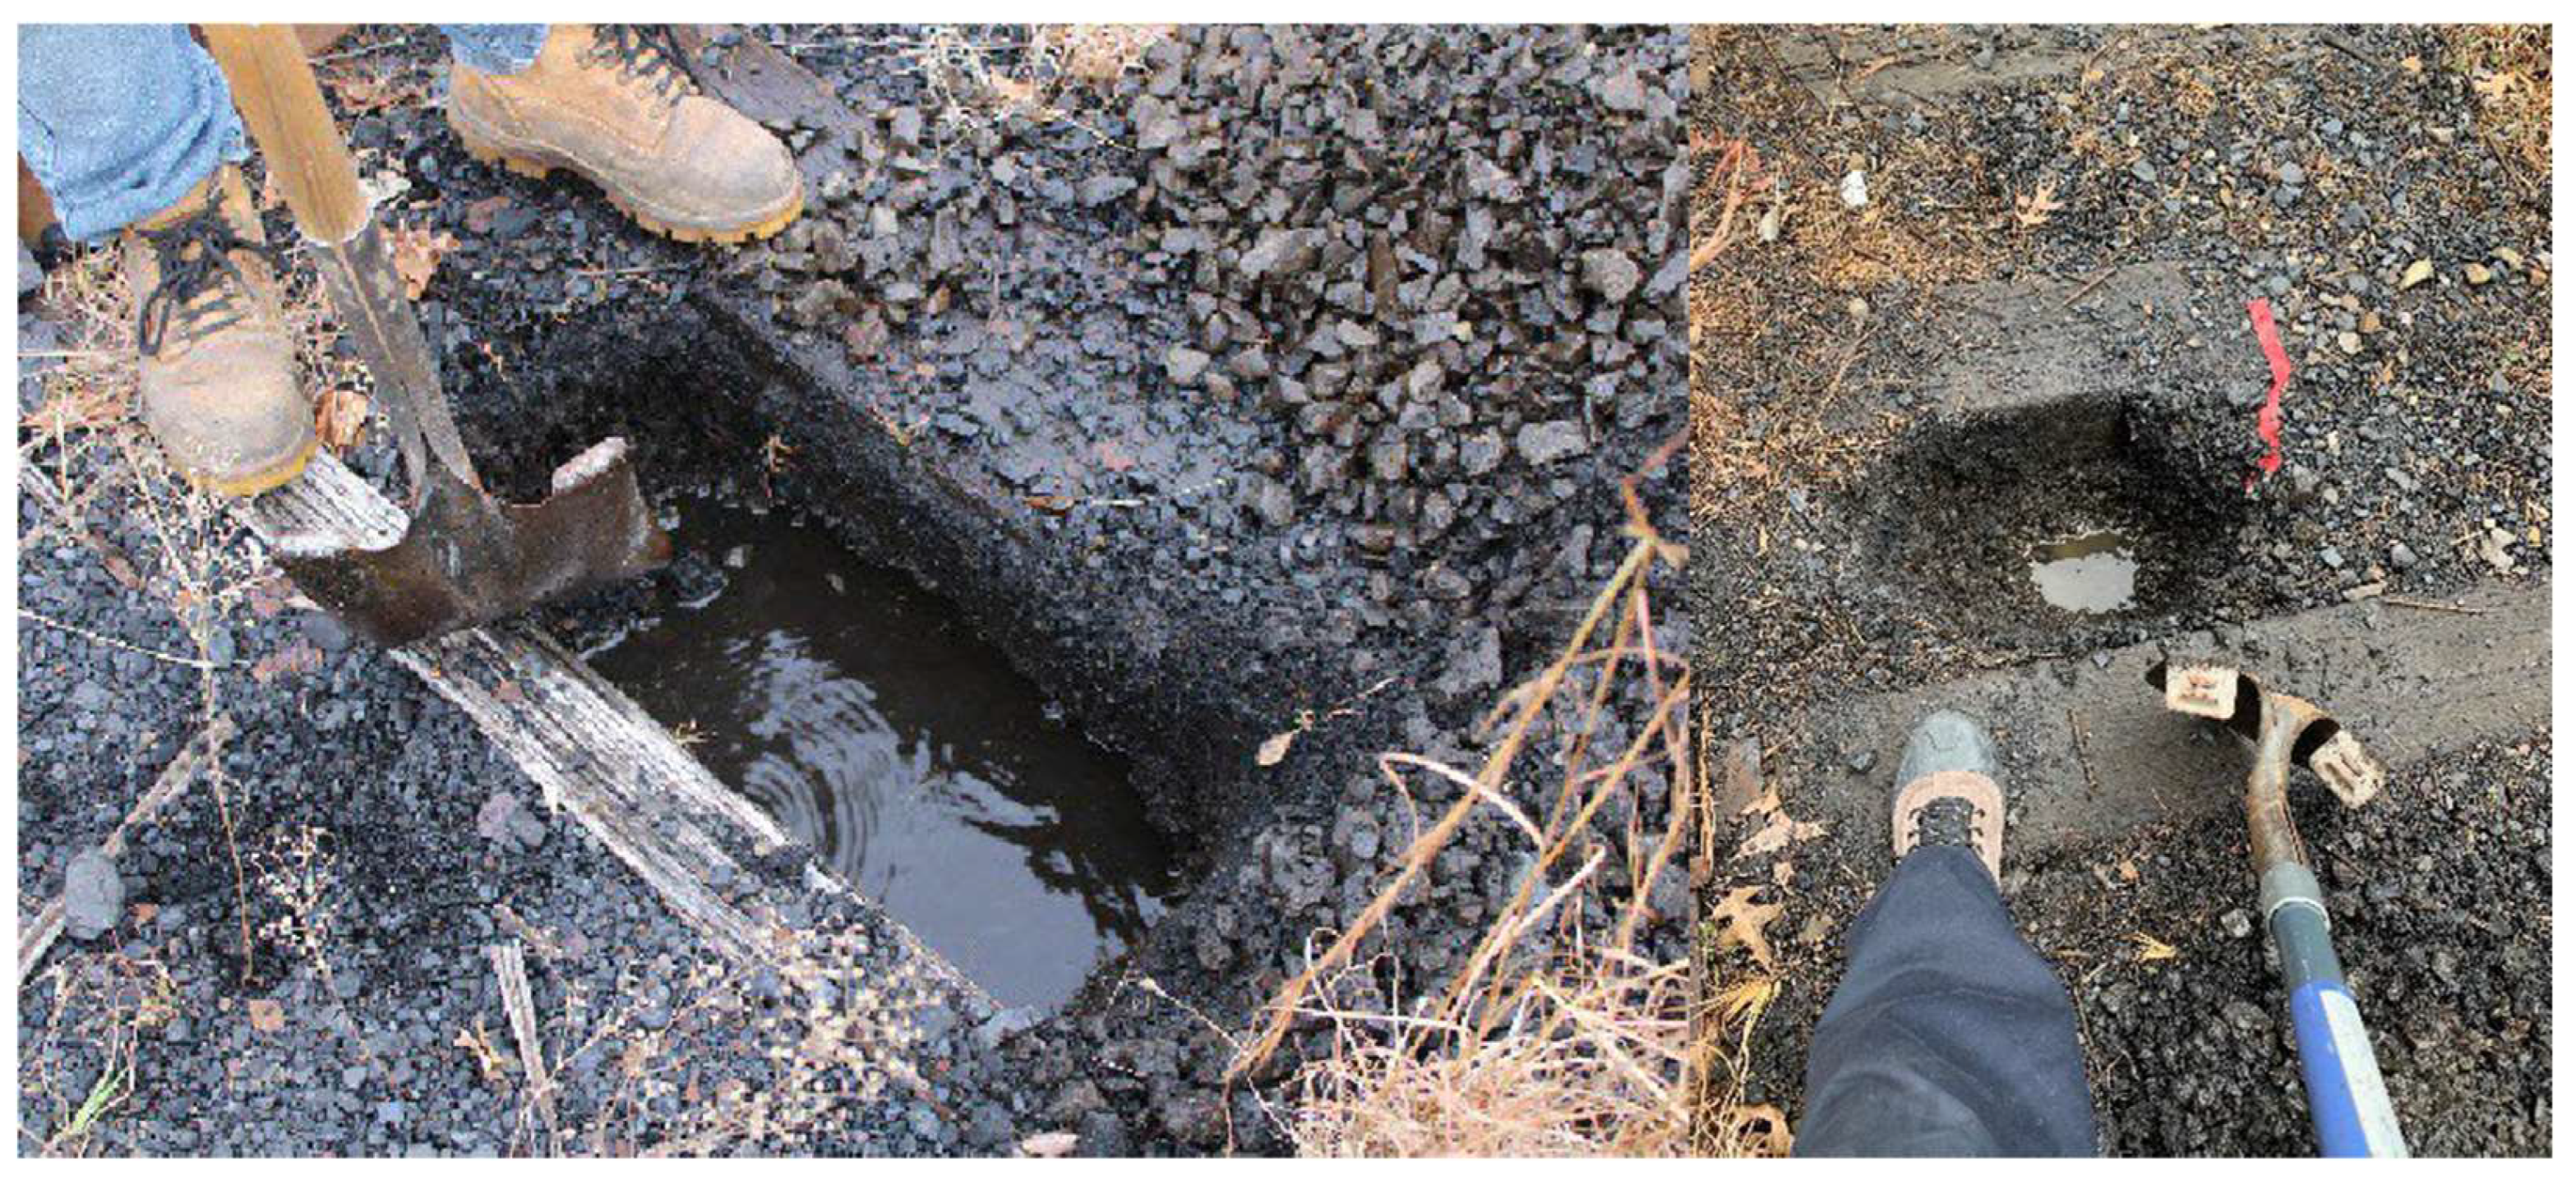
Figure 8 shows the data collection process at the ERDC test track facility, and
Figure 9 shows a sample of the result of the proposed tool.
The correlation functions between SDs of the STFT and WT methods, and fouling levels are developed. The functions depend on all the parameters presented in
Table 4 above. The ballast fouling index (BFI) categories that need to be correlated to the standard deviation are shown in
Table 4.
The correlation function is given by the following:
where
N is the number of
FI levels; SD
min = 700; SD
max = 1000.
The SD values of STFT were computed at the depth corresponding to two-way travel time from 5 ns (below the tides) to 10 ns. The light red to yellow color represents high SD corresponding to low fouled ballast, and the black color represents low SD corresponding to high fouled ballast, as shown in
Figure 10. From distances of 30 ft to 58 ft, ballast with 15% fouled is indicated by red to black colors. Similarly, from distances of 60 ft to 82 ft, ballast with 35% fouled is mostly represented by dark red to black colors. The 15% silt fouled ballast from 187 ft to 207 ft is also shown by a light black color strip. This validates the effectiveness of the SD values to indicate fouling conditions.
Soil samples have been taken from the site to calculate moisture content. The moisture content was found to be equal to 2.4%. GPR can detect the minimum moisture content is about 5%, where the dielectric of the soil starts increasing with the moisture content. Therefore, a moisture content of 2.4% does not affect the GPR signals reading. Through iterative processes and rigorous testing, the NDTPro tool has been optimized to improve its accuracy. Finally, the fouling index result generated by the tool was meticulously compared against the verified railroad track design details provided by ERDC, as depicted in
Figure 10. The findings revealed a strong alignment between the output of the tool and the specified design details, demonstrating the tool is both accurate and operational. The iterative nature of the development and testing process highlights the thoroughness and diligence applied to ensure the tool’s accuracy and functionality. Through multiple iterations and careful comparisons against verified design details, a solid foundation has been established for the NDTPro tool’s efficacy and its potential to enhance railroad track assessment practices.
4. NDTPro Testing
Two case studies have been conducted to assess the robustness of the proposed tool. The first case is the Heartland Intermodal Rail Gateway in Prichard, WV, and the second is the CSX Railroad in Russell, Kentucky.
The railroad at the Heartland Intermodal Gateway in Prichard, WV 25555, was selected to perform a full-scale testing of the software to verify its accuracy and robustness. The Heartland Intermodal Gateway is a 65-acre facility designed to transfer 20-foot and 40-foot shipping containers between railcars and trucks. The USD 32 million project was paid for with a combination of state money and a federal grant award. The facility has multiple tracks, which makes it a perfect fit for the project’s needs. The line is a double track with steel ties, and several zones are covered from the bottom to the top of the rails by a ballast layer. After a thorough manual inspection, the tracks were conclusively determined to be newly constructed and in flawless condition. Further, soil samples have been taken to perform quantitative lab-based testing on the ballast. A series of tests were performed on the soil and aggregate samples. These tests included determining the water “moisture” content of soil and rock by mass, conducting sieve analysis for both fine and coarse aggregates, assessing the amount of material in soils finer than the No. 200 sieve using the wash sieve method, and conducting particle-size analysis of soils through the hydrometer test. Additionally, the density, relative density (specific gravity), and absorption characteristics of both coarse and fine aggregates were examined. The specific gravity of samples was determined using a pycnometer. The permeability of granular soils under constant head conditions was measured, and the liquid limit, plastic limit, and plasticity index of soils were evaluated through Atterberg limits testing. Other tests included investigating the laboratory compaction characteristics of soil using standard effort, analyzing the one-dimensional consolidation properties of soils using incremental loading, and conducting direct shear tests on soils under consolidated drained conditions. These comprehensive tests confirm that the track ballast is in perfect condition.
The GPR data were collected over an approximated 2024 ft section. The section was divided into 15 segments with lengths varying from 100 ft to 300 ft with different samples per scan of 256, 512, 1024, and 2048, as presented in
Table 4. GPR data collection was performed using both a push-cart-based and hi-rail-based method, and a ground-coupled antenna with a center frequency of 400 MHz was used. The analysis results of SD using the STFT method are shown in
Table 5.
Given that the manual inspection and soil lab testing conclusively determined the tracks were newly constructed and in impeccable condition, it was a reasonable expectation to discover a clean BFI ranging from 0% to less than 1% across all the evaluated segments. Remarkably, the findings presented in
Table 4 support this expectation, as they reveal that every segment yielded a BFI value of 0%.
The outcome, where all segments displayed a BFI of 0%, not only reinforces the initial assumption but also holds substantial significance. It serves as a testament to the accuracy and reliability of the developed tool utilized for analyzing the GPR signal and determining the fouling condition. The consistent BFI values of 0% across all segments further validate the robustness of the tool’s performance. This compelling result signifies the tool’s ability to precisely assess and quantify the level of fouling in the ballast. It demonstrates the tool’s reliability in providing accurate and consistent measurements, bolstering confidence in its effectiveness for future evaluations of track conditions.
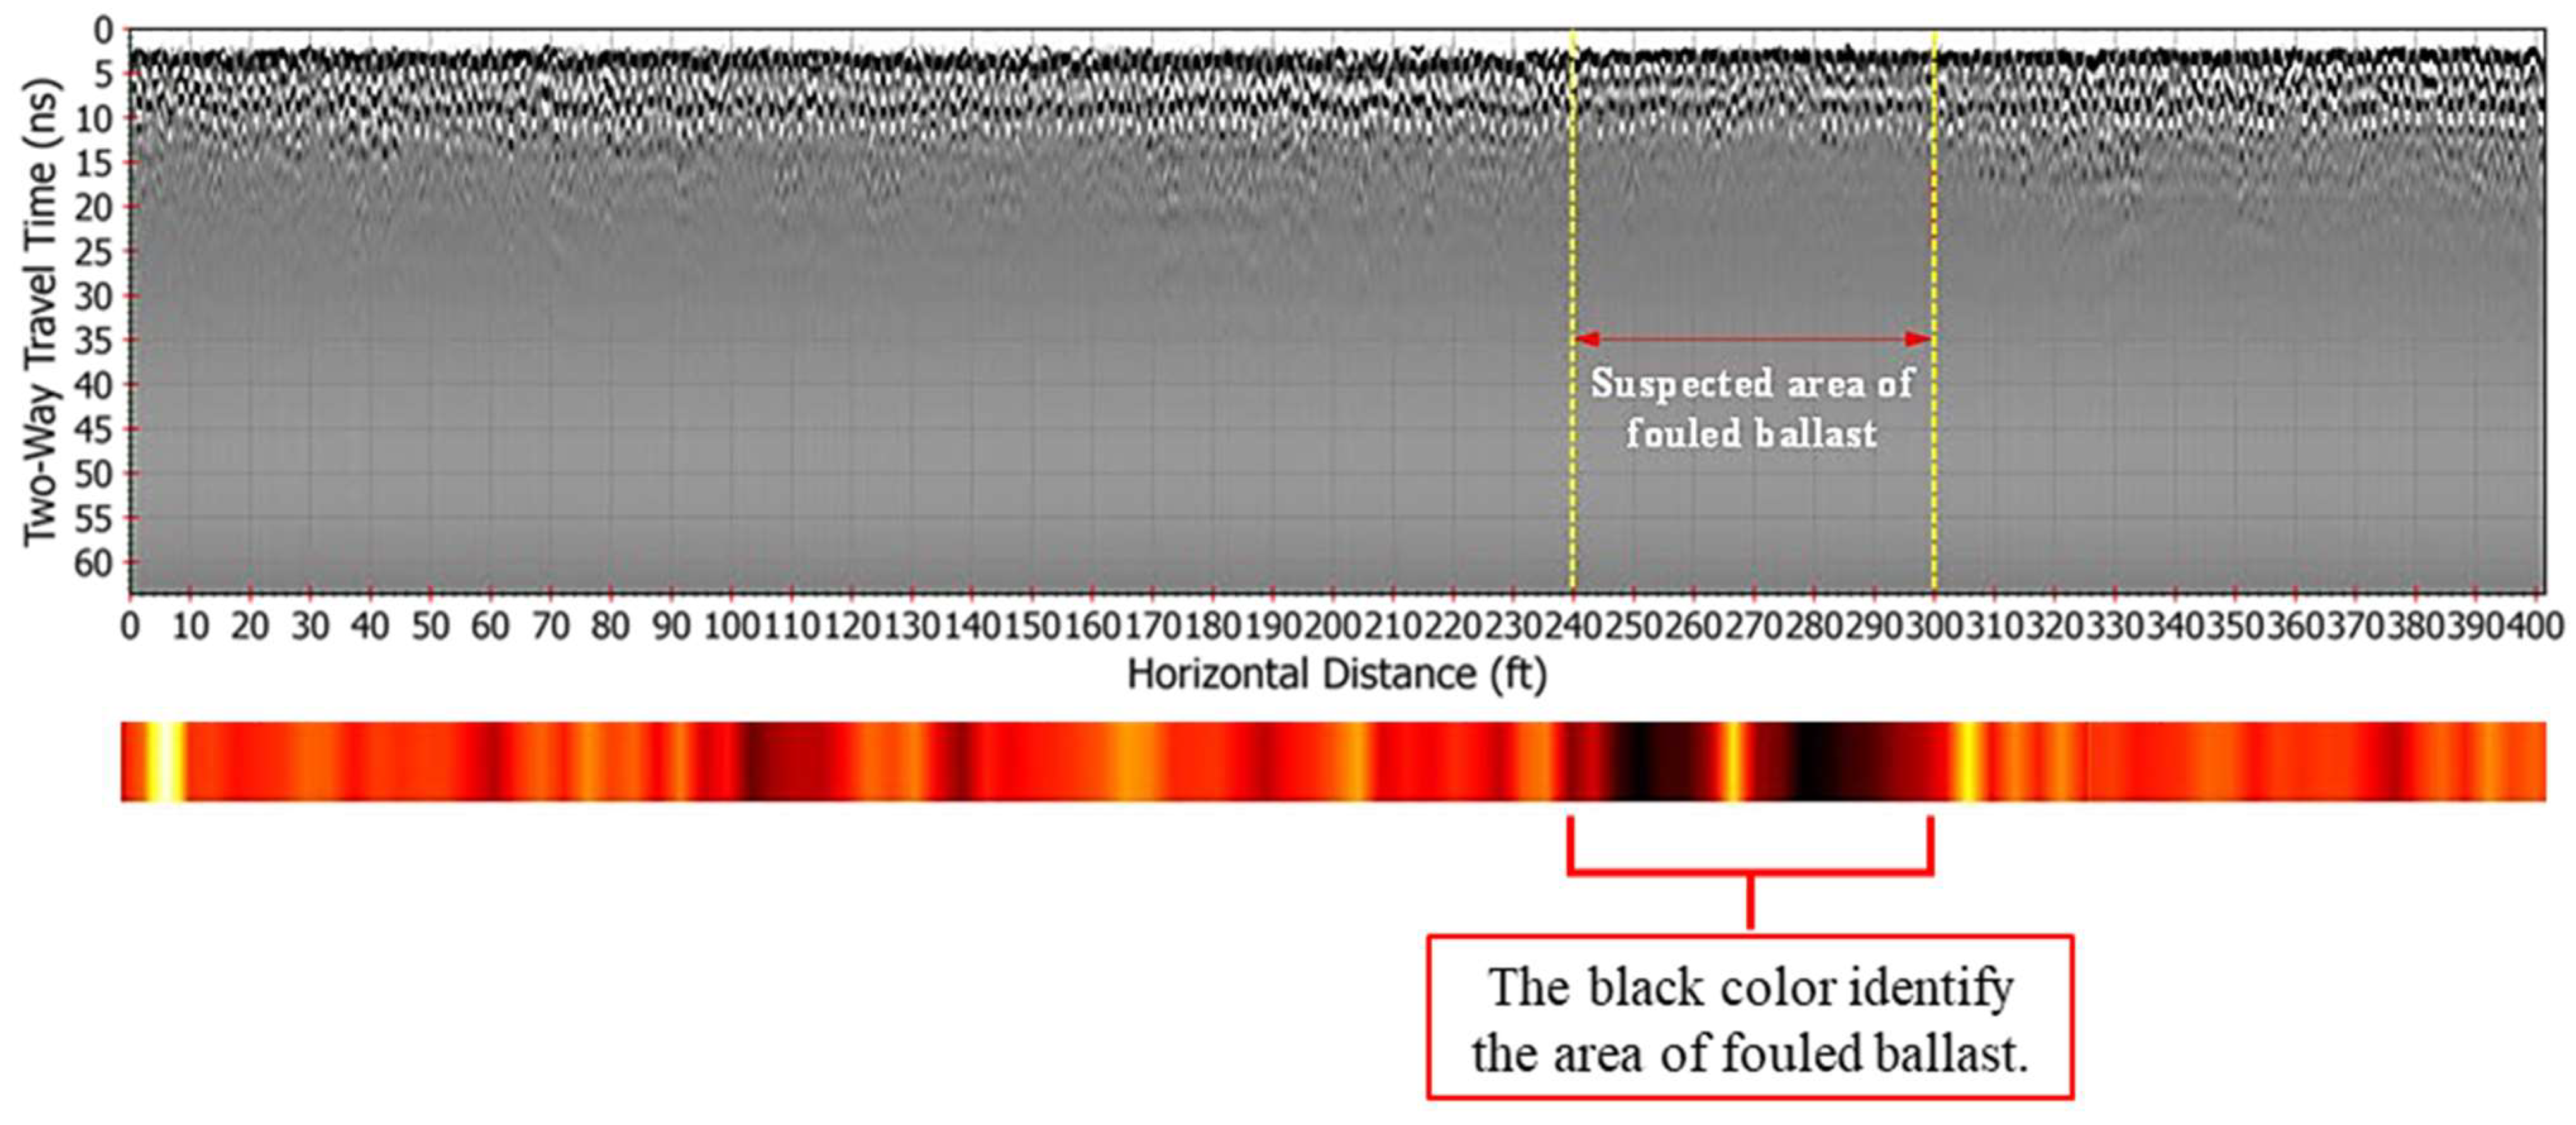
With permission from CSX corporation, GPR scanning of approximately 1.53 miles (8087 ft) of the rail track was performed at the CSX facility in Russell, Kentucky. The hi-rail collected the data with 1024 samples per trace and the SPU ranging from 2 to 10 scans per linear foot. CSX employees manually inspected the CSX rail, and they collected soil samples. Based on the inspection reports provided by CSX, some areas of the tracks have fouled ballast.
Figure 11 shows the area of fouled ballast that CSX rail inspectors have identified. The NDTPro tool was able to locate these suspected areas of fouled ballast. The tool results matched the result of the manual inspection and the soil lab results with high accuracy.
Figure 12 shows the result of the NDTPro.
5. Conclusions
Throughout this study, the development and implementation of the NDTPro tool have been thoroughly investigated. NDTPro represents a significant advancement in the field of railroad track inspection, aiming to automate the interpretation of GPR images to assess ballast fouling levels. As part of this investigation, various aspects of the tool’s development, functionality, and potential limitations have been explored.
Development of NDTPro tool: The primary focus of this research has been on the development of the NDTPro tool, which effectively automates the interpretation of GPR images for assessing ballast fouling levels. Through iterative design and testing, NDTPro has been refined to provide accurate and reliable results, streamlining the railroad inspection process.
Visualization of fouling level: NDTPro utilizes a visual representation of fouling levels, employing specific colors based on the SD of STFT and WT amplitudes. This intuitive visualization enhances the efficiency and accuracy of railroad track inspections, allowing inspectors to quickly identify areas of concern.
Validation of the NDTPro tool: Two case studies have been conducted to assess the robustness of the proposed tool. In both cases, the tool performed very well and produced accurate results that were comparable with manual inspections and soil testing.
Limitations and future directions: Despite the advancements made, certain limitations have been identified during the study. These limitations include the availability of limited experimental and control groups, which hinder a comprehensive demonstration of NDTPro’s effectiveness. Additionally, further investigation is required to address the relatively lower accuracy of data collected using the hi-rail truck compared to the push-cart method.
There are several promising avenues for future research and development regarding NDTPro looking ahead. Expanding the capabilities of the tool to encompass a broader range of rail track inspections is a key area of focus. This may involve integrating other non-destructive testing techniques or sensor data, such as ultrasonic testing or laser-based measurements, to provide a more comprehensive assessment of railroad track health. Furthermore, exploring the application of artificial intelligence and machine learning algorithms to enhance NDTPro’s interpretative abilities holds significant potential. By optimizing the identification of different types of fouling, NDTPro can further improve its accuracy and efficiency. To ensure the reliability and practical utility of NDTPro in real-world conditions, conducting long-term field trials and comparing the results with traditional inspection methods will be essential. Through continued research and development efforts, NDTPro has the potential to revolutionize railroad track assessment practices, enhancing safety and efficiency in railway operations.


 ,
, 


