Abstract
This paper presents experimental investigations on buried Glass Reinforced Plastic (GRP) pipes with a diameter of 1400 mm. The tested pipes were buried in dense, gravelly sand and subjected to traffic loads to study the effects of backfill cover on pipe deflection. The experimental program included tests on three GRP pipes with backfill covers of 100 cm, 75 cm, and 50 cm. The maximum traffic loads applied to the pipe–soil system corresponded to Iraqi Truck Type 3 (AASHTO H type). Vertical deflections of the pipes were monitored during the application of these loads. The experimental results showed that, as the backfill cover increased, the maximum vertical deflection of the pipe decreased. Deflection reductions were 38.0% and 33.3% when the backfill increased from 50 cm to 100 cm and from 50 cm to 75 cm, respectively. A 500 mm compacted backfill cover was found to be sufficient to resist traffic loads, with the vertical deflection percentage remaining below the allowable limit. Additionally, the behavior of the GRP pipes under different traffic load configurations was analyzed using finite element (FE) analysis with Plaxis 3D. The model was validated using field data. The study investigated numerous variables impacting the behavior of embedded pipes, including pipe material, pipe thickness, backfill properties, backfill depth, and the properties of the soil beneath the GRP pipe. The deflections of the steel pipe were lower than those of the GRP pipe when using different thicknesses.
1. Introduction
Since the dawn of civilization, buried pipes have enhanced people’s quality of life. Initially, these pipes were manufactured in various materials, sizes, and shapes and were used for drainage applications before the 19th century. Today, buried pipe infrastructure serves a multitude of purposes, including sewer and drain lines, water mains, highway and railway culverts, gas and liquid petroleum lines, heat distribution networks, and numerous other specialized functions [1]. The development of modern cities has often led to increased traffic congestion and limited usable space. One effective solution to these problems is to construct roadway tunnels of large diameter [2,3]. Examining the impact of backfill materials and cover depth on the performance and structural integrity of large-diameter Glass-Reinforced Plastic (GRP) pipes is vital. These pipes are commonly used in infrastructure projects because of their corrosion resistance and high strength-to-weight ratio. The main goal is to understand how different types of backfill materials and varying depths of cover affect the behavior of GRP pipes under load conditions, such as those encountered during installation and service life.
The procedure and results of the field tests on large-diameter pipes subjected to highway design truck loading were investigated [4,5,6,7,8]. Al-Mosawe and Dawood [5] performed an experimental examination of buried concrete pipes, which is the topic of the current work. To investigate the effects of backfill compaction on concrete pipes, varied surface loadings are applied to pipes buried in loose and dense, gravelly, sandy soil. To conduct the experimental investigation, 300 mm-diameter full-scale precast unreinforced concrete pipes were tested in a special soil box test facility that was set up for this project. Two loading platforms, a uniform loading platform and a patch loading platform, were utilized. Ali and Sehaib [6] used three-dimensional finite element techniques to try to understand how bedding types affect the behavior of huge-diameter GRP flexible sewer pipes. Both the BS EN 1295-1 [7] methodology and the finite element method (ABAQUS software, version 6.9) were used to perform theoretical and numerical studies. The effects of several parameters, such as backfill depth, bedding compaction, and backfill compaction, were investigated. In particular, with well-compacted backfill, a rise in the bedding compaction modulus (E′1) leads to a reduction in the stresses and displacements of the pipe due to compaction. Fattah et al. [8] utilized the most recent Plaxis-3D software 2013 version to numerically simulate the buried pipe problem using the finite element approach. Rajkumar and Ilamaruthi’s study has been chosen for reanalysis as a 3D problem because it contains all the program’s required parameters, including the elastic modulus, Poisson’s ratio, and angle of internal friction. It was discovered that the findings of vertical crown deflection for the Plaxis-3D model without geogrid are higher than those for two-dimensional plane strain by roughly 21.4%, whereas this drops to 12.1% for the model with geogrid, but generally speaking, both have the same tendency. Dawood et al. [9] evaluated earlier research and scientific theories connected to the study and design of thrust blocks and restraint joints to examine how these systems behave when subjected to thrust forces, as well as the characteristics and variables that influence how these systems behave. Because both systems have conditions that make their employment more feasibly, scientifically, and economically advantageous, it is necessary to study their behavior because they cannot be abandoned. A review of the open literature revealed a very limited number of studies focused on the backfill cover of GRP pipes, so this paper is aimed at investigating the effect of the backfill cover on the deflection of full-scale, large-diameter GRP pipes under traffic loading.
The 3D non-linear finite element analyses of a large-diameter buried pipe were discussed in previously published research [10,11,12,13]. Three assumptions of small displacement theory, time-independent response, and linearly isotropic elastic material were made in the three-dimensional model [10]. The truckload was simulated by the tire pressure acting on a finite contact area [10]. According to the principle of equivalent bending stiffness, the corrugation profile steel pipe was modeled by the plain plate beam elements and the soil by two-dimensional plain strain elements [11]. The compaction of the surrounding soil was carried out using embedment wheels and jumping jack rammers [12]. Not all components of the finite element model are necessary to achieve a realistic result. Some components can be converted into simpler geometries that can save a substantial amount of time and analysis costs [13].
Previous research has focused on studying the behavior of the backfill cover on large-diameter pipes. However, GRP pipes, particularly those with large diameters, have received comparatively less attention. A gap in the literature regarding parametric studies that consider varying pipe thicknesses, backfill properties, backfill depths, and the properties of soil under the pipe still exists. This paper deals with the experimental investigations of GRP pipes that are buried in dense conditions of gravelly, sandy soil subjected to traffic load to study the effects of the backfill cover on the deflection in the pipe. The experimental program included tests of three GRP pipes. The maximum traffic loading applied to the pipe–soil system was Iraqi Truck Type 3 (AASHTO H type). A Total Station surveying device was used to measure the vertical deflection of the pipes. Moreover, the behavior of GRP pipe under different types of traffic loads was investigated through finite element modeling using Plaxis 3D [14]. The developed model was validated using the field data. Numerous variables that impact the behavior of embedded pipes were investigated, including pipe material, pipe thickness, backfill properties, backfill depth, and the properties of soil under the pipe.
2. Experimental Work
2.1. Materials Descriptions
2.1.1. GRP Pipes
A total of three full-scale GRP pipes of 1400 mm diameter which were made by Dubai Pipes Factory were used in the present experimental work. The thickness of the pipes and other properties, as calculated by the laboratory of Al-Qadisya University, are shown in Table 1. The length of the pipes was 6000 mm.

Table 1.
1400 mm GRP Pipe Test Results According to the BS-5480 [15].
2.1.2. Backfill Soil
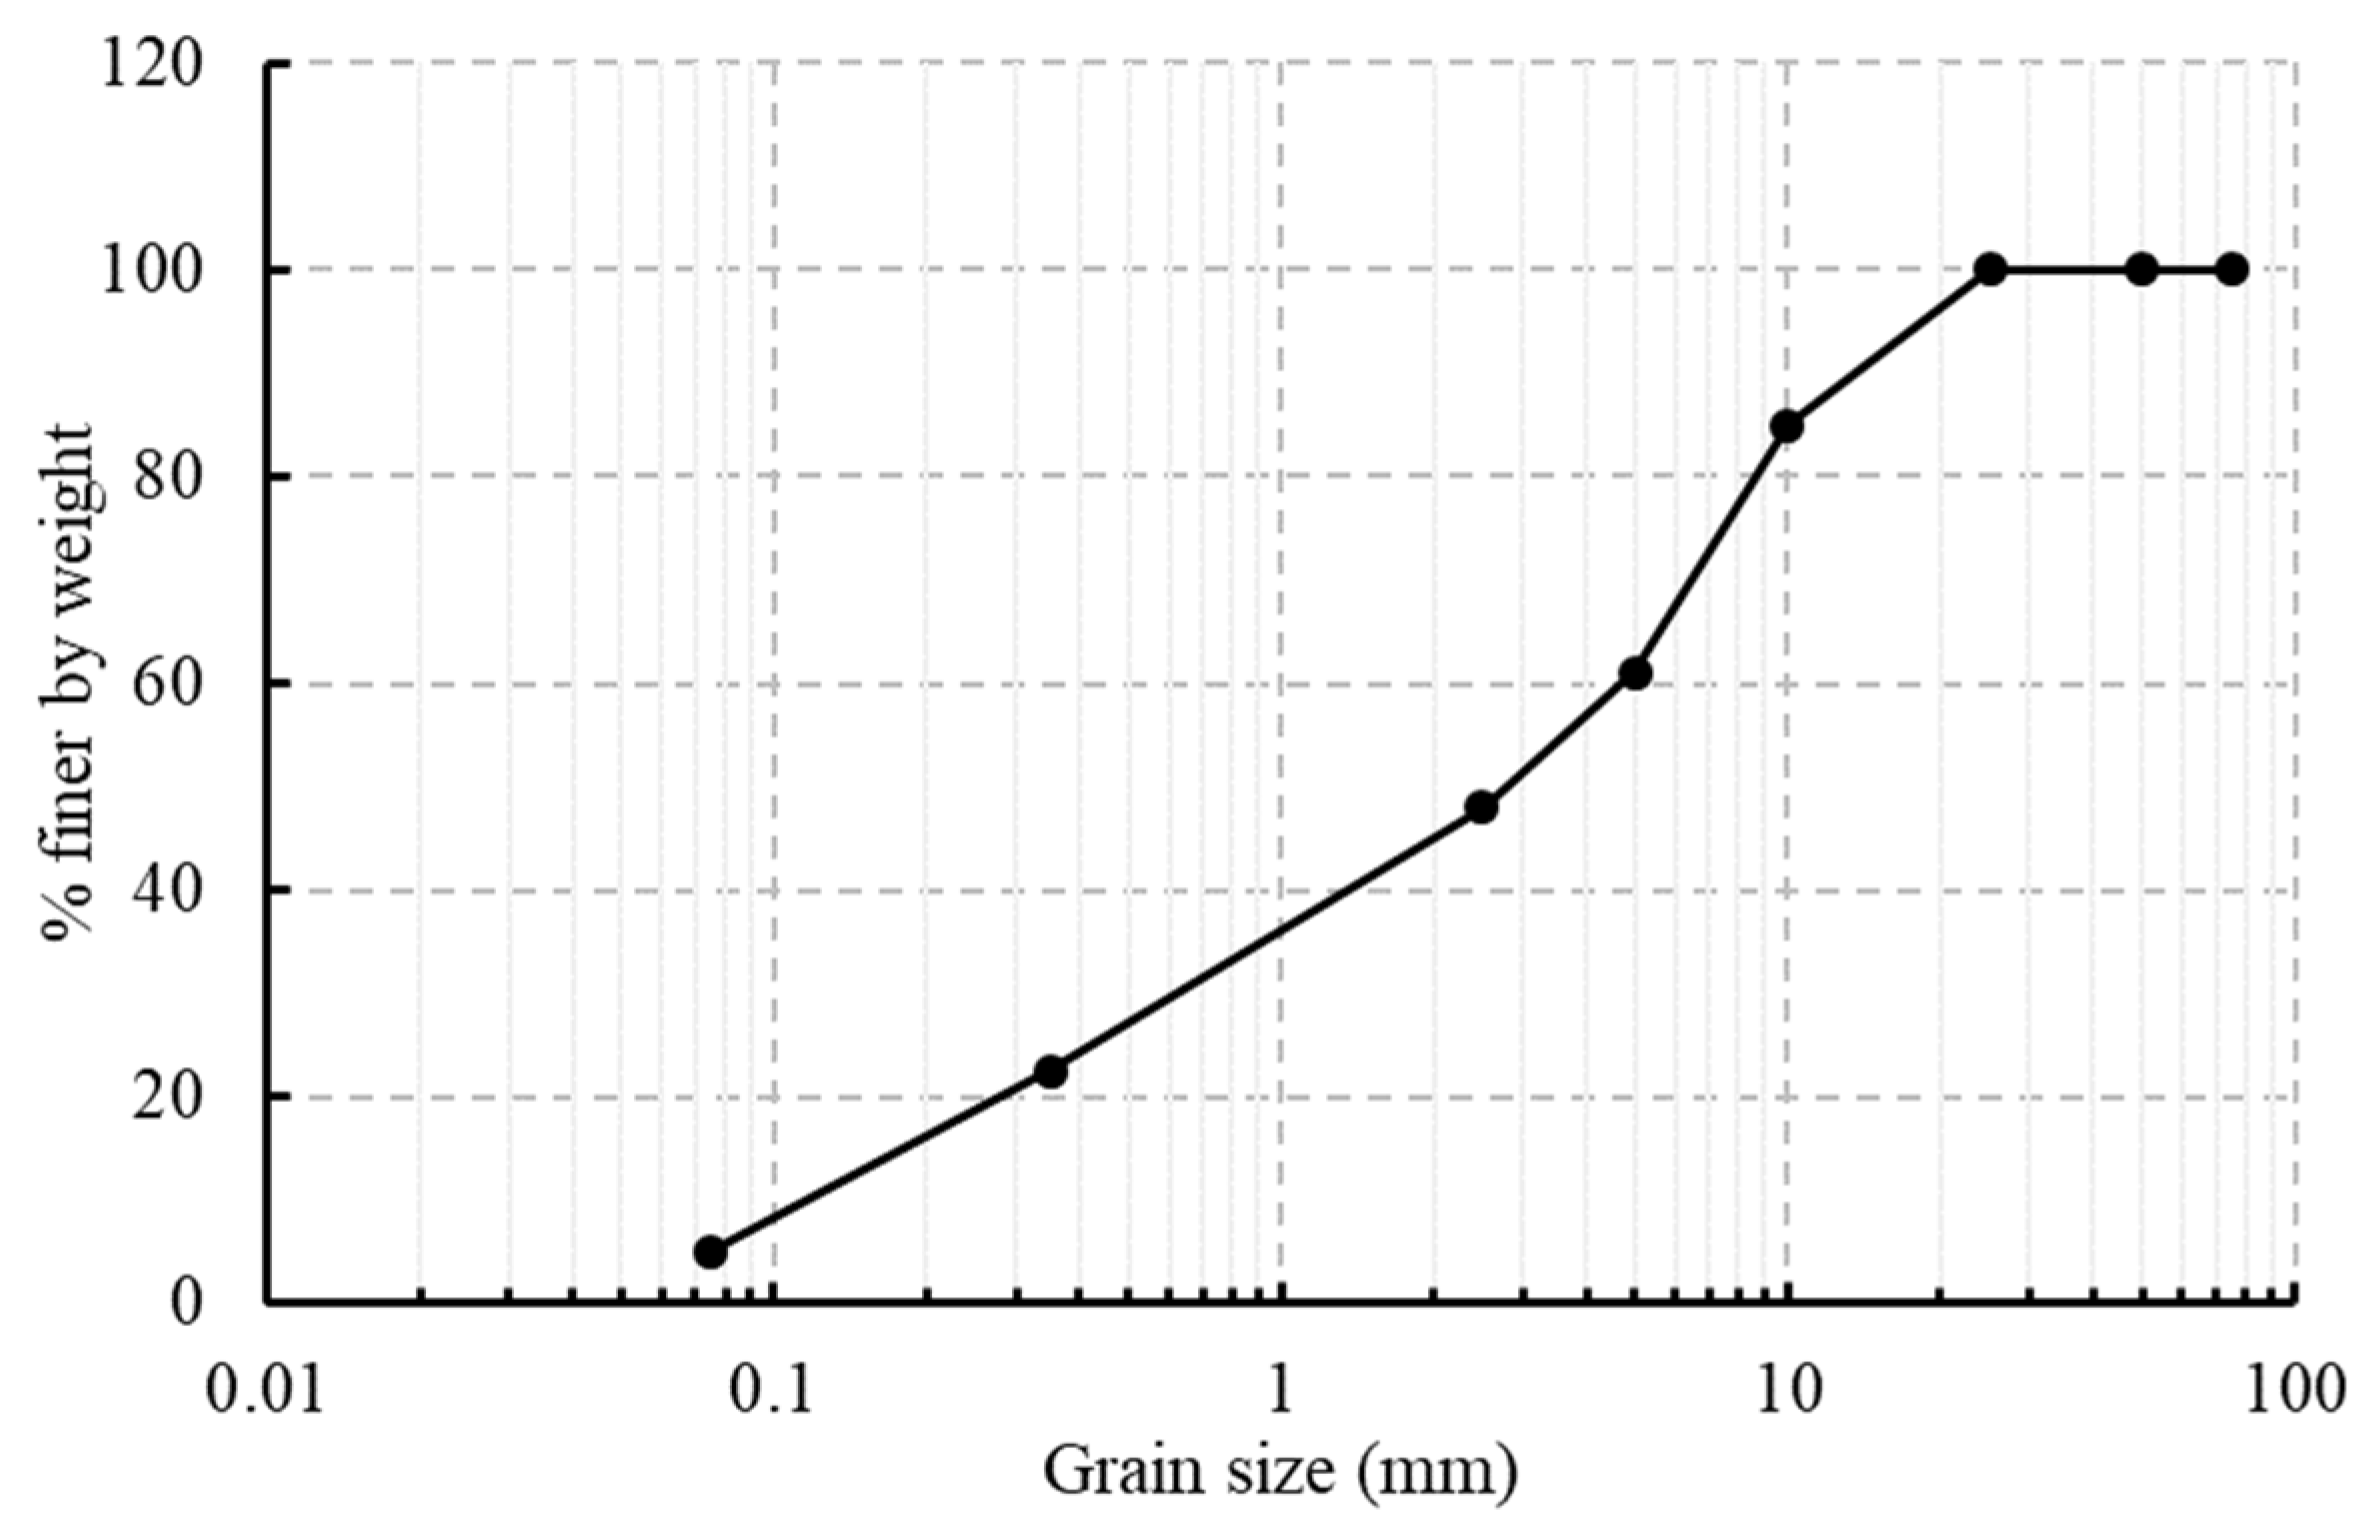
The soil utilized in this study was a relatively uniform gravelly sand. Mechanical grain size analysis was conducted on this granular material, following ASTM D422 [16] standards. The particle size distribution curve is illustrated in Figure 1. The uniformity coefficient (Cu) and the coefficient of curvature (Cc) were calculated as detailed in Equations (1) and (2), respectively, based on the data presented in Figure 1.
D10, D30, and D60 represent the particle diameters at which 10%, 30%, and 60% of the sample is finer, respectively. Based on Figure 1, D10, D30, and D60 are measured as 0.12 mm, 0.6 mm, and 3.25 mm. With a uniformity coefficient (Cu) of 27 and a coefficient of curvature (Cc) of 0.92, the soil is classified as SP (poorly graded sand with gravel) according to the Unified Soil Classification System (USCS). It is further classified as A-1-b under AASHTO standards [17]. According to Iraqi standards, this soil falls under granular based material Type C, as detailed in Table 2. Additionally, it meets the soil stiffness class SC2 requirements of ASTM D3839 [18]. These classifications are summarized in Table 2.
Table 2.
Soil Classifications.

Figure 1.
Grain size distribution for granular material.
Figure 1.
Grain size distribution for granular material.
2.2. Description of the Equipment Used
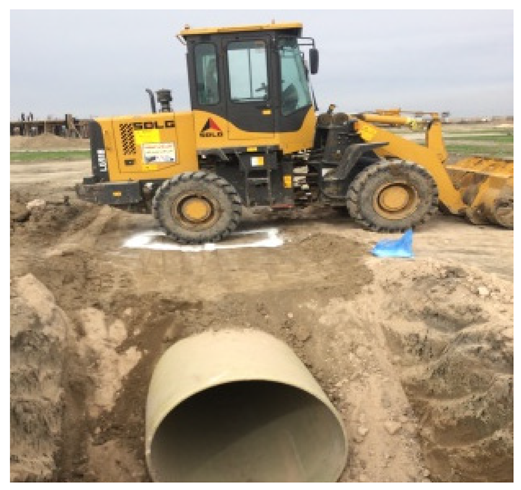
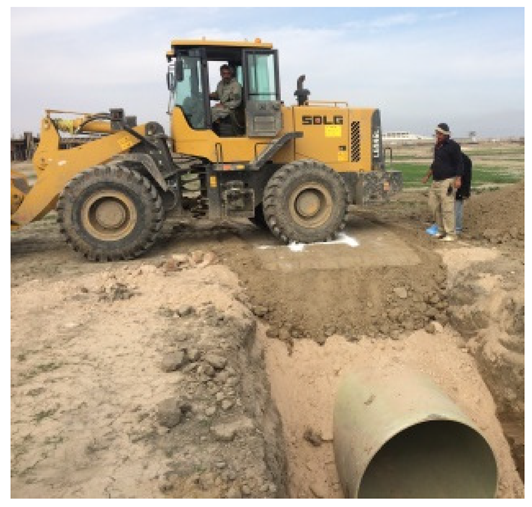
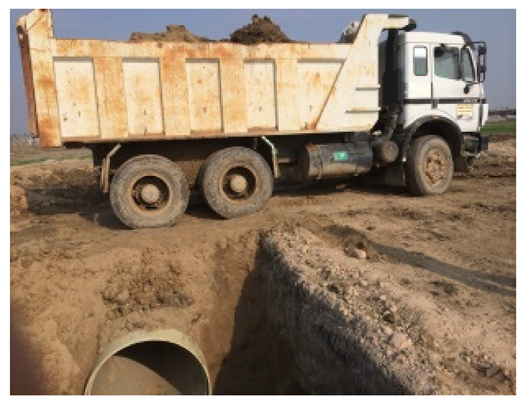
A Hitachi excavator size 170 and two SDLG shovels were used in the field excavation work to put down the subbase, place the pipes, and then complete the backfill over the pipes. A double drum vibratory roller was used to compact the bottom of the trench (natural ground), the bedding layers, and the layers of the earth fill. A plate compactor was used to compact the layers of the subbase between the pipes and the wall of the trench and the subbase layers above the trench.
2.3. Description of Devices and Tools
A Total Station Topcon Es-600g (Shanghai Galaxy International Trade Co., Ltd., Shanghai, China) was used to locate the test points inside the pipes and read the displacements during the tests. To ensure the level of the bottom of the trench, bedding layers, and backfill layers, a Nikon AE-7 auto level (Nikon, Tokyo, Japan) was used. The auto-level features include waterproofing and nitrogen filling, which ensure functionality even in the wettest conditions. A 5 m metal measuring tape was used to measure the width of the trench, ensuring the pipes were laid in the center of the trench and locating the test points inside the pipes for the vehicle’s tires.
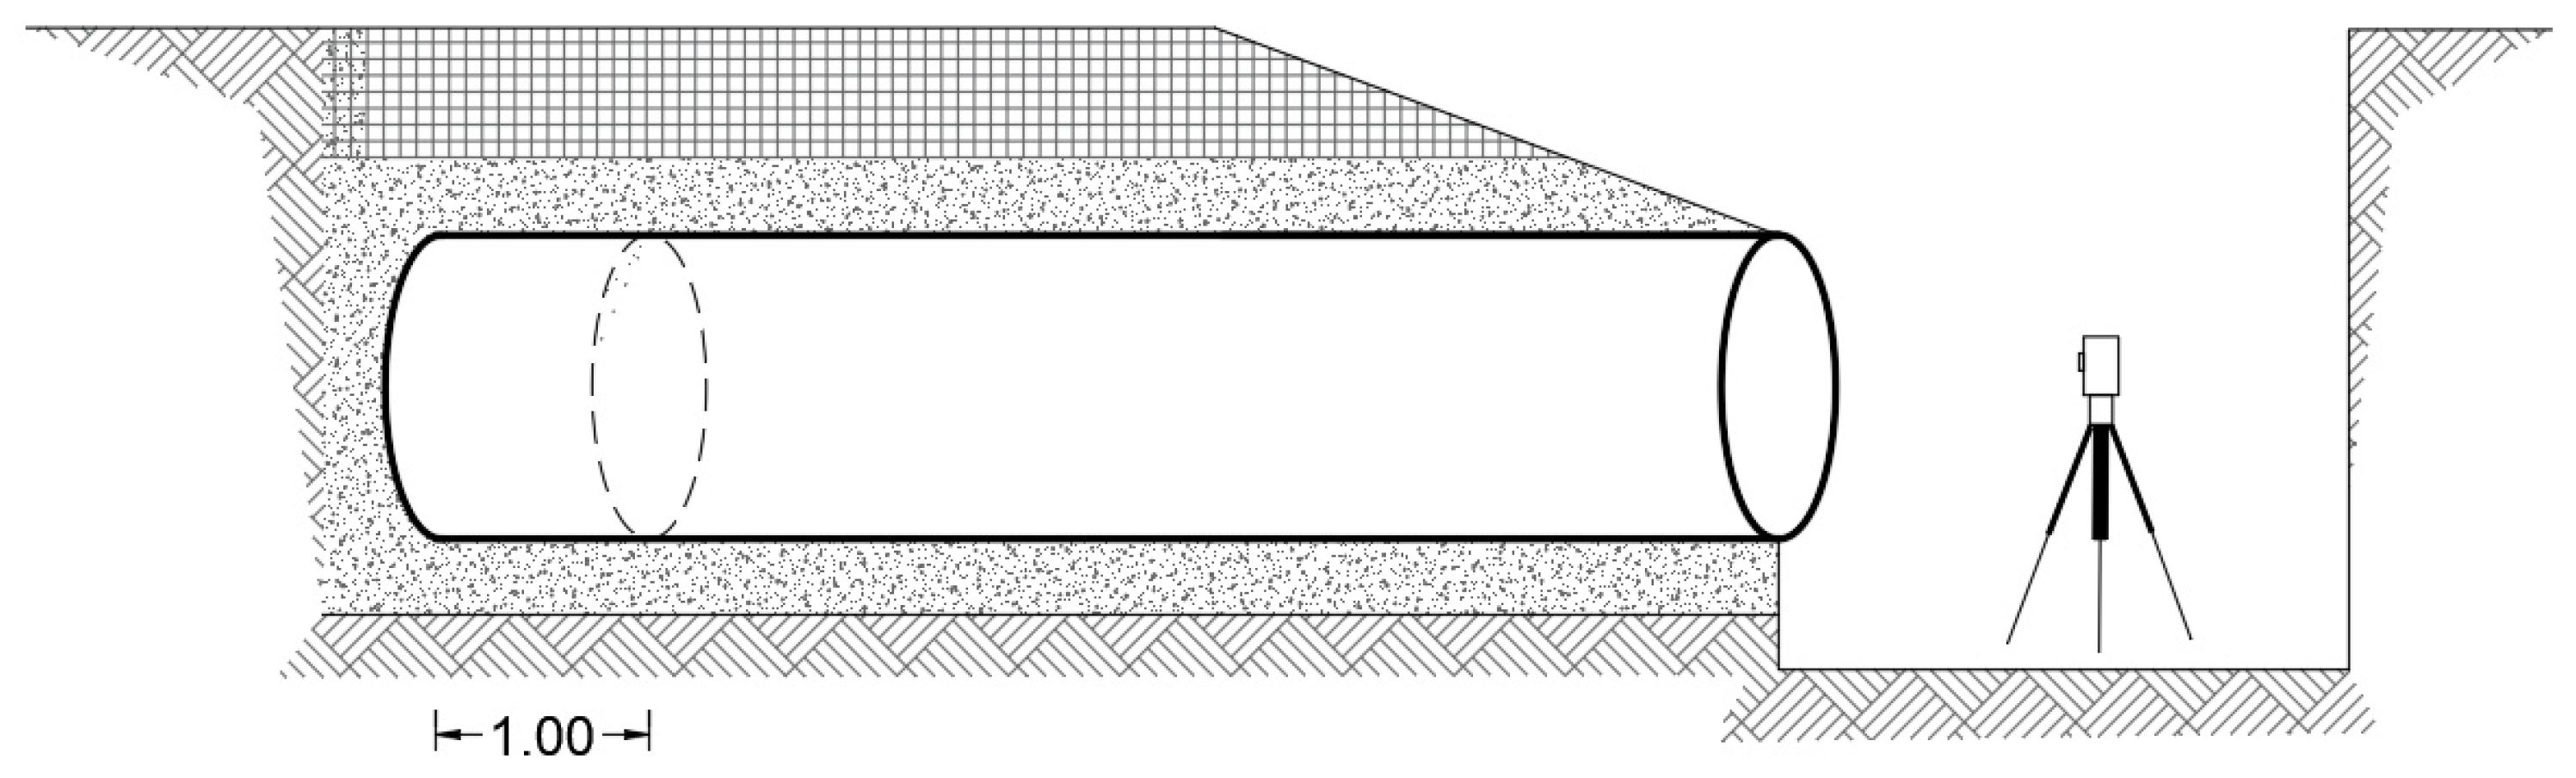
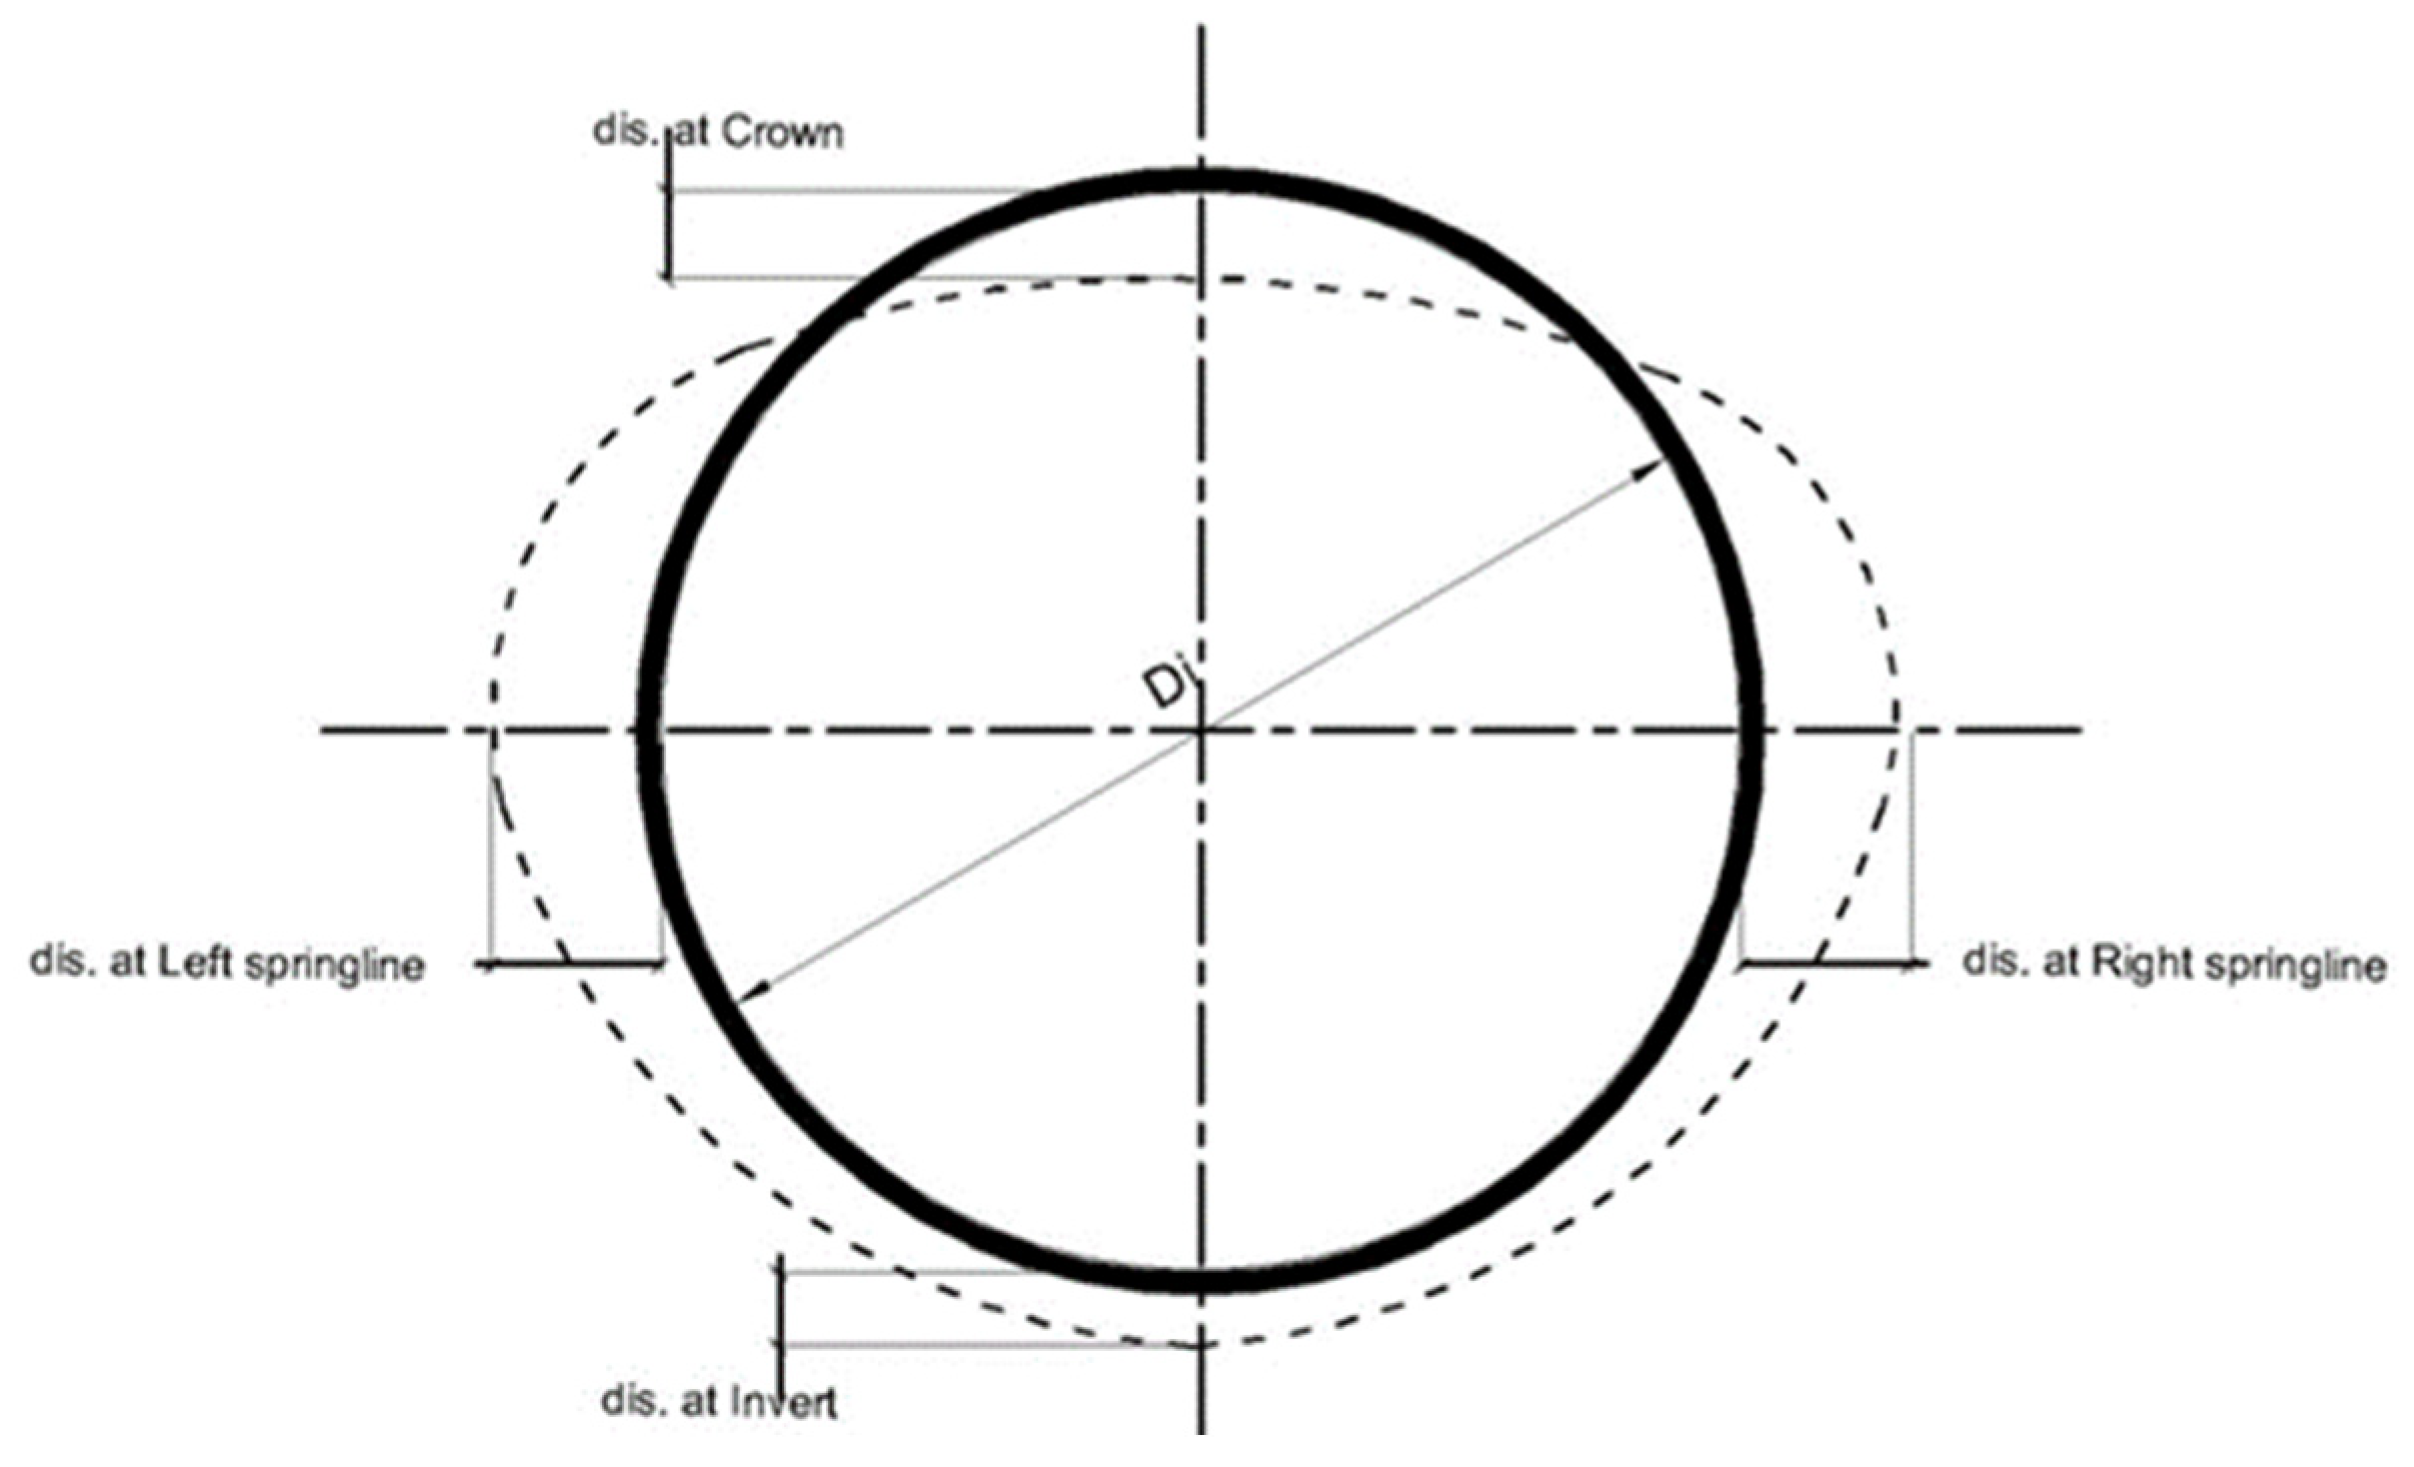
Pins in different sizes were pasted with epoxy on the test points inside the pipes. The ends of these pins were the target of the total station reading. A total of 4 pins were used for every pipe and they were placed at the crown point, invert point, left springline point, and right springline point. All of these pins were located 1 m from the far pipe end, as shown in Figure 2.
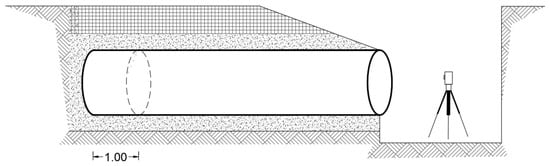
Figure 2.
The pin location 1 m from the far pipe end.
2.4. Compaction Control of Backfill Soil
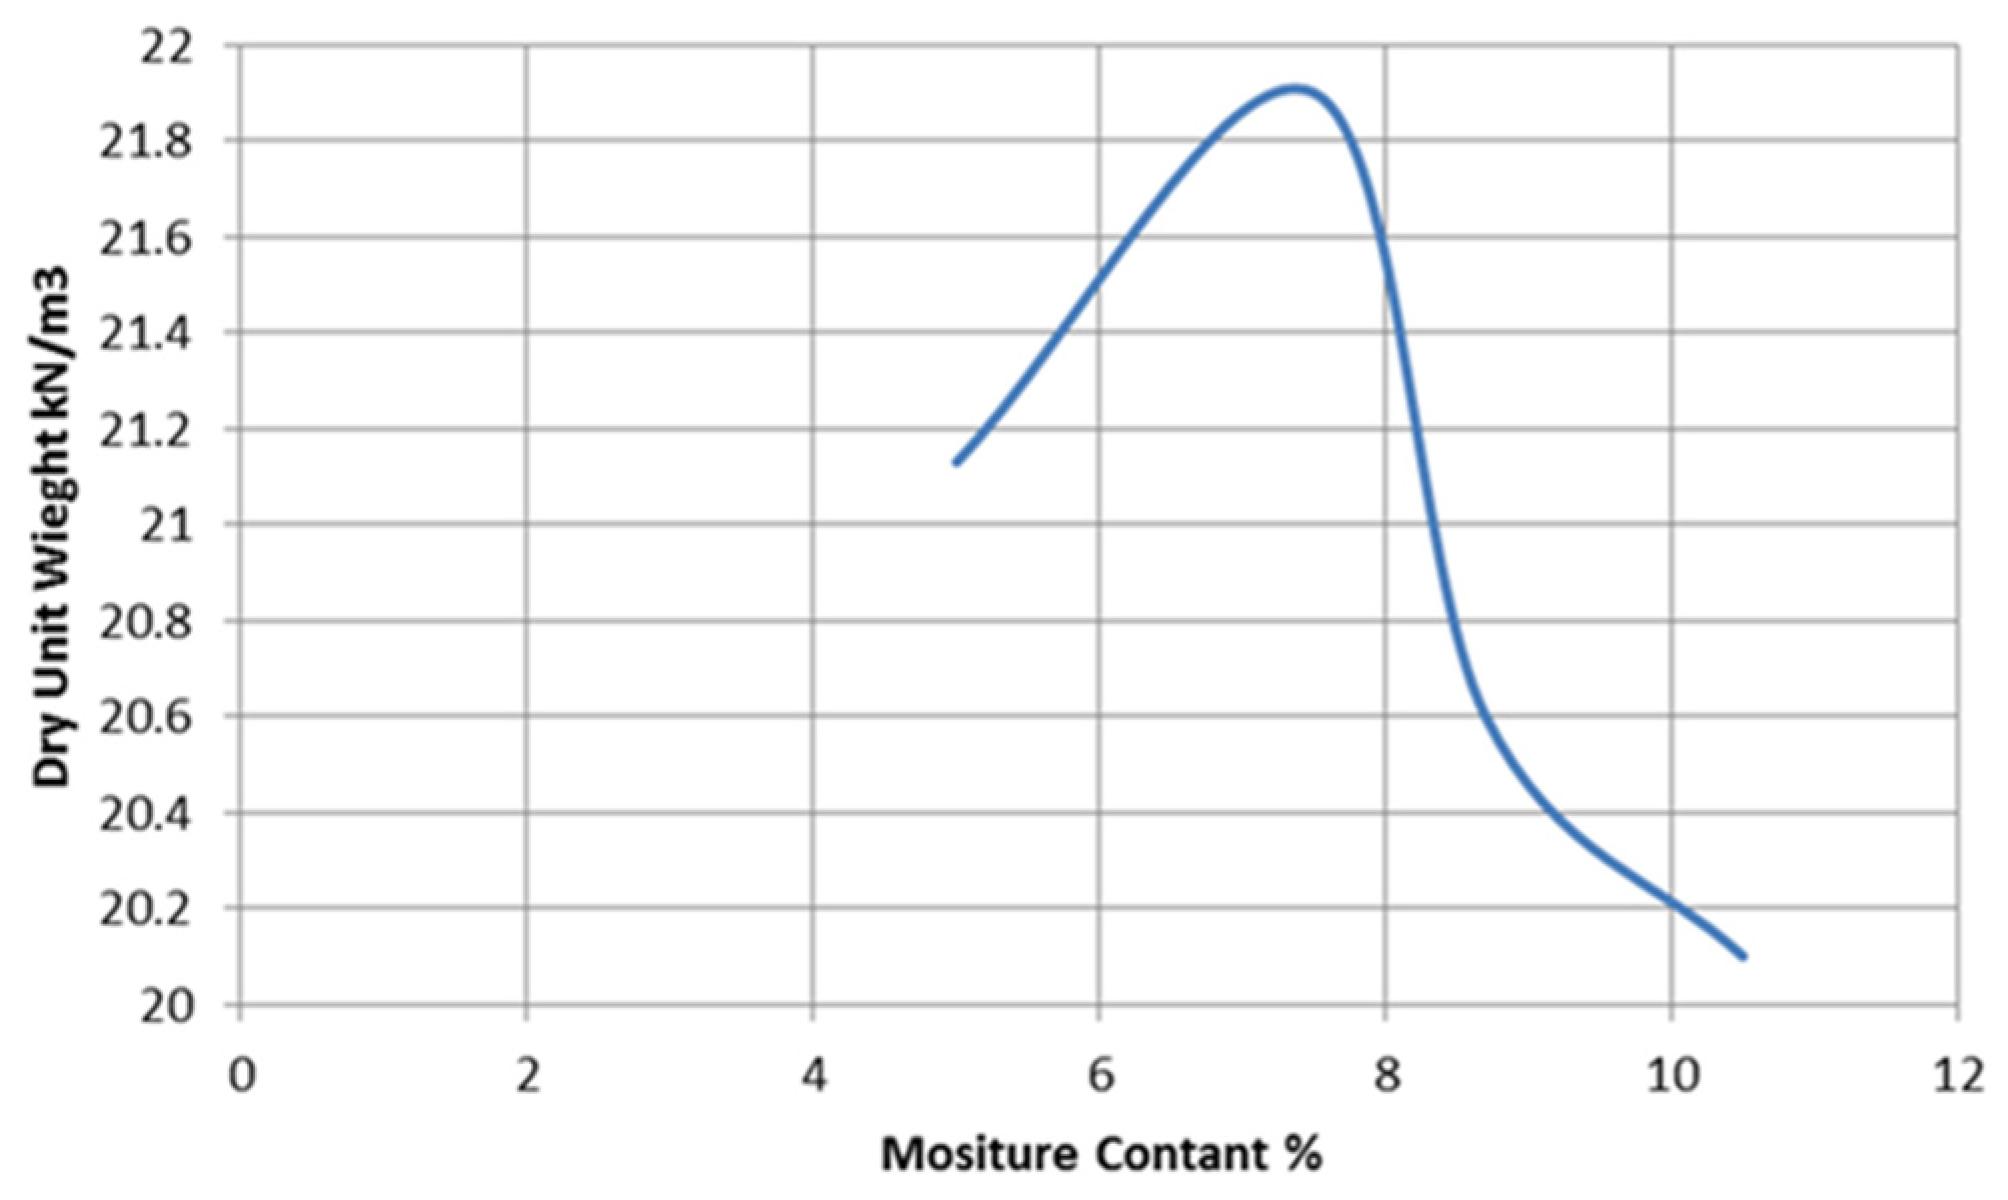
In geotechnical engineering, it is standard practice to use the dry density of compacted fill to control field compaction operations. To determine this, a standard Proctor Density Test (AASHTO T-90 [21] or ASTM D698 [22]) or a Modified Proctor Compaction Test (AASHTO T-180 [23] or ASTM D1557 [24]) is performed on the soil to find its maximum dry density. The target dry density for field compaction is then specified as a percentage of this maximum dry density. In this study, the compaction characteristics of the test soil were assessed using the Modified Proctor Test, AASHTO T-180 [23]. The tests were conducted using a mold with a diameter of 150 mm and a height of 115 mm. Six compaction tests were carried out to determine the moisture–density relationship of the backfill soil. The maximum dry unit weight obtained was 21.9 kN/m3 with an optimum moisture content of 7.5%, as illustrated in Figure 3. The same backfill material was compacted under different amounts of compaction energy using the compaction tools. The compaction is expressed as a compaction degree as a percentage ratio between dry field density and the maximum dry density at the laboratory.
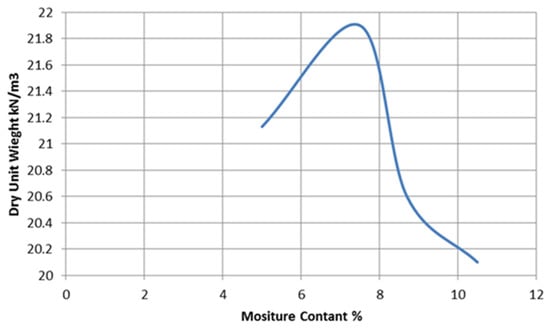
Figure 3.
The representative compaction curve (water content versus dry unit weight).
2.5. Applied Load
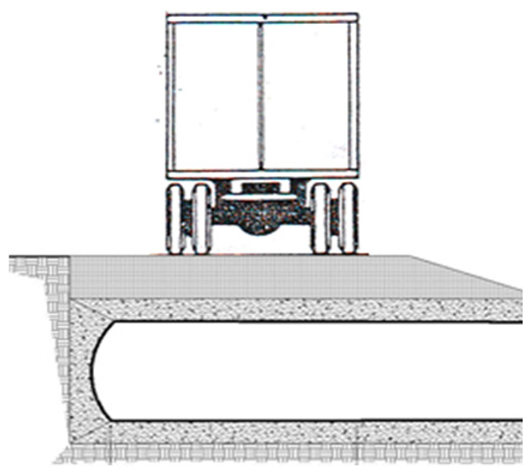
The load system used in this study was traffic load, which includes a small shovel, large shovel, truck (type 2), and truck (type 3), according to Iraqi specifications. With the use of these loads, it was possible to understand the real behavior of the GRP pipe under exact traffic load. The Iraqi State Commission for Roads and Bridges assumes that the distribution of the truckload is as shown in Figure 4. The same ratios between axles were used when the total weights were different. Five loading stages were used, as shown in Table 3.
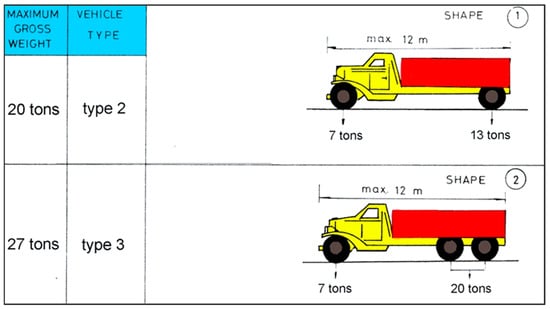
Figure 4.
Legal axle and gross weight permitted on motor vehicles in regular operation in Iraq.
Table 3.
Details of Loading Types.
2.6. Installation Method of GRP Pipes
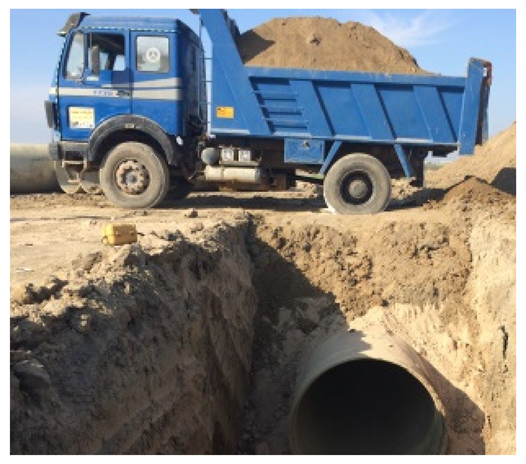
Figure 5 illustrates the installation method of GRP pipes used in the experimental work. The process began with trench excavation using an excavator, ensuring the bottom of the bedding met the required level and design specifications. The trench width was set to the pipe diameter plus 900 mm (D + 900 mm). Next, the trench bottom was compacted, and a 300 mm thick layer of subbase bedding material was placed. The bedding was then leveled and compacted. Subsequently, the GRP pipe was carefully positioned in the trench. Granular material was placed around the pipe and compacted, paying particular attention to the haunch area to eliminate gaps and enhance the pipe’s stiffness. Finally, the granular material was added above the pipe and compacted until it reached ground level.
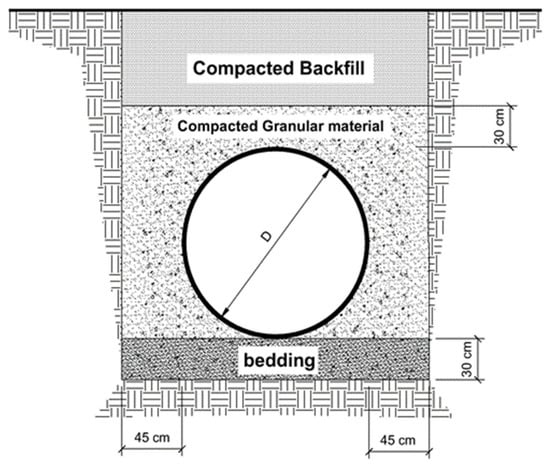
Figure 5.
Installations and backfilling method.
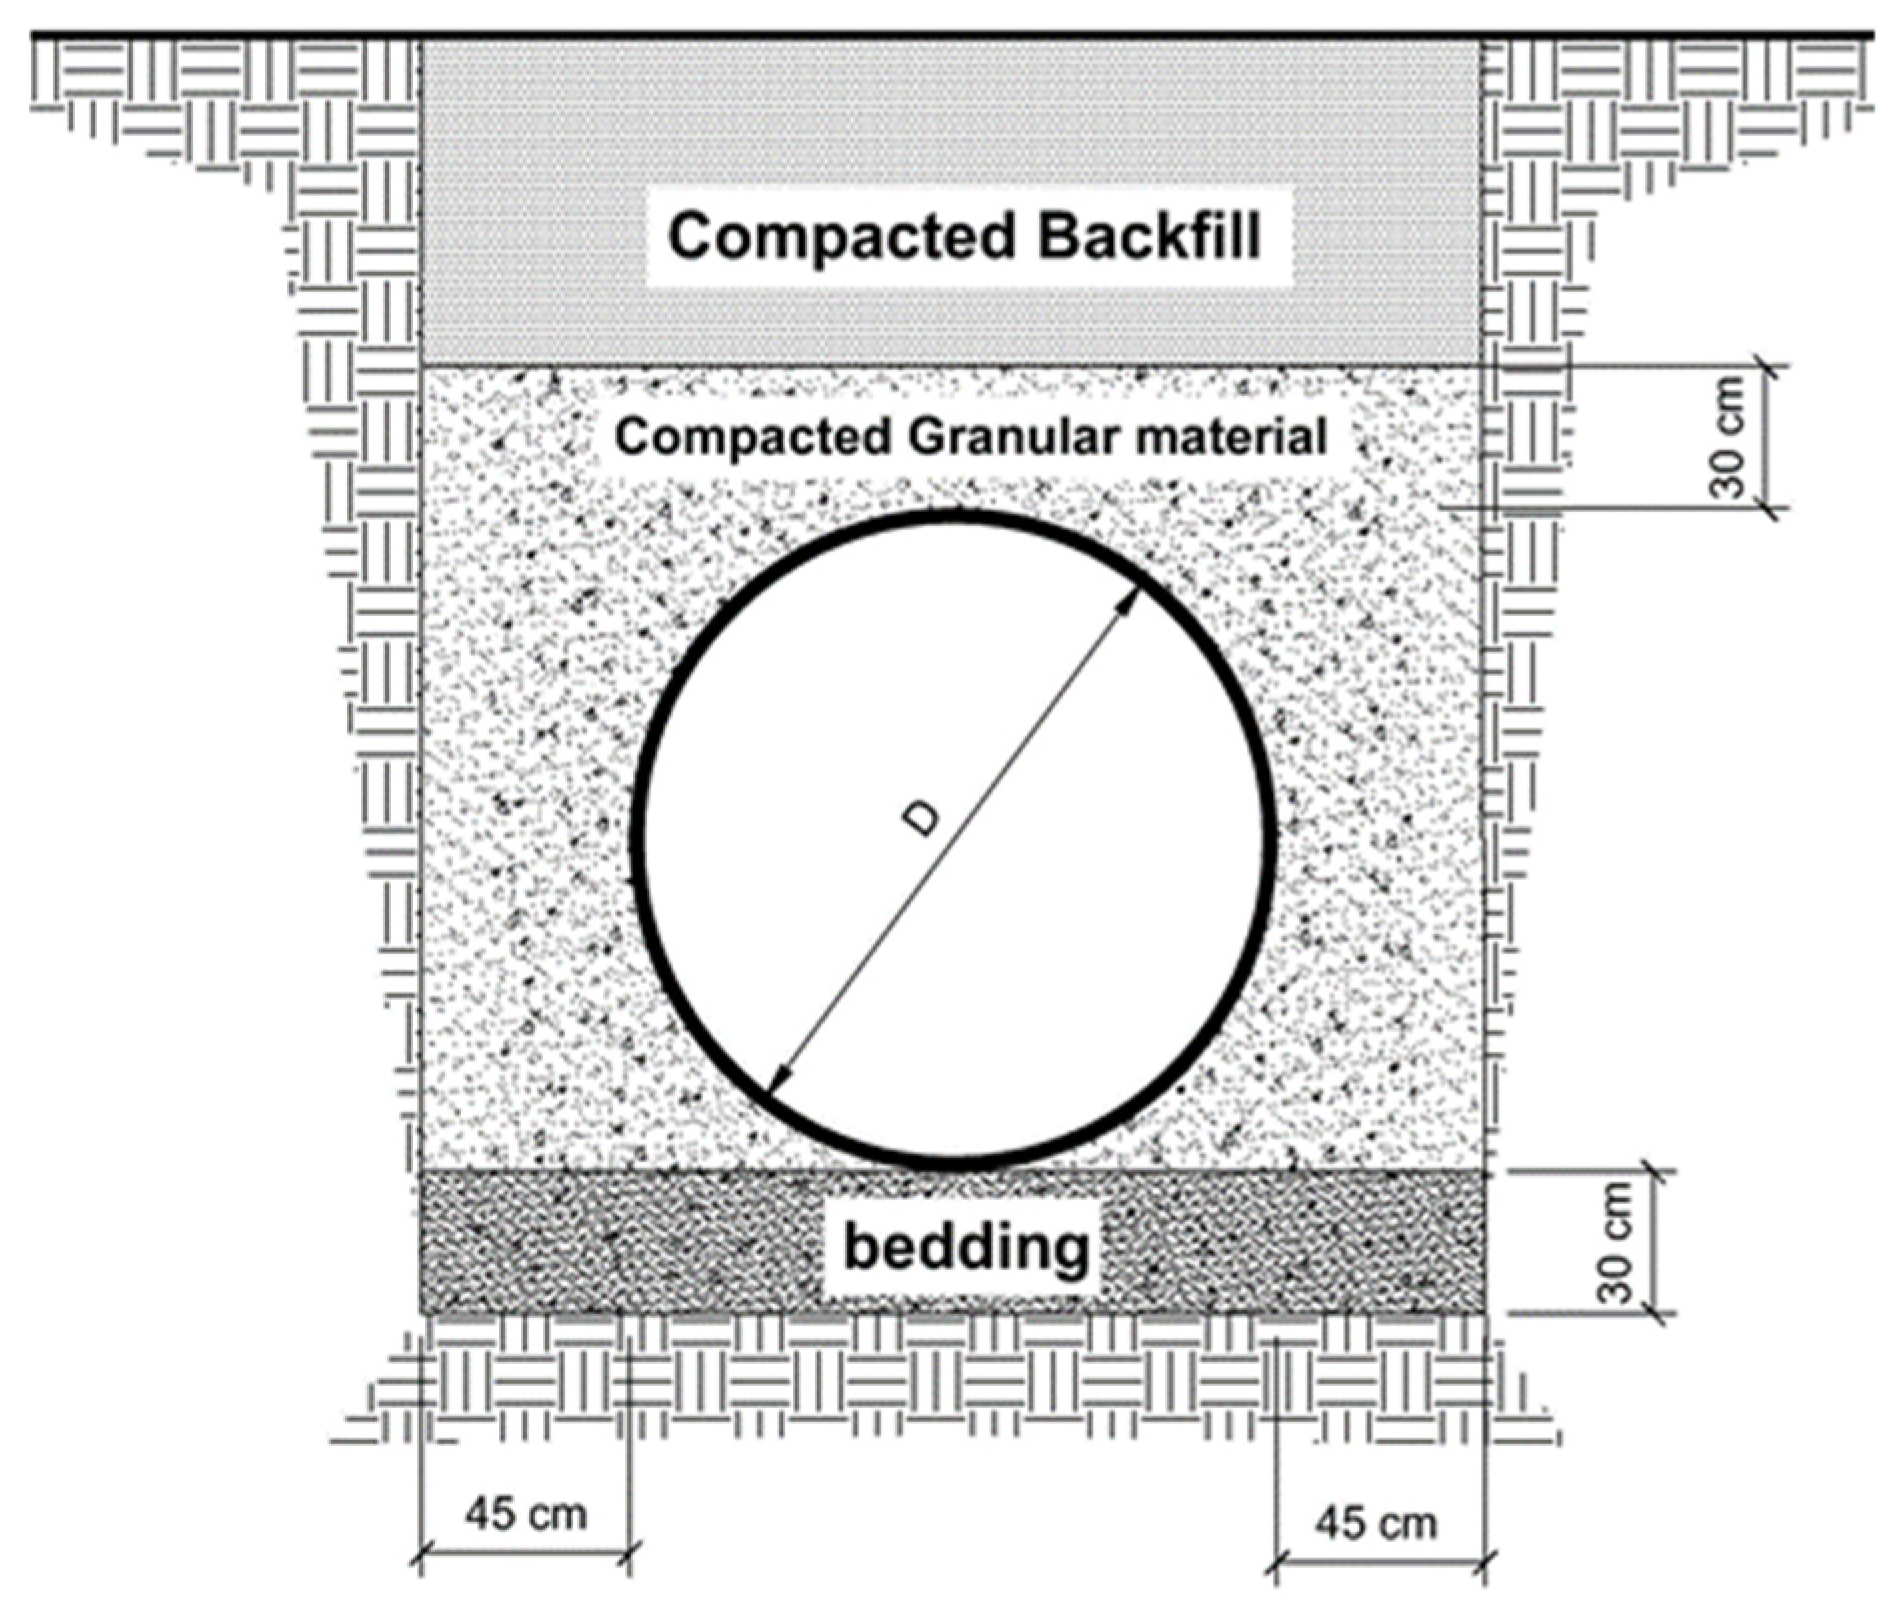
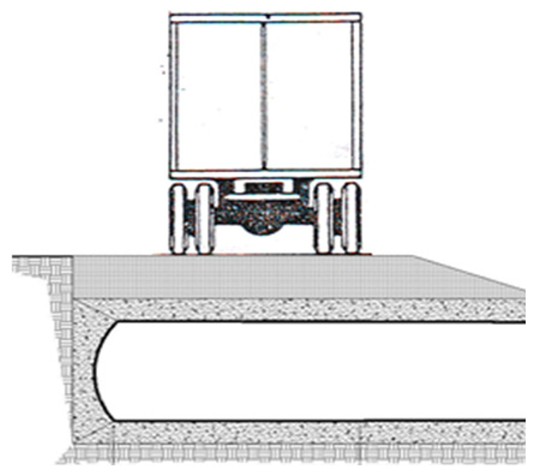
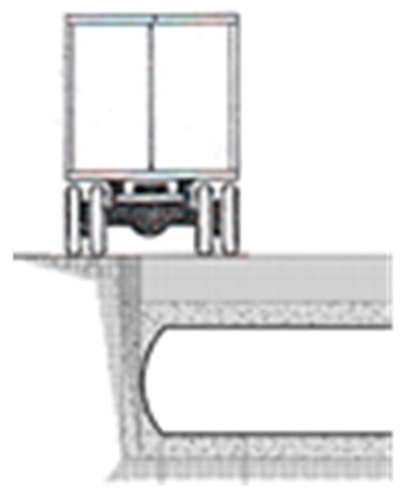
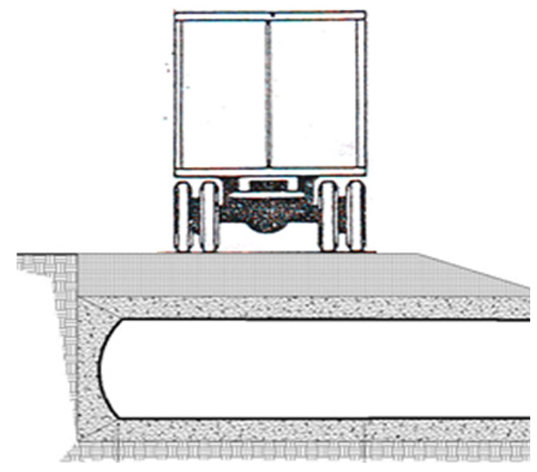
2.7. Test Variable
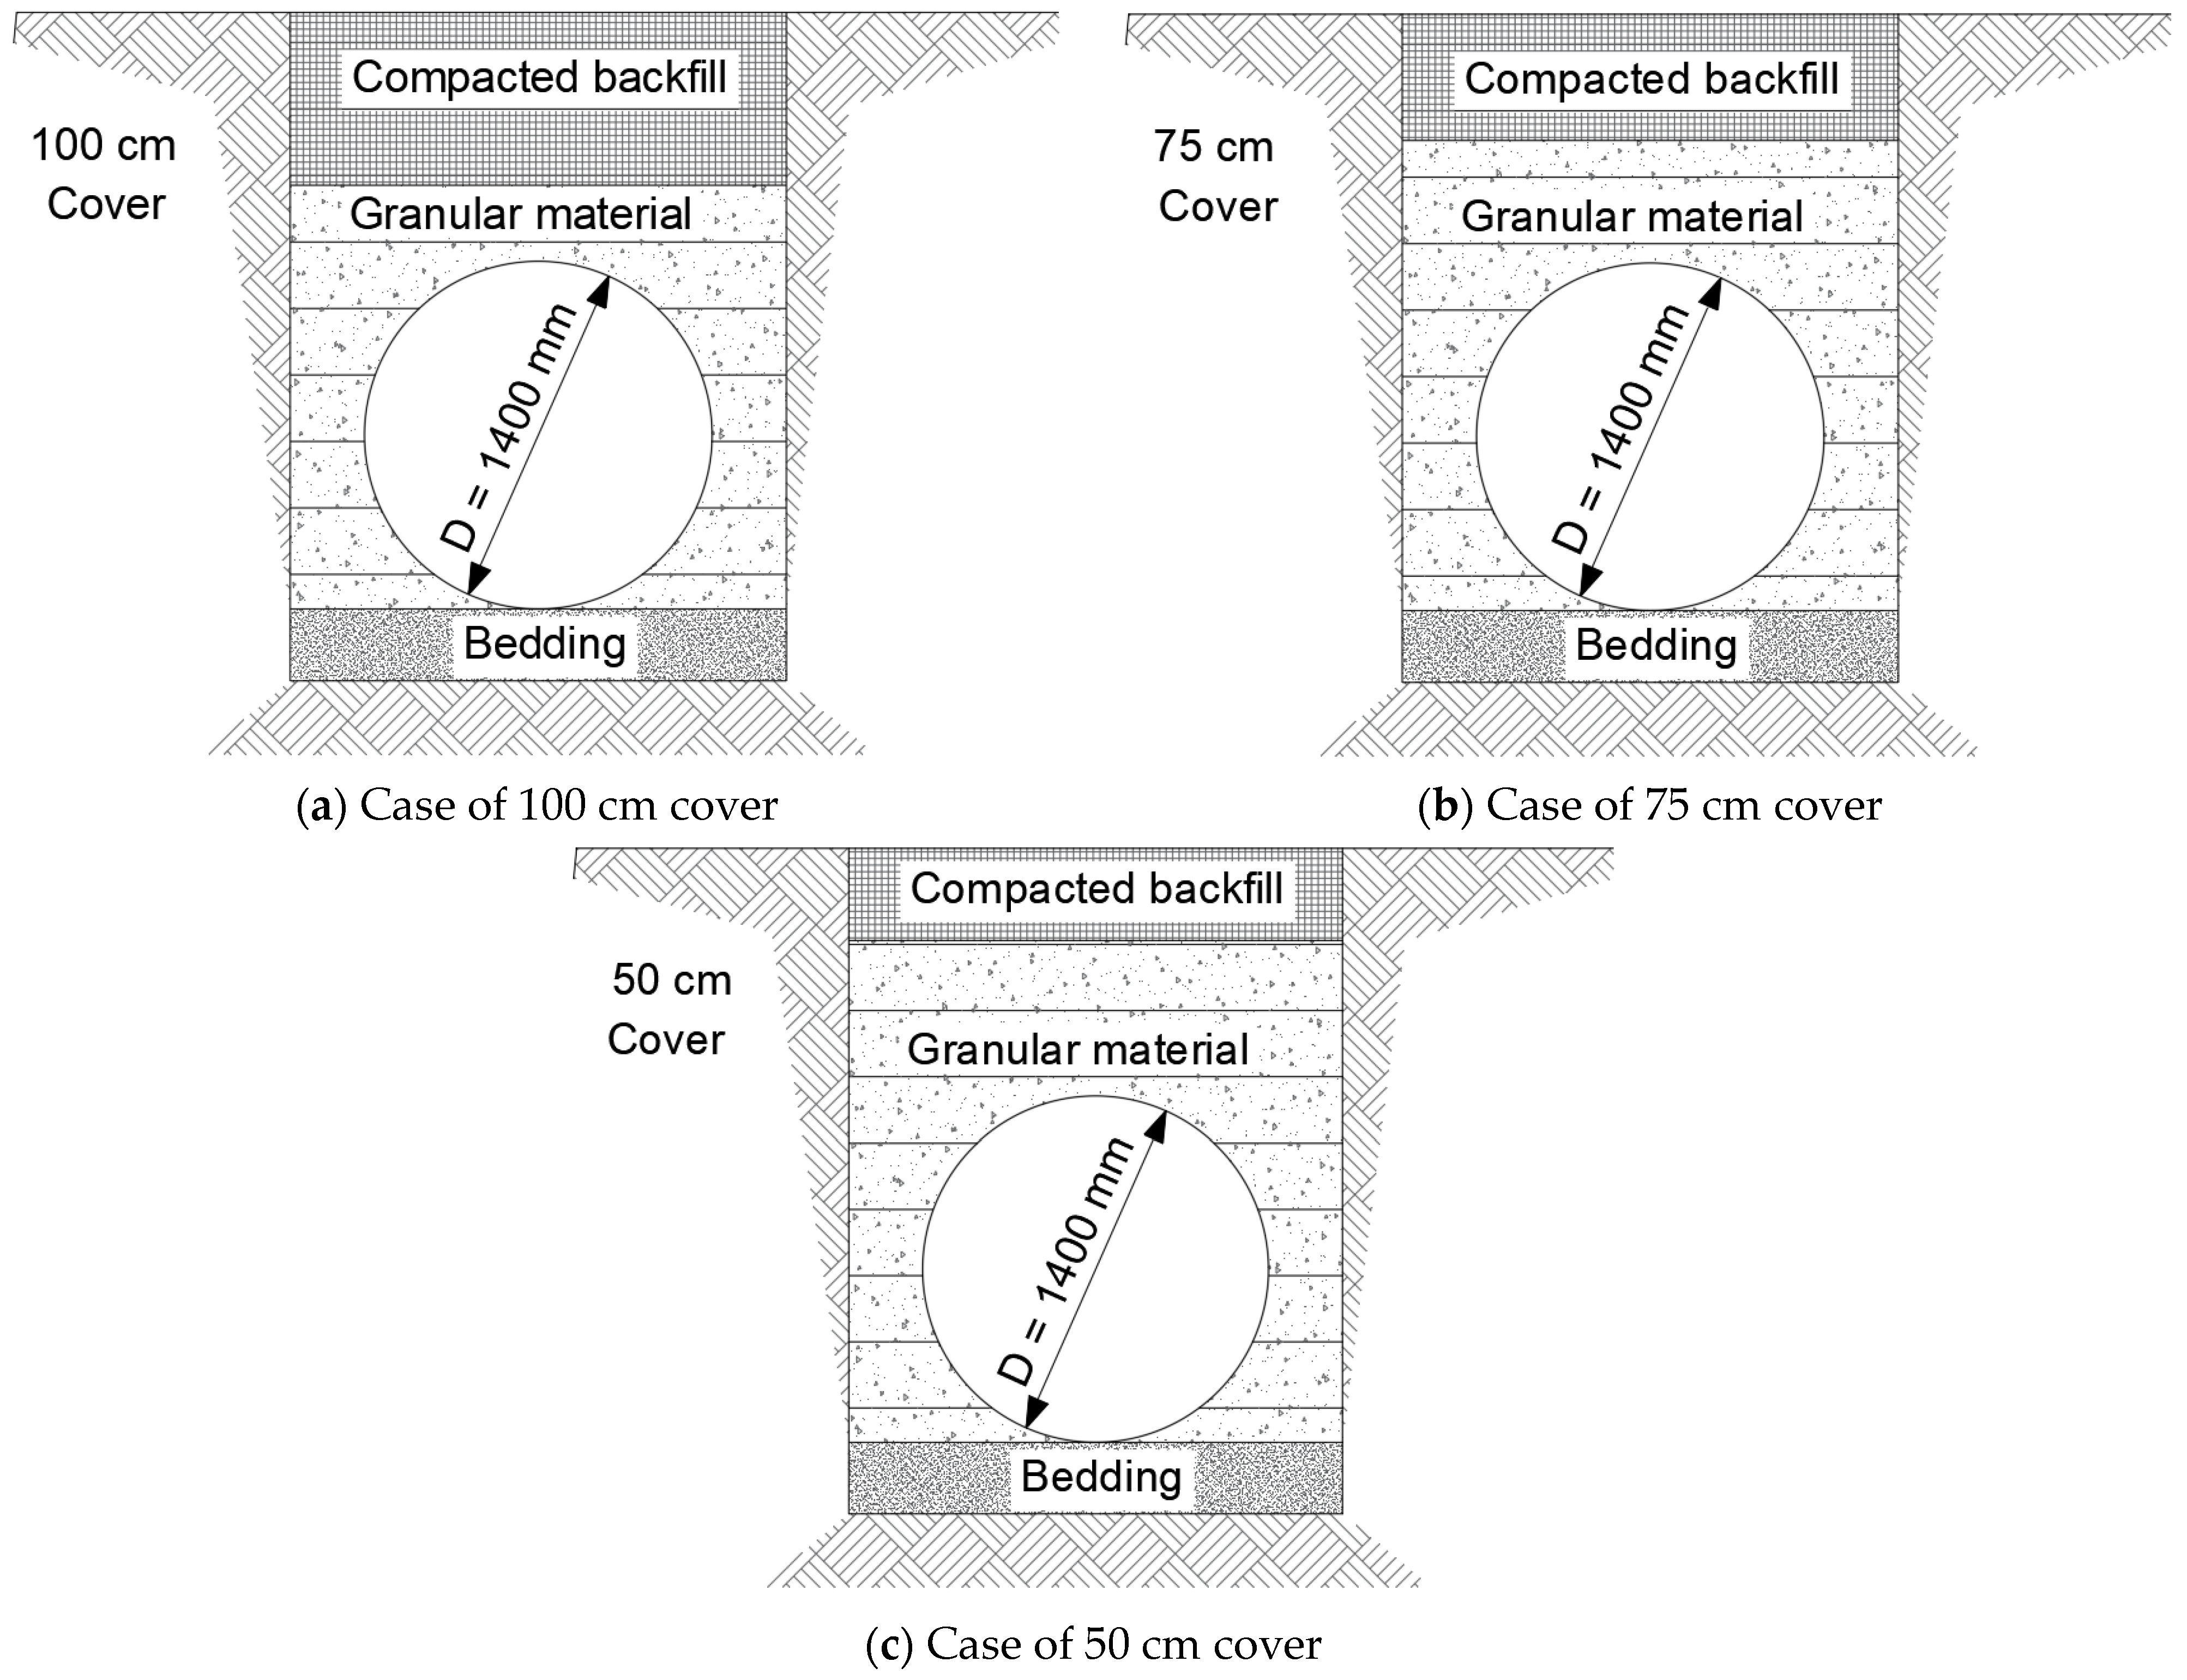
The sole test variable in this study was the backfill cover thickness, as depicted in Figure 6. Each of the three tests was conducted under the traffic loadings specified in Table 3.
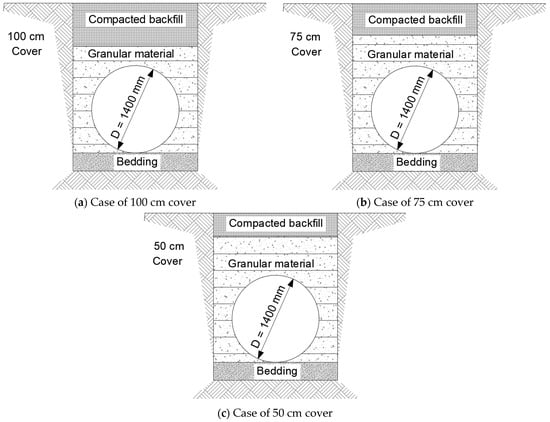
Figure 6.
Test variables.
3. Analysis of Experimental Results
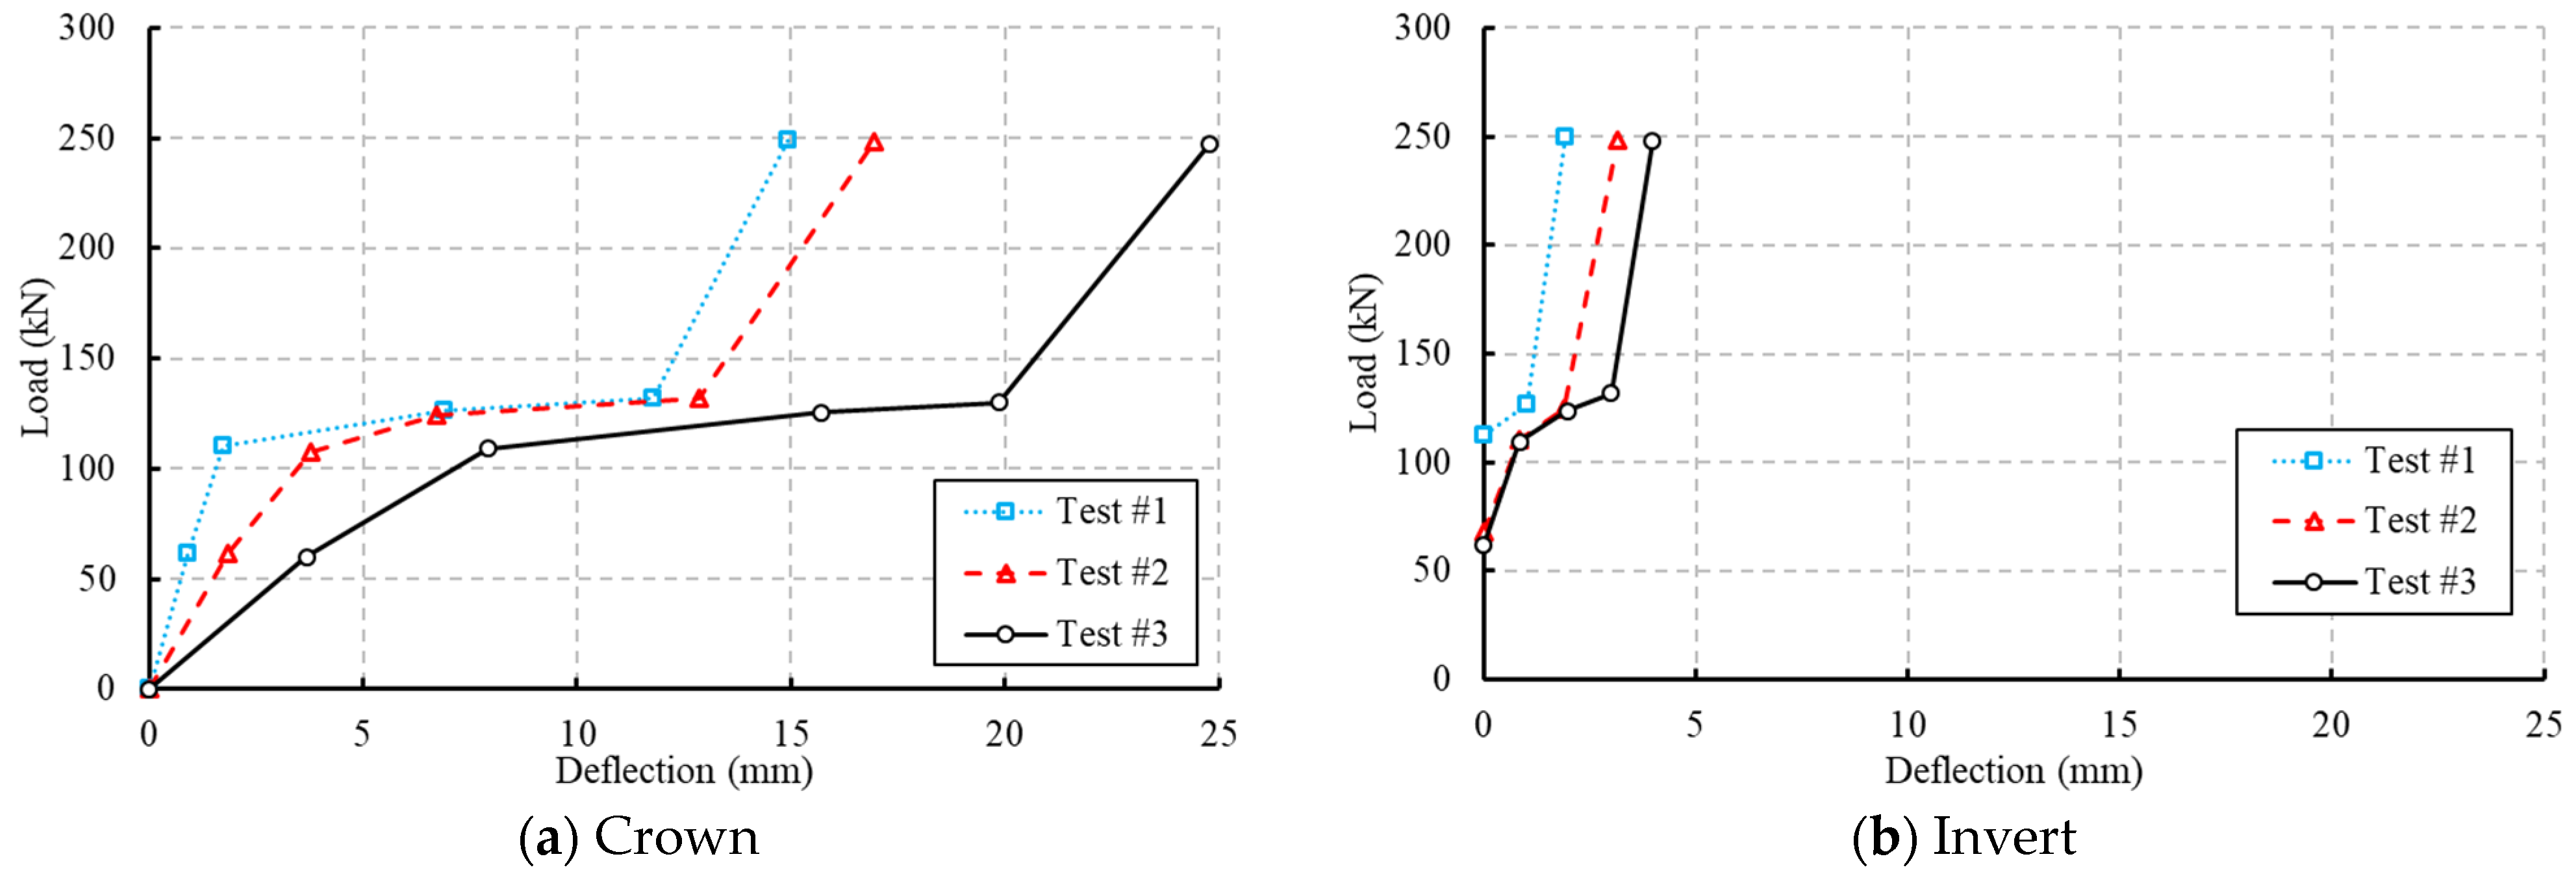
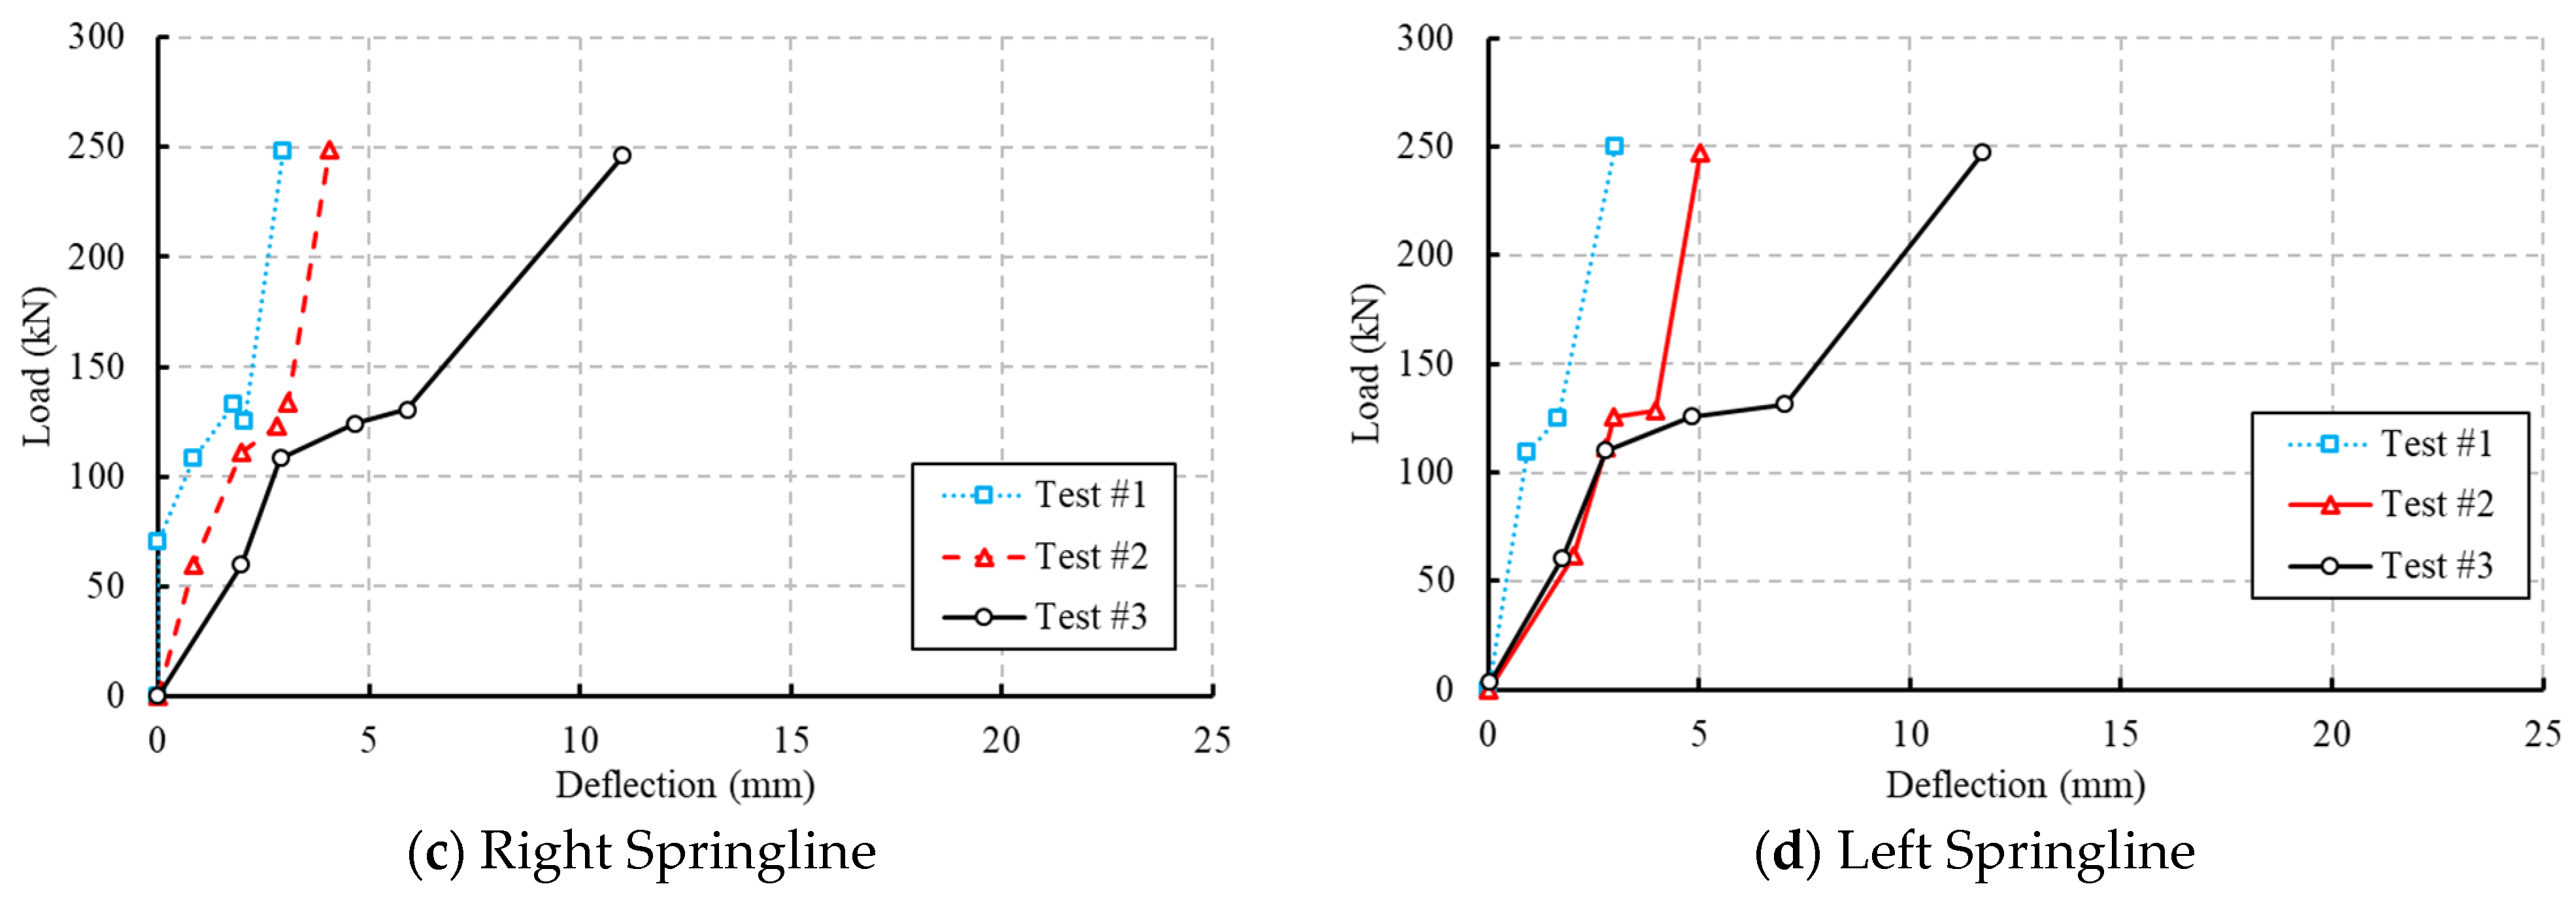
In the fieldwork, displacements were recorded at the following four points inside the pipes: crown, invert, right springline, and left springline. These points were located 1.0 m from the ends of the pipes, directly under the vehicle tires. The results consistently showed that displacements were directed downward at the crown and invert points, to the right at the right springline, and to the left at the left springline, as illustrated in Figure 7. Figure 8 presents the displacement data for the four specified points in the three tests conducted on 1400 mm diameter GRP pipes. Figure 8a indicates that the crown point experienced greater displacement compared to the other points. Figure 8c,d reveal that the displacements at the right and left springline points were generally similar. The maximum deflection at all points was observed in Test No. 3, which featured a 500 mm backfill cover. The vertical deflection (∆y) can be obtained from the following equation:
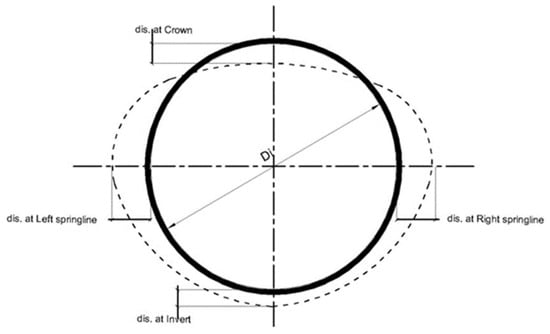
Figure 7.
Displacement directions.
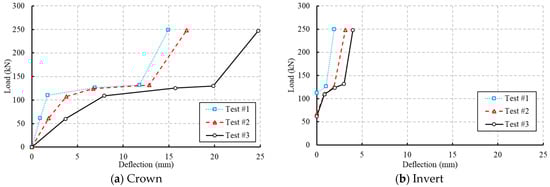
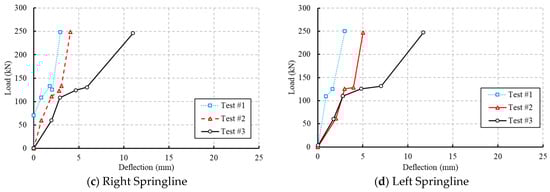
Figure 8.
Deflection results of 1400 mm diameter pipes in different tests.
The vertical deflection was calculated as a percentage of the original diameter, with the maximum allowable deflection for GRP pipes being 5%, according to the AWWA M45 [25]. Figure 9 illustrates the vertical deflection percentage for the 1400 mm diameter GRP pipe. The highest observed vertical deflection was 1.5%, occurring at an applied force of 248.5 kN, as shown in Figure 9c. This value is well within the 5% limit, indicating that the test conditions are acceptable for deflection. Generally, as the backfill cover increases, the maximum deflection decreases due to the load distribution effect, where an increased backfill cover reduces the traffic load applied on the pipe by a 1:2 ratio.
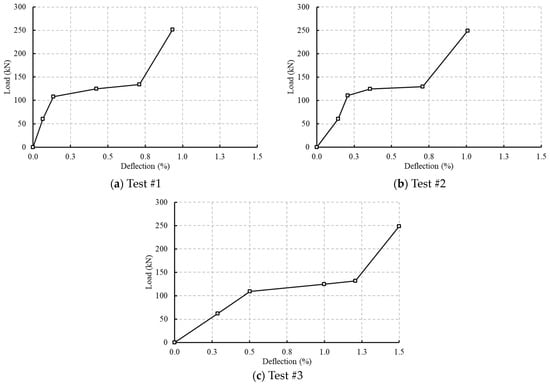
Figure 9.
Vertical deflections percentage results of 1400 mm diameter pipes in different tests.
4. Finite Element Analysis
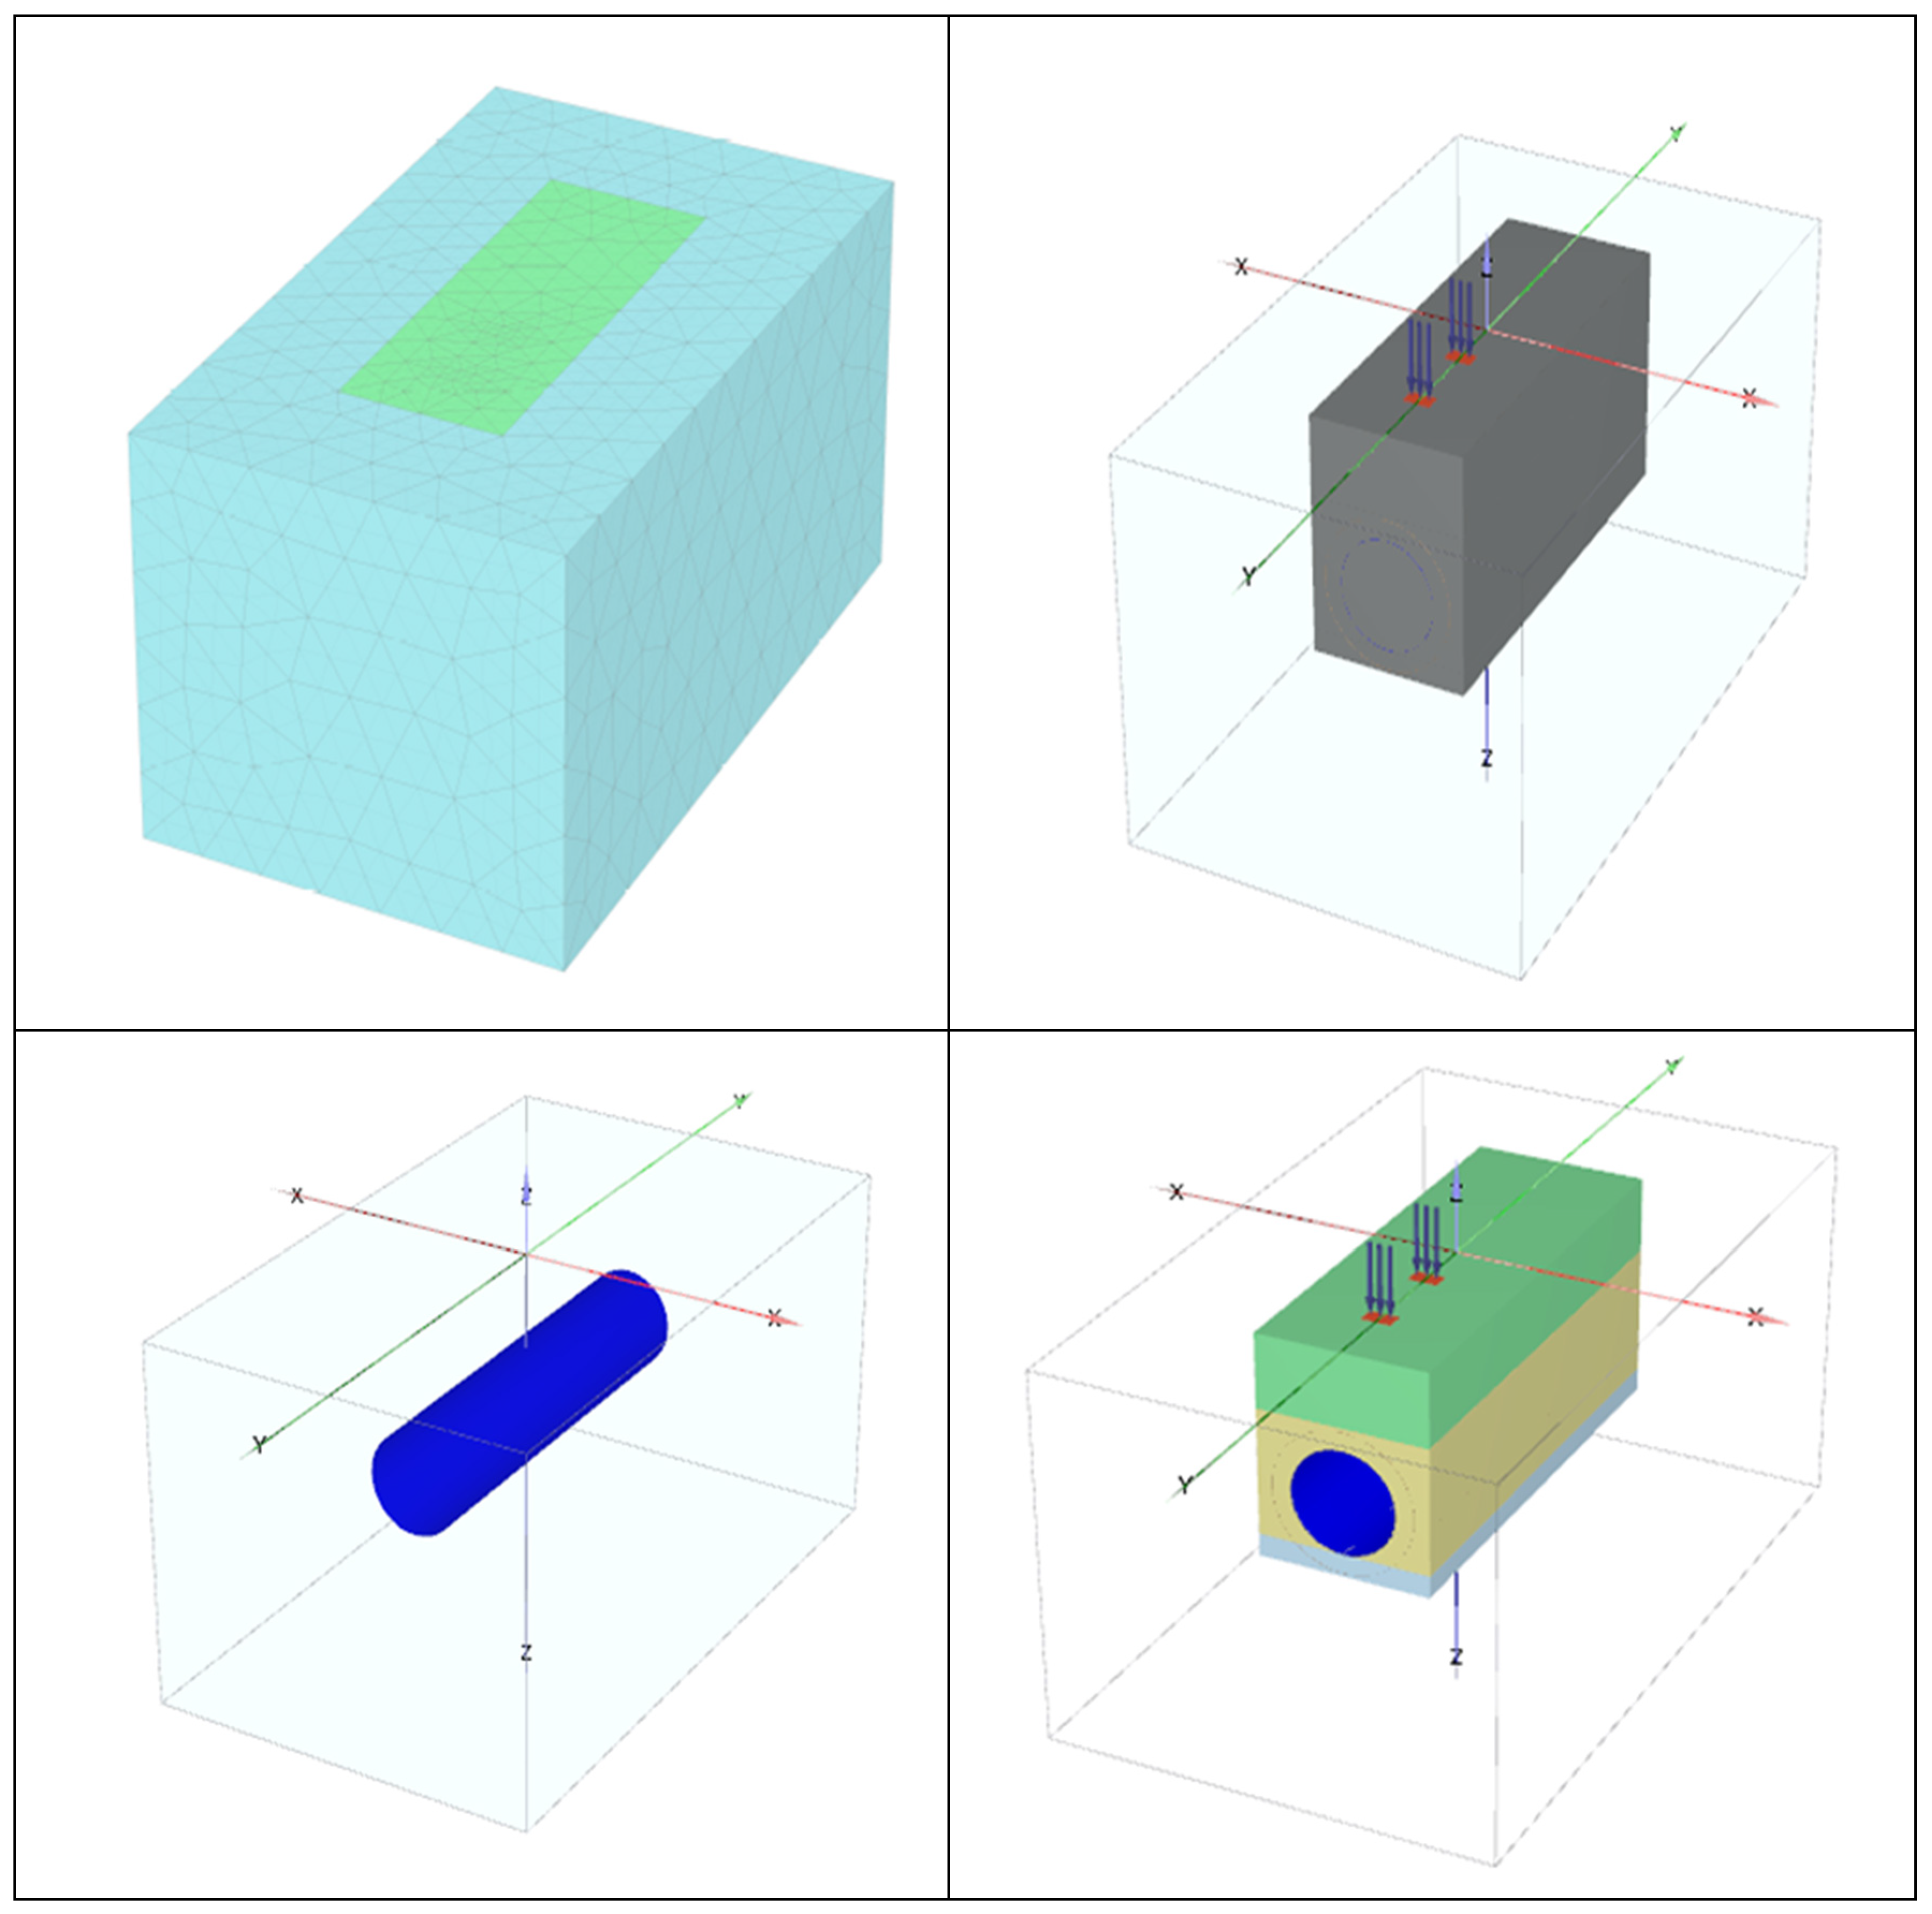
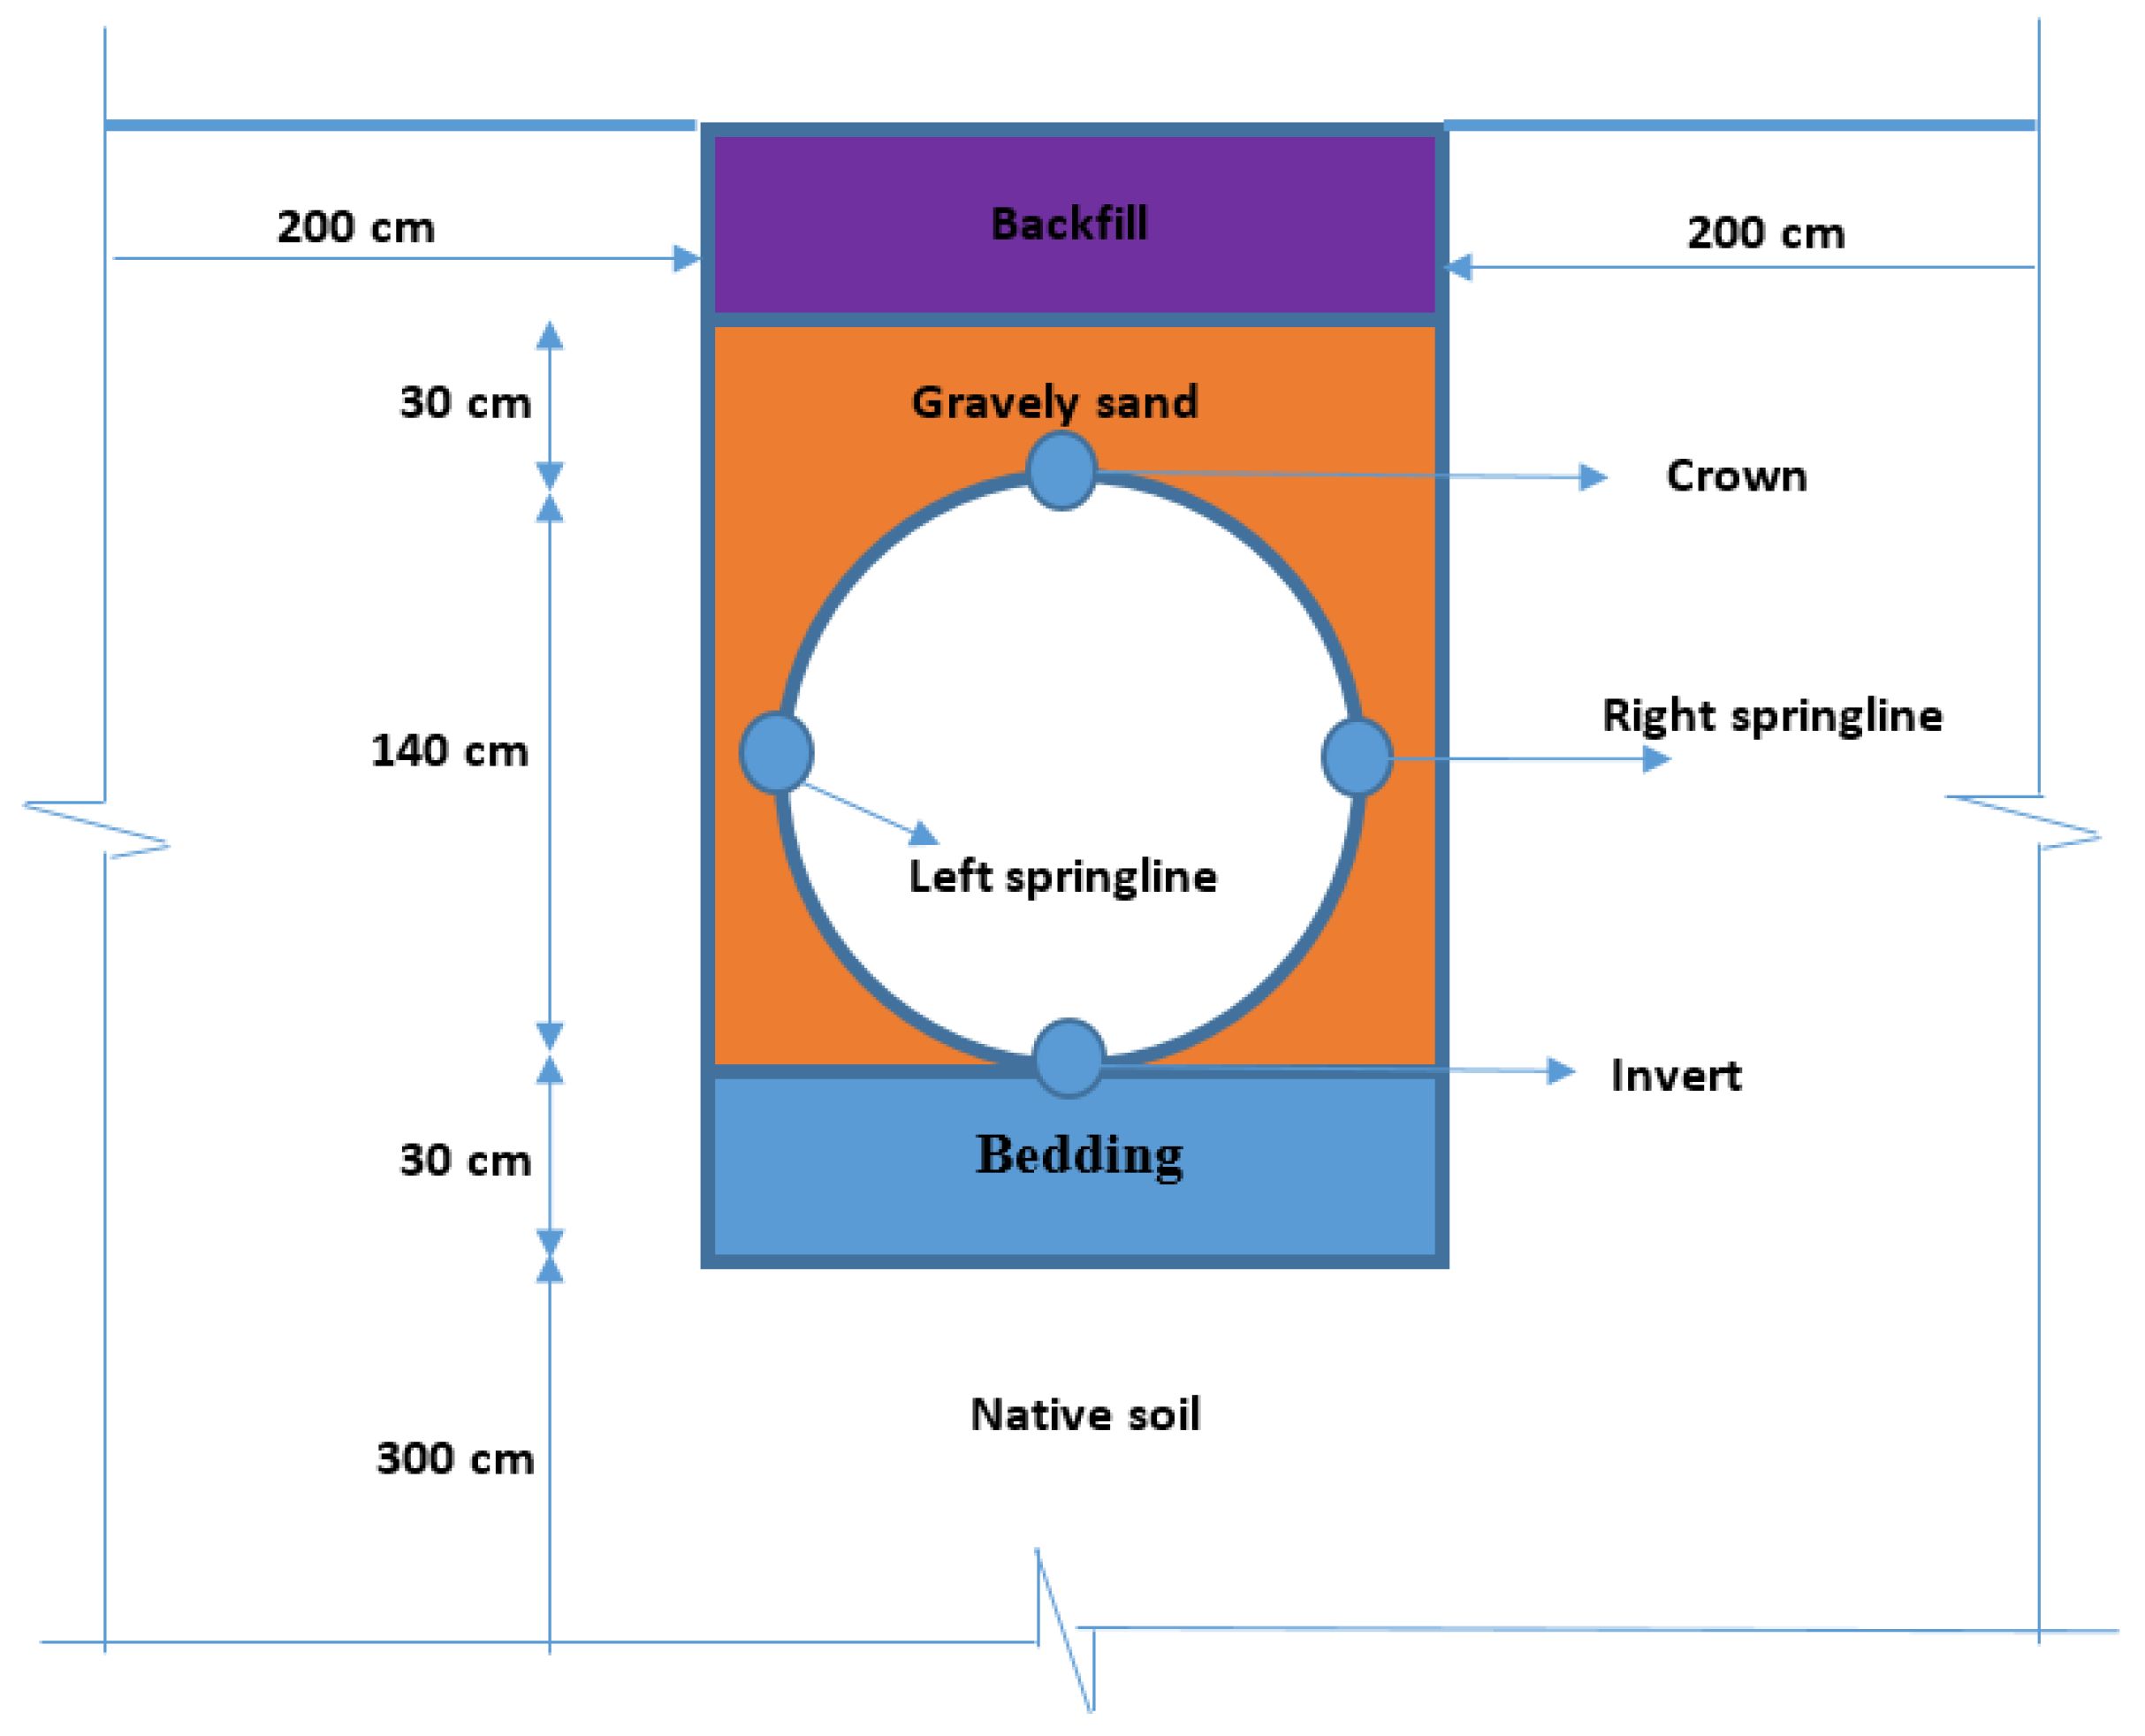
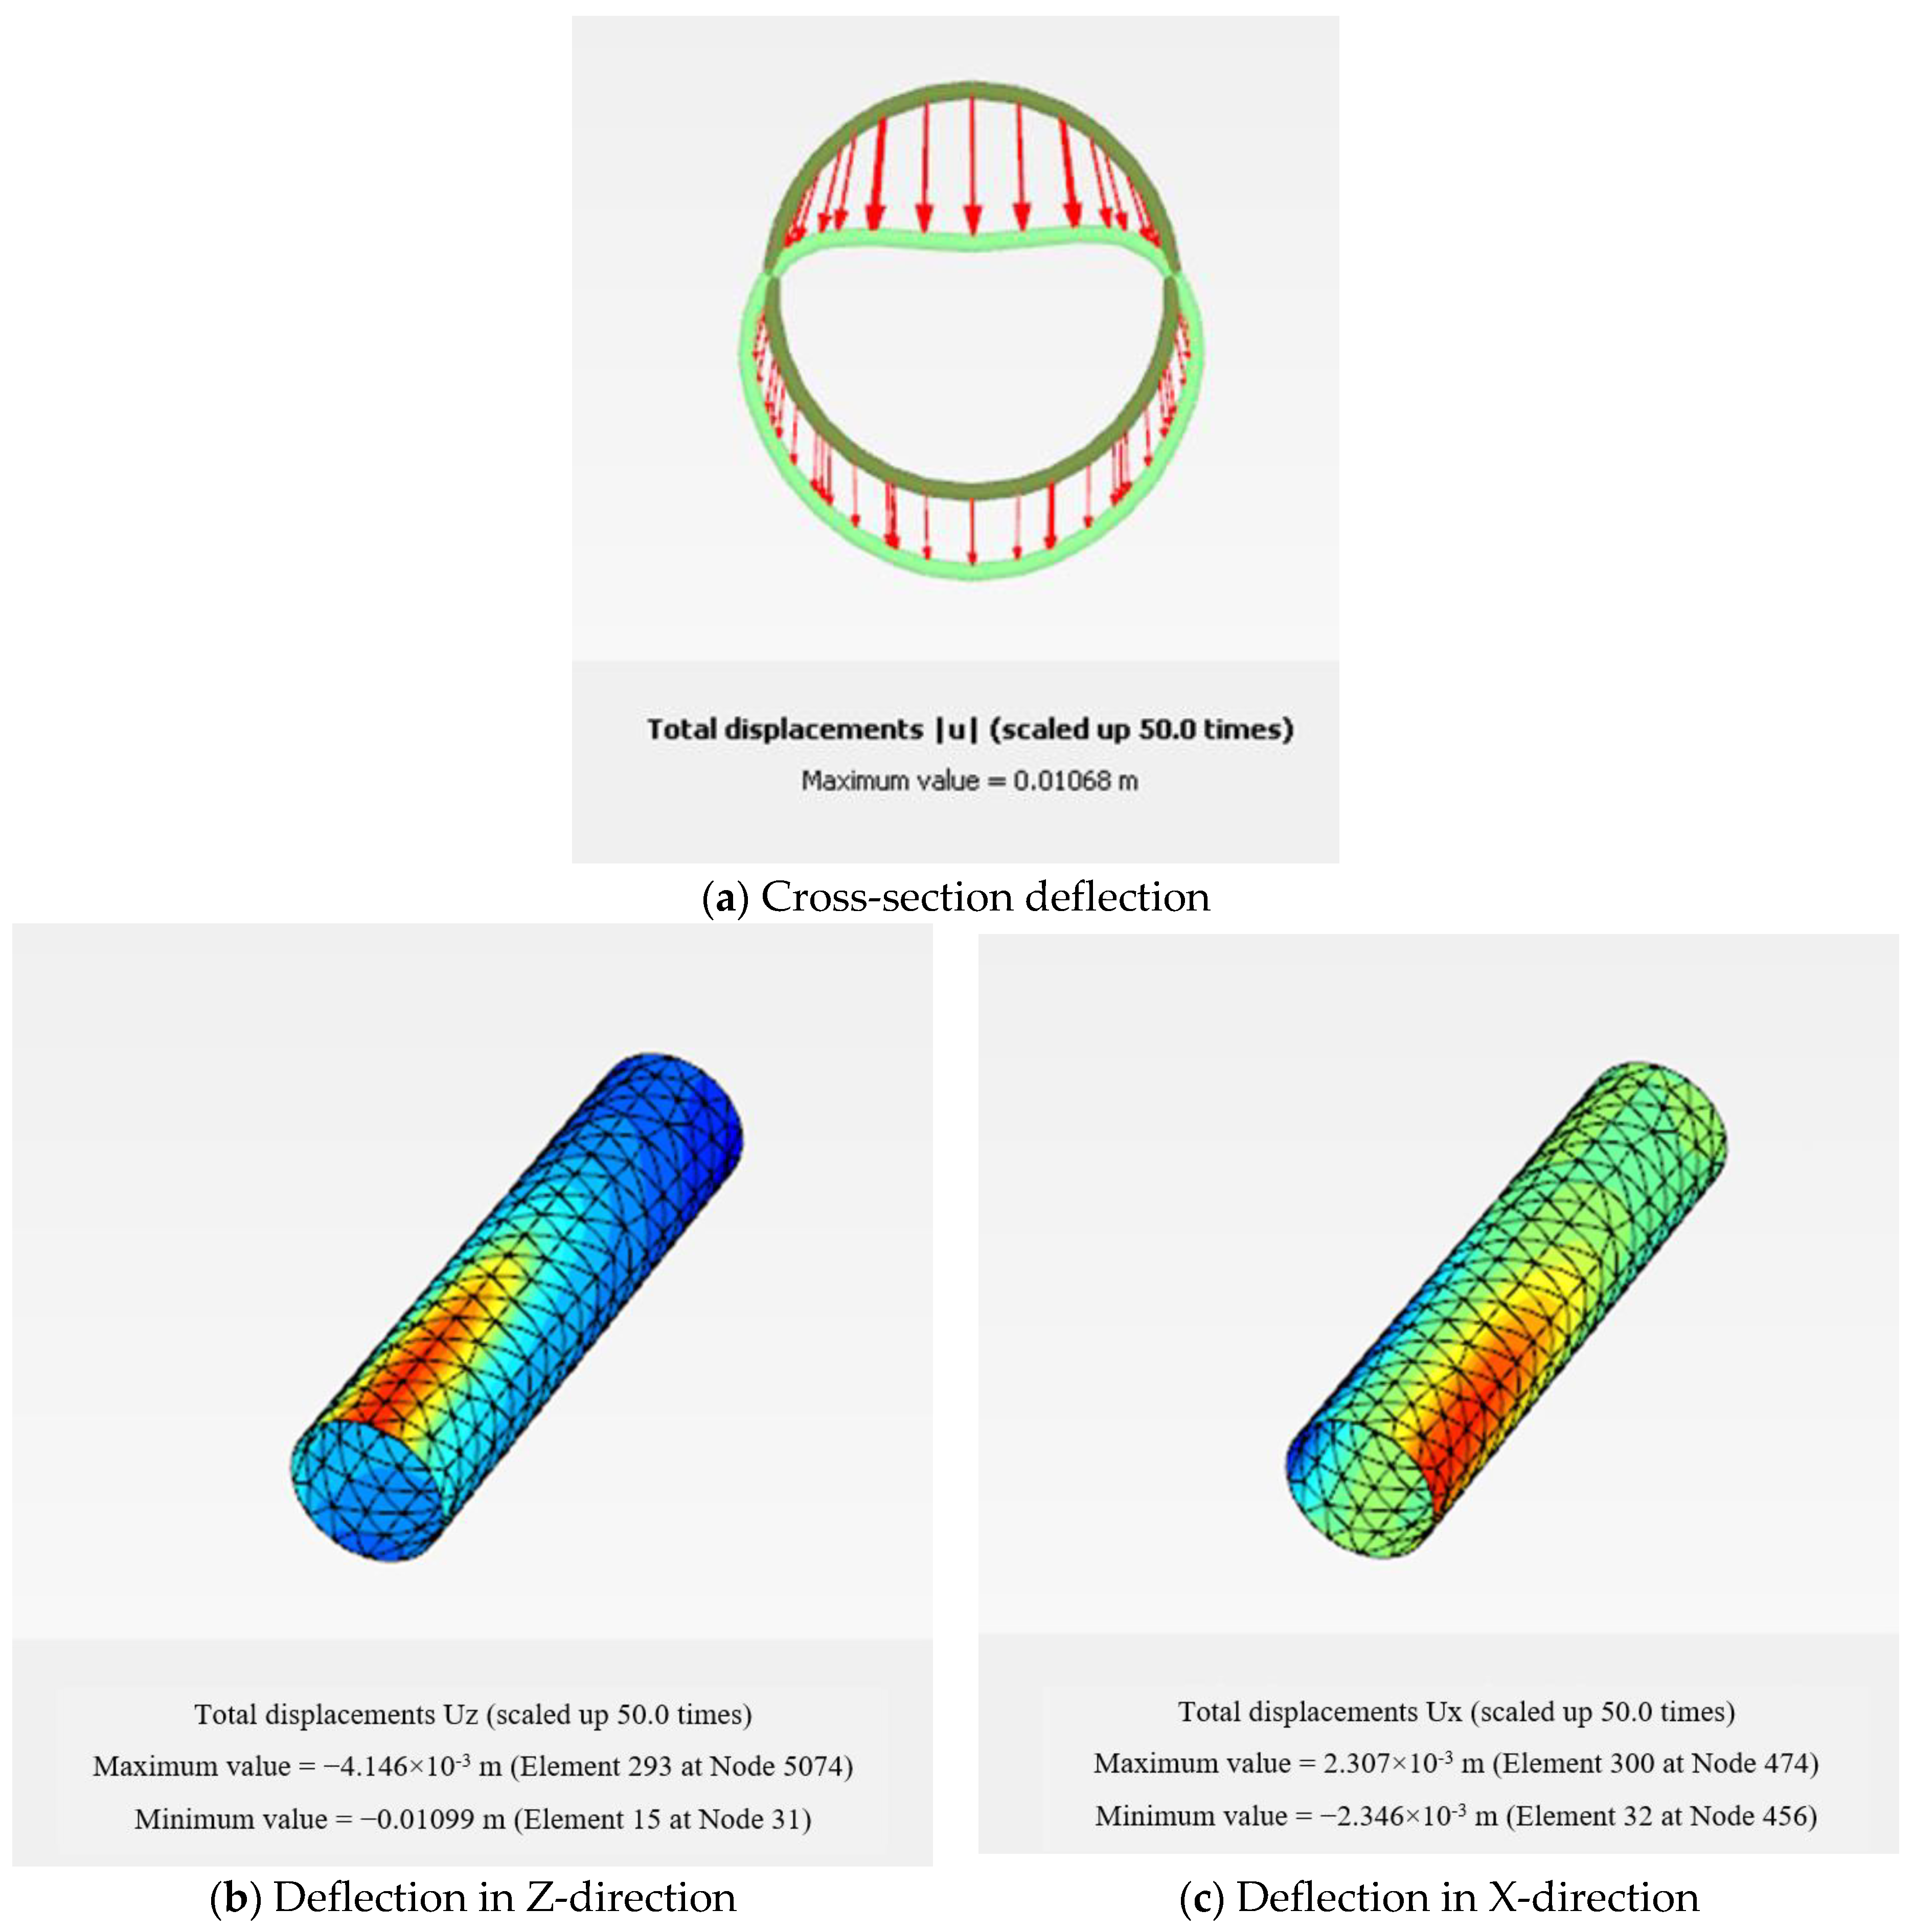
The behavior of GRP pipes under various traffic loads was analyzed using finite element (FE) modeling with Plaxis 3D [14], as illustrated in Figure 10. To ensure the model’s accuracy, its results were validated against field data. Three scenarios were examined, each with different backfill thicknesses ranging from 50 cm to 100 cm, as shown in Figure 11. The properties of the backfill, gravelly sand, native soil, and bedding soil are detailed in Table 4.
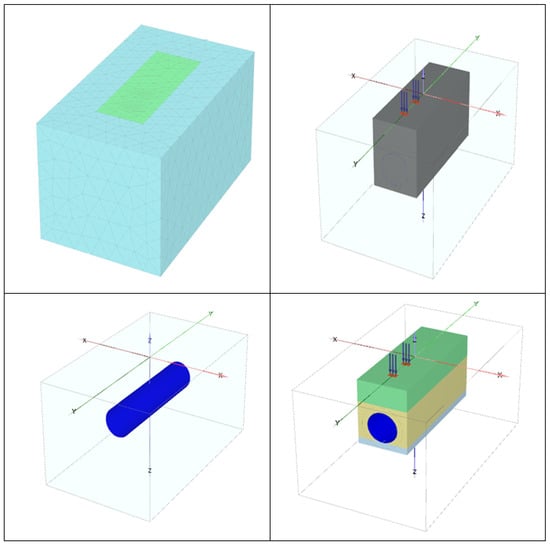
Figure 10.
Finite element model using Plaxis 3D.
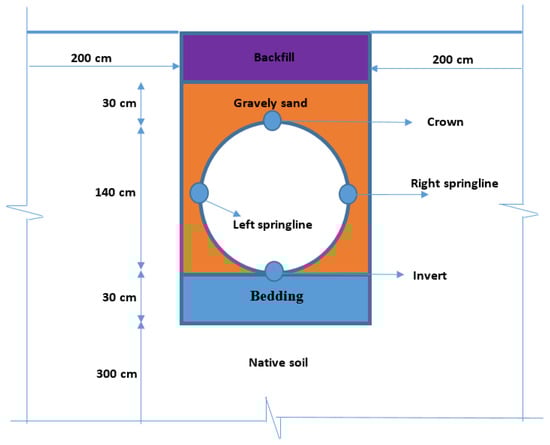
Figure 11.
Cross-section of the studied model.
Table 4.
The properties of soils used in the Plaxis software.
4.1. Elements
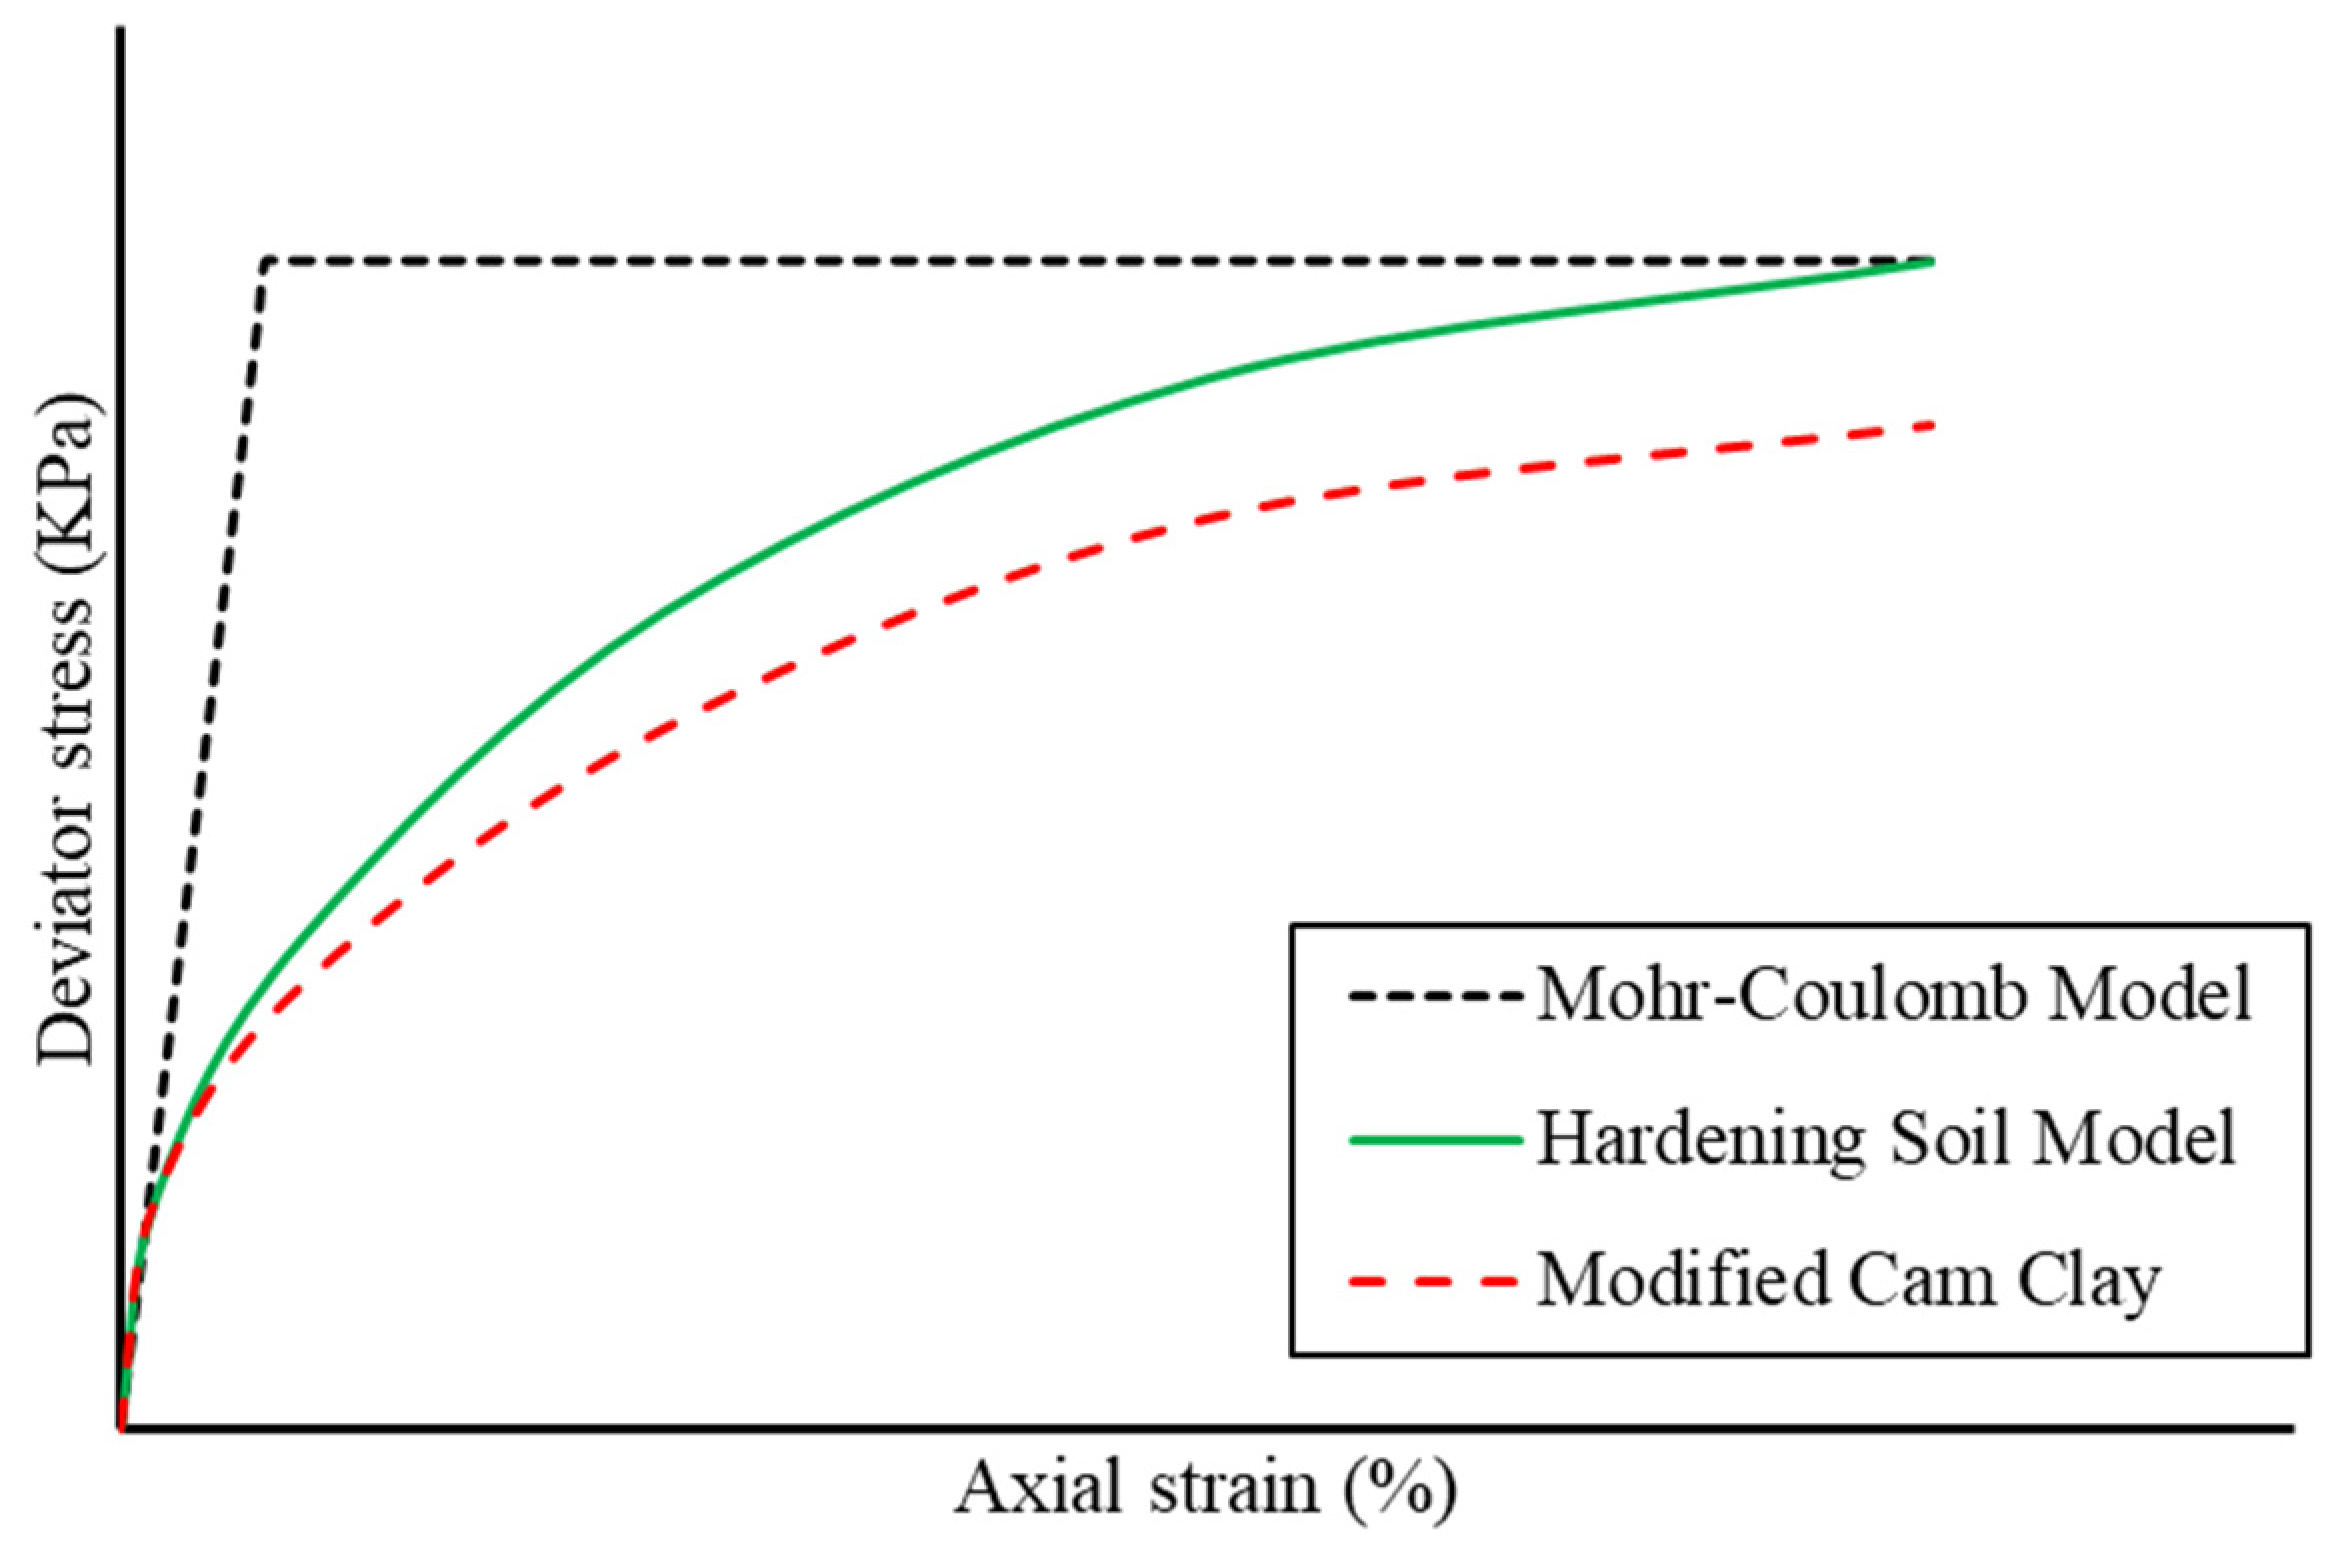
All soils were modeled using the hardening soil model (HSM), an advanced elastoplastic constitutive model capable of simulating a wide range of soil behaviors, including both stiff and soft soil characteristics [26]. HSM effectively correlates stiffness parameters with stress levels and models the evolution of plastic strains under compressive loading conditions. It is an enhancement of Duncan and Chang’s hyperbolic model [27], incorporating plasticity theory and surpassing the elasticity-centric approach of its predecessor [28,29]. Figure 12 illustrates the differences between the Mohr–Coulomb, hardening soil, and modified cam clay models.
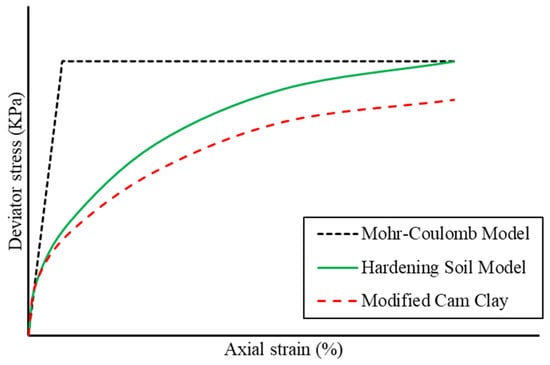
Figure 12.
Comparison between Mohr–Coulomb, hardening soil, and modified cam clay models [3].
Elasto-plastic behavior combines both elastic and plastic responses that soil exhibits under loading. In this context, two types of strain occur: permanent strain and recoverable strain. The stress limit up to which the strain in the soil mass is recoverable is known as yield stress (σy). Beyond this yield stress, the strain in the soil mass becomes permanent. Yield stress is not constant; it varies as the soil mass undergoes continuous loading and unloading. The studied pipes were represented by plate elements, as recommended by Plaxis 3D guidelines [14]. Tire pressure was modeled as a surface load applied to the plate elements. The model consisted of 3790 elements and 6586 nodes, with different components simulated using 10-node tetrahedral elements.
4.2. Boundary Conditions
The lateral boundary of the soil was assumed to be supported as rollers, facilitating soil settlement. Conversely, the lower boundary was treated as hinged support to restrain horizontal and vertical displacements. Multiple iterations were conducted, varying the dimensions of the soil medium, to determine the optimal size that maintains result accuracy. These iterations aimed to establish the largest element size that does not compromise accuracy, thereby enhancing computational efficiency. The dimensions of the soil domain are illustrated in Figure 11.
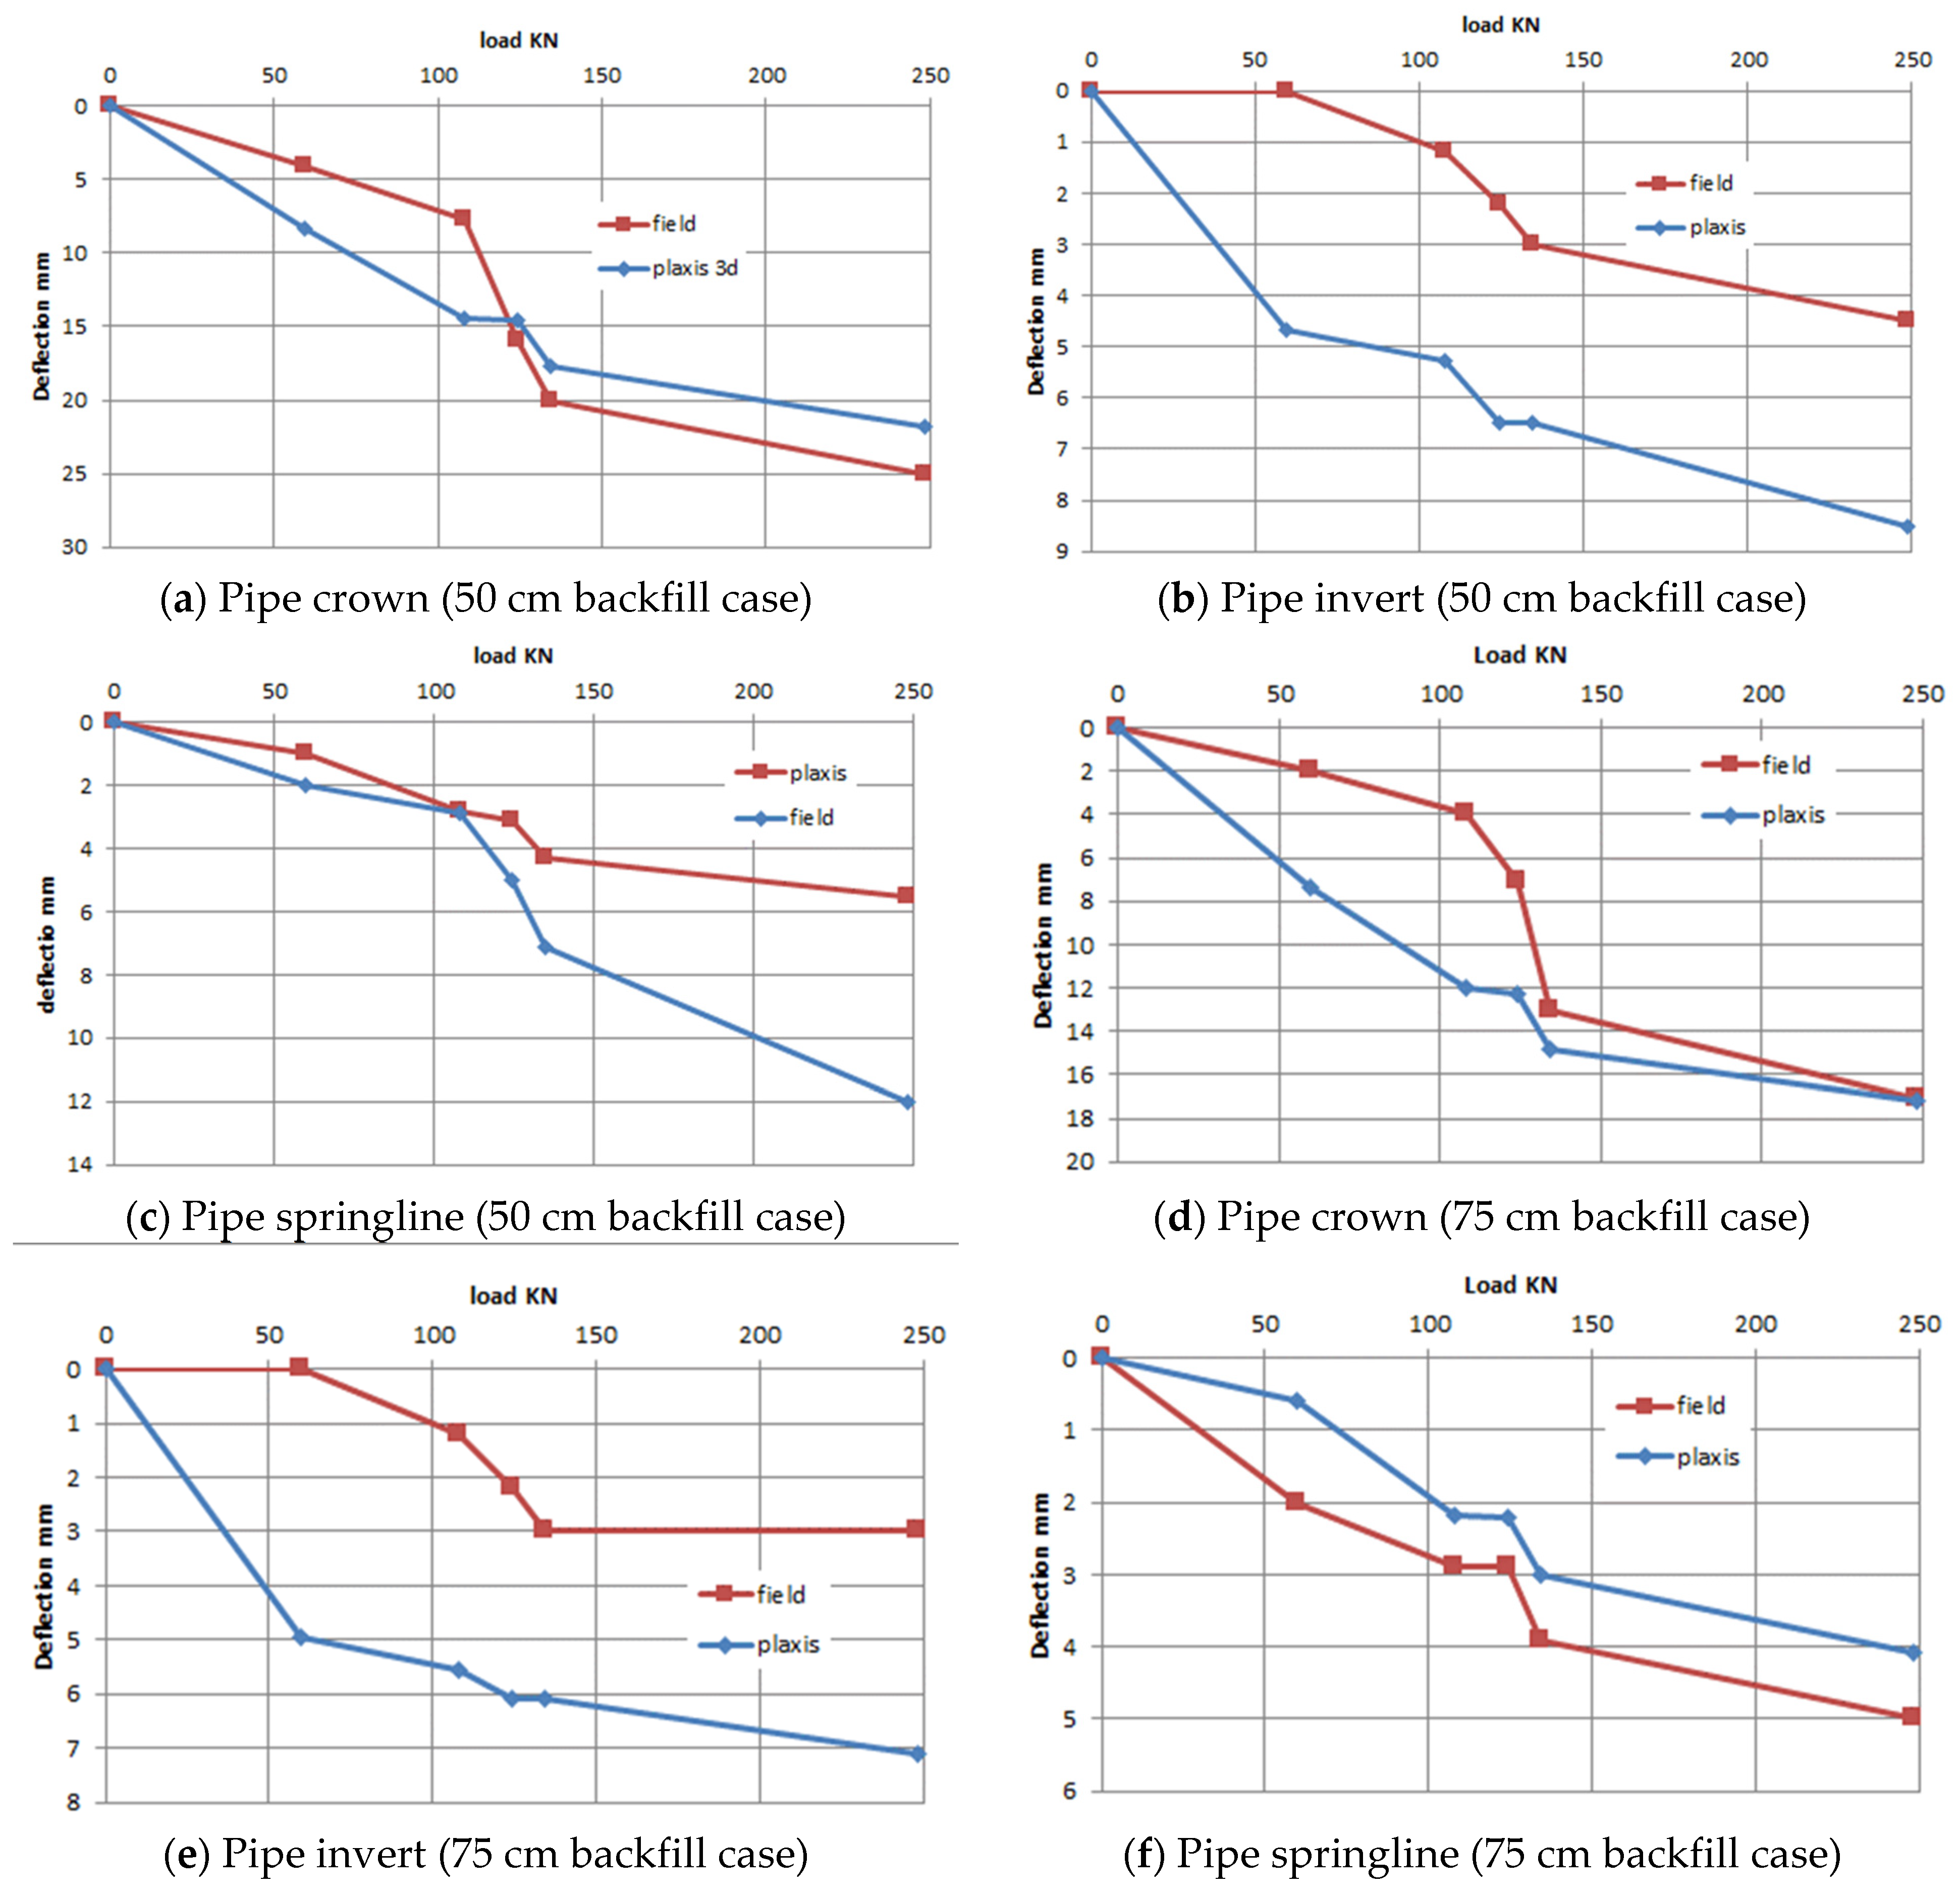
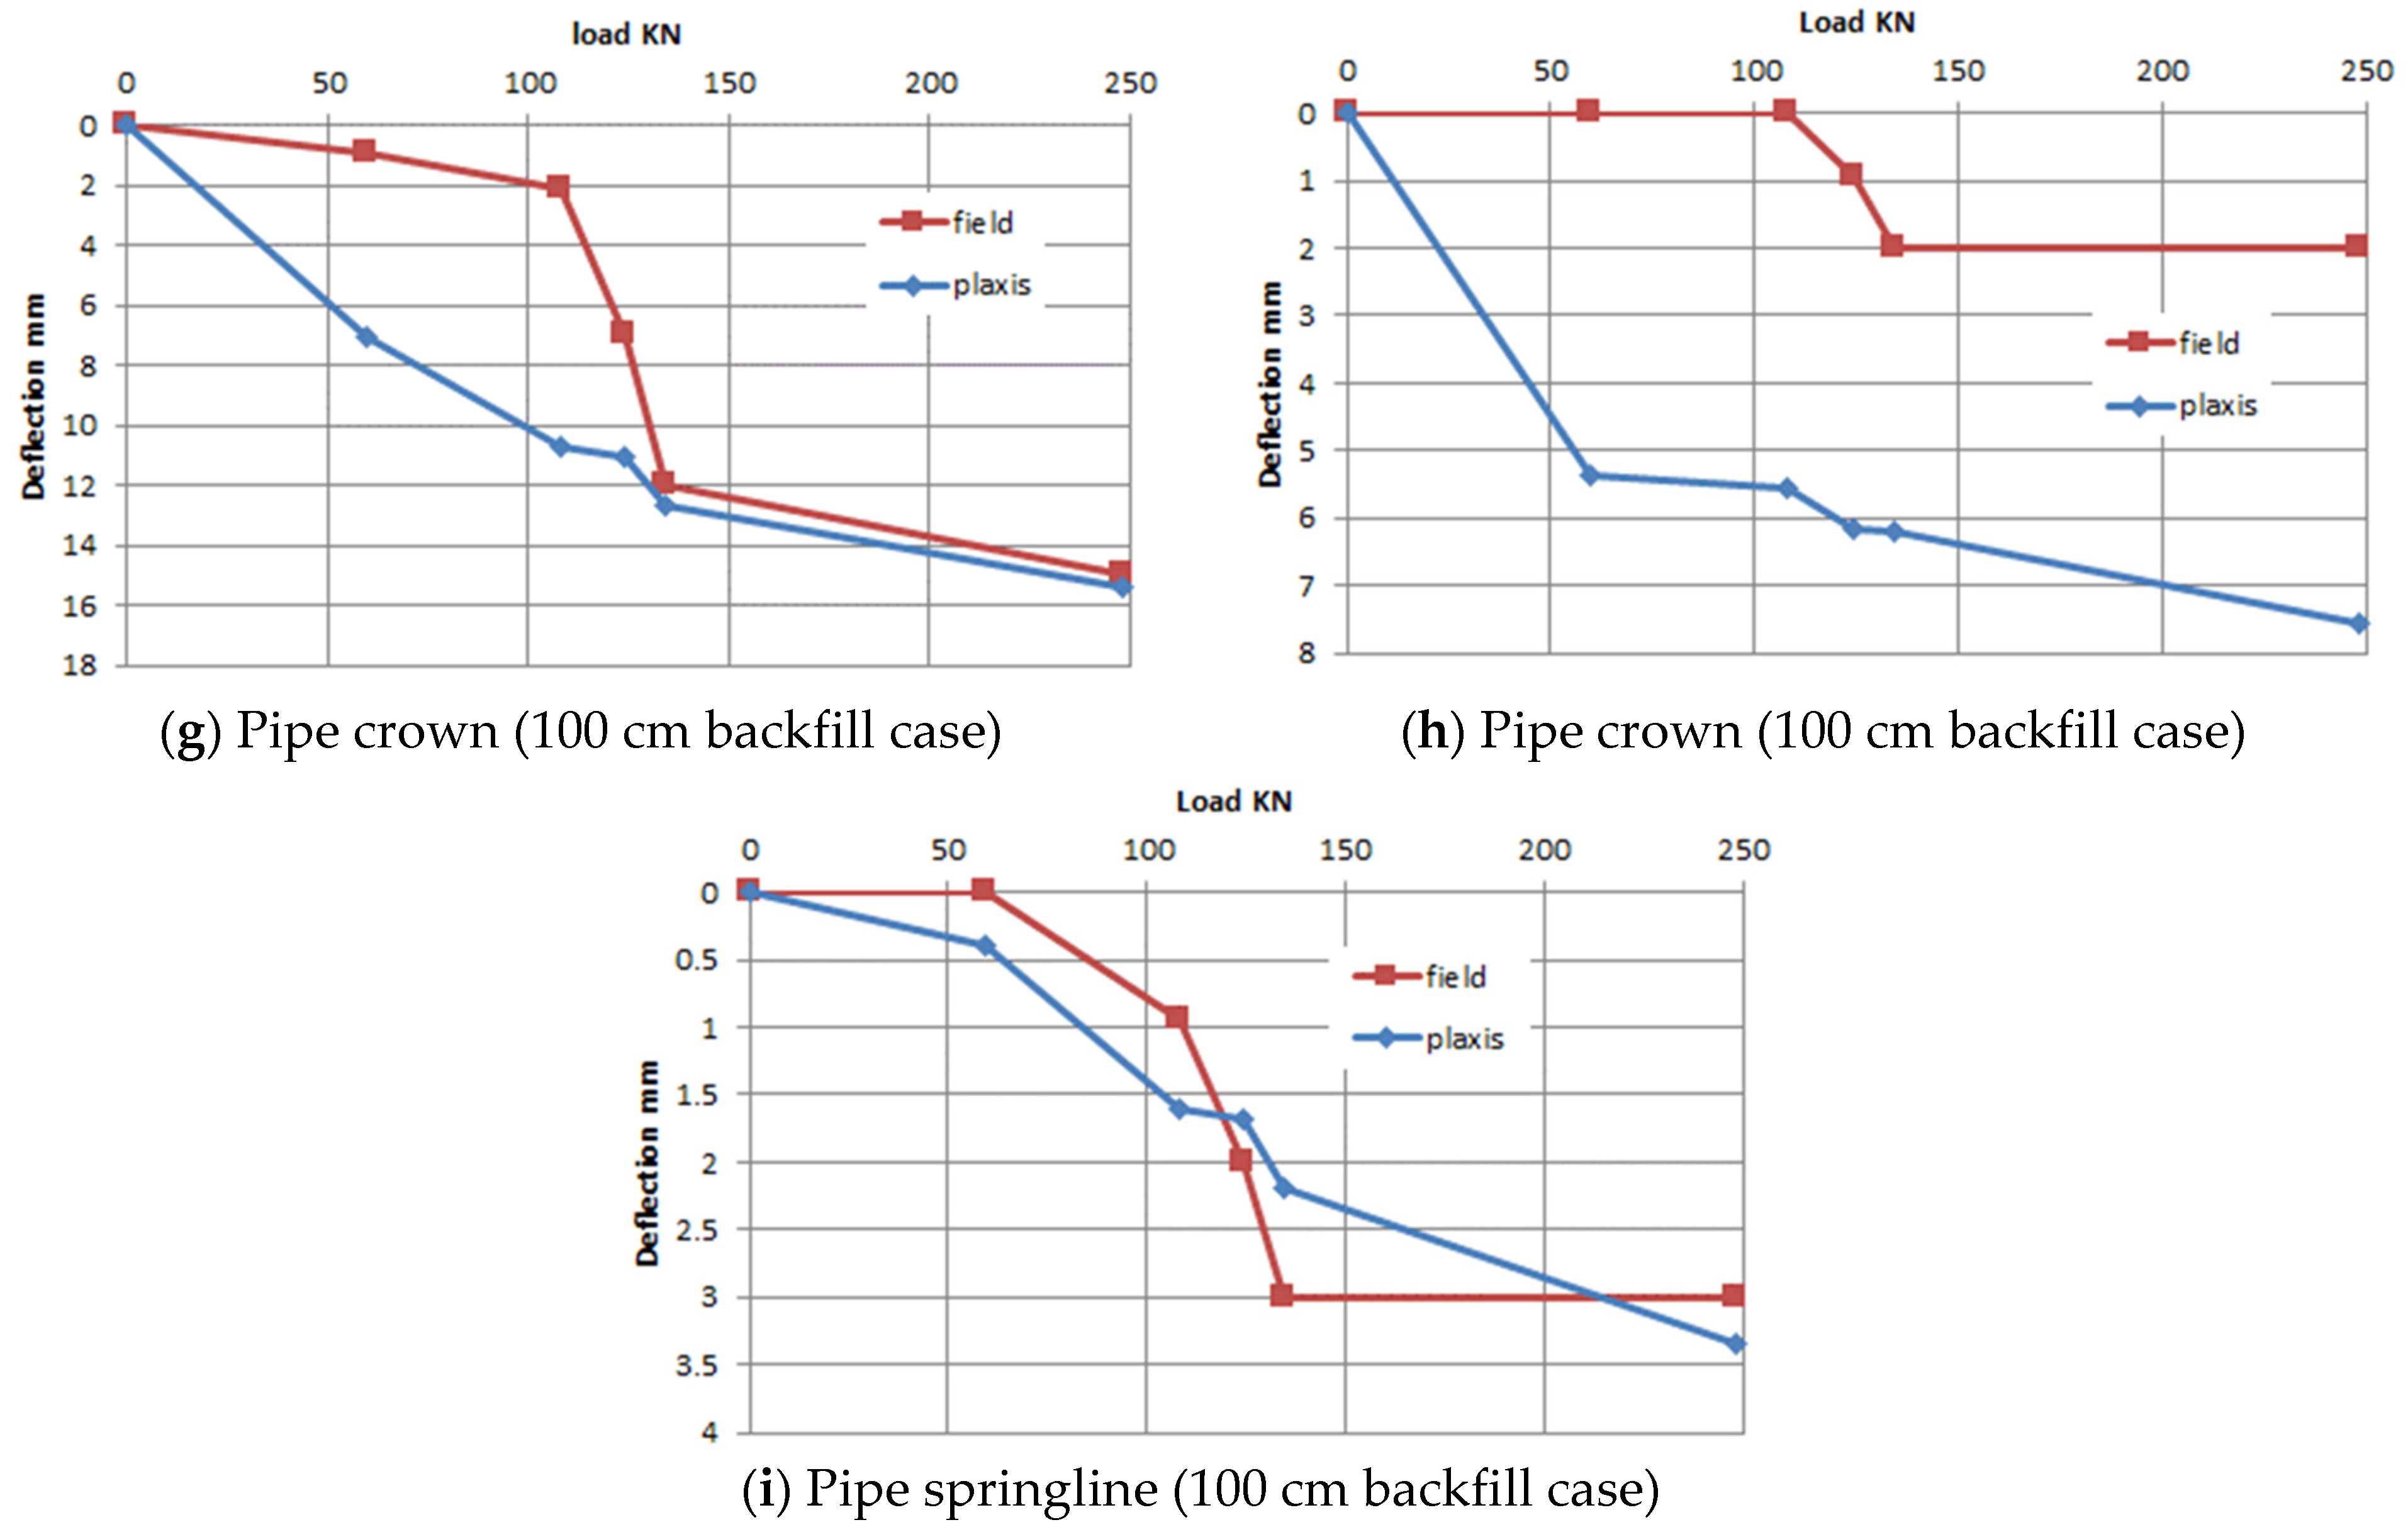
4.3. Verification Results
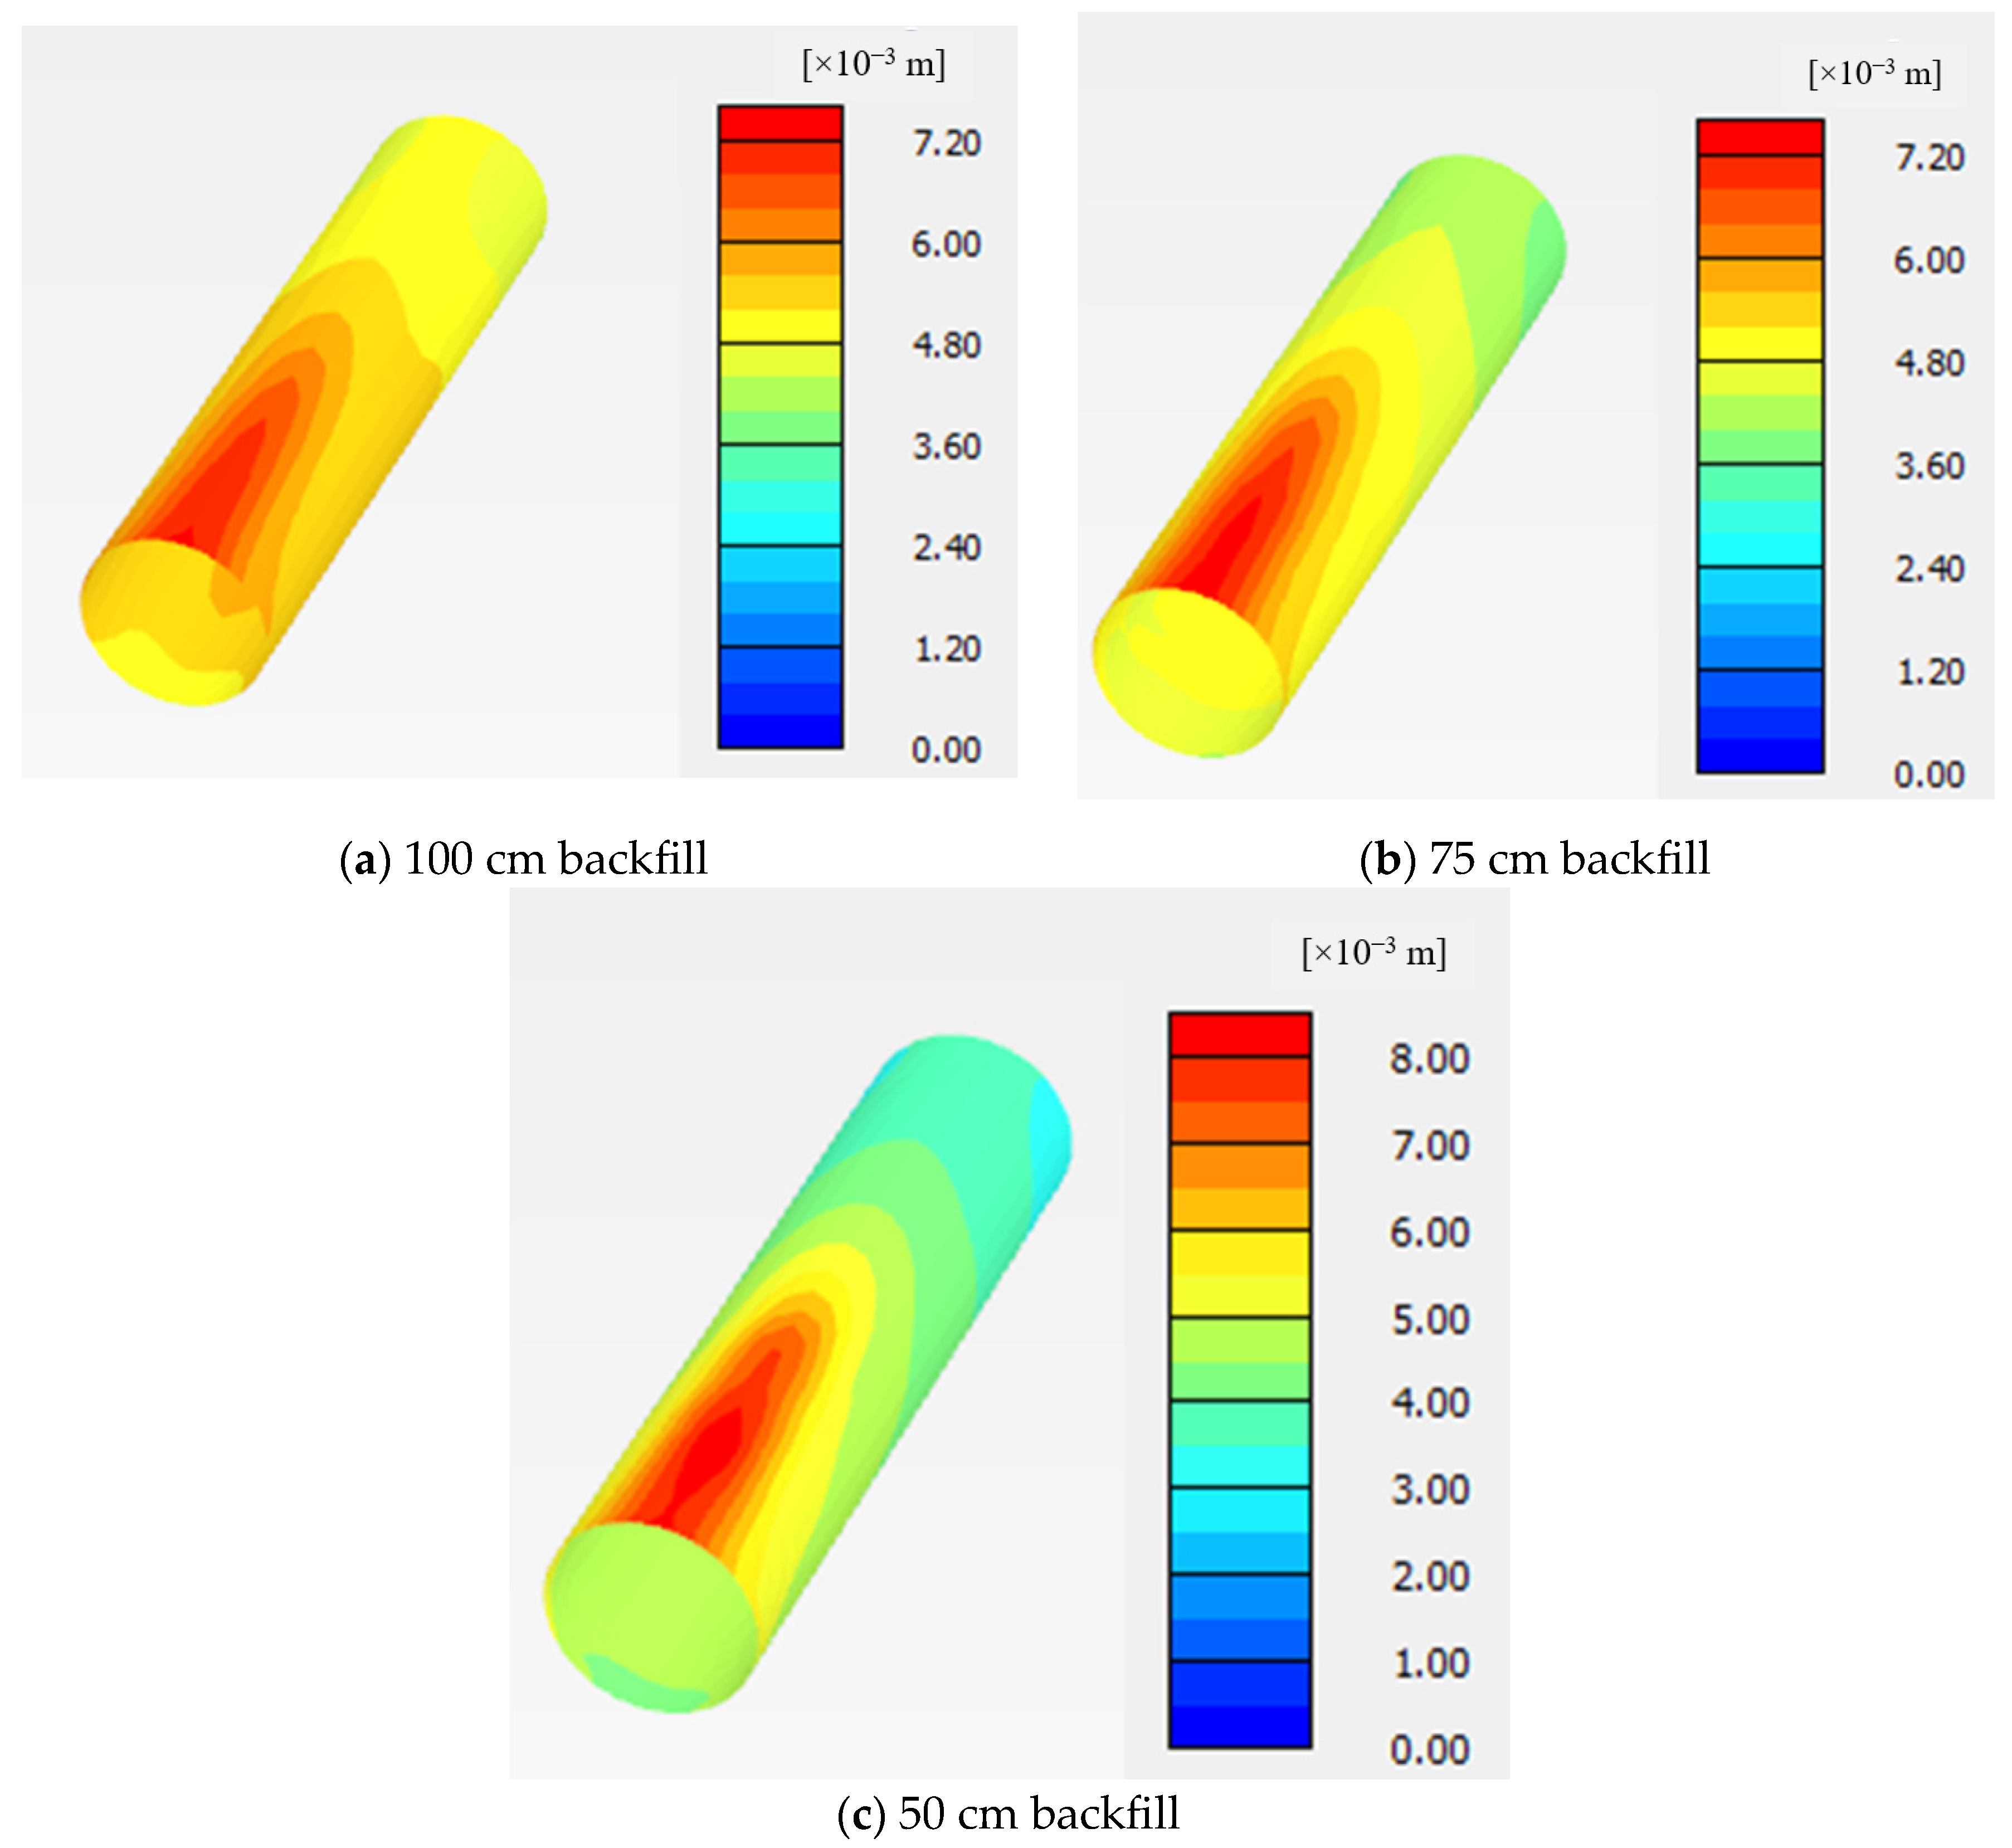
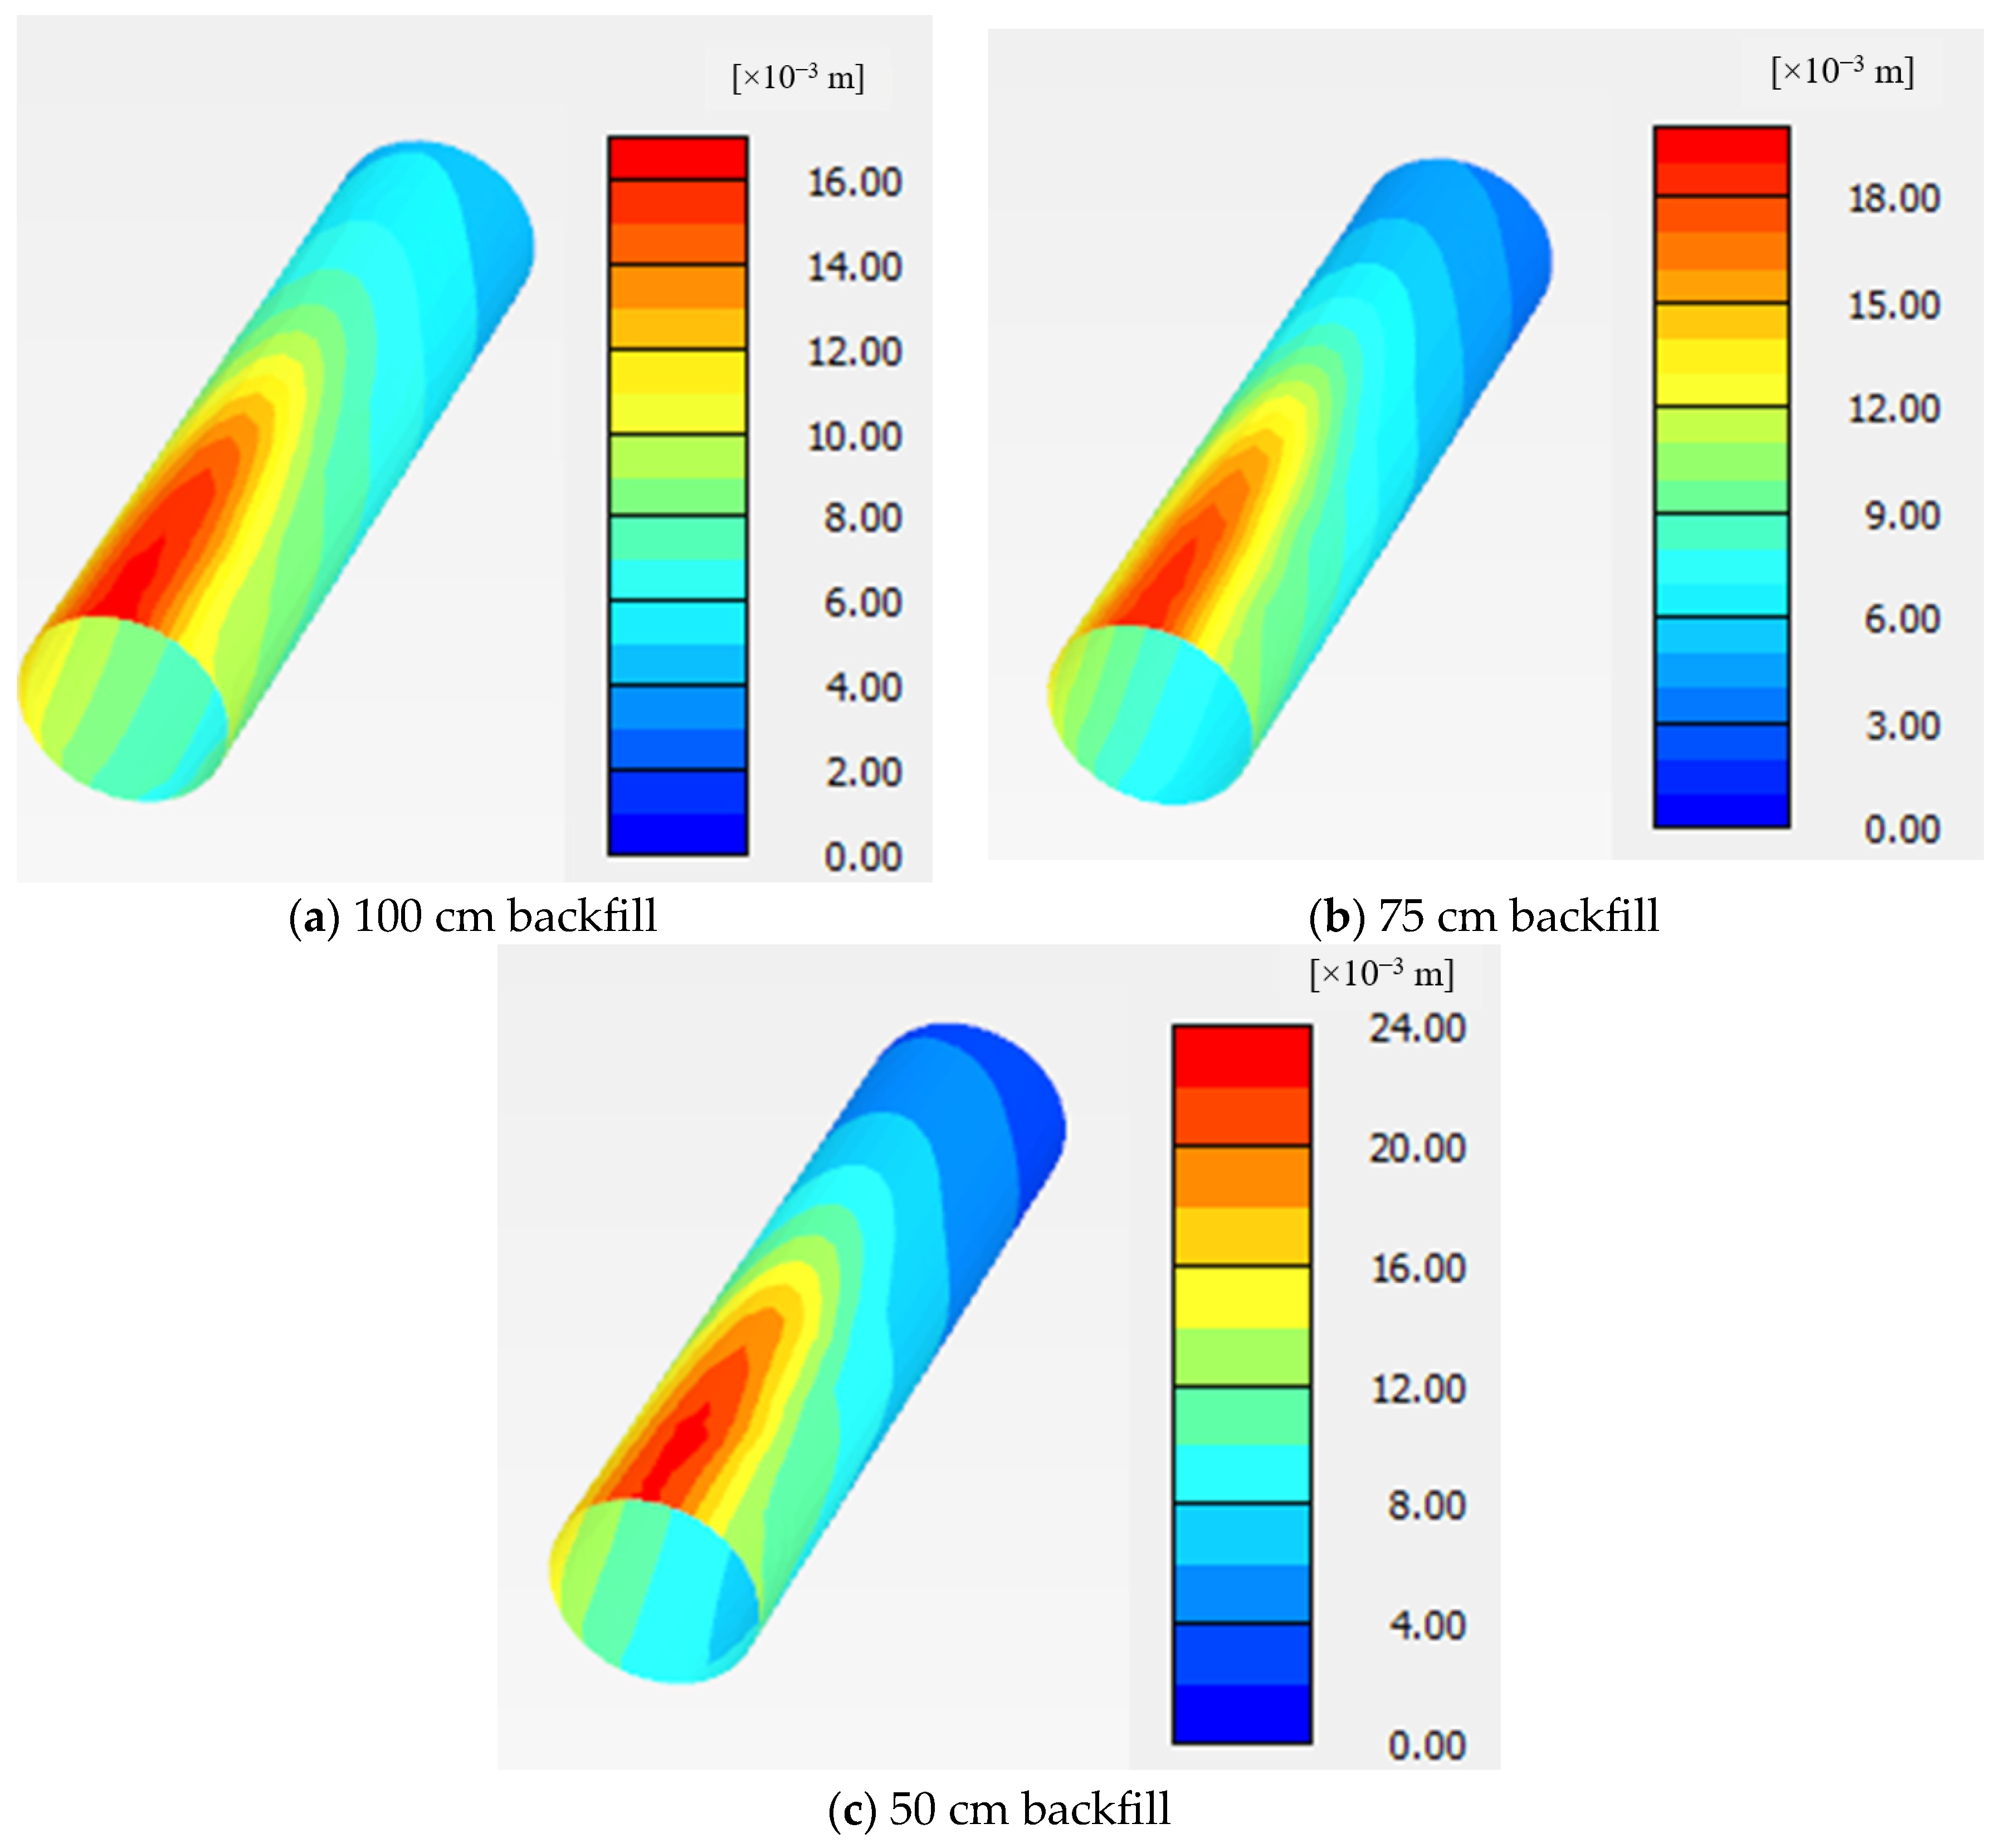
Figure 13 presents the deflection of the pipe crown, invert, and springline for all studied cases. The results show a strong correlation between numerical simulations and field data, suggesting that FE analysis is a reliable tool for predicting the impact of other parameters on pipe behavior under external loads. Figure 14 illustrates the vertical and lateral deflections of the pipe under load No. 2, with a backfill thickness of 100 cm. Additionally, Figure 15 and Figure 16 compare pipe deflections for backfill thicknesses of 50 cm, 75 cm, and 100 cm under loads No. 1 and No. 5. The results indicate that increasing the backfill thickness from 50 cm to 75 cm and 100 cm significantly reduces deflection at the crown, invert, and springline. The difference between the field and FE results could be attributed to various assumptions that were made about the FE modeling of the soil. The soil was assumed to be elasto-plastic material. However, the actual behavior is more complex. Additionally, the accuracy of the field measurements could contribute to these differences. In general, the field and FE results show the same trend.
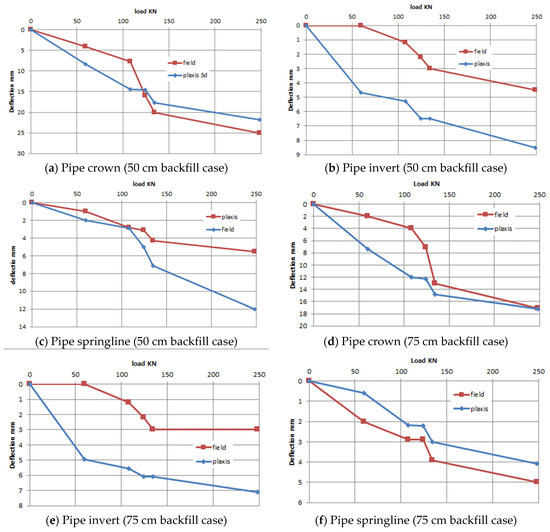
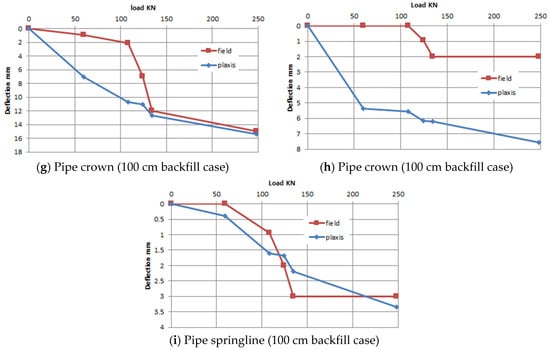
Figure 13.
Comparisons between the FE and experimental load-deflection relationships.
Figure 14.
Deflections of the analyzed pipes under load No. 2 (case of 100 cm backfill).
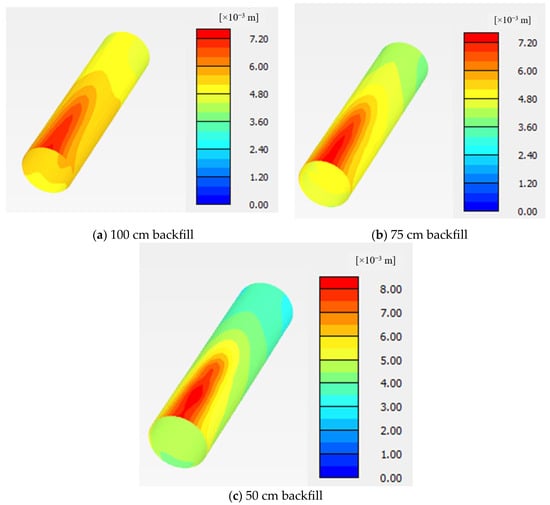
Figure 15.
Deflection of the analyzed pipes under load No. 1.
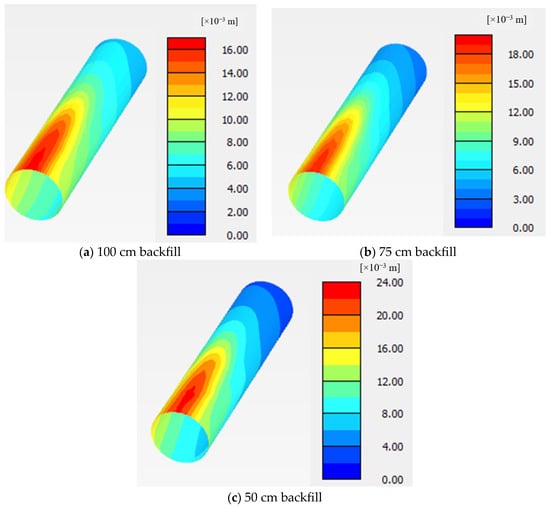
Figure 16.
Deflection of the analyzed pipes under load No. 5.
5. Parametric Studies
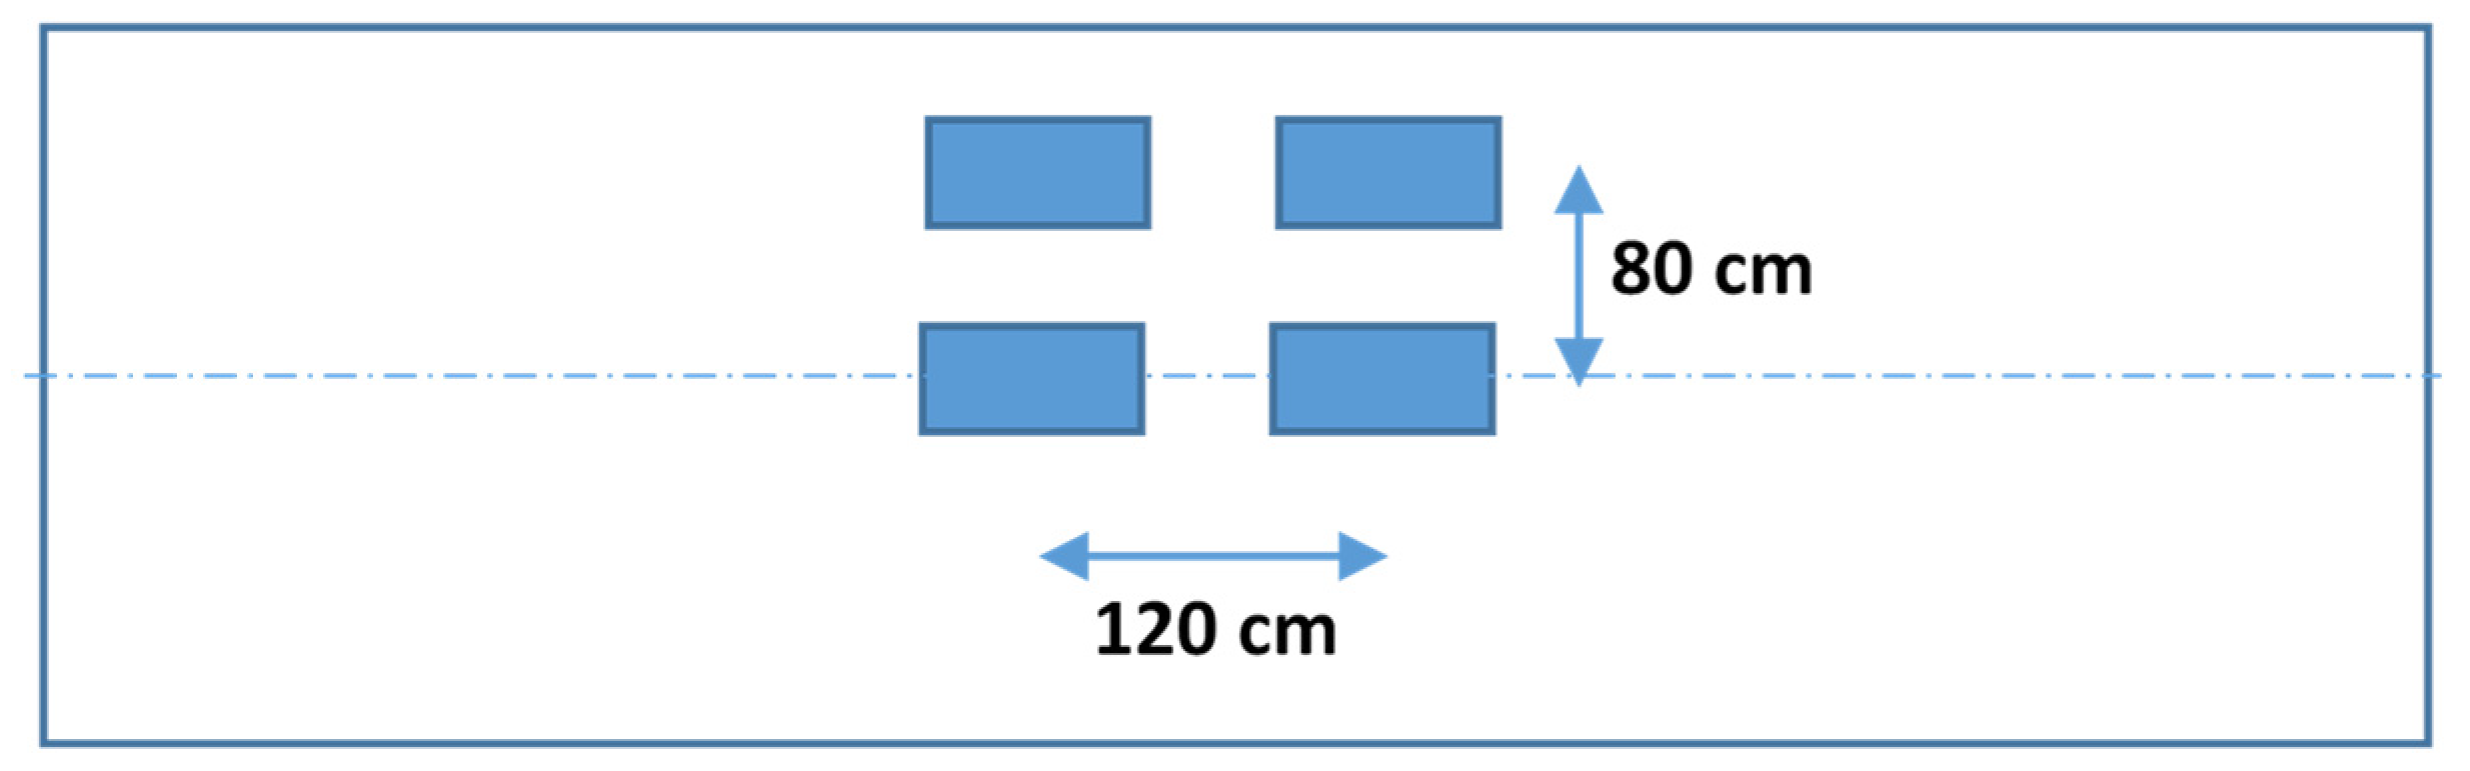
Numerous variables can impact the behavior of embedded pipes, including pipe material, pipe thickness, backfill properties, backfill depth, and the properties of the soil under the pipe. The primary aim of the parametric investigation was to identify the most cost-effective method for significantly mitigating pipe deflection. FE models were constructed to simulate a scenario where a pipe is embedded in a soft clay layer extending to a depth of 8 m, followed by an extended layer of sand. Table 5 outlines the pertinent properties of the soft clay and sand utilized in the FE simulations, with the soft clay soil represented by the hardening soil model and the sandy soil by the Mohr–Coulomb model. To enhance computational efficiency, the mesh was refined within the area of interest (the pipe and its surrounding soil), while a coarser mesh was applied in the distant field. A summary of the analyzed cases is presented in Table 6. The length of all studied pipes was 10 m. Twenty-seven cases were studied with different backfill depths, bedding depths, pipe diameters, pipe thicknesses, and pipe materials. The properties of backfill and bedding soils are presented in Table 7. Moreover, the load used in the parametric study was an equivalent load of truck tires, as shown in Figure 17. The contact area between tires and soil was 25 cm × 50 cm and the tire pressure was 500 KPa.
Table 5.
Properties of the soft clay and sand.
Table 6.
Parameters of the studied cases.
Table 7.
Properties of the backfill and bedding soils.
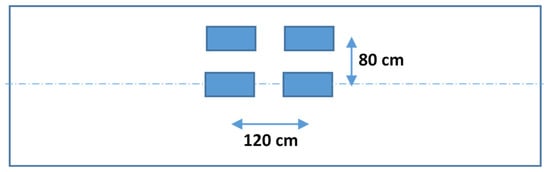
Figure 17.
Layout of the truck tires.
5.1. Bedding Depth
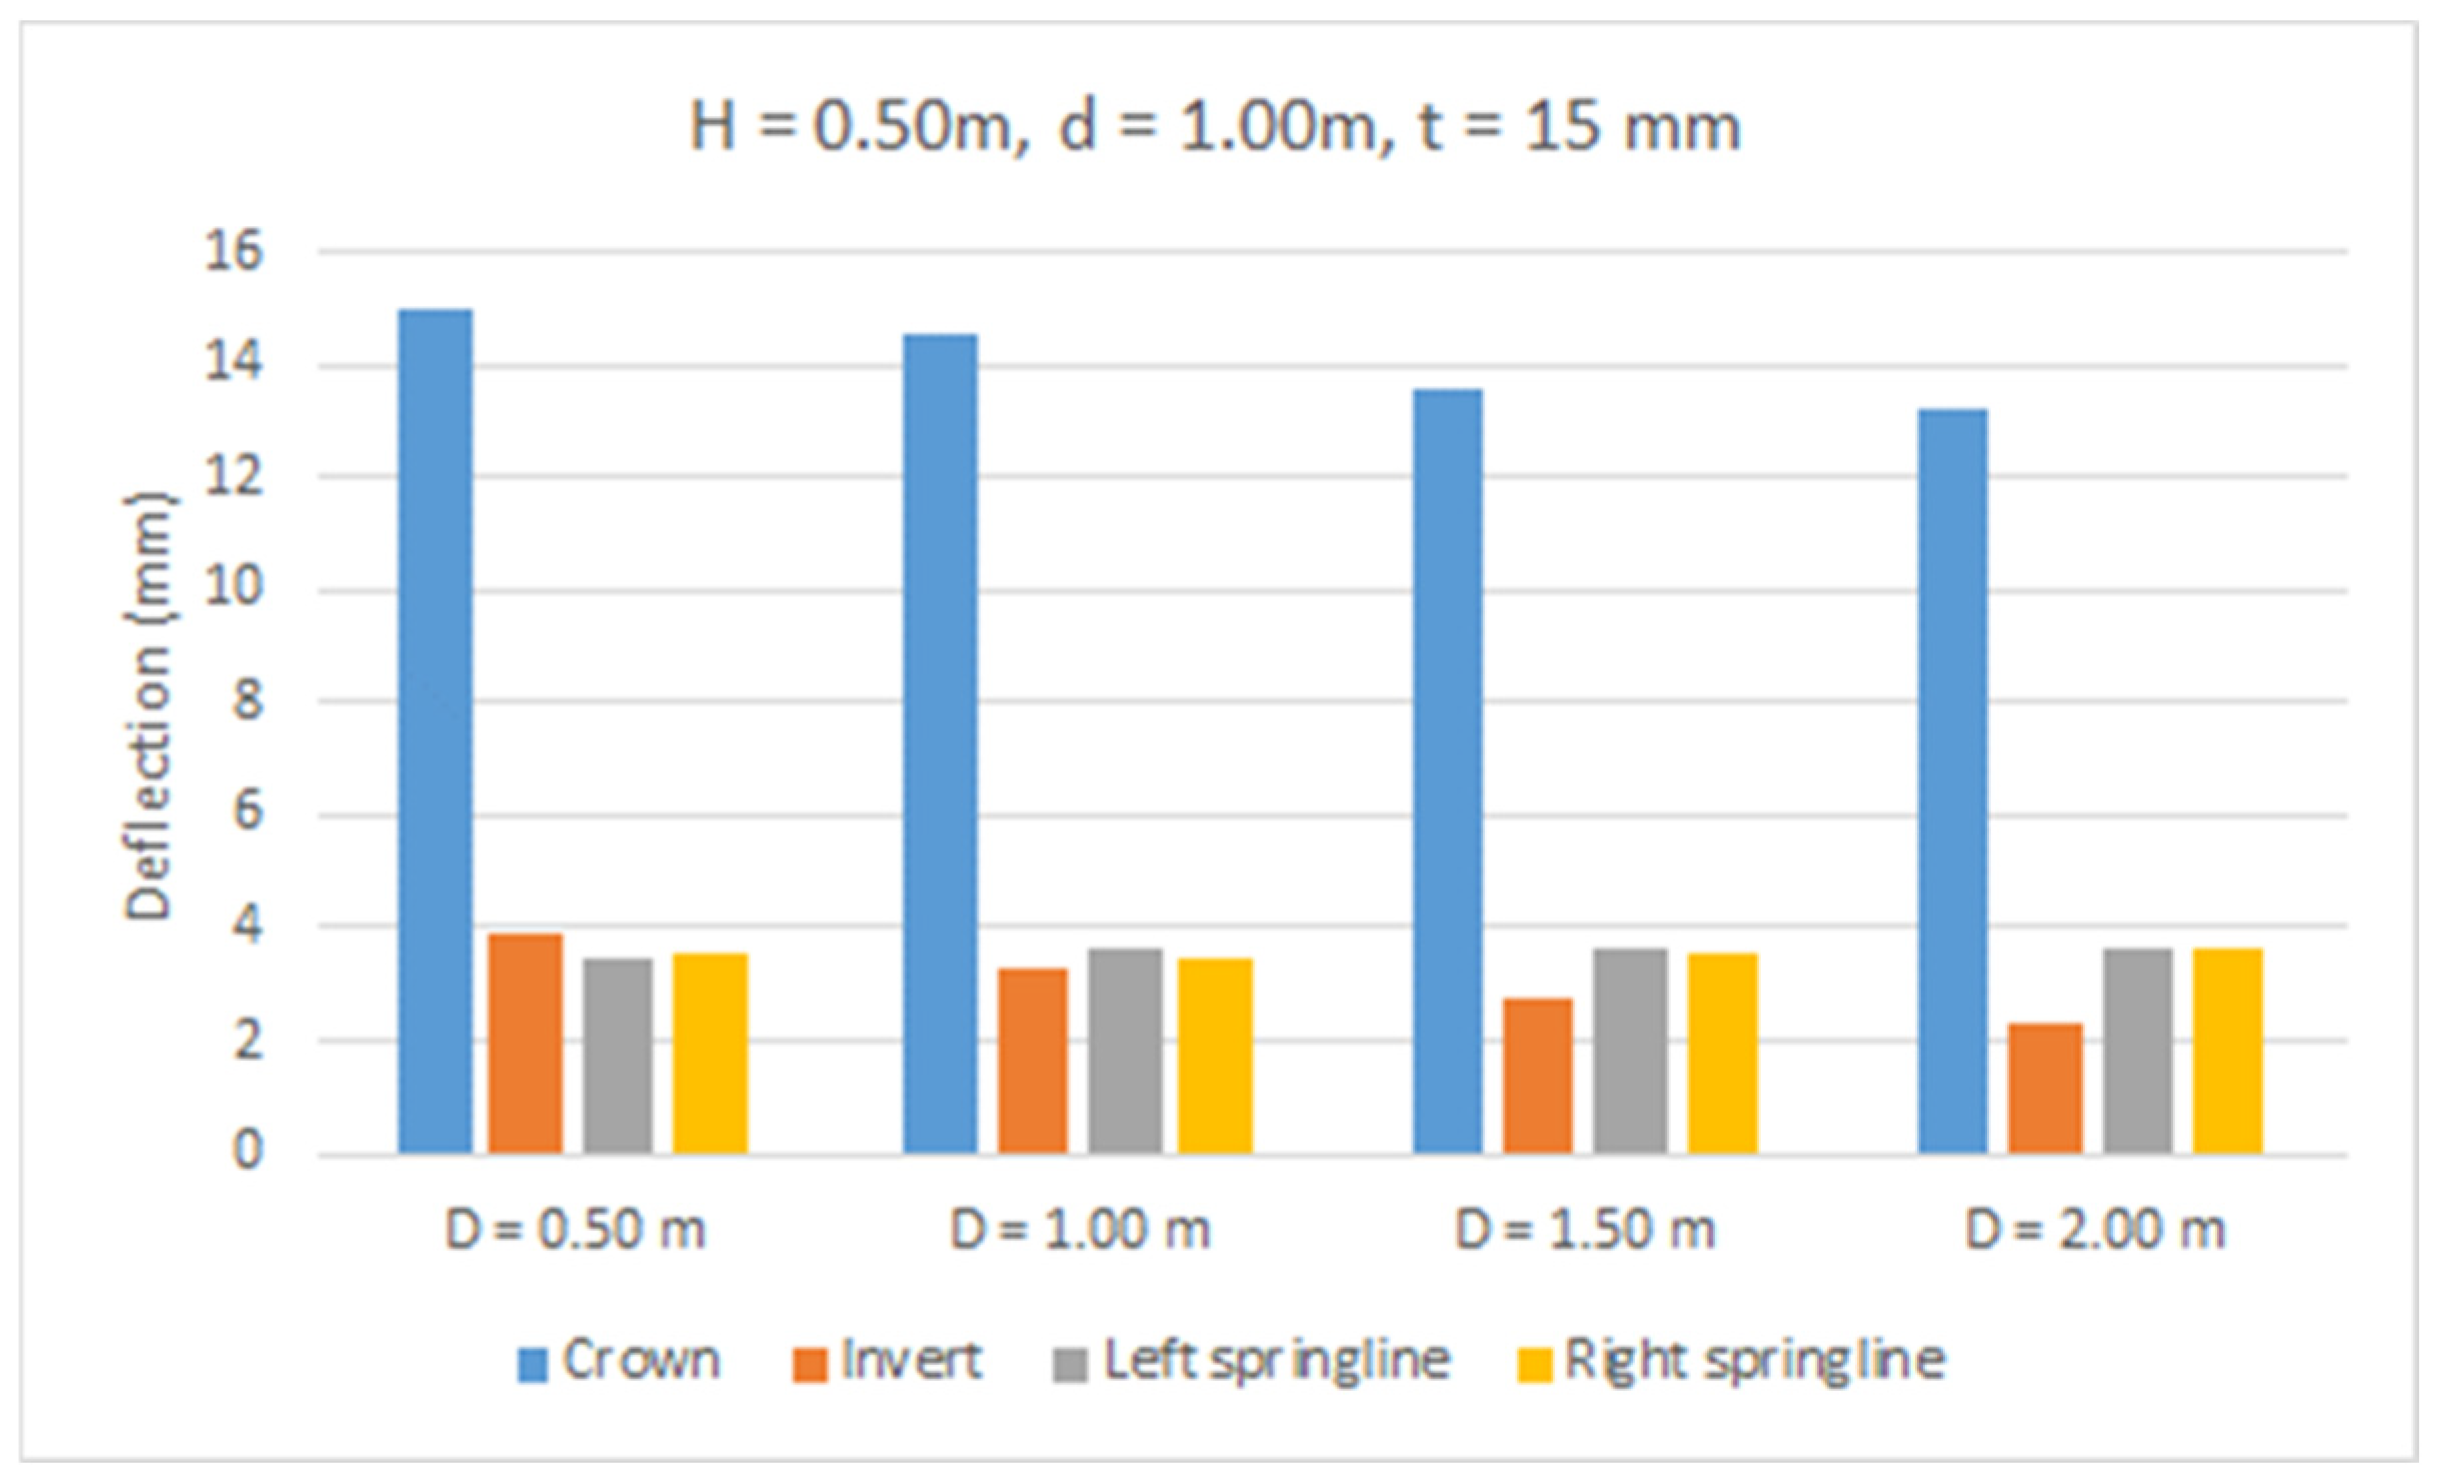
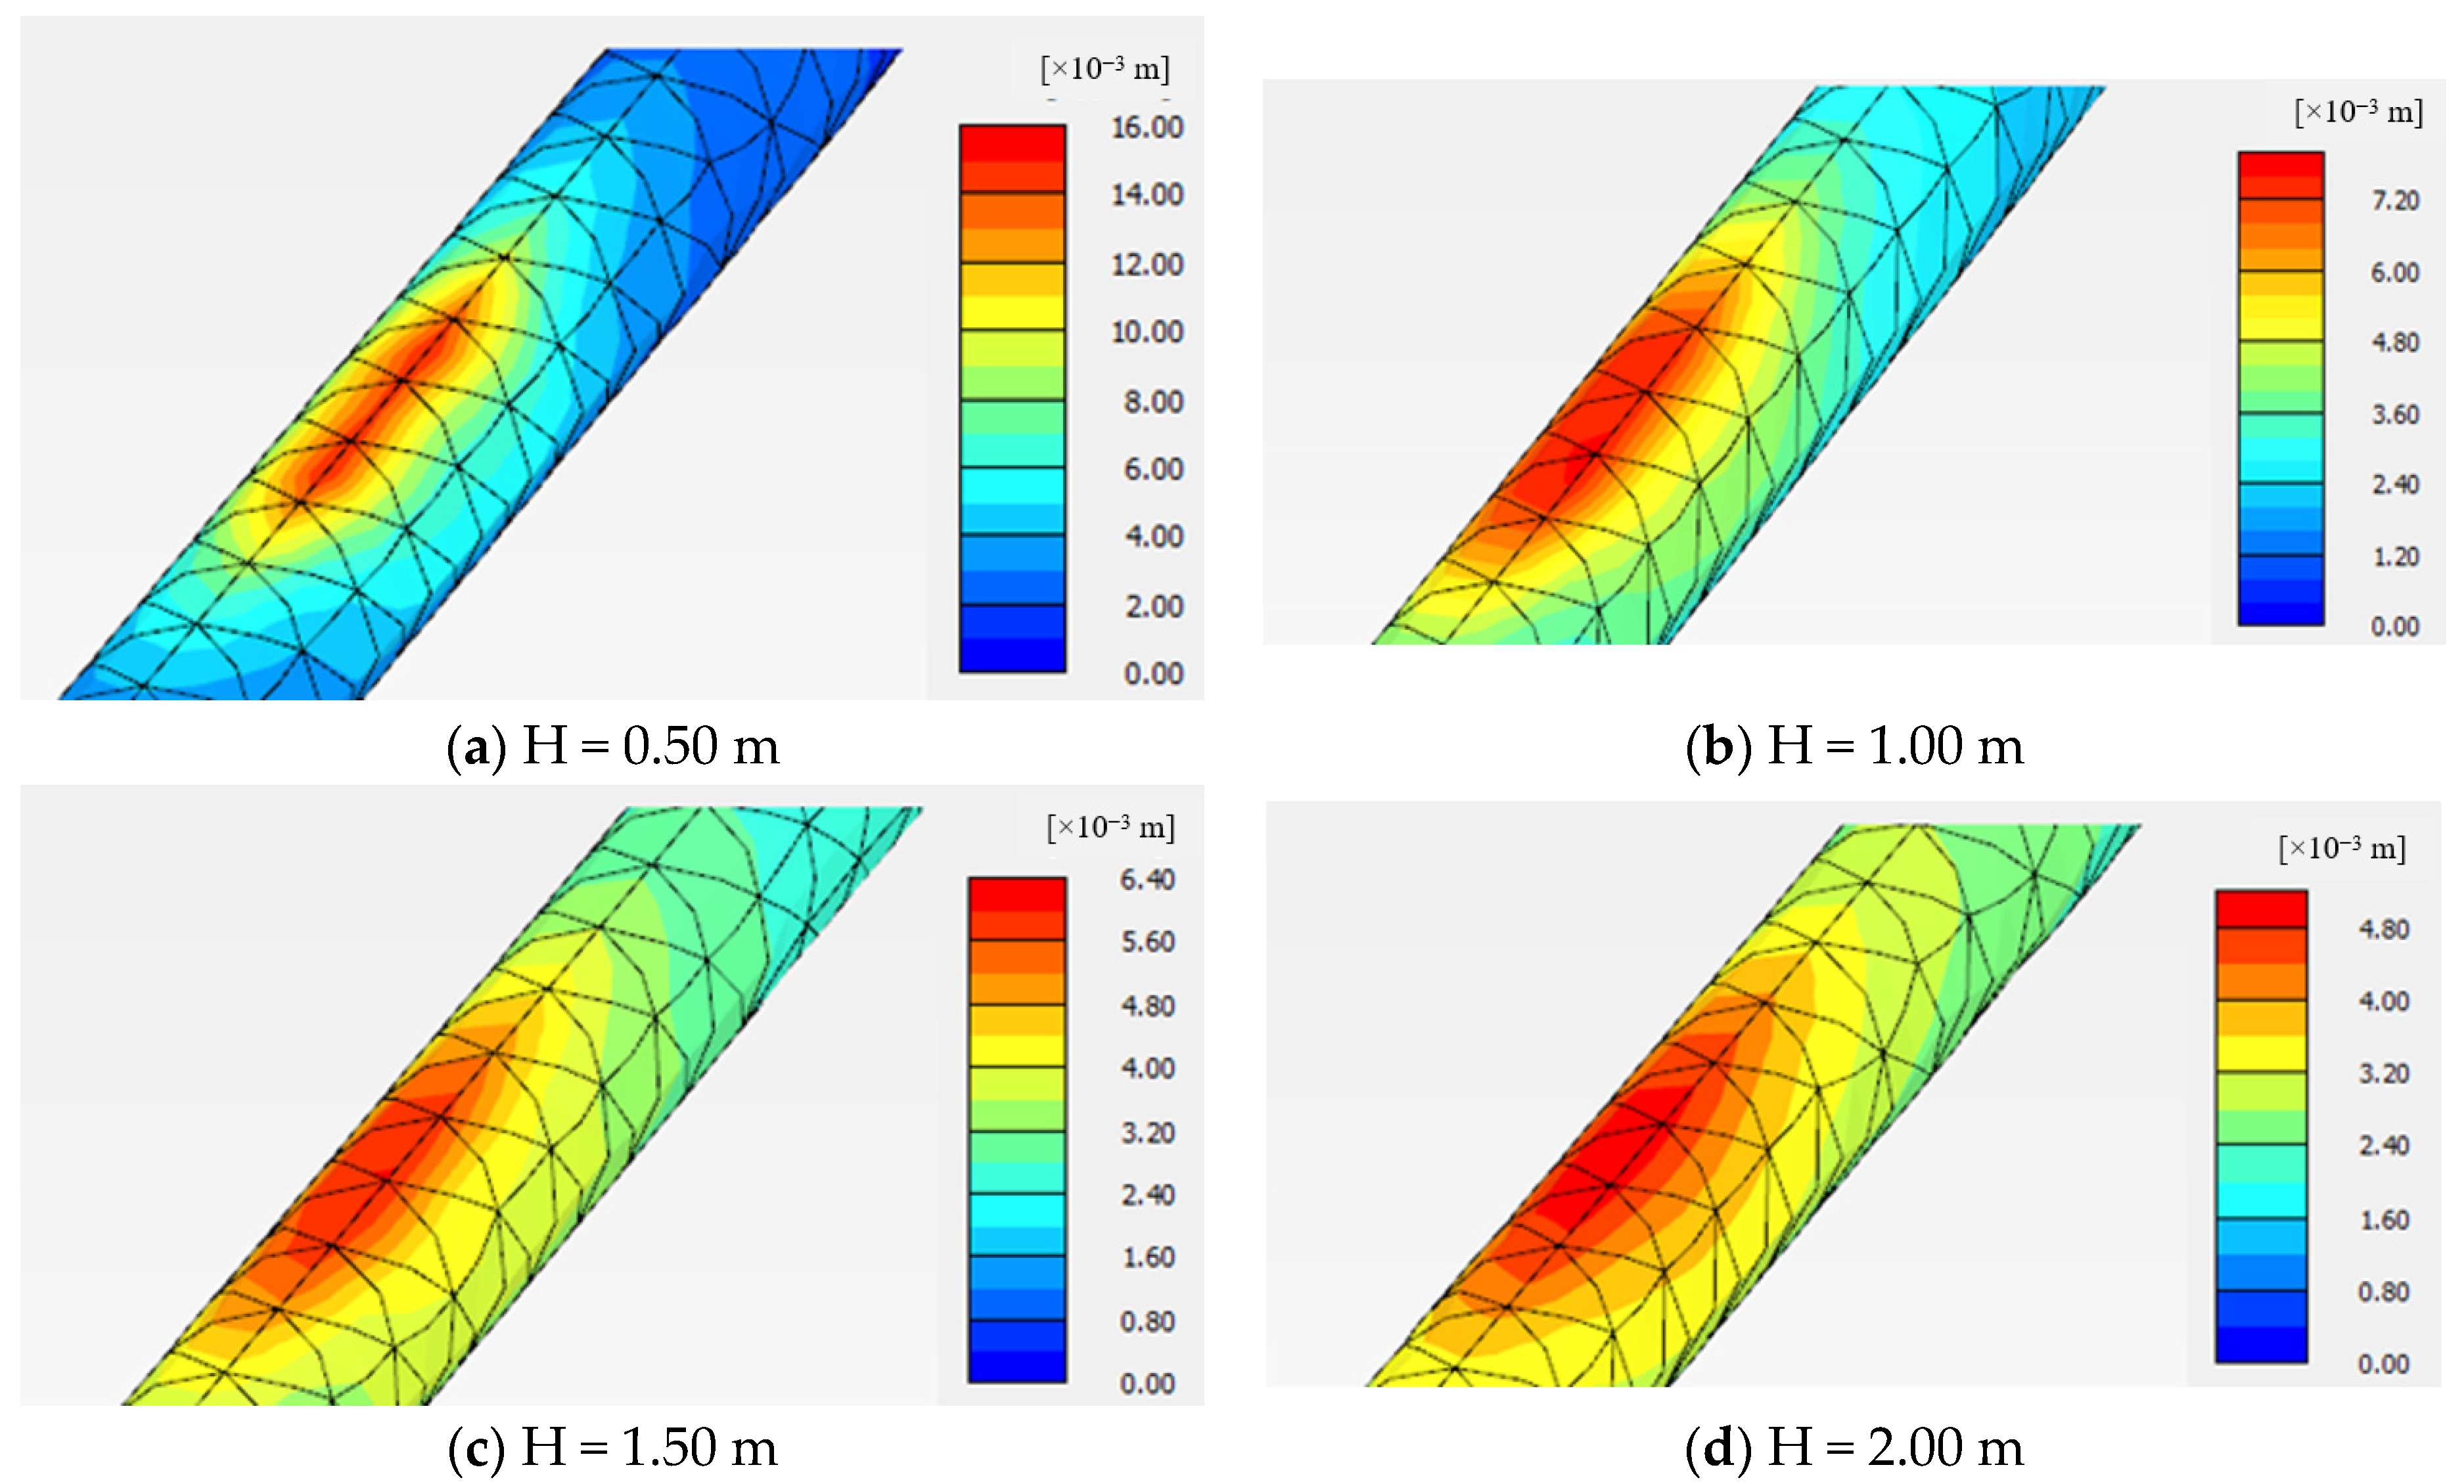
The effect of bedding depth on the deflection behavior of buried GRP pipes subjected to equivalent traffic loads was studied and analyzed. Figure 18, Figure 19, Figure 20 and Figure 21 illustrate the deflection of a 1.00 m diameter GRP pipe with a thickness of 15 mm under a 0.50 m backfill, resting on various bedding thicknesses. The results confirm that increasing the bedding depth from 0.50 m to 1.00 m, 1.50 m, and 2.00 m reduced the crown deflection by 3.2%, 9.2%, and 12%, respectively. Additionally, the invert deflection decreased by 16%, 5%, 32%, and 43.3%, respectively, with the same increases in bedding depth. However, deflections at the left and right springlines showed a non-significant increase as the bedding depth increased from 0.50 m to 1.00 m, 1.50 m, and 2.00 m.

Figure 18.
Pipe deflection with different bedding depths (D) and constant pipe diameter (d = 1.00 m), pipe thickness (t = 15 mm), and backfill depth (H = 0.50 m).
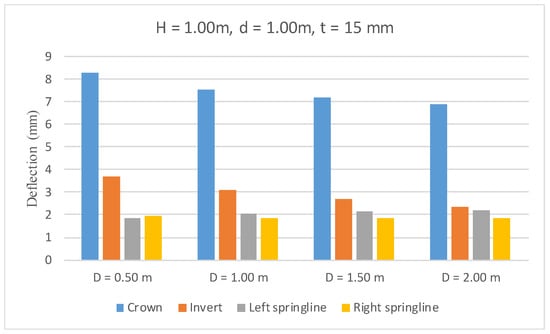
Figure 19.
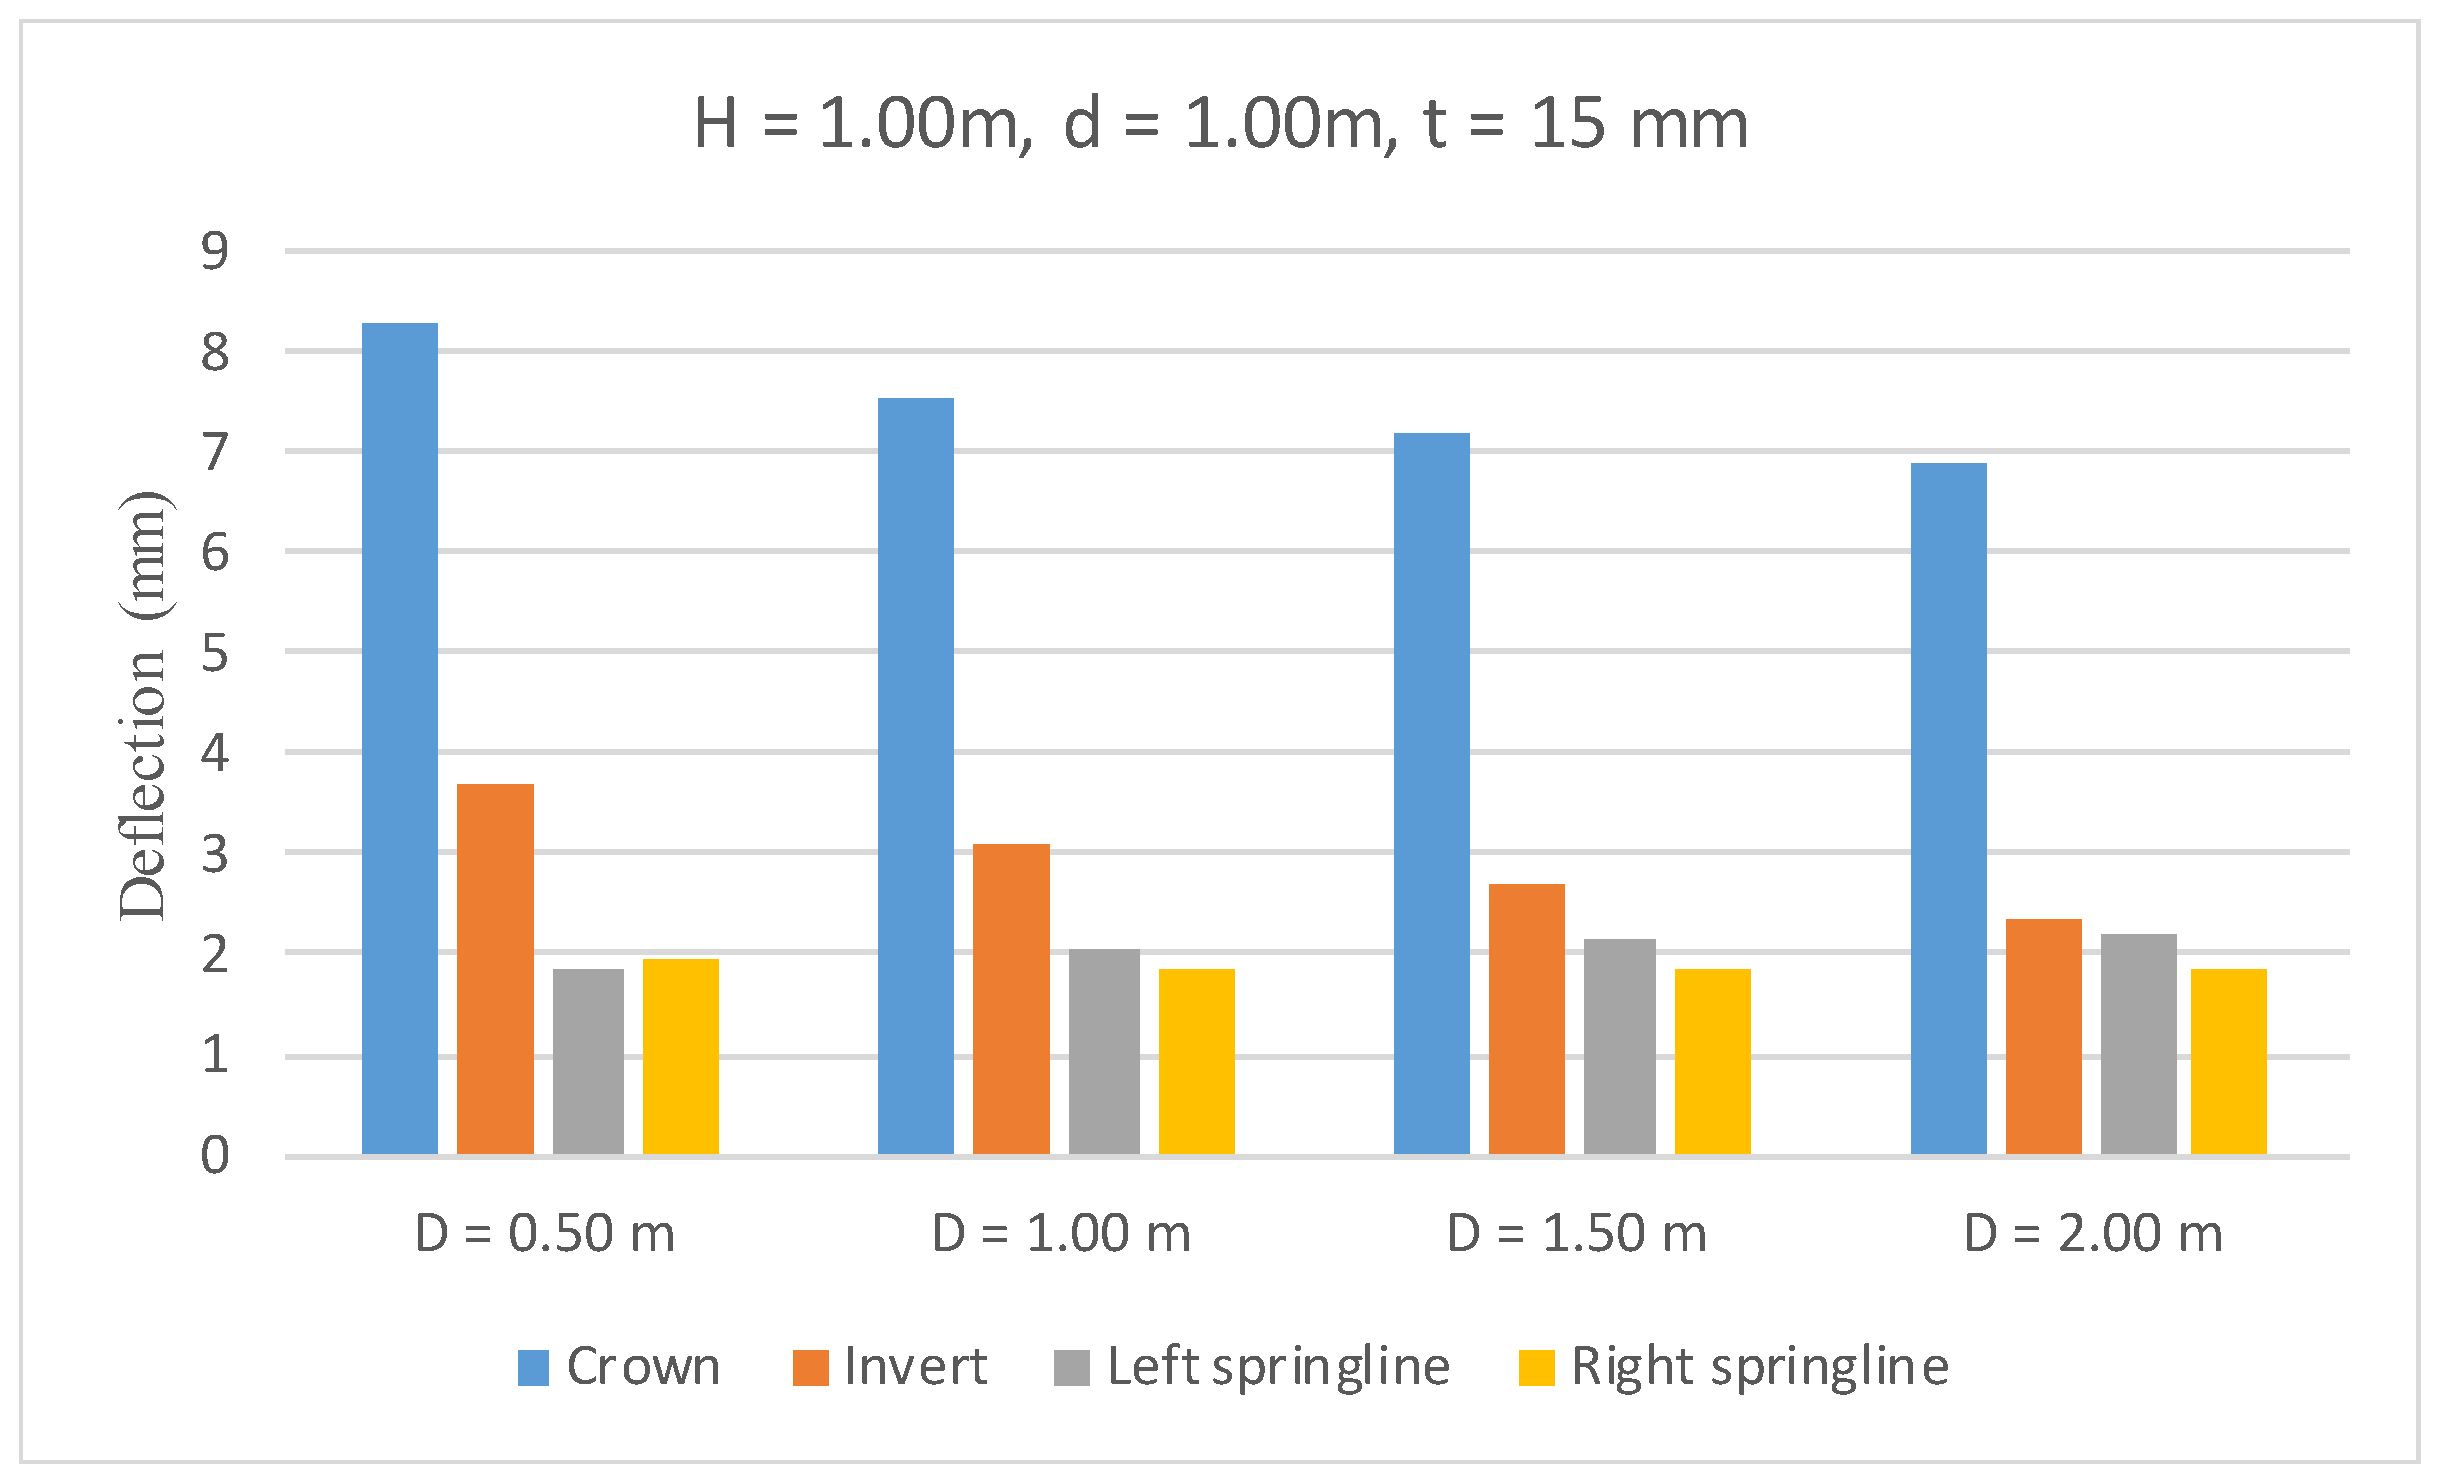
Pipe deflection with different bedding depths (D) and constant pipe diameter (d = 1.00 m), pipe thickness (t = 15 mm), and backfill depth (H = 1.00 m).
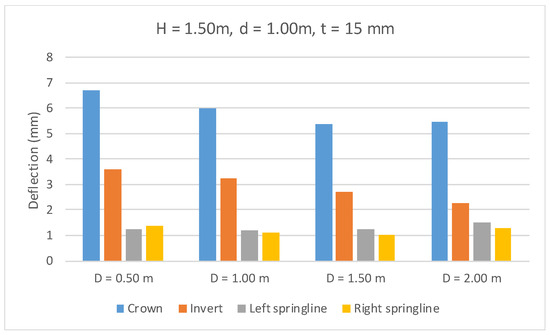
Figure 20.
Pipe deflection with different bedding depths (D) and constant pipe diameter (d = 1.00 m), pipe thickness (t = 15 mm), and backfill depth (H = 1.50 m).
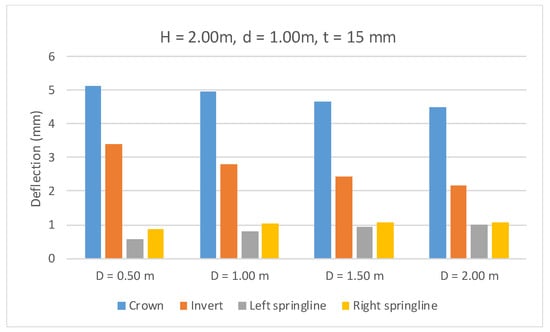
Figure 21.
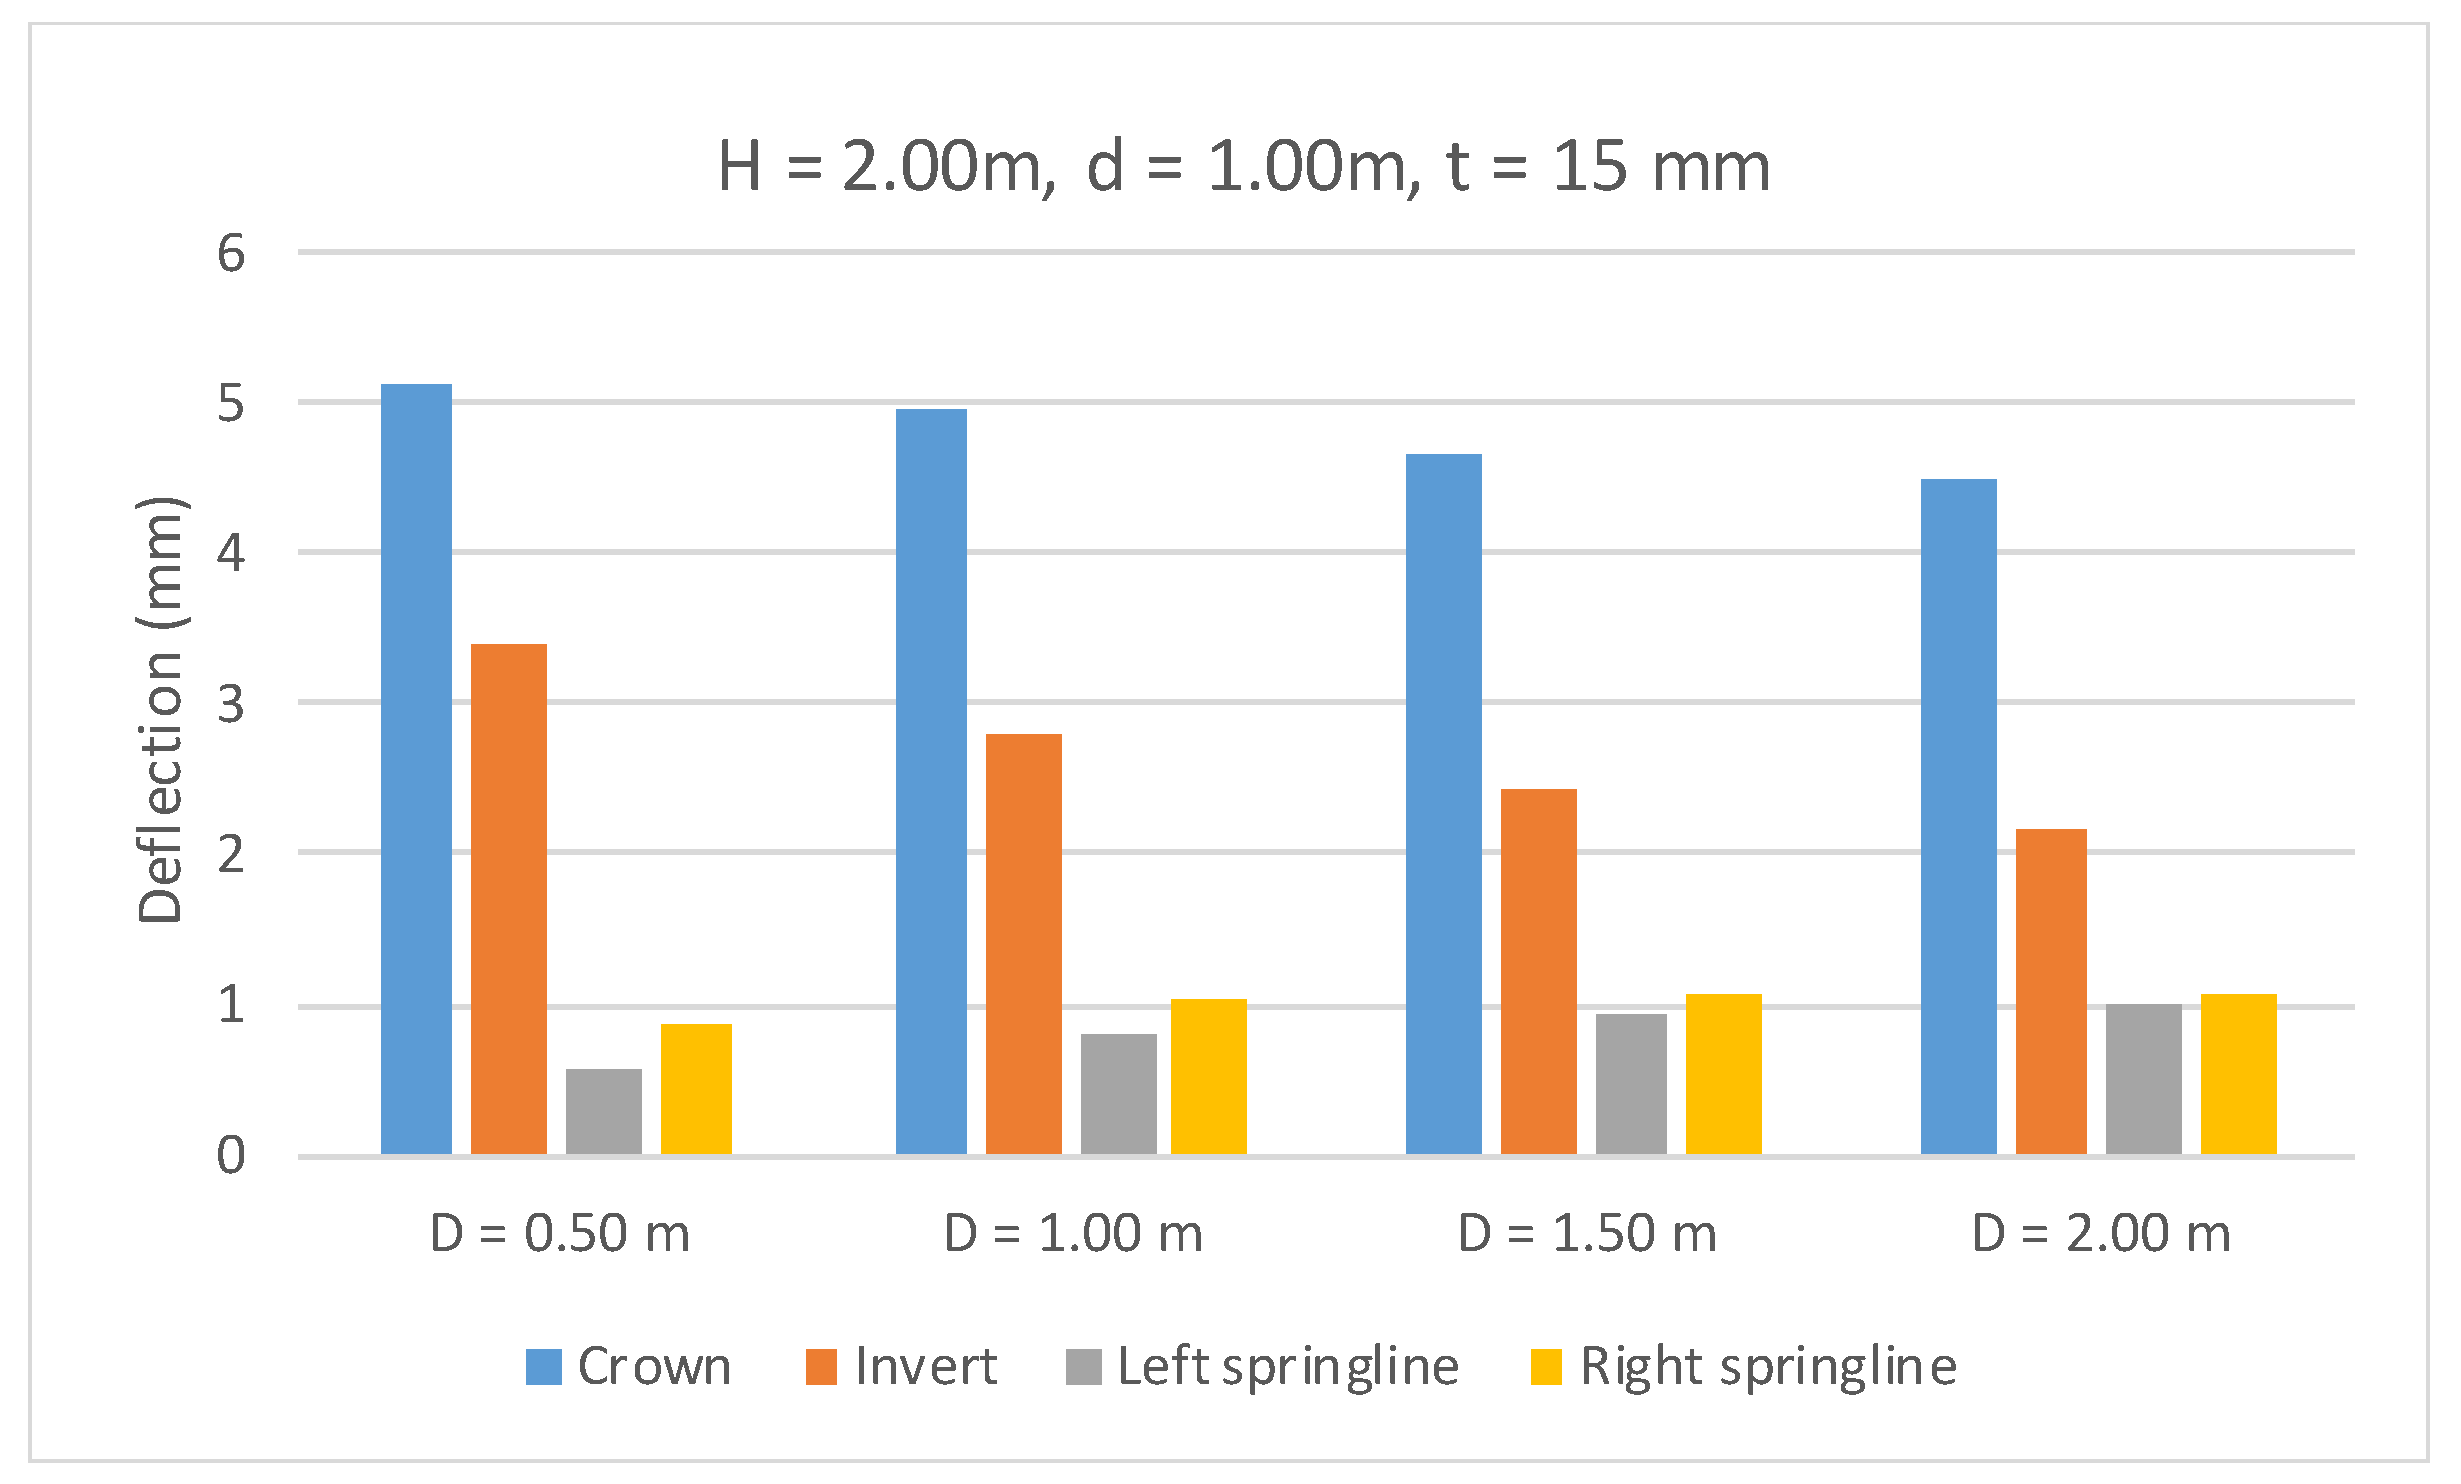
Pipe deflection with different bedding depths (D) and constant pipe diameter (d = 1.00 m), pipe thickness (t = 15 mm), and backfill depth (H = 2.00 m).
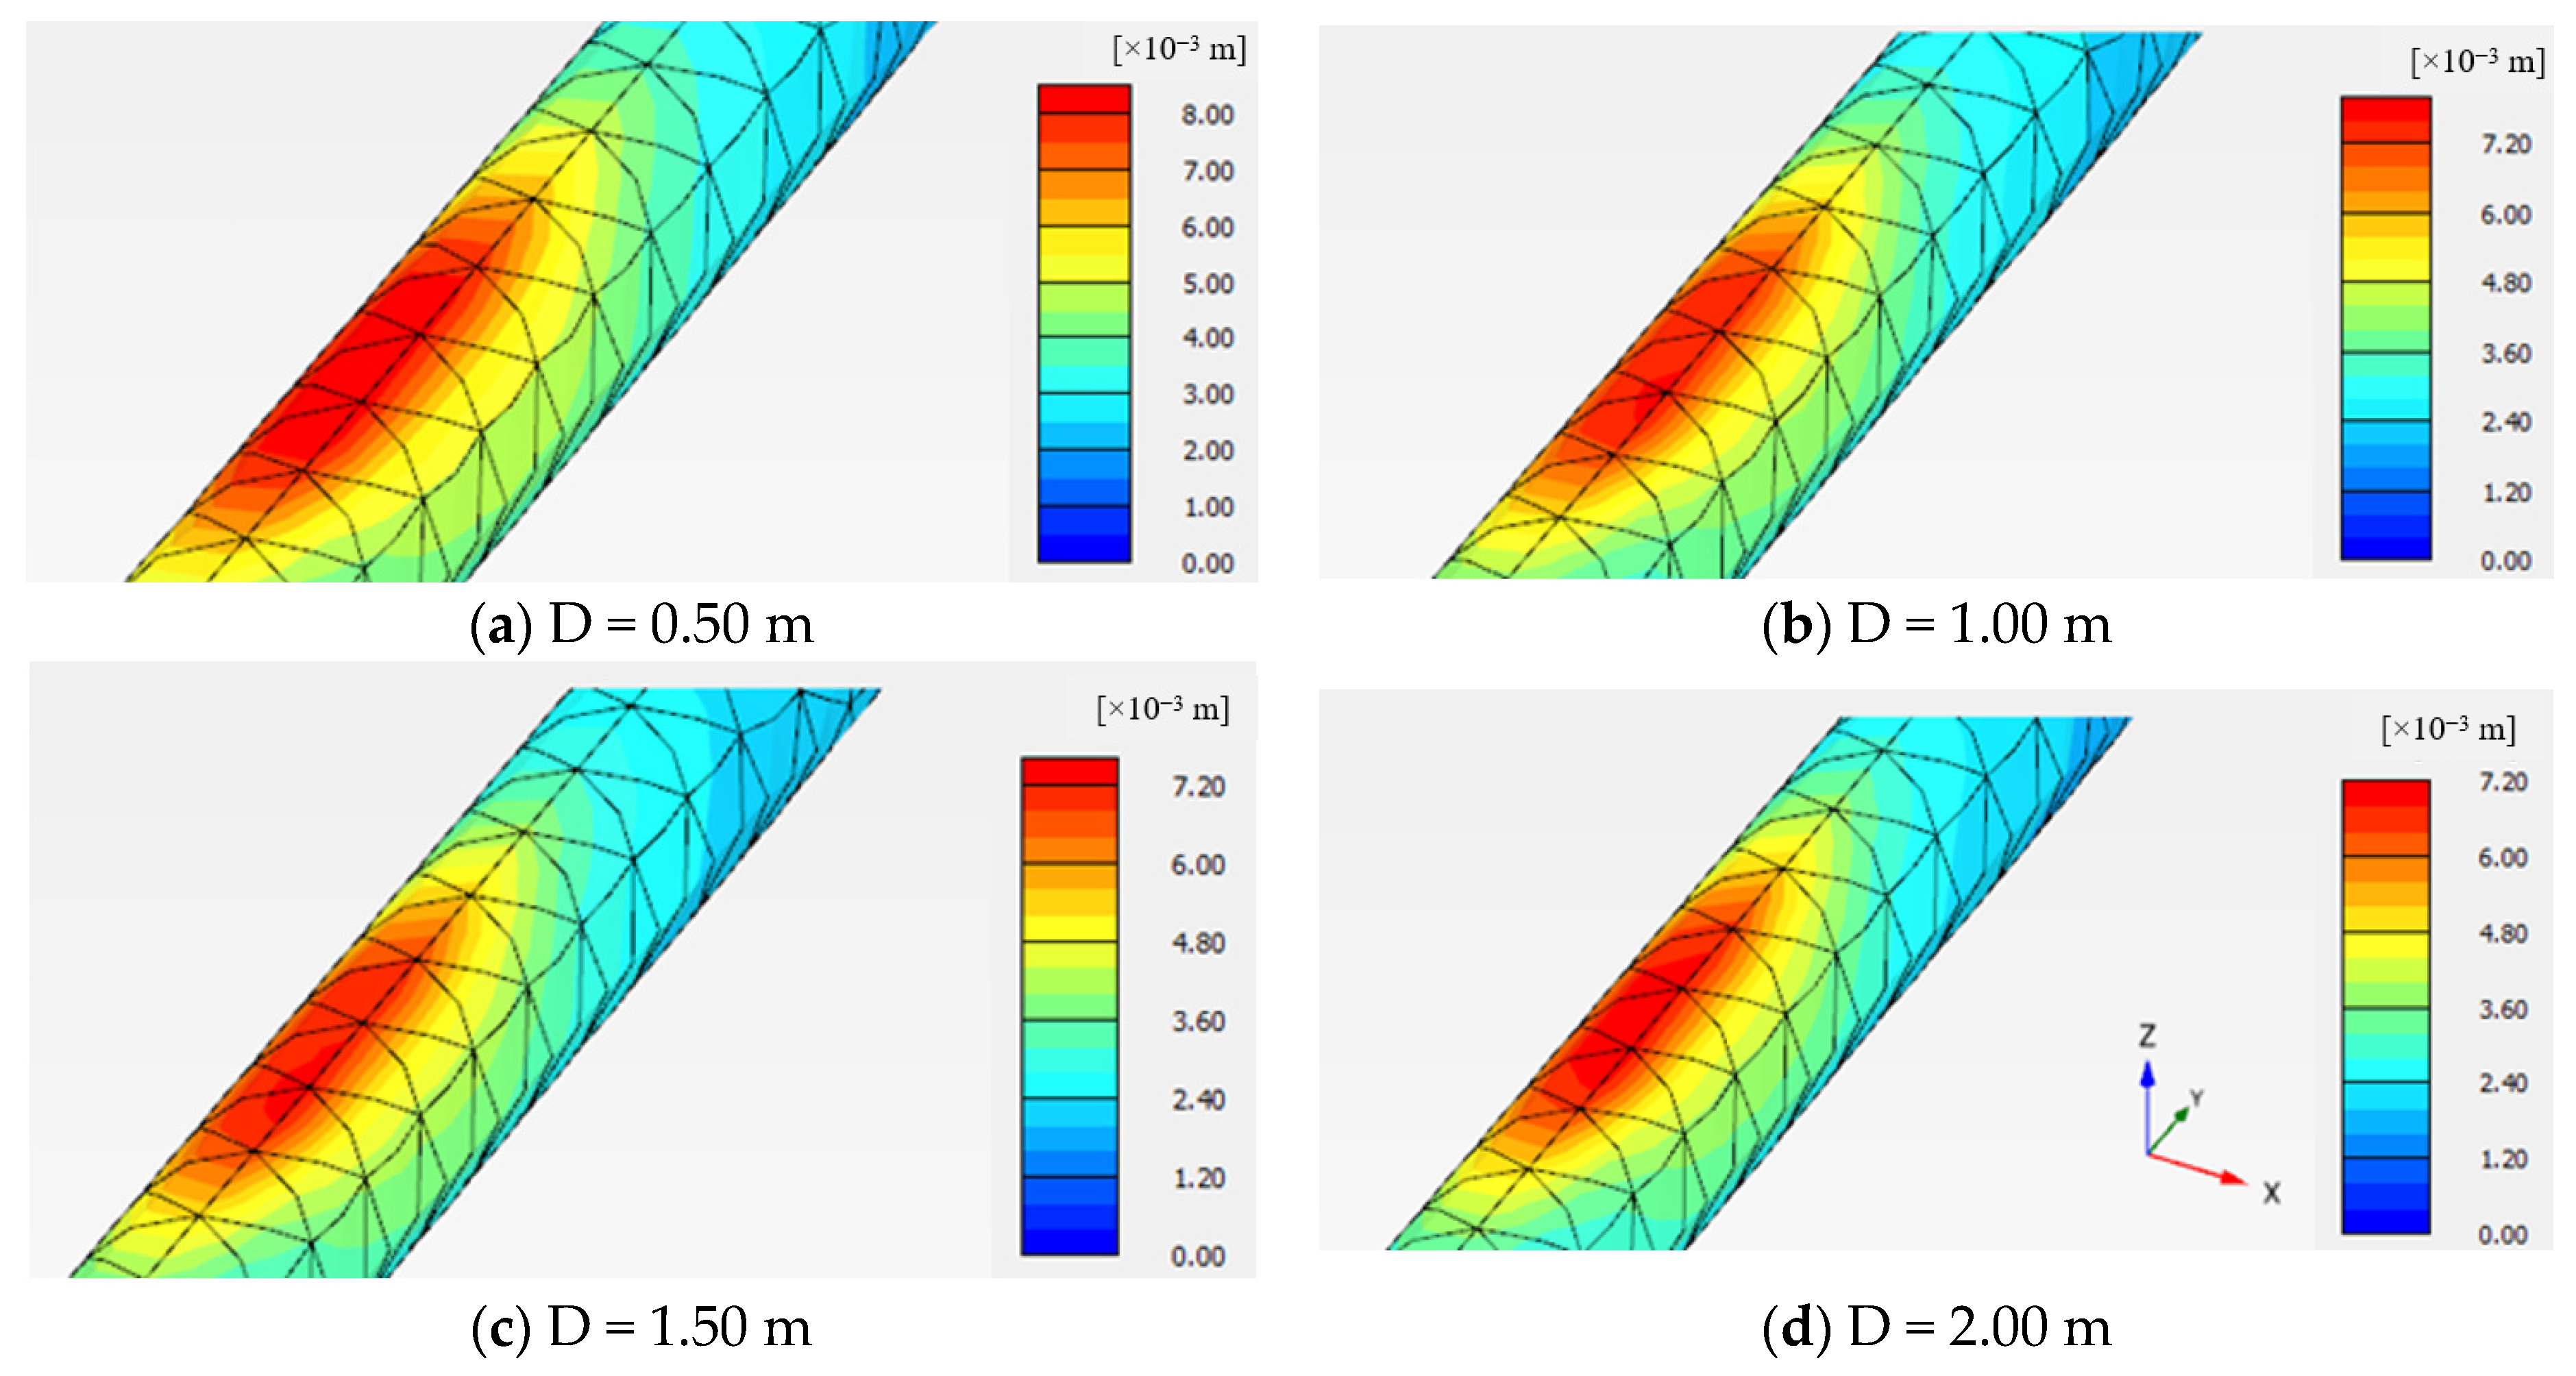
Similar crown and invert deflection behavior occurred when the backfill thickness increased to 1.00, 1.50, and 2.00 m, as shown in Figure 19, Figure 20 and Figure 21. However, the deflection of left and right springlines showed a significant increase when the bedding depth increased from 0.50 m to 1.00, 1.50, and 2.00 m at backfill depth of 1.00, 1.50, and 2.00 m. For the 2.00 m backfill case, the left springline deflection increased by 46, 66, and 78% when the bedding depth increased from 0.50 m to 1.00, 1.50, and 2.00 m, respectively. In addition, the right springline deflection increased by 18, 22, and 24% when the bedding depth increased from 0.50 m to 1.00, 1.50, and 2.00 m, respectively. Figure 22 presents a comparison of Plaxis output pipe deflections between pipes with 1.00 m backfill, 1.00 m diameter, 15 mm thickness, and different bedding depths. It is indicated that the maximum deflection occurs at a point diverged from the pipe center to the left, and that is due to the position of the load, as shown in Figure 17. Furthermore, the deflection of the left springline is greater than the right springline deflection, due to the same reason.

Figure 22.
Comparisons of the pipe deflection with different bedding depths (D) and constant pipe diameter (d = 1.00 m), pipe thickness (t = 15 mm), and backfill depth (H = 1.00 m).
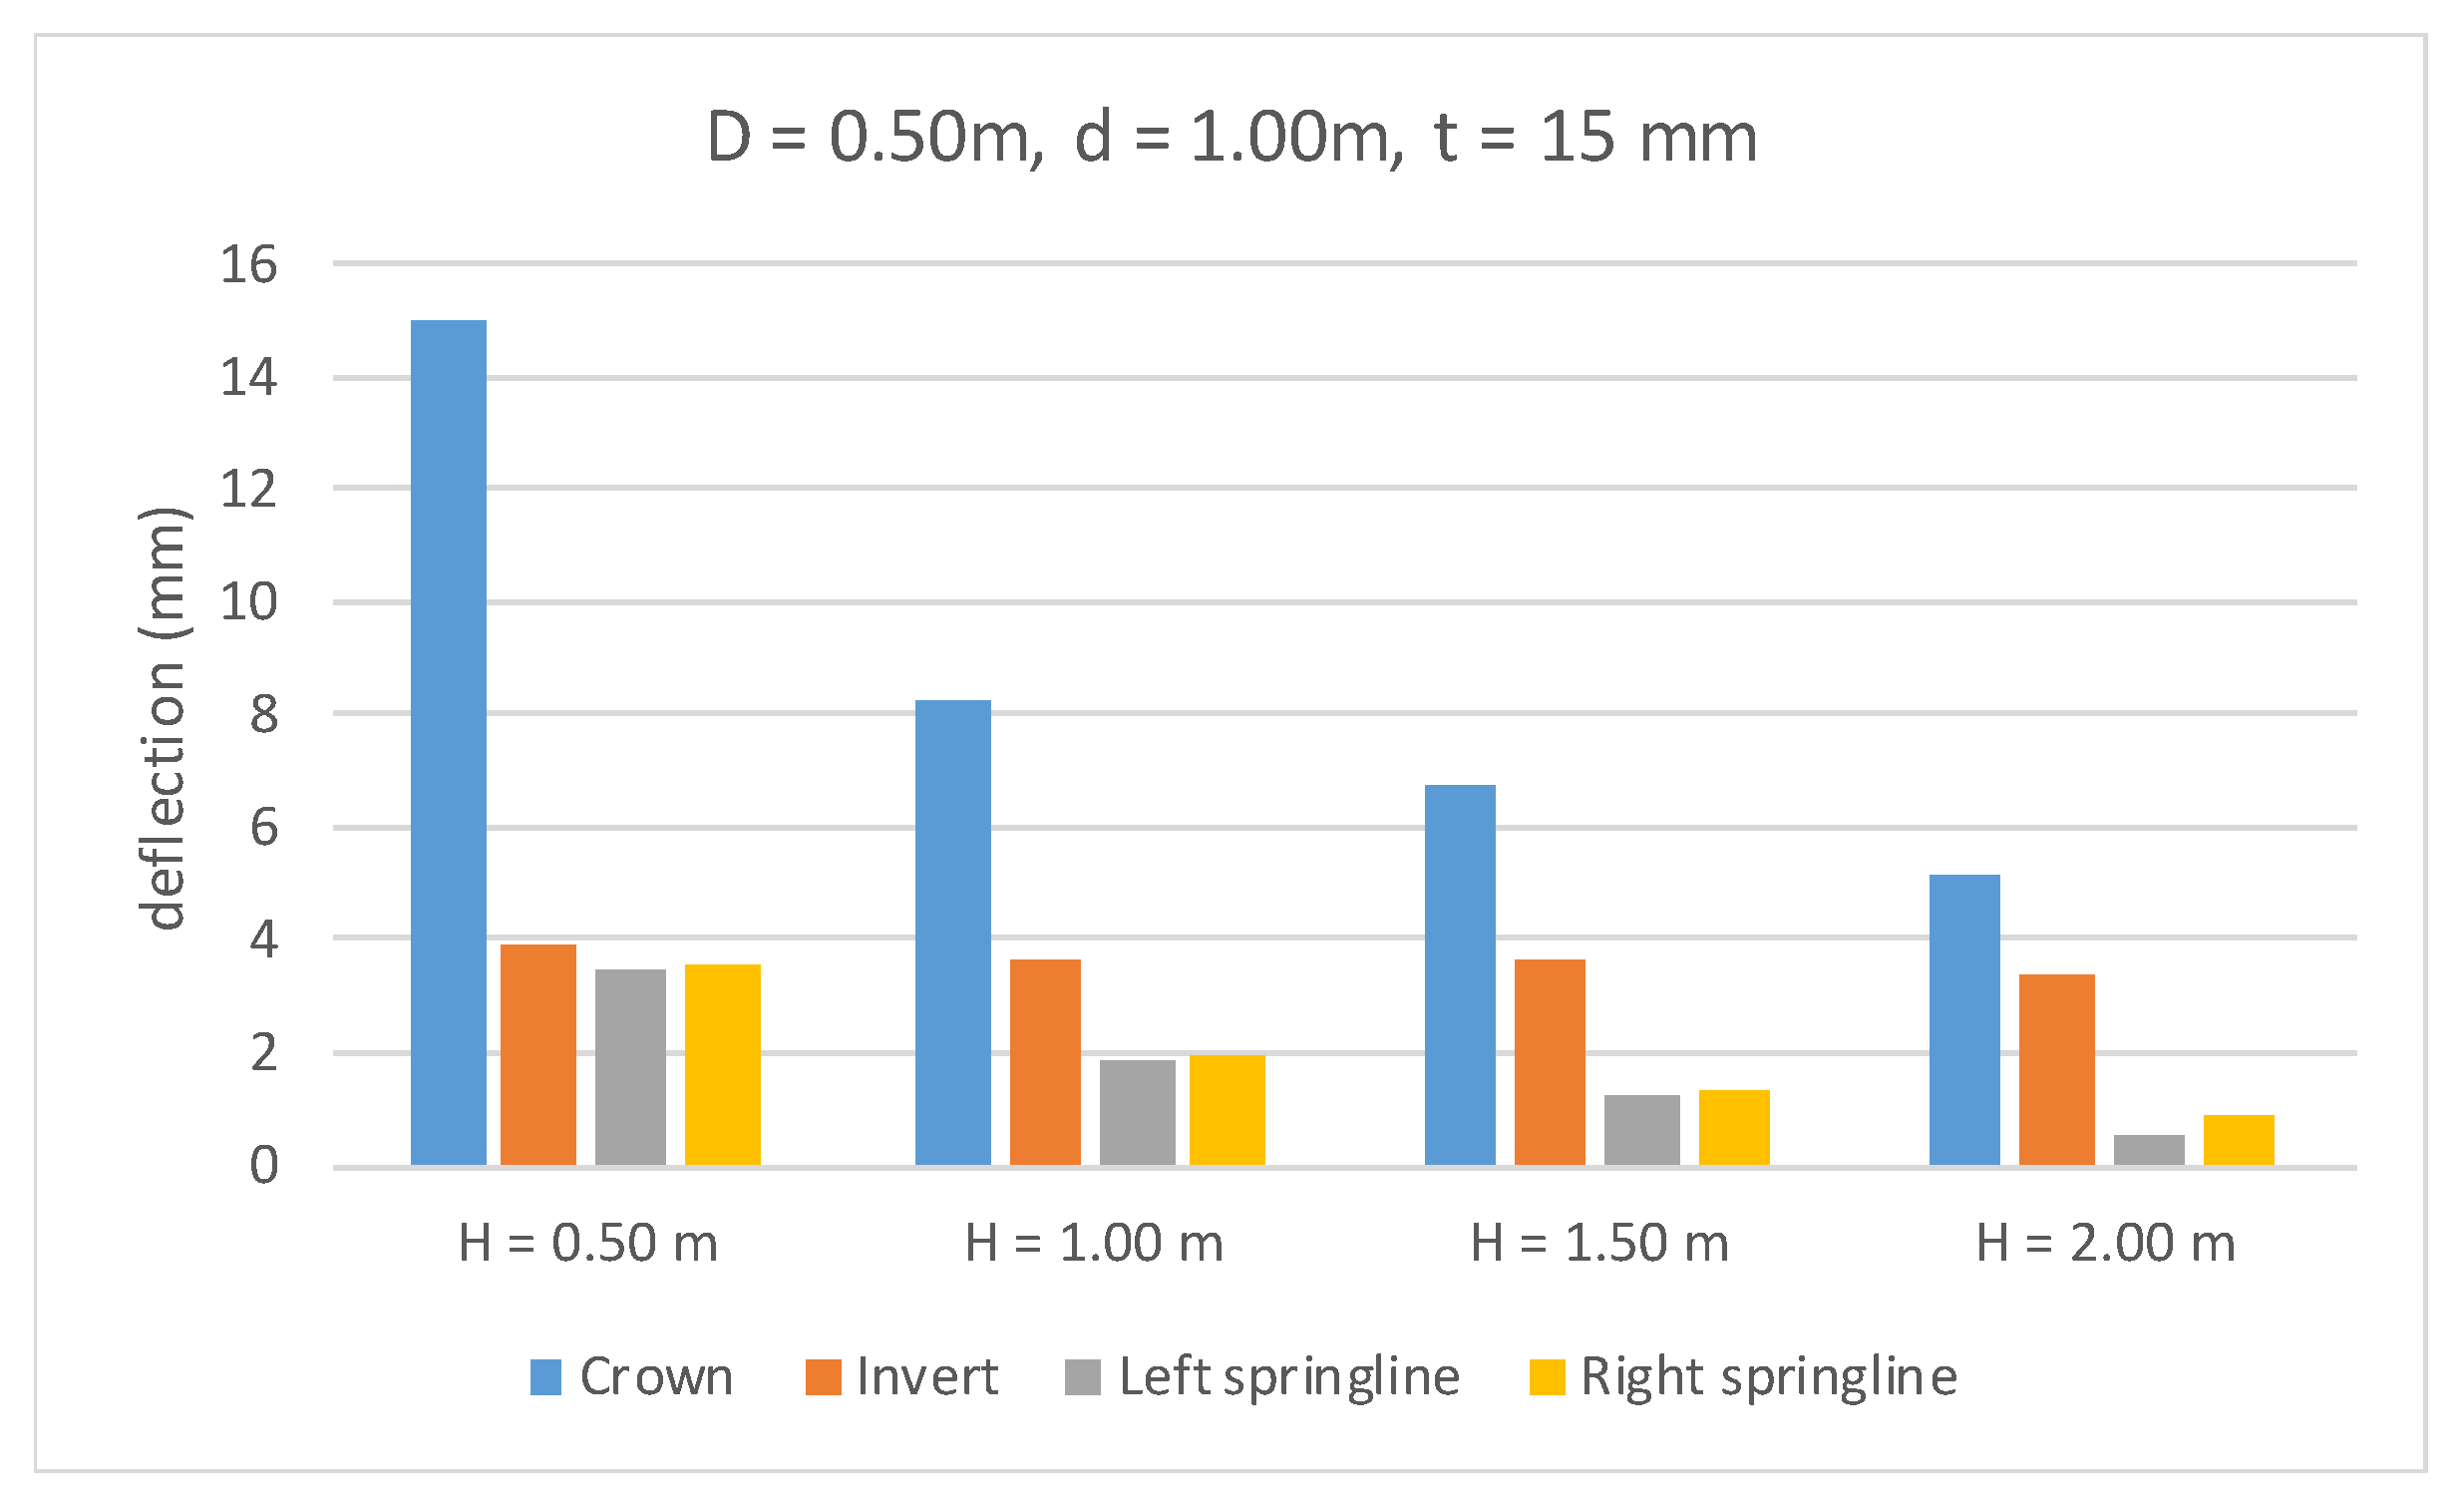
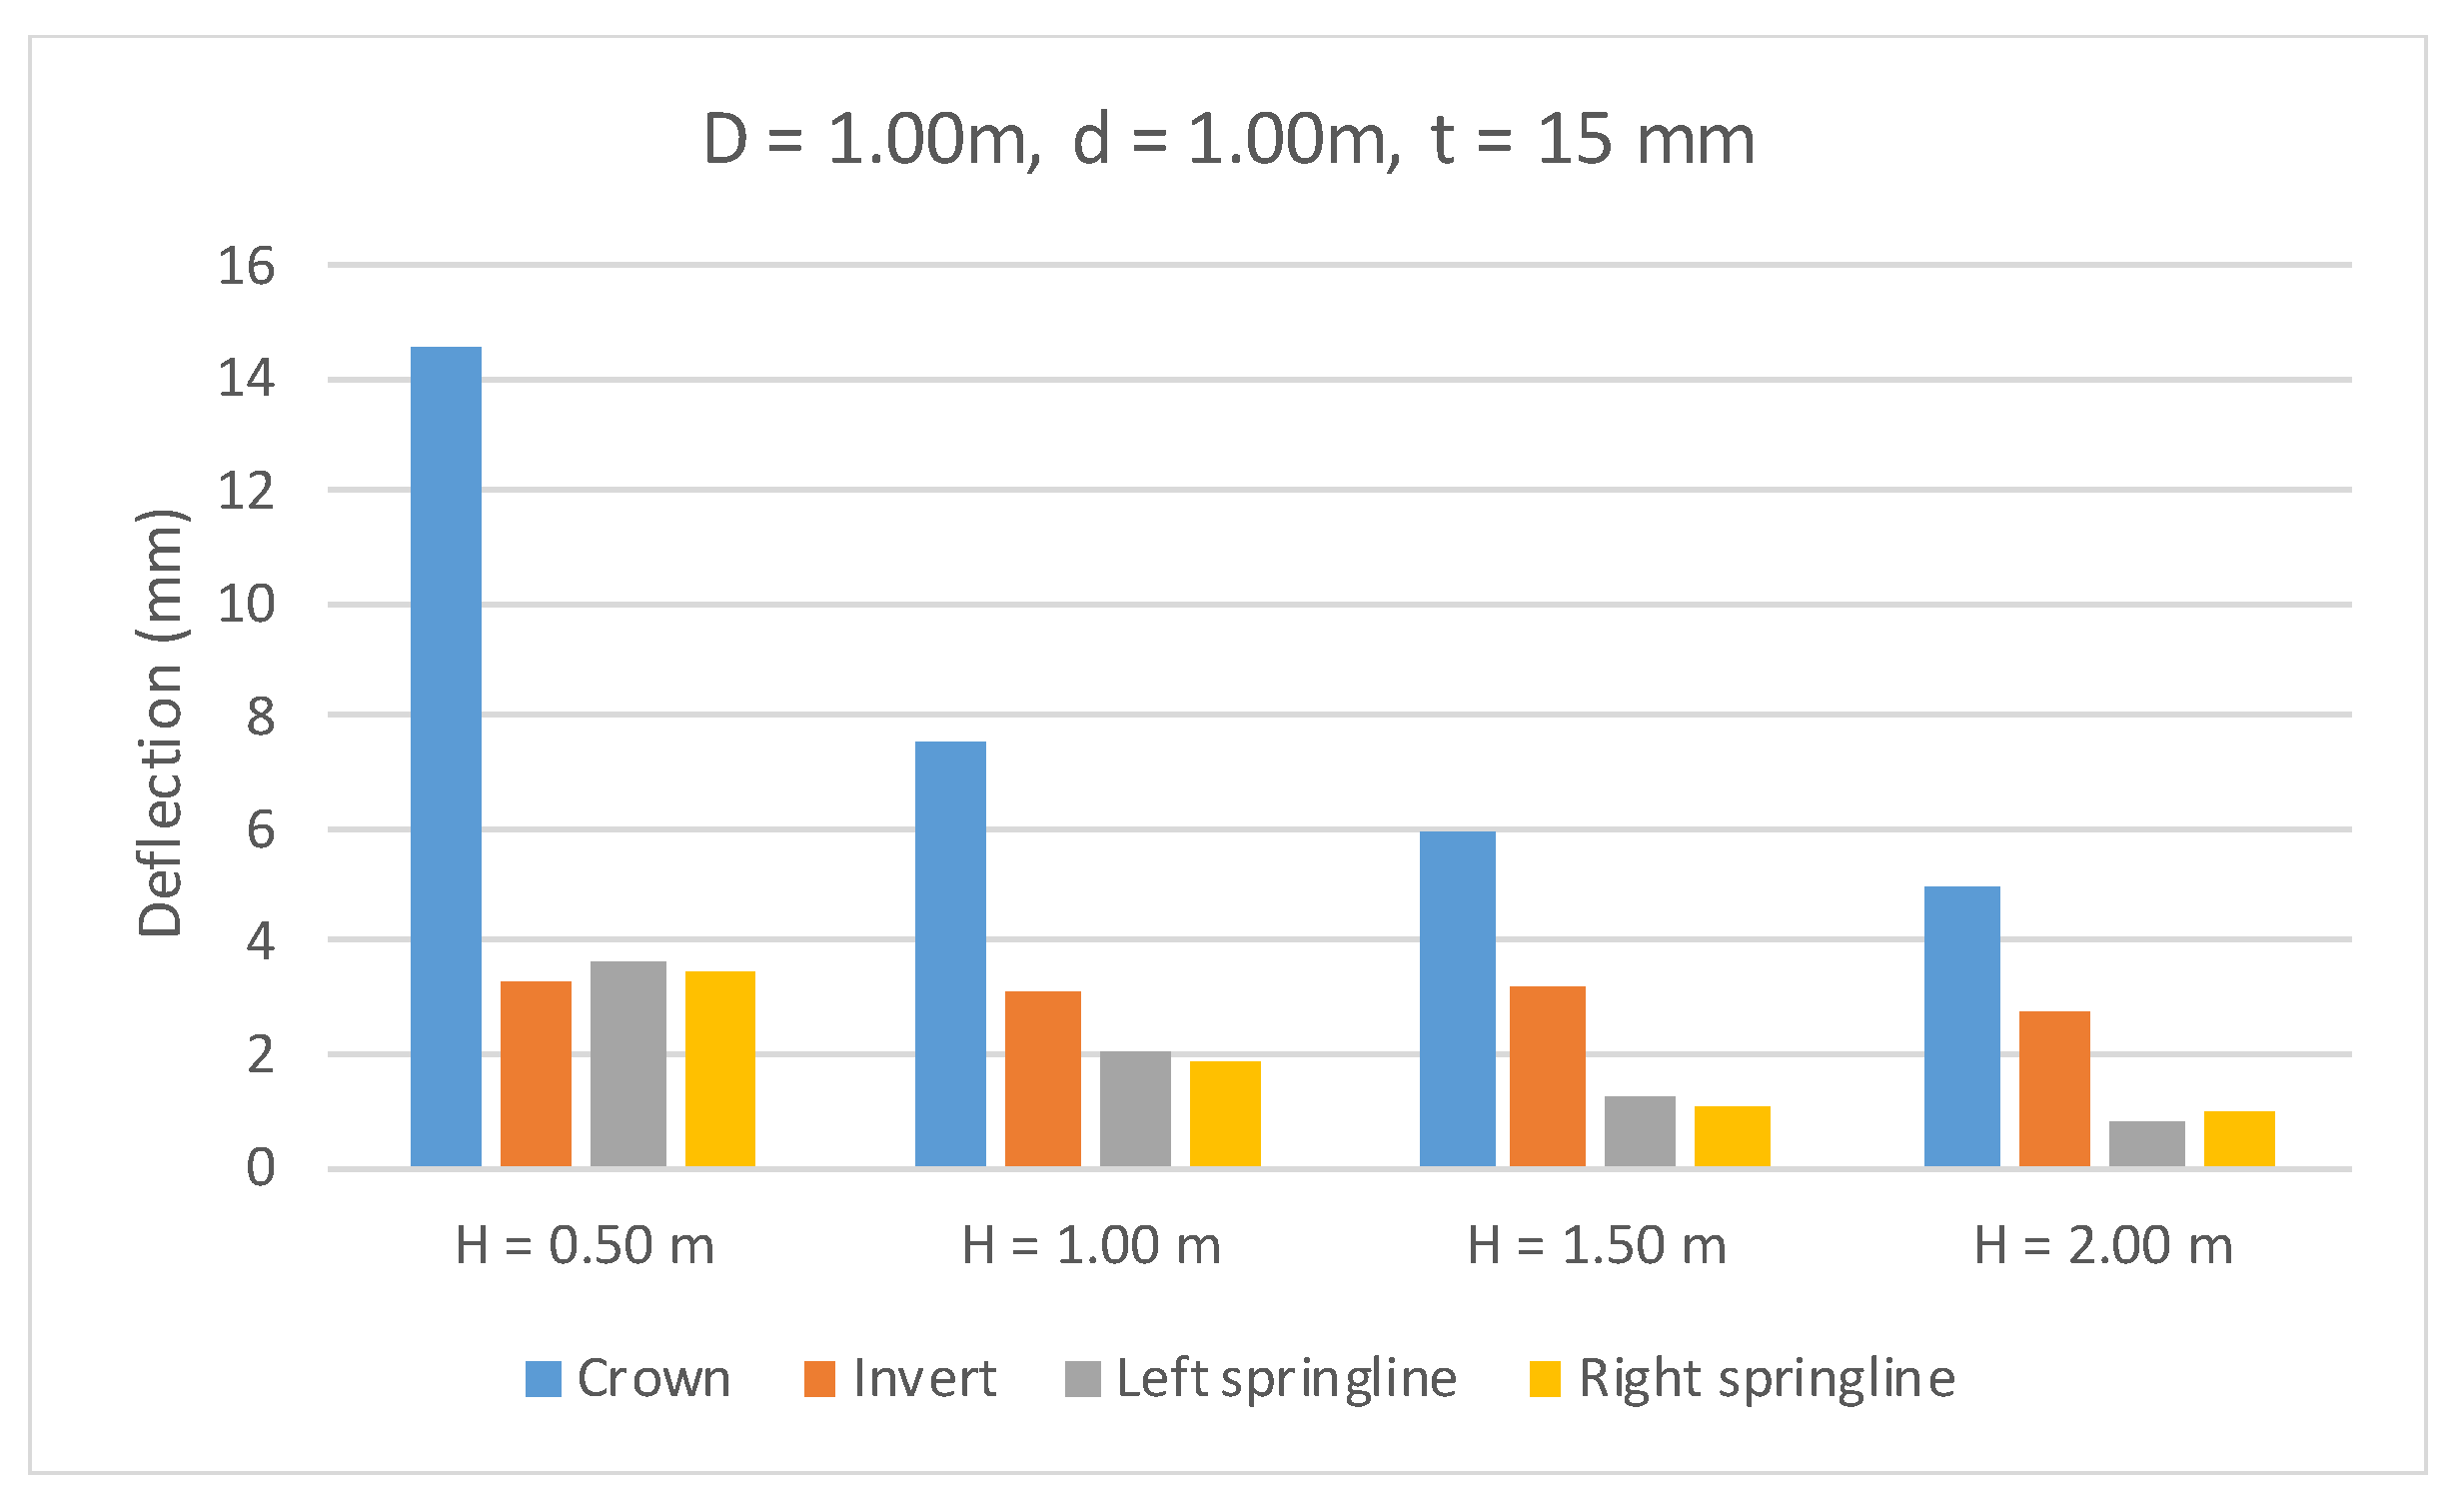
5.2. Backfill Depth
The backfill depth over buried pipes has an essential role in the pipe deflection. Therefore, the influence of backfill depth on the deflection of 1.00 m diameter GRP pipe with thickness of 15 mm resting over different bedding depths is presented in Figure 23, Figure 24, Figure 25 and Figure 26. At bedding depth = 0.50 m, the crown deflection decreased from 15 mm to 8.29 mm, 6.70 mm, and 5.12 mm when the backfill depth increased from 0.5 m to 1.00 m, 1.50 m, and 2.00 m, respectively. Furthermore, the left and right springlines deflection show a noticeable decrease from 3.46 mm to 1.83 mm, 1.23 mm, and 0.55 mm, and from 3.59 mm to 1.96 mm, 1.36 mm, and 0.86 mm when the backfill depth increased from 0.50 m to 1.00 m, 1.50 m, and 2.00 m, respectively. A similar trend occurred when the bedding depth changed to 1.00, 1.50, and 2.00 m, as shown in Figure 20, Figure 21 and Figure 22.

Figure 23.
Pipe deflection with different backfill depths (H) and constant pipe diameter (d = 1.00 m), pipe thickness (t = 15 mm), and bedding depth (D = 0.50 m).
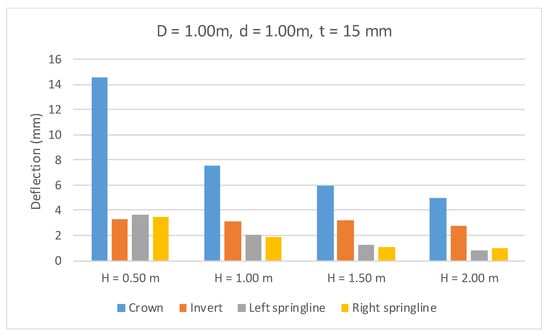
Figure 24.
Pipe deflection with different backfill depths (H) and constant pipe diameter (d = 1.00 m), pipe thickness (t = 15 mm), and bedding depth (D = 1.00 m).
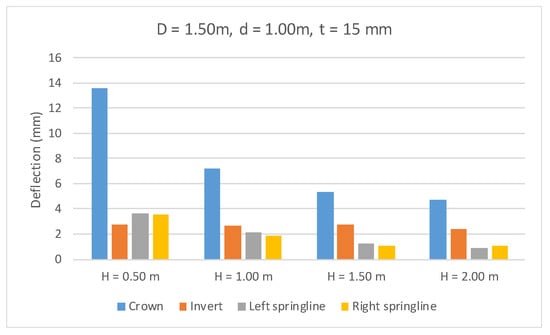
Figure 25.
Pipe deflection with different backfill depths (H) and constant pipe diameter (d = 1.00 m), pipe thickness (t = 15 mm), and bedding depth (D = 1.50 m).

Figure 26.
Pipe deflection with different backfill depths (H) and constant pipe diameter (d = 1.00 m), pipe thickness (t = 15 mm), and bedding depth (D = 2.00 m).
On the other hand, the invert deflection did not show a significant change when the backfill depth increased from 0.50 m to 1.00, 1.50, and 2.00 at a constant bedding depth. This occurred because the main controller of invert deflection is the bedding depth, so when the bedding depth is constant while changing the backfill depth, no noticeable change results. Figure 27 presents a comparison of Plaxis output pipe deflections between pipes with 1.00 m bedding, 1.00 m diameter, 15 mm thickness, and different backfill depths.

Figure 27.
Comparisons of pipe deflection with different backfill depths (H) and constant pipe diameter (d = 1.00 m), pipe thickness (t = 15 mm), and bedding depth (D = 1.00 m).
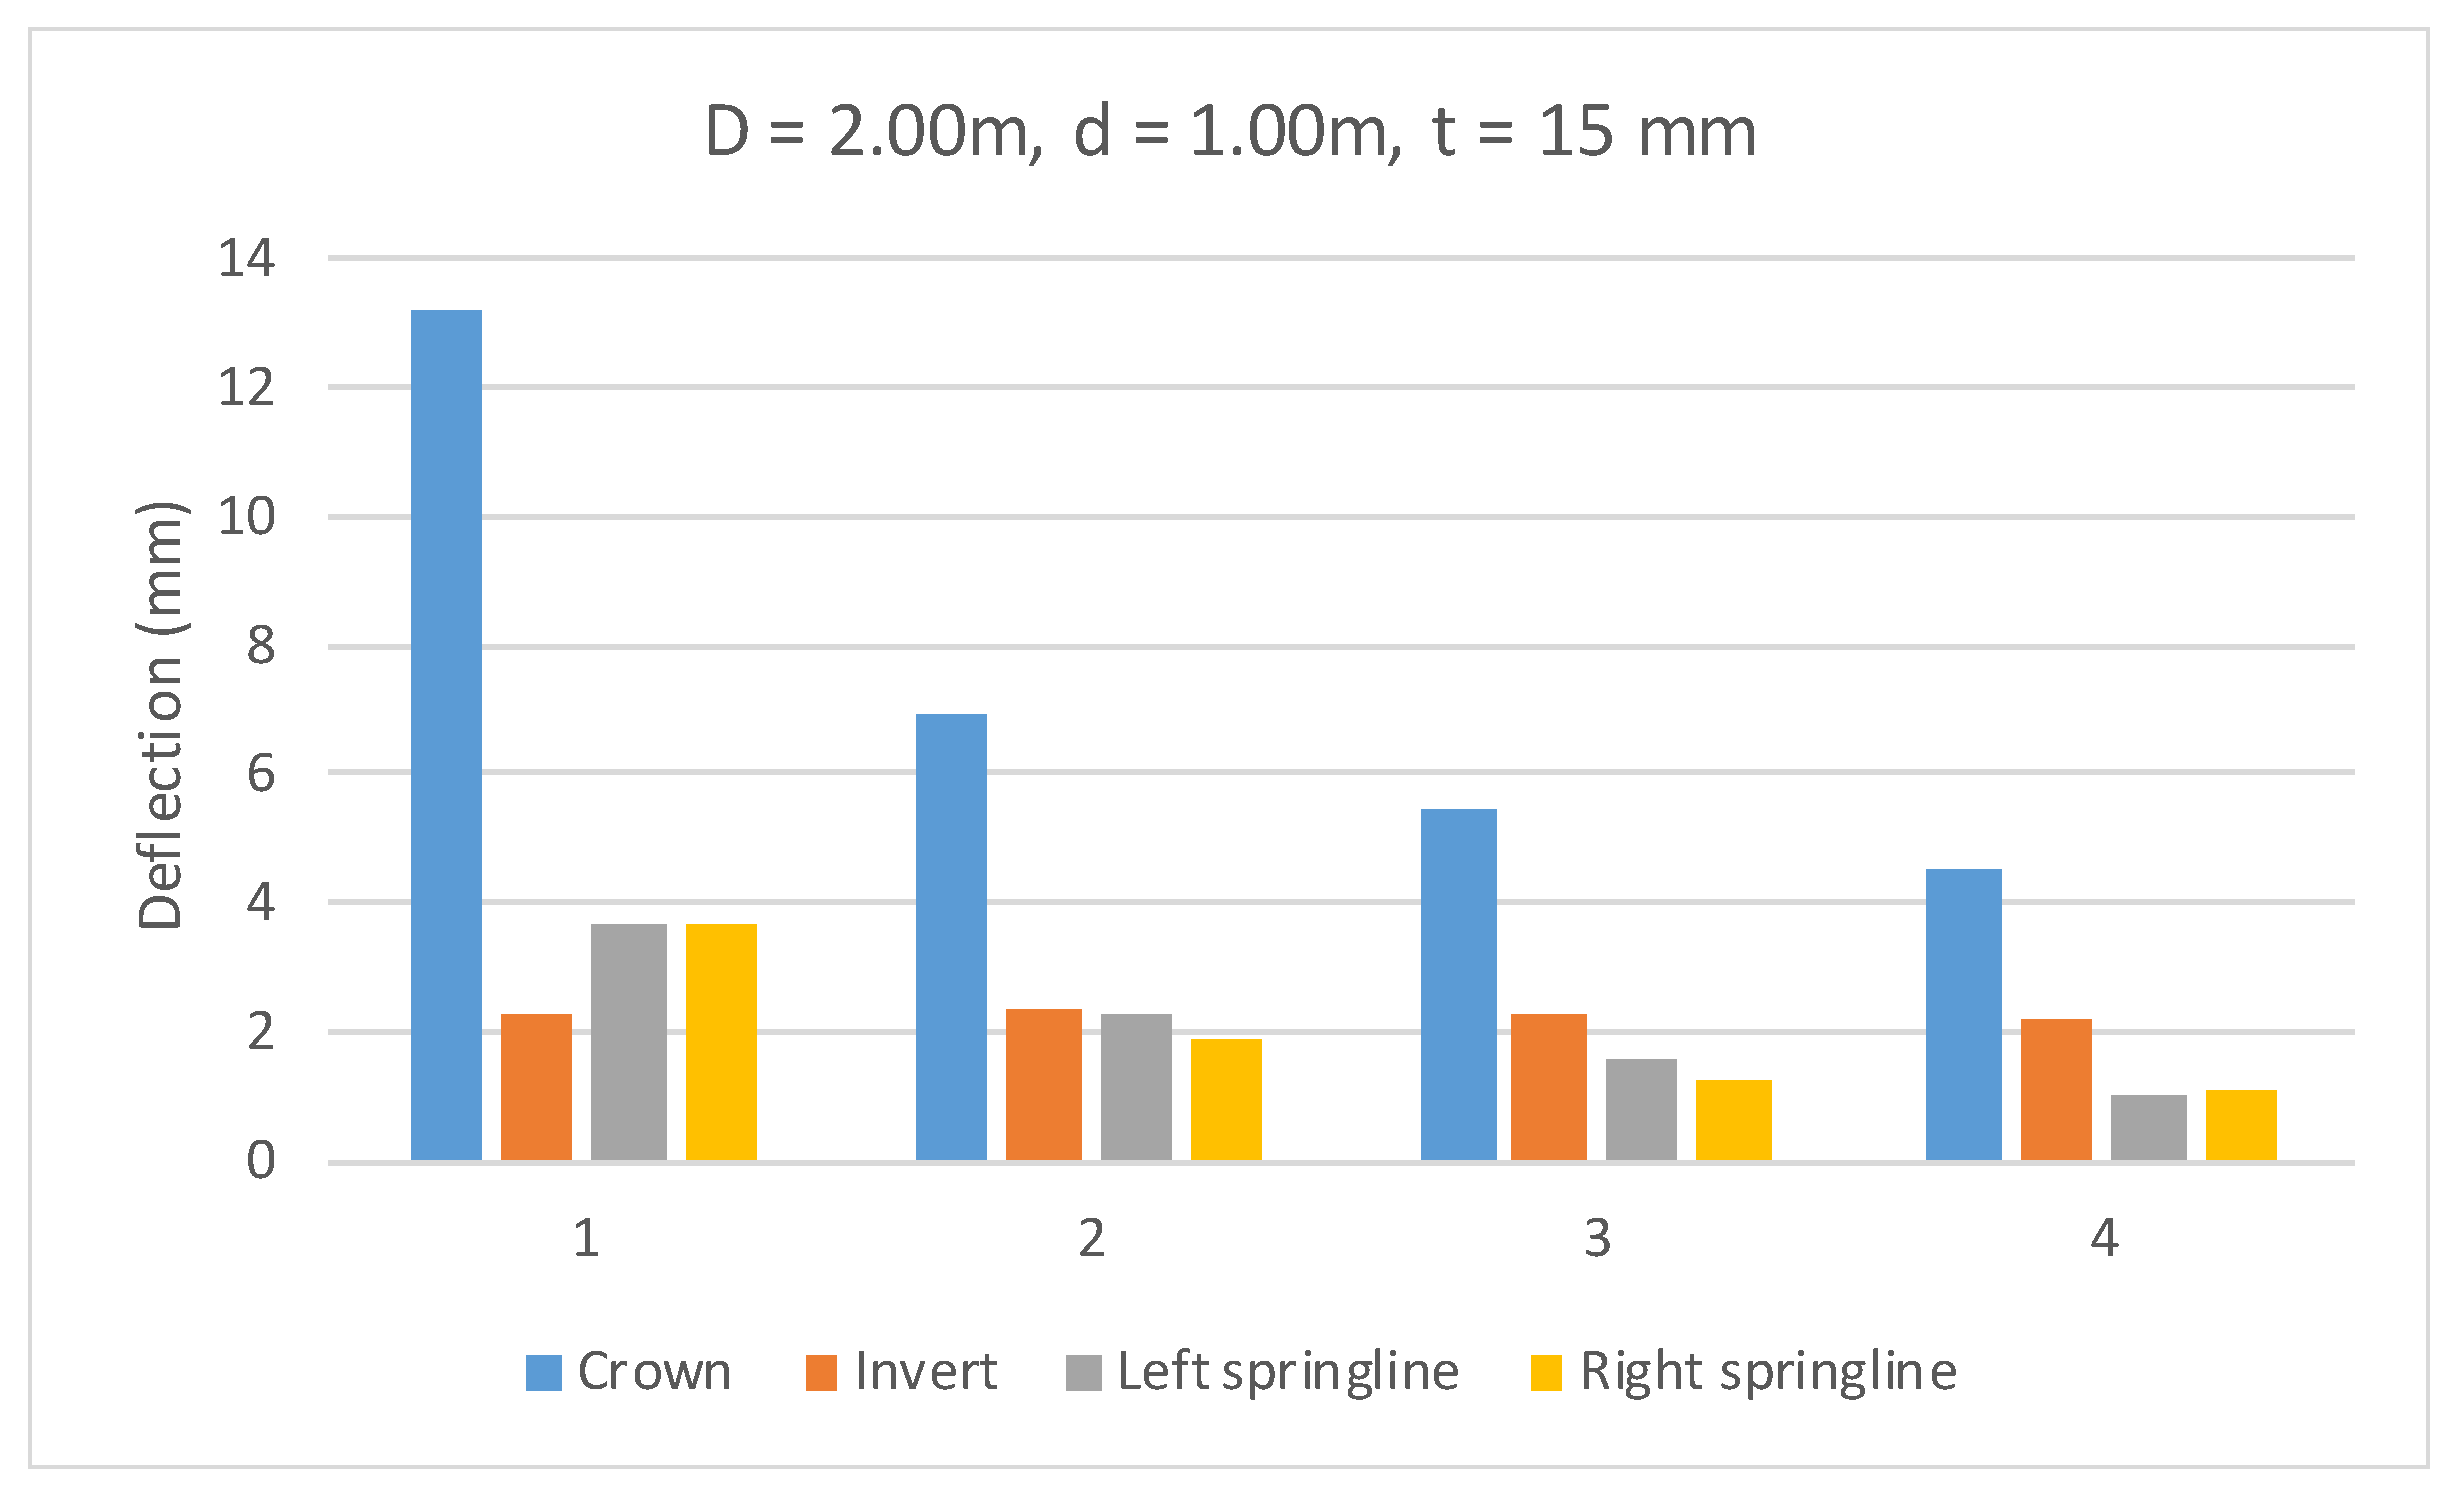
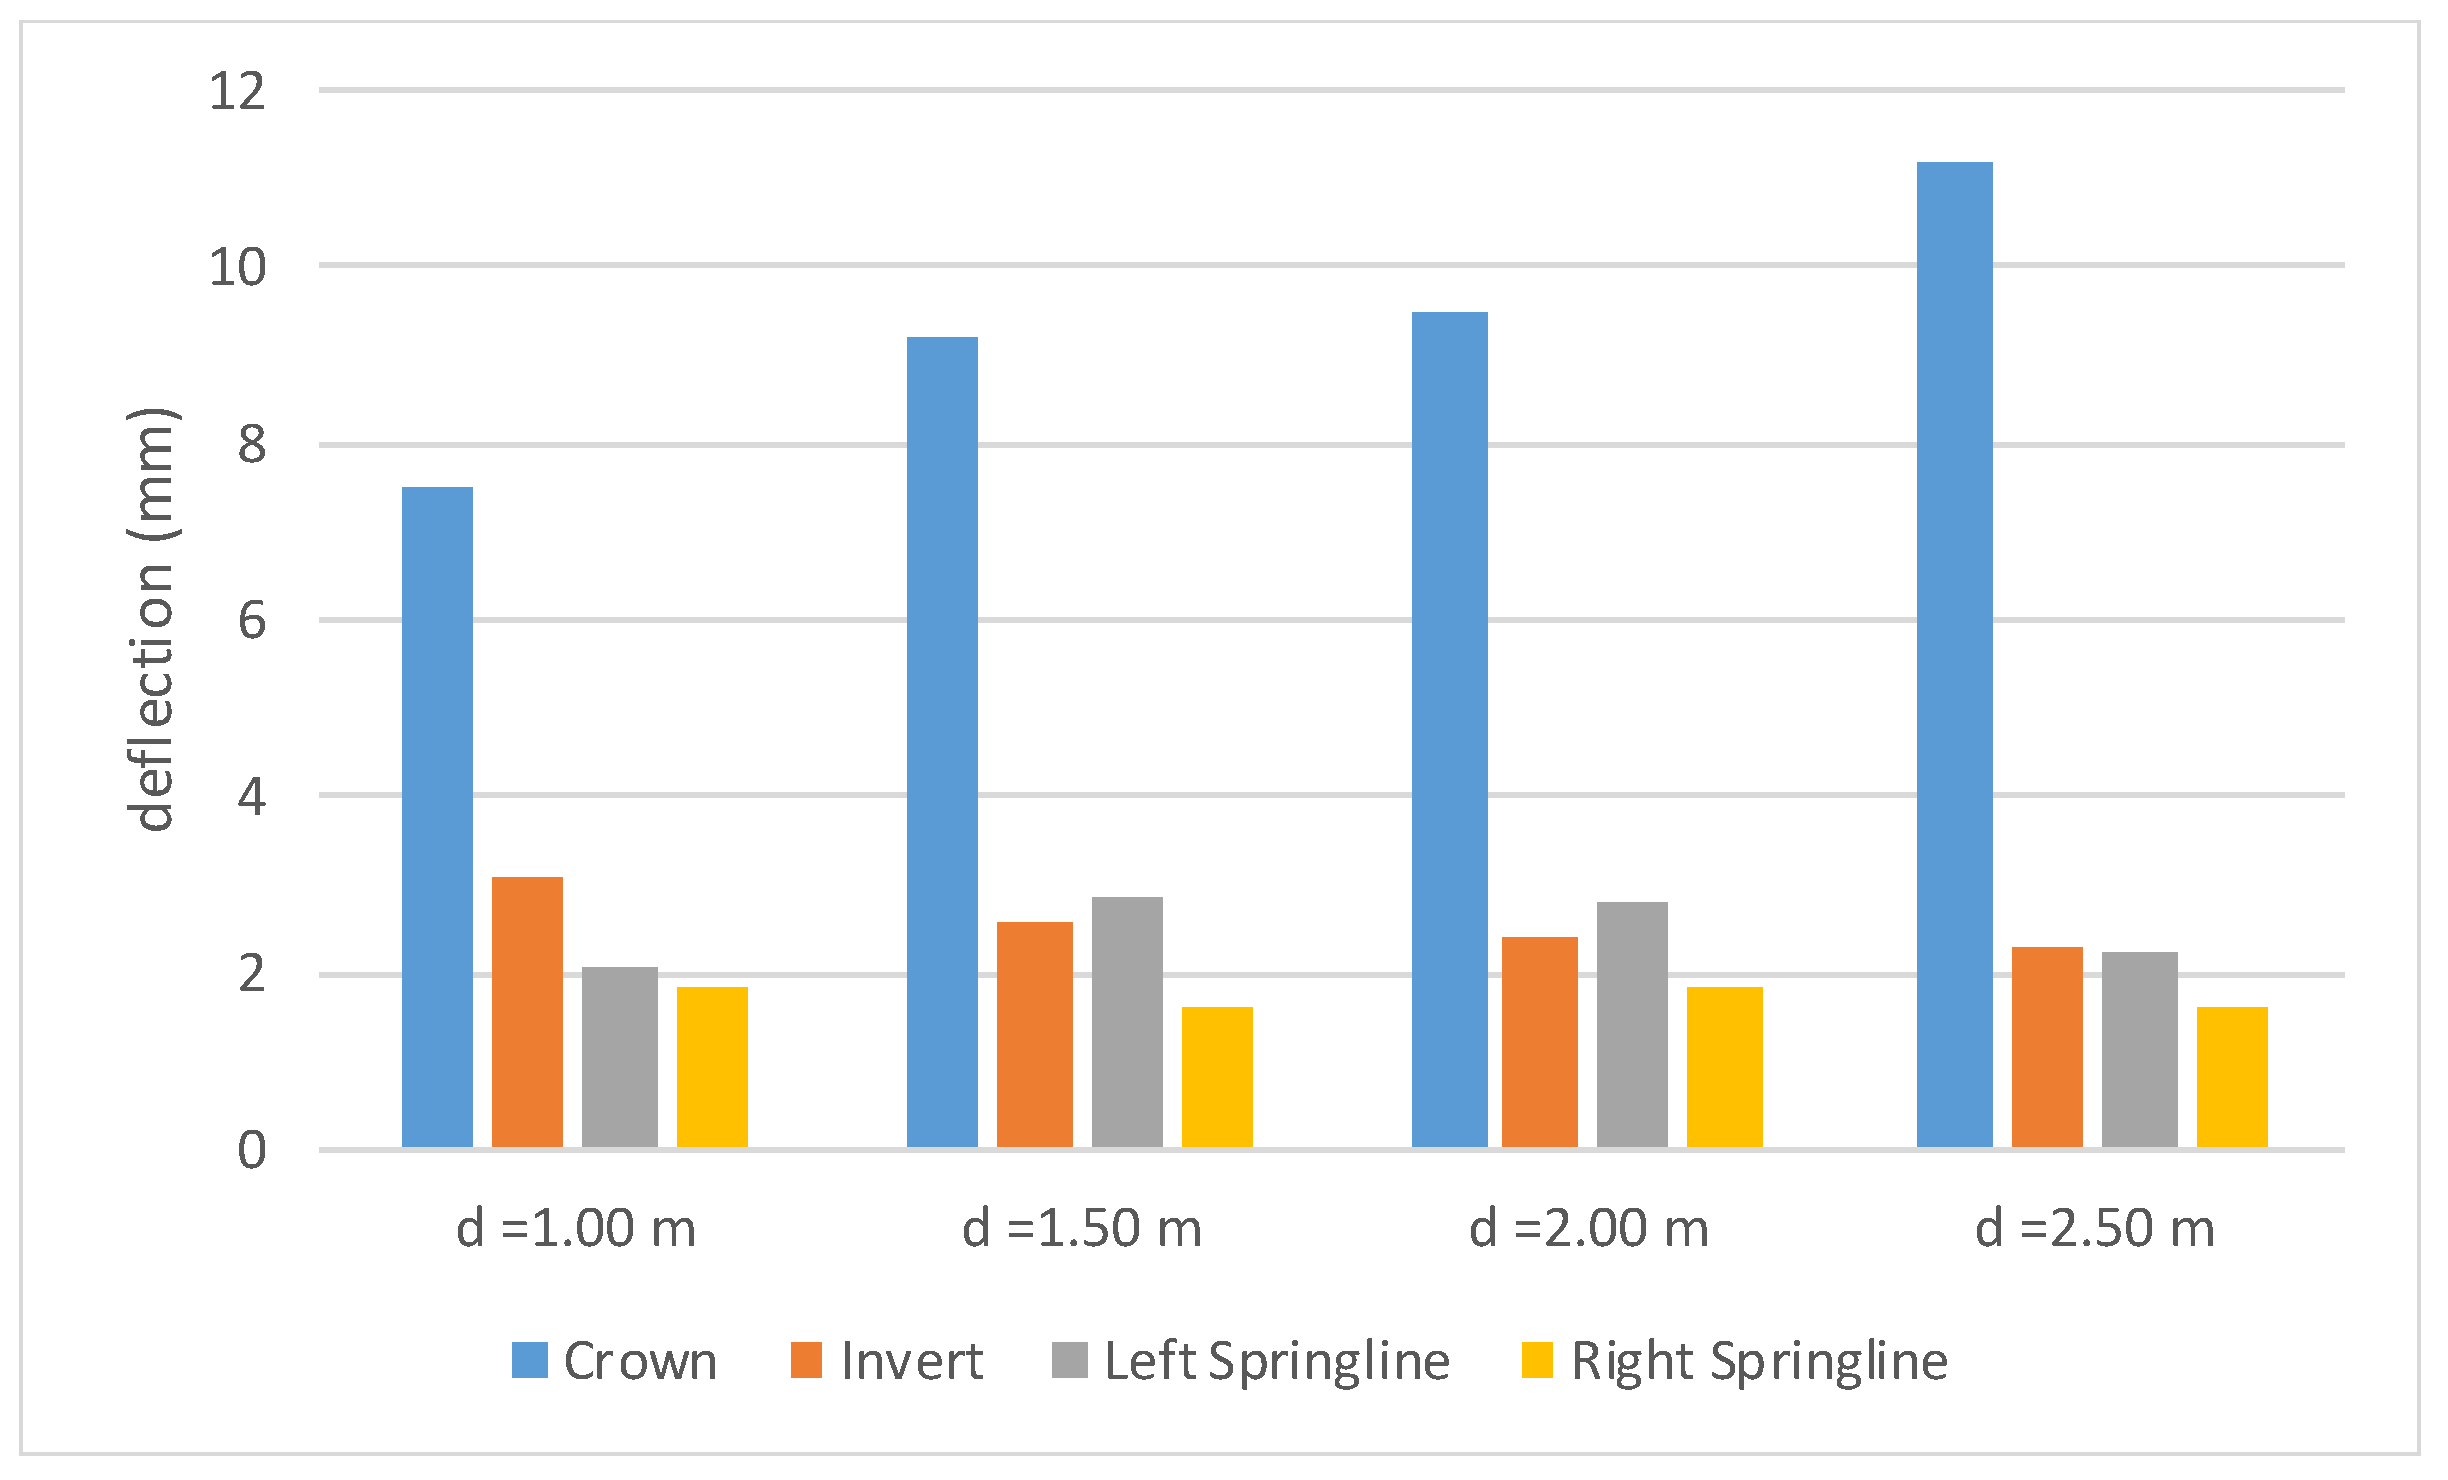
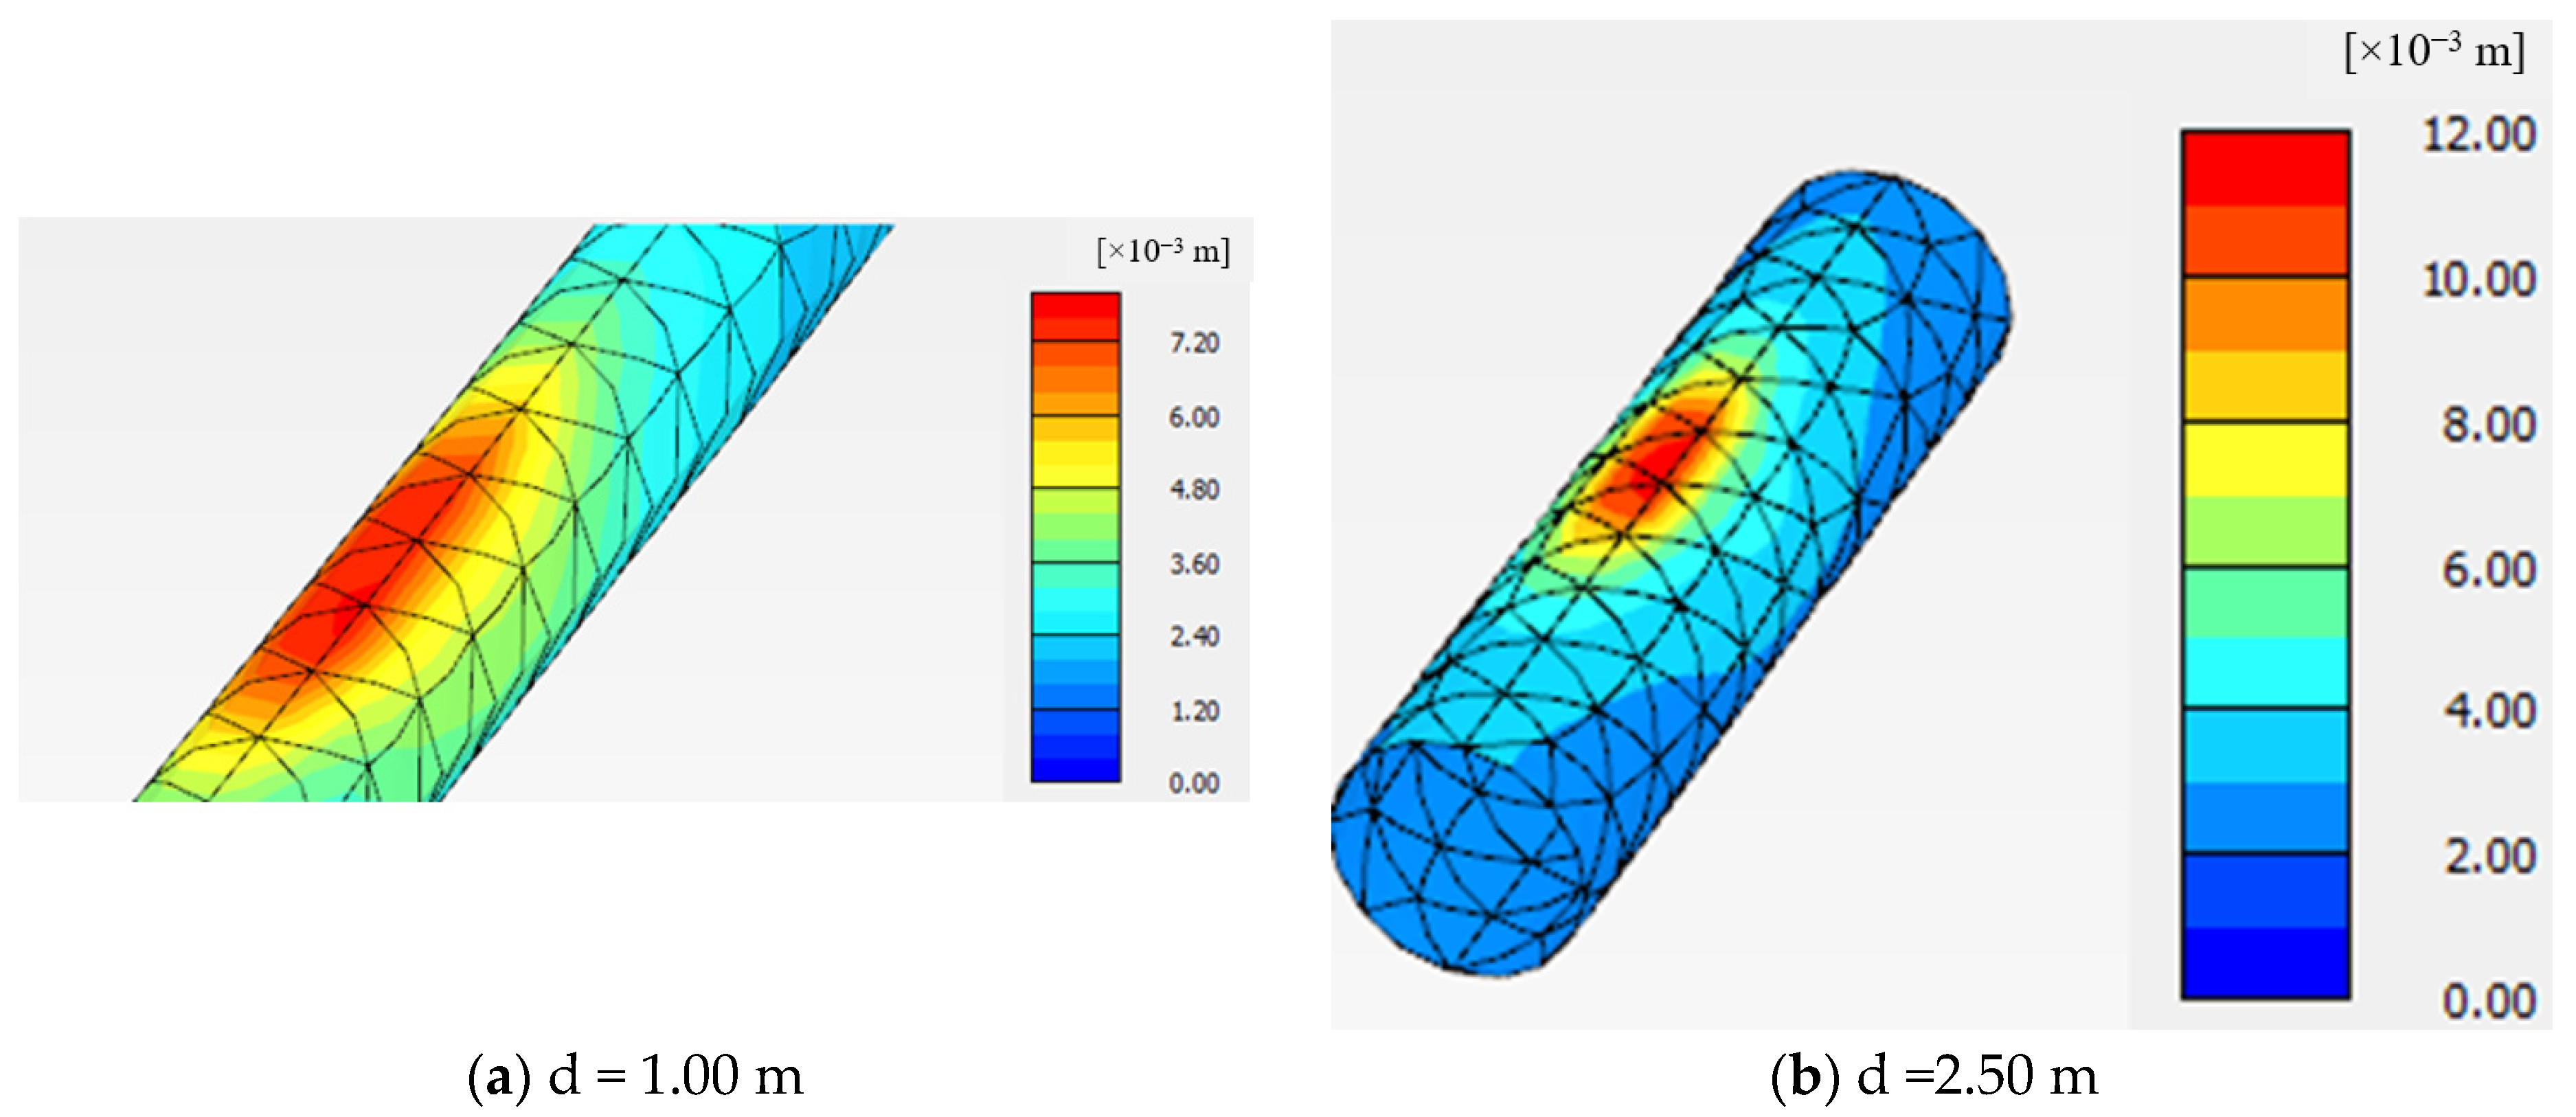
5.3. Pipe Diameter
The behavior of GRP pipe with a constant thickness of 15 mm and various diameters ranging from 1.00 m to 2.50 m was studied and analyzed. The bedding depth under the pipe was 1.00 mm and the backfill over the pipe was also 1.00 m. Figure 28 presents the comparison of crown, invert, left springline, and right springline deflections between pipes with different diameters. Results indicate that the crown deflection increased by 22.7%, 26.5%, and 48.7% when the pipe diameter increased from 1.00 m to 1.50 m, 2.00 m, and 2.50 m, respectively. On the other hand, the invert deflection decreased by 17.2%, 21.5%, and 25.1% when increasing the pipe diameter from 1.00 m to 1.50 m, 2.00 m, and 2.50 m, respectively. In addition, the left and right springlines showed different deflection behaviors, where the deflection showed maximum values at pipe diameters of 1.50 m and 2.00 m. Figure 29 presents a comparison of Plaxis output pipe deflections between pipes with 1.00 m bedding, 1.00 m backfill, 15 mm thickness, and different pipe diameters (d).

Figure 28.
Pipe deflection with different pipe diameters (d) and constant backfill depth (H = 1.00 m), pipe thickness (t = 15 mm), and bedding depth (D = 1.00 m).

Figure 29.
Comparisons of the pipe deflection between 1.00 m and 2.50 m diameter pipes.
5.4. Pipe Thickness
The deflection behavior of a 1.50 m diameter GRP pipe with constant backfill depth and bedding depth of 1.00 m and various thicknesses ranging from 15 to 35 mm is presented in Figure 30. It was observed that the pipe deflection decreased with increasing pipe thickness, where the crown deflection reduced by 4.8, 10.6, 15.7, and 20.8% when the pipe thickness increased from 15 mm to 20, 25, 30, and 35 mm, respectively. Furthermore, the left and right springlines’ deflection was reduced by 3.9, 8.6, 15.6, and 23.1% and by 7.6, 17.3, 22.6 and 27.8%, respectively, when the pipe thickness was increased from 15 mm to 20, 25, 30, and 35 mm. On the contrary, the pipe thickness did not affect invert deflection where the deflection variation of all studied cases did not exceed 3.6%.
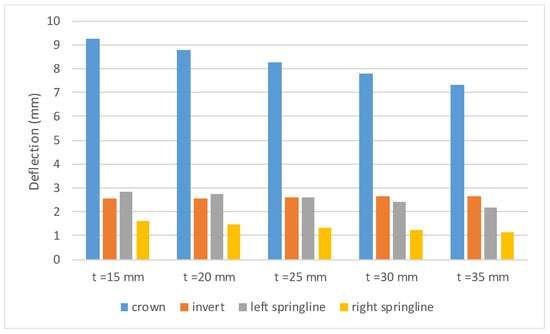
Figure 30.
GRP pipe deflection with different pipe thicknesses (t) and constant backfill depth (H = 1.00 m), pipe diameter (d = 1.5 m), and bedding depth (D = 1.00 m).
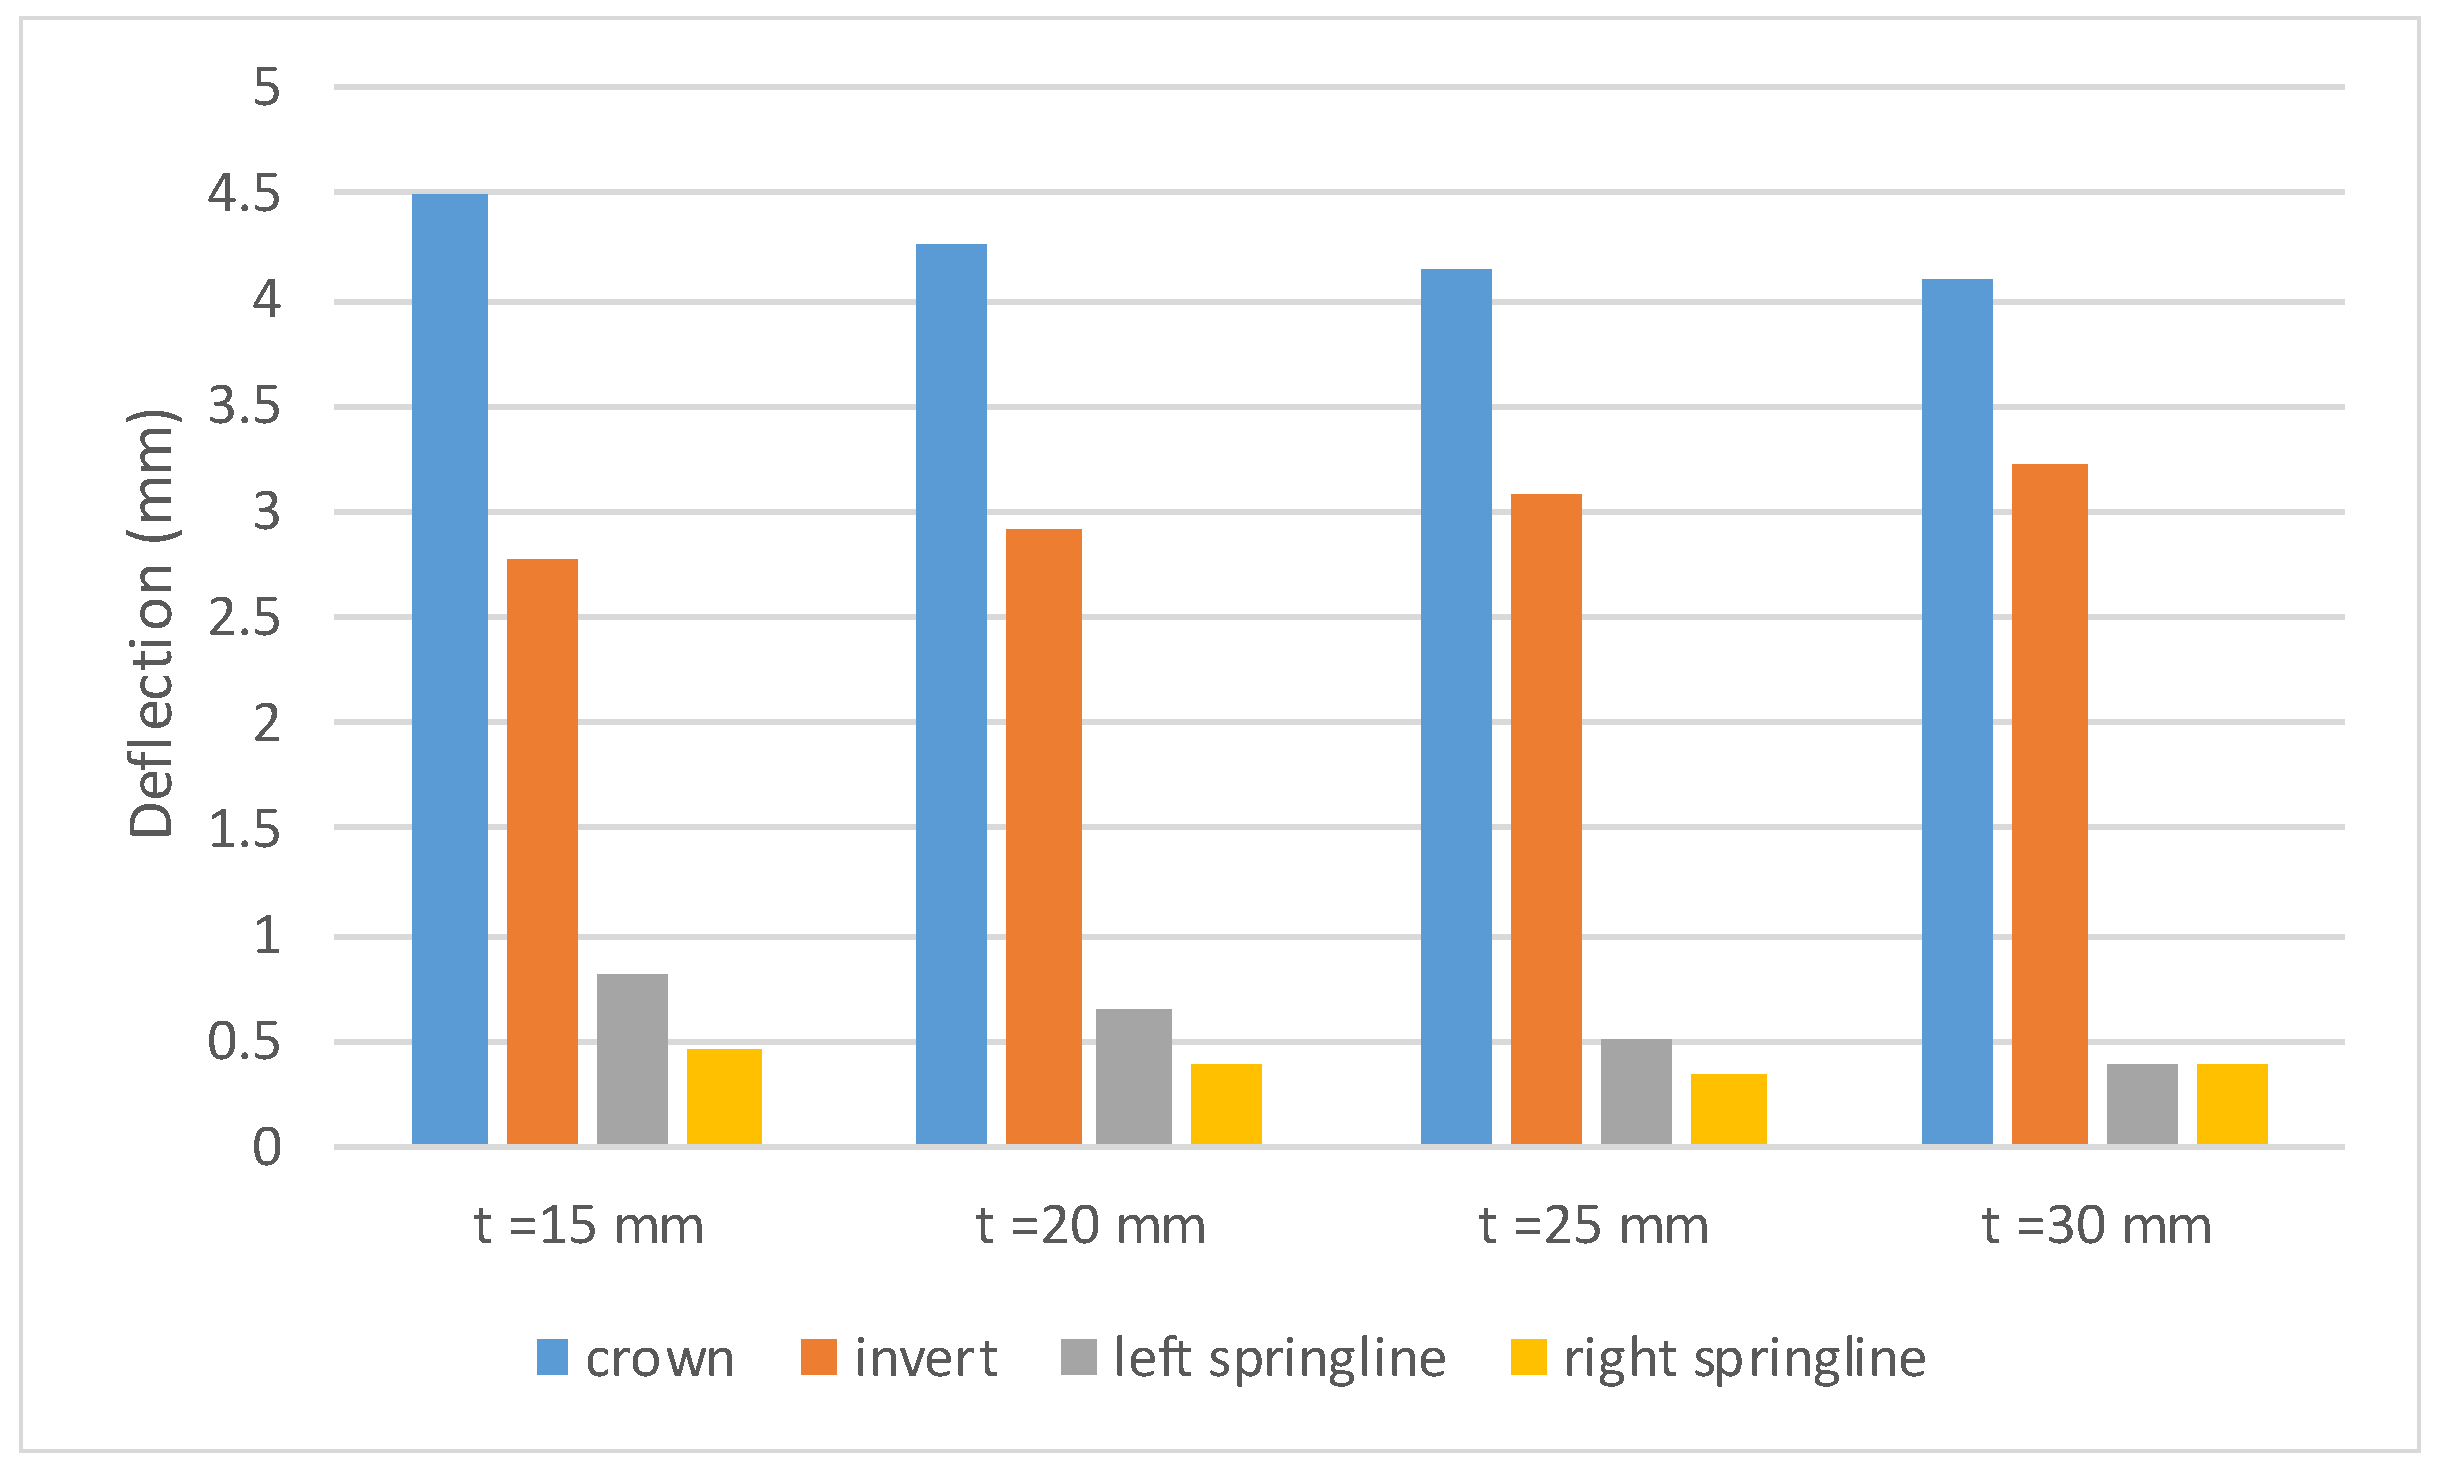
In addition, steel pipe with different thicknesses (t) and constant backfill depth (H = 1.00 m), pipe diameter (d = 1.5 m), and bedding depth (D = 1.00 m) was studied and analyzed, as shown in Figure 31. It was found that the crown and invert deflections showed similar behavior, where they decreased from 4.50 mm to 4.262 mm, 4.138 mm, and 4.084 mm and from 2.763 mm to 2.913 mm, 3.07 mm, and 3.231 mm, respectively, when the pipe thickness increased from 15 mm to 20 mm, 25 mm, and 30 mm. Additionally, the left and right springlines’ deflection reduced from 0.827 mm to 0.64 mm, 0.50 mm, and 0.396 mm and from 0.469 mm to 0.401 mm, 0.341 mm, and 0.391 mm.

Figure 31.
Steel pipe deflection with different pipe thicknesses (t) and constant backfill depth (H = 1.00 m), pipe diameter (d = 1.5 m), and bedding depth (D = 1.00 m).
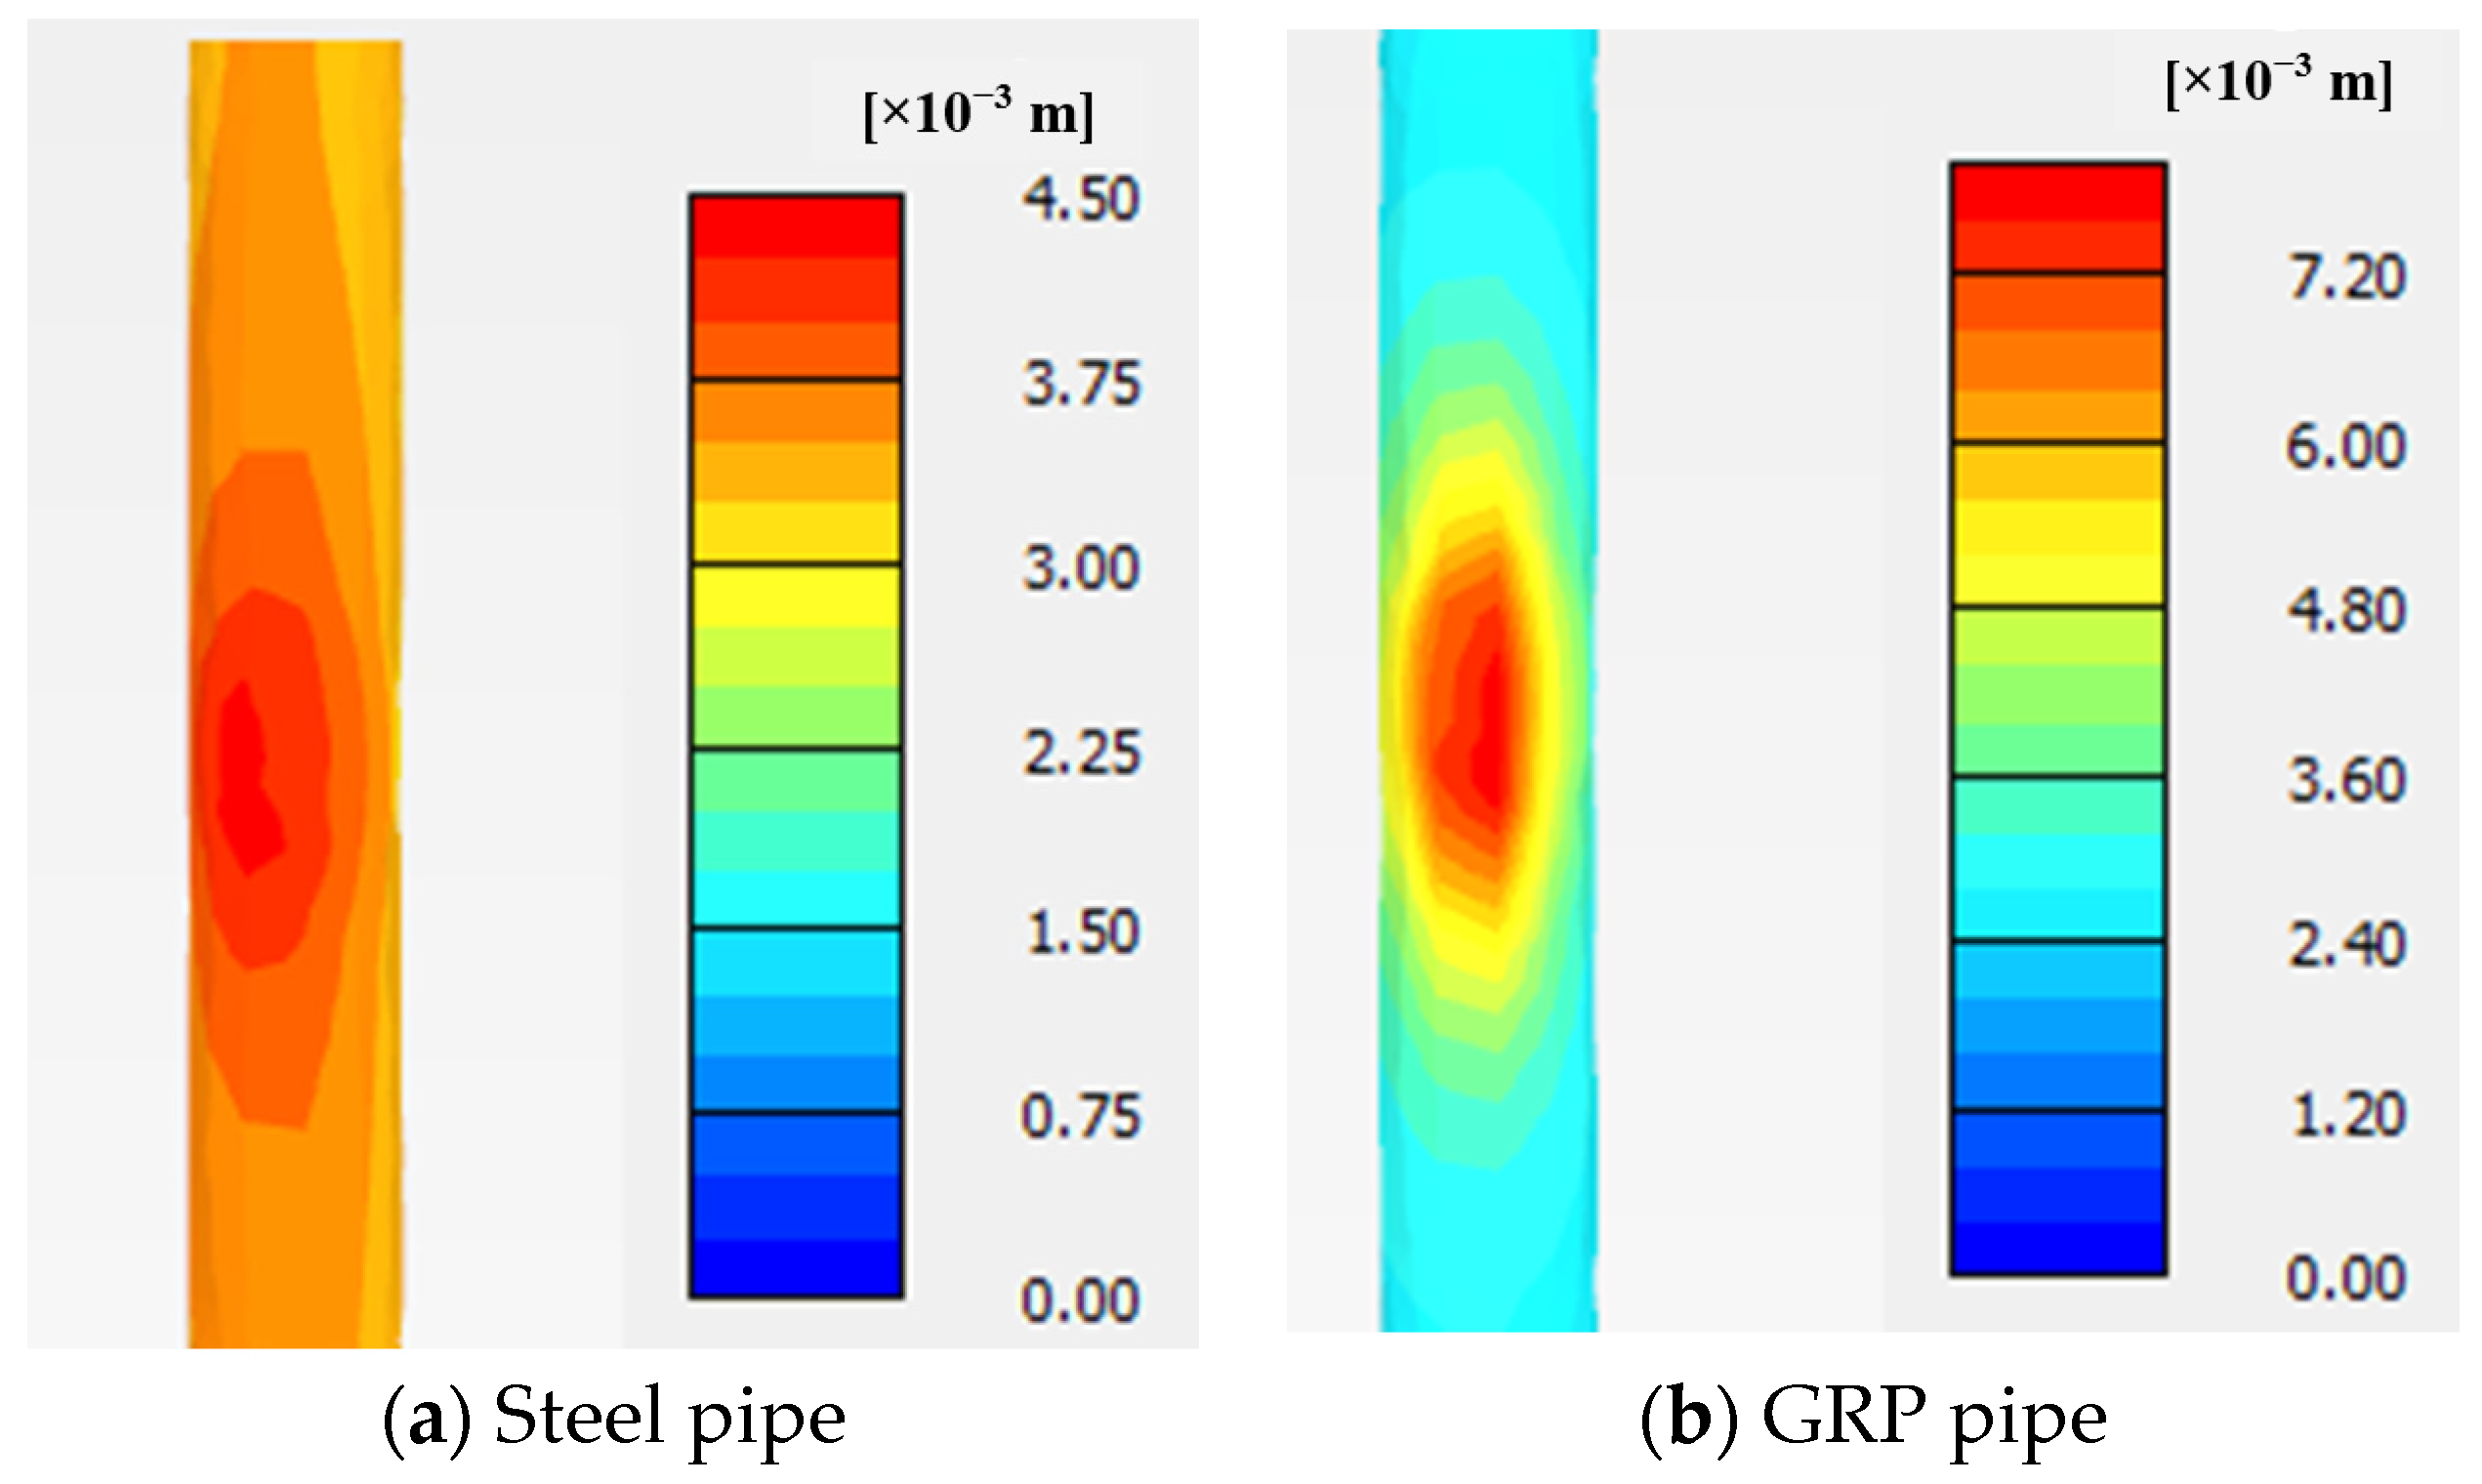
5.5. Comparison between Steel and GRP Pipes
Figure 30 and Figure 31 show that the crown deflection of steel pipe is lower than that of GRP pipe by 51.2%, 51.4%, 49.8%, and 47.4% for pipe thicknesses of 15 mm, 20 mm, 25 mm, and 30 mm, respectively. Moreover, the left and right springline deflections of steel pipe were found to be lower than those of the GRP pipe by 68%-80% for pipe thicknesses ranging from 15 mm to 30 mm. In addition, the deflection of pipe invert decreased by 8%, 13.9%, 17.8%, and 22.9% when the GRP pipe was replaced with steel pipe with thicknesses of 15 mm, 20 mm, 25 mm, and 30 mm, respectively. Figure 32 shows a comparison of pipe deflection output between GRP and steel pipes with thicknesses of 30 mm.

Figure 32.
Comparisons between steel and GRP pipes with pipe thickness (t = 30 mm), backfill depth (H = 1.00 m), pipe diameter (d = 1.5 m), and bedding depth (D = 1.00 m).
5.6. Normal Forces in GRP Pipes
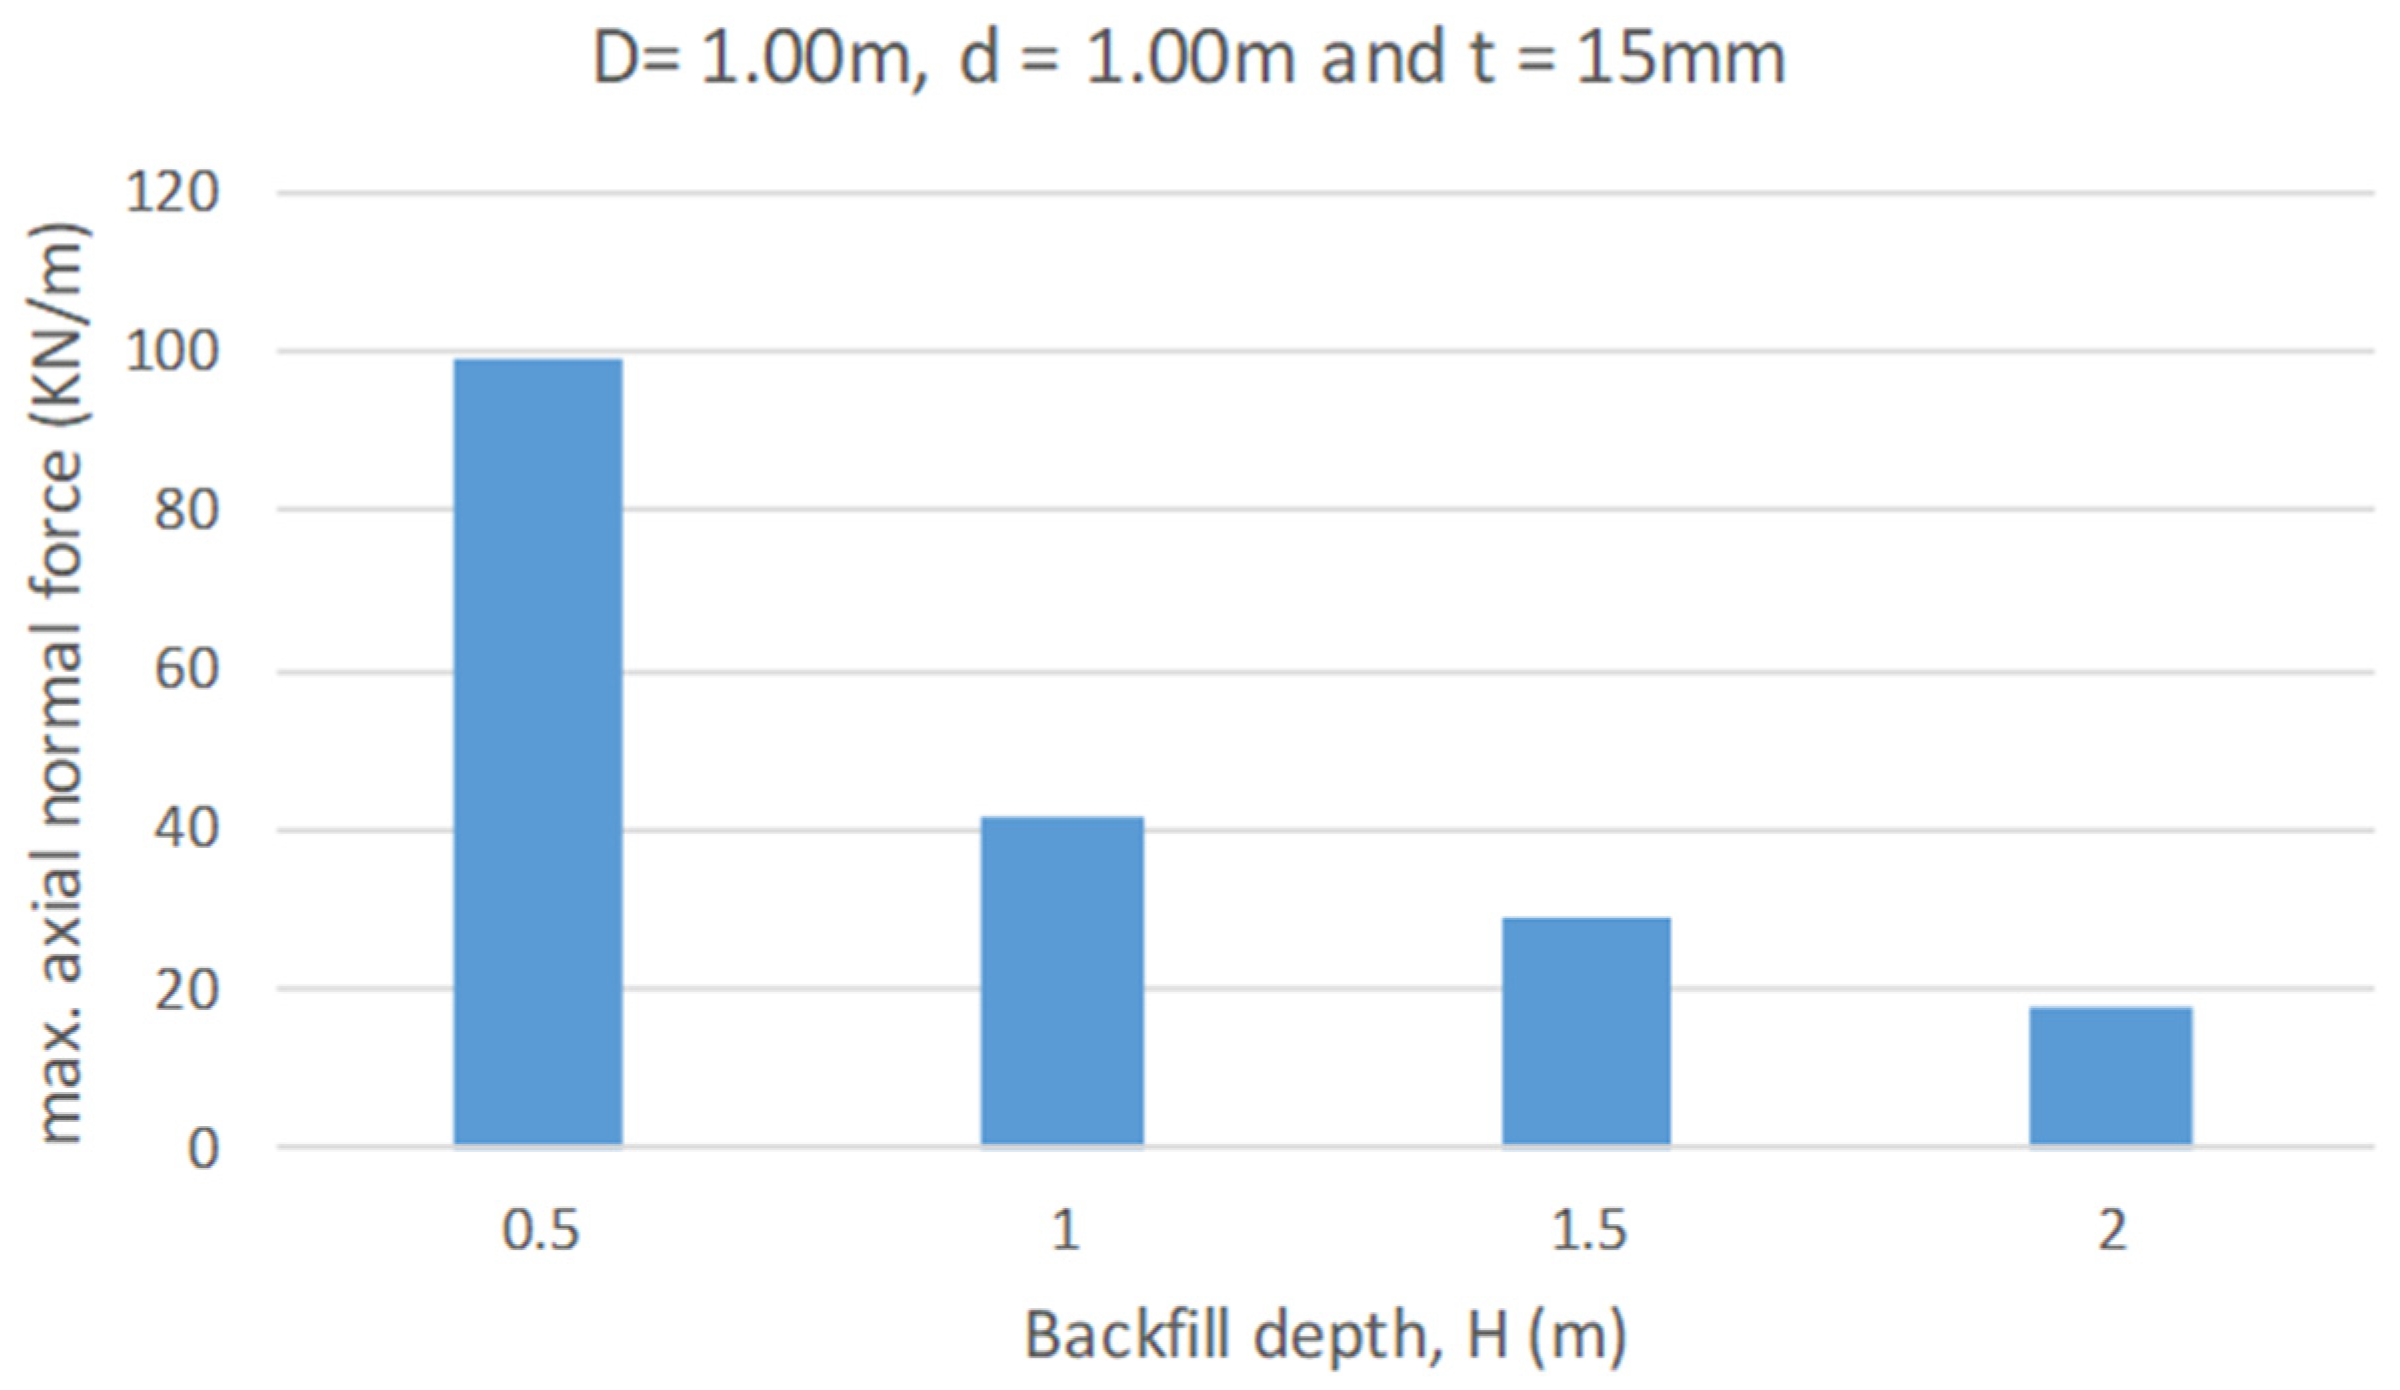
The effect of backfill depth on the axial normal force at the crown of a 1.00 m diameter GRP pipe with a thickness of 15 mm, resting over a bedding depth of 1.00 m, is illustrated in Figure 33. The results indicate that the maximum axial normal force decreased by 58%, 70%, and 82% as the backfill depth increased from 0.5 m to 1.00 m, 1.50 m, and 2.00 m, respectively. Furthermore, Figure 34 shows the effect of bedding depth on the axial normal force at the crown of a 1.00 m diameter GRP pipe with a thickness of 15 mm under a backfill depth of 1.00 m. It is observed that the maximum axial normal force decreased by 10%, 16%, and 19% as the bedding depth increased from 0.5 m to 1.00 m, 1.50 m, and 2.00 m, respectively. Therefore, backfill depth plays a more significant role in reducing axial forces in pipes compared to bedding depth. Figure 35 illustrates the axial normal force in a GRP pipe with a 1.00 m diameter and 15 mm thickness, resting over a bedding depth of 1.00 m and under a backfill depth of 1.50 m.
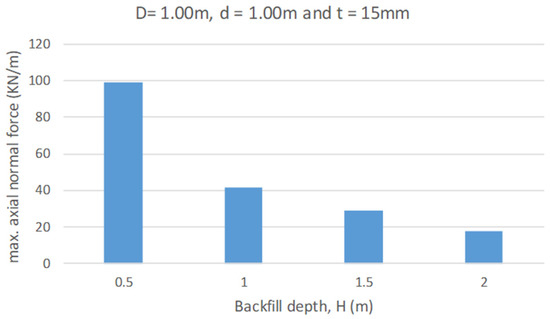
Figure 33.
Normal force in the GRP pipe with different backfill depths (H) and constant pipe diameter (d = 1.00 m), pipe thickness (t = 15 mm) and bedding depth (D = 1.00 m).
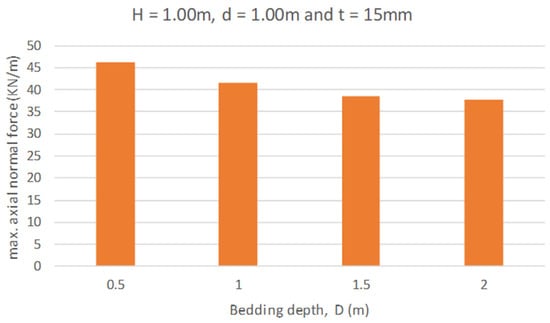
Figure 34.
Normal force in the GRP pipe with different bedding depths (D) and constant pipe diameter (d = 1.00 m), pipe thickness (t = 15 mm) and backfill depth (H = 1.00 m).
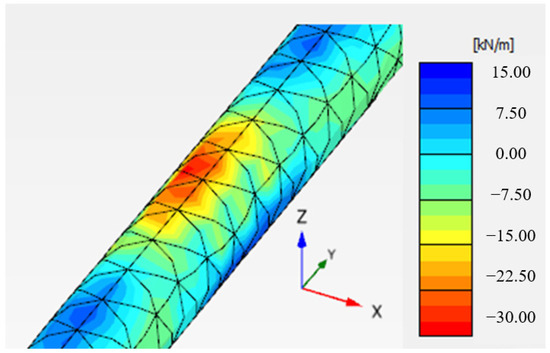
Figure 35.
Axial normal force in the GRP pipe with pipe thickness (t = 15 mm), backfill depth (H = 1.50 m), pipe diameter (d = 1.00 m), and bedding depth (D = 1.00 m).
6. Conclusions
This study focuses on experimental investigations involving buried Glass Reinforced Plastic (GRP) pipes. The pipes were buried in densely packed gravelly, sandy soil and subjected to varying traffic loads to examine how the backfill cover affects pipe deflection. Additionally, the behavior of GRP pipes under different types of traffic loads was analyzed using finite element modeling in Plaxis 3D. The model’s accuracy was confirmed through field data validation. Various factors influencing embedded pipe behavior were explored, including pipe material, thickness, backfill properties, depth, and soil characteristics beneath the pipe. Based on the analysis findings, the following conclusions can be drawn:
- For the 1400 mm diameter GRP pipes, minimum backfill covers of 75 cm and 50 cm were suitable and can be used for local practice of backfilling for both earth fill loading and traffic loading.
- The experimental results showed that as the backfill cover increased the maximum deflection decreased. The percentages of the deflection reduction were 38% for a backfill increase from 50 cm to 100 cm and 33.33% for a backfill increase from 50 cm to 75 cm.
- The FE results indicated that the crown deflection increased by 22.7%, 26.5%, and 48.7% when the pipe diameter increased from 1.00 m to 1.50 m, 2.00 m and 2.50 m, respectively. On the other hand, the invert deflection decreased by 17.2%, 21.5%, and 25.1% when the pipe diameter increased from 1.0 m to 1.5 m, 2.0 m, and 2.5 m, respectively.
- The pipe deflection decreased by increasing the pipe thickness where the crown deflection reduced by 4.8, 10.6, 15.7, and 20.8% when the pipe thickness increased from 15 mm to 20, 25, 30, and 35 mm, respectively.
- The deflections of the steel pipe were lower than those of the GRP pipe when using different thicknesses.
- As the backfill cover increases, the maximum deflection decreases due to the load distribution effect, where an increased backfill cover reduces the traffic load applied on the pipe by a 1:2 ratio.
Author Contributions
Conceptualization, T.H.I.; Data curation, Y.J.H.; Formal analysis, A.A.A., A.E.-Z. and A.M.A.; Investigation, A.I.S., Y.J.H. and M.H.M.; Methodology, Y.J.H., M.H.M., A.A.A., T.H.I., A.E.-Z. and A.M.A.; Resources, A.E.-Z.; Software, A.I.S., Y.J.H. and A.M.A.; Supervision, A.A.A.; Validation, A.I.S., M.H.M. and A.M.A.; Visualization, M.H.M. and T.H.I.; Writing—original draft, A.I.S., Y.J.H., M.H.M., A.A.A., T.H.I. and A.M.A.; Writing—review and editing, A.E.-Z. All authors have read and agreed to the published version of the manuscript.
Funding
This research received no external funding.
Data Availability Statement
The data presented in this study are available on request from the corresponding author.
Acknowledgments
The authors would like to thank Kareem Hashim and AlNajim company for providing the materials and equipment that are used to perform the tests. This paper is submitted to the International Conference on Geotechnical Engineering and Energetic-Iraq.
Conflicts of Interest
The authors declare no conflicts of interest.
References
- Jiang, N.; Zhu, B.; Zhou, C.; Li, H.; Wu, B.; Yao, Y.; Wu, T. Blasting vibration effect on the buried pipeline: A brief overview. Eng. Fail. Anal. 2021, 129, 105709. [Google Scholar] [CrossRef]
- Jiang, X.; Zhang, X.; Zhang, X.; Long, L.; Bai, Y.; Huang, B. Advancing Shallow Tunnel Construction in Soft Ground: The Pipe-Umbrella Box Jacking Method. Transp. Res. Rec. 2024. [Google Scholar] [CrossRef]
- Jiang, X.; Zhang, X.; Wang, S.; Bai, Y.; Huang, B. Case Study of the Largest Concrete Earth Pressure Balance Pipe-Jacking Project in the World. Transp. Res. Rec. 2022, 2676, 92–105. [Google Scholar] [CrossRef]
- Arockiasamy, M.; Chaallal, O.; Limpeteeprakarn, T. Full-Scale Field Tests on Flexible Pipes under Live Load Application. J. Perform. Constr. Facil. 2006, 20, 21–27. [Google Scholar] [CrossRef]
- Al-Mosawe, M.J.; Said, A.M.; Dawood, A.O. Investigation of Backfill Compaction Effect on Buried Concrete Pipes. J. Eng. 2013, 19, 180–196. [Google Scholar] [CrossRef]
- Ali, A.F.; Sehaib, R. Effects of Bedding Types on the Behavior of Large Diameter GRP Flexible Sewer Pipes. J. Eng. 2017, 23, 136–155. [Google Scholar] [CrossRef]
- BS EN 1295-1; Structural Design of Buried Pipelines under Various Conditions of Loading General Requirements. British Standards Institution: London, UK, 2019.
- Fattah, M.Y.; Zbar, B.S.; Al-Kalali, H.H.M. Three-Dimensional Finite Element Simulation of the Buried Pipe Problem in Geogrid Reinforced Soil. Glob. J. Eng. Sci. Res. Manag. 2016, 3, 118–128. [Google Scholar] [CrossRef]
- Dawood, M.; Izzet, A.F.; Khudair, B.H. Comparative Study between the Behavior of the Concrete Thrust Block and the Restraint Joint in a Water Distribution System; Review. J. Eng. 2022, 28, 1–10. [Google Scholar] [CrossRef]
- Chaallal, O.; Arockiasamy, M.; Godat, A. Numerical Finite-Element Investigation of the Parameters Influencing the Behavior of Flexible Pipes for Culverts and Storm Sewers under Truck Load. J. Pipeline Syst. Eng. Pract. 2014, 6, 04014015. [Google Scholar] [CrossRef]
- Liu, B.; Wang, Z.; Xu, W.; Sun, H.; Wang, X. Comparative Experimental Study and FE Analysis of Corrugated Steel Pipe Culverts with Different Stiffness. Open Civ. Eng. J. 2016, 10, 549–563. [Google Scholar] [CrossRef]
- Saleh, A.E.; Jalali, H.H.; Pokharel, A.; Abolmaali, A. Deformation of buried large diameter steel pipes during staged construction and compaction-case study and finite element analysis. Transp. Geotech. 2021, 31, 100649. [Google Scholar] [CrossRef]
- Daradkeh, A.M.; Jalali, H.H. Finite Element Modeling Aspects of Buried Large Diameter Steel Pipe–Butterfly Valve Interaction. Modelling 2023, 4, 548–566. [Google Scholar] [CrossRef]
- Plaxis 3D: 3D Geotechnical Engineering Software. American Bentley Systems, Inc.: Exton, PA, USA, 2013.
- BS-5480; Specification for Glass Reinforced Plastics (GRP) Pipes, Joints and Fittings for Use for Water Supply or Sewerage. British Standards Institution: London, UK, 2006.
- ASTM D422-63; Standard Test Method for Particle-Size Analysis of Soils. American Society for Testing and Materials: Franklin, MA, USA, 2007.
- American Association of State Highway and Transportation Officials. AASHTO LRFD Bridge Design Specifications, 8th ed.; American Association of State Highway and Transportation Officials: Washington, DC, USA, 2017. [Google Scholar]
- ASTM D3839-14; Standard Guide for Underground Installation of “Fiberglass” (Glass-Fiber Reinforced Thermosetting-Resin) Pipe. American Society for Testing and Materials: Franklin, MA, USA, 2019. [CrossRef]
- ASTM D2487-17; Standard Practice for Classification of Soils for Engineering Purposes (Unified Soil Classification System). American Society for Testing and Materials: Franklin, MA, USA, 2017. [CrossRef]
- AASHTO M145; Standard Specification for Classification of Soils and Soil-Aggregate Mixtures for Highway Construction Purposes. American Association of State Highway and Transportation Officials: Washington, DC, USA, 2018.
- AASHTO T-90; Standard Method of Test for Determining the Plastic Limit and Plasticity Index of Soils. American Association of State Highway and Transportation Officials: Washington, DC, USA, 2020.
- ASTM D698-12; Standard Test Methods for Laboratory Compaction Characteristics of Soil Using Standard Effort. American Society for Testing and Materials: Franklin, MA, USA, 2021. [CrossRef]
- AASHTO T-180; Standard Method of Test for Moisture–Density Relations of Soils Using a 4.54-kg (10-lb) Rammer and a 457-mm (18-in.) Drop. American Association of State Highway and Transportation Officials: Washington, DC, USA, 2020.
- ASTM D1557-12; Standard Test Methods for Laboratory Compaction Characteristics of Soil Using Modified Effort. American Society for Testing and Materials: Franklin, MA, USA, 2021. [CrossRef]
- American Water Works Association. AWWA M45: Fiberglass Pipe Design, 13th ed.; American Water Works Association: Denver, CO, USA, 2013. [Google Scholar]
- Schanz, T.; Vermeer, P.A.; Bonnier, P.G. The hardening soil model: Formulation and verification. In Beyond 2000 in Computational Geotechnics; Ten years of Plaxis International. Proceedings of the international symposium; Routledge: Abingdon-on-Thames, UK, 1999; pp. 281–296. [Google Scholar]
- Duncan, J.M.; Chang, C.Y. Nonlinear analysis of stress and strain in soils. J. Soil Mech. Found. Div. 1970, 96, 1629–1653. [Google Scholar] [CrossRef]
- Saleh, S.; Mohd Yunus, N.Z.; Ahmad, K.; Mat Said, K.N. Numerical simulation with hardening soil model parameters of marine clay obtained from conventional tests. SN Appl. Sci. 2021, 3, 156. [Google Scholar] [CrossRef]
- Shi, X.; Sun, J.; Qi, Y.; Zhu, X.; Zhang, X.; Liang, R.; Chen, H. Study on Stiffness Parameters of the Hardening Soil Model in Sandy Gravel Stratum. Appl. Sci. 2023, 13, 2710. [Google Scholar] [CrossRef]


Disclaimer/Publisher’s Note: The statements, opinions and data contained in all publications are solely those of the individual author(s) and contributor(s) and not of MDPI and/or the editor(s). MDPI and/or the editor(s) disclaim responsibility for any injury to people or property resulting from any ideas, methods, instructions or products referred to in the content. |
© 2024 by the authors. Licensee MDPI, Basel, Switzerland. This article is an open access article distributed under the terms and conditions of the Creative Commons Attribution (CC BY) license (https://creativecommons.org/licenses/by/4.0/).