Article

Geotechnical and Geophysical Assessment of the Soil Layers of the Missan Combined-Cycle Power Plant Project

by
Ruba H. Sa’ur
1,
Duaa Al-Jeznawi
1,
Saif Alzabeebee
2,
Luís Filipe Almeida Bernardo
3,* and
Suraparb Keawsawasvong
4
1
Department of Civil Engineering, College of Engineering, Al-Nahrain University, Jadriya, Baghdad 10881, Iraq
2
Department of Roads and Transport Engineering, University of Al-Qadisiyah, Al-Qadisiyah 58002, Iraq
3
GeoBioTec, Department of Civil Engineering and Architecture, University of Beira Interior, 6201-001 Covilhã, Portugal
4
Department of Civil Engineering, Thammasat School of Engineering, Thammasat University, Pathumthani 12120, Thailand
*
Author to whom correspondence should be addressed.
CivilEng 2024, 5(3), 717-735; https://doi.org/10.3390/civileng5030038
Submission received: 7 July 2024 / Revised: 2 August 2024 / Accepted: 23 August 2024 / Published: 29 August 2024
(This article belongs to the Collection Recent Advances and Development in Civil Engineering)

Abstract

:
This study investigated the geotechnical and geophysical properties of the soil layers at the Missan combined-cycle power plant in Iraq. The data from 69 boreholes, including physical and chemical soil properties, were analyzed. The soil is primarily classified as silty clay with moderate to high plasticity, with some sandy layers. Since the Missan governorate is located in a seismically active region represented by the Iraq–Iran border, a study on the seismic properties of the site is also performed. Seismic downhole tests were conducted to determine wave velocities and dynamic moduli. The site was classified as soft clay soil according to FEMA and Eurocode 8 standards. Correlations for the physical and dynamic soil properties were evaluated. The correlations were executed via regression statistical analysis via Microsoft Excel software (2013). The results of the correlation equations and the coefficient of correlation R2 show that the physical correlations were considered medium to good correlations, whereas the dynamic soil correlations were perfectly correlated such that the R2 values were close to 1. This paper provides comprehensive data and soil property correlations, which can be valuable for future construction projects in the Missan area and similar geological formations.

1. Introduction

Missan is an Iraqi governorate that is located in the southeastern part of Iraq and has an area of approximately 16,072 km2. The geographical location of the Missan governorate is highly important, as it shares external borders with Iran and internal borders with the Basrah, Thi-Qar, and Wassit governorates, as shown in Figure 1. Therefore, the main goal of constructing the Missan combined-cycle power plant (MCCPP) was to supply clean energy and transfer sufficient electricity to cover the needs of 3,000,000 Iraqi houses and businesses. The first step in any construction project is to evaluate the geotechnical and geophysical characteristics of the soil. Hence, the geotechnical and geophysical properties of the soil at the Missan combined-cycle power plant (MCCPP) site were determined by different engineering testing laboratories and geophysical exploration companies.
It is common knowledge that all society structures are constructed on or on the ground at appropriate depths. Therefore, the response of the soil underneath these structures is significant, and soil investigations should be performed accurately while considering three engineering factors, i.e., safety, time, and cost [1]. Civil engineers obtain subsurface information, which supports them in designing foundations for intended structures inside power plants on the basis of site classification or characterization. Recently, the application of geophysical and geotechnical techniques in civil engineering has been a successful strategy [2].
There are few studies that cover the soil properties and soil of the Missan area [3,4,5,6]. Gelson and Plank [3] investigated Missan soil for construction purposes early in 1960. They investigated Missan soil to construct a highway bridge over the river Tigris. They reported that the soil layers were nonuniform horizontally. In addition, correlations between the mechanical and physical attributes of Al-Ammarah (the city center of Missan) clayey soil were studied by Al-Kahdaar and Al-Amery [4], who verified these correlations via simple regression analysis to find direct equations between different parameters. This approach provides convenient, simple, and easy indicator design parameters at preliminary investigation stages. In 2022, Mustafa [5] described the geotechnical properties of the soil profile in Hilla city within the Babylon governorate in the middle parts of Iraq. Microsoft Excel (2013) software was used to examine the correlations between the physical and mechanical properties of the soil, and the authors concluded that these correlations can be used to predict the values of the shear strength and consolidation parameters. However, Mahmood [6] collected the results of the standard penetration test (SPT), and particle size analysis was used to classify the Quaternary deposits extending vertically according to consistency and compactness. He divided the soil into seven layers. The bearing capacity of the first layer is suitable for holding shallow foundations of different light buildings in the study area. For heavy structures, piles of different types must be extended to depths that vary between 14–17 m, which represent depths of the sixth and seventh layers with high bearing capacities. Hossain et al. [7] used the most common soil investigation methods, such as the standard penetration test (SPT) and cone penetration test (CPT), to investigate the relationships among the soil parameters at the riverbank of the Rupsha River, Khulna, Bangladesh. Yilmaz [8] indirectly estimated the two main parameters of cohesive soils (swell percentage and shear strength) that play important roles in the deformation of structures. He collected clayey soil samples from five alluvial deposits in Turkey, and parameters, including the liquidity index, percent swell, and shear strength, were determined. The regression equations established for the liquidity index–percent swell and liquidity index–undrained shear strength had high correlation coefficients of 0.87 and 0.95, respectively. As a result, the equations derived from the samples used in this study apply well with an acceptable accuracy for use in percent swell and undrained shear strength estimations at the preliminary stage of site investigations. Al-Abboodi et al. [9] illustrated the major characteristics of Al-Ammarah soil via data gathered from various positions. They also reported that the soil layers are discontinuous in the horizontal direction, and issues related to sand dunes and gypsum occurrence were considered. Thus, there is a need for a study that thoroughly details the ground conditions for Missan soil and focuses on reporting the main geotechnical and geophysical characteristics of MCCPP project soil using the data available from ground investigation reports.

2. Investigations of Soil Geotechnical Properties

The main data were obtained from various engineering laboratories and geophysical exploration companies, where the data were collected from 69 boreholes drilled at different locations at the intended site at depths between 15 m and 45 m below the natural ground level (NGL), as shown in Figure 2. An example of the cross-sectional profile (for boreholes #1, #7, #13, and #20) of the site is plotted in Figure 3 to illustrate the different soil layers in the longitudinal and horizontal directions. One of the most common issues that geotechnical engineers face is the discontinuity of soil strata in the horizontal direction. On the basis of the results of the site investigation, the subsoils for the whole intended power plant site were mainly soft to medium close to the surface, strengthened with depth, to stiff with grayish and brownish colors; and sandy lean to fat silty clay with shiny spots of soluble salts and crystal pieces of silica minerals, black spots of organic materials together with white tiny marine shells, intervened by and overlying layers of medium-dense to very dense, with grayish and brownish visions in colors, fine- to medium-grained clayey silty sand with rusty spots of iron oxide compounds and black spots of organic matter.
From the values of the specific gravity, sieve analysis, and consistency indices, and according to the Unified Soil Classification System (USCS), the majority of the clayey soil is classified as CL-CH, i.e., silty clay with moderate to high plasticity, whereas the sandy layers are categorized as SM-SC. Table 1 shows an example of the soil layer description of borehole No. 35; notably, borehole No. 35 was chosen for its position at the center part of the project area and located within the turbine installation region. The method of drilling was carried out in accordance with the American Society for Testing and Materials (ASTM D 1452 D5783) [10].
During the soil investigation conducted in February 2019, the water table was at a shallow depth, which was near the surface and down to a depth of 1.0 m. This level was measured according to ASTM D-4750 [10].
The strength of the soil was measured at several depths via the standard penetration test (SPT). The test was performed in accordance with ASTM D1586-99 [10]. The test involved recording the number of blows of 140 lbs. A standard hammer with a 30-inch (76 cm) drop was used to drive a 2-inch (50.8 mm) diameter standard split spoon sampler into the soil at a distance of 12 inches (30.5 cm). Figure 4 shows the change in the number of blows with depth. The SPT number ranged from 2 to 20 with the soil depth between the ground surface and 15 m below the NGL. The SPT number ranged from 2 to 20, with soil depths ranging from 15 to 25 m below the NGL. Finally, when the depth of the soil increased above 25 m, the SPT values also increased significantly.
The plasticity properties of the soil at the site are illustrated in Figure 5, where the liquid limit (LL%) ranges between 38% and 68%, the plastic limit (PL%) ranges between 17% and 30%, and the plasticity index (PI%) ranges between 11% and 33.8%.
The consolidation and swelling tests were performed according to ASTM D-2435-02 [10]. The swelling potential of the soil was assessed via the oedometer consolidation device via two methods: free swelling and swelling pressure. Figure 6 shows the changes in the compression index (Cc), recompression index (Cr), and initial void ratio (e0) with soil depth.
Table 2 and Table 3 describe the physical properties and chemical properties of the site for the disturbed sample (DS) and undisturbed sample (US) of soil collected from the results of the following tests:
Natural moisture content and unit weight [10];
Specific gravity [10];
Grain size distribution [10];
Liquid and plastic limits [10];
Shear test:
Unconfined compression test [10];
Triaxial compression test (UU) [10];
Direct shear tests [10].
Compression test:
Consolidation and swelling tests [10];
Laboratory permeability test [10];
Chemical analysis of the soil:
Sulfate content as SO3 for soil;
Amount of soluble salt content [11);
Organic matter content [10];
pH.

3. Investigations of Soil Seismic Properties

In the past, Iraq was one of the countries with low seismic activity; however, seismic activity has clearly increased during the last ten years. Earthquakes can cause damage to different essential projects, such as buildings, dams, water and sewage systems, transportation, and electric power plants. Geotechnical engineers are interested in studying the seismic activity of soil layers, considering that soil is the medium that transmits seismic waves.
In the last ten years, two strong earthquakes have occurred in Iraq. The strongest earthquake hit the Iraq–Iran borders in Halabja city in the Sulaymaniyah governorate on 12 November 2017. This earthquake had a Richter local magnitude (ML) of 7.3. The earlier earthquake hit the Iraq–Iran borders in Ali Al-Gharbi city in the Missan governorate on 20 April 2012, with an ML of 5, whereas, during 2023, three weak-to-light earthquakes occurred in the Missan governorate, with an ML of 3–4. The Missan governorate is located in a seismically active region represented by Iraq–Iran borders. In this part of the paper, a study on the seismic properties of Missan soil (the Missan combined-cycle power plant (MCCPP) site) was performed.

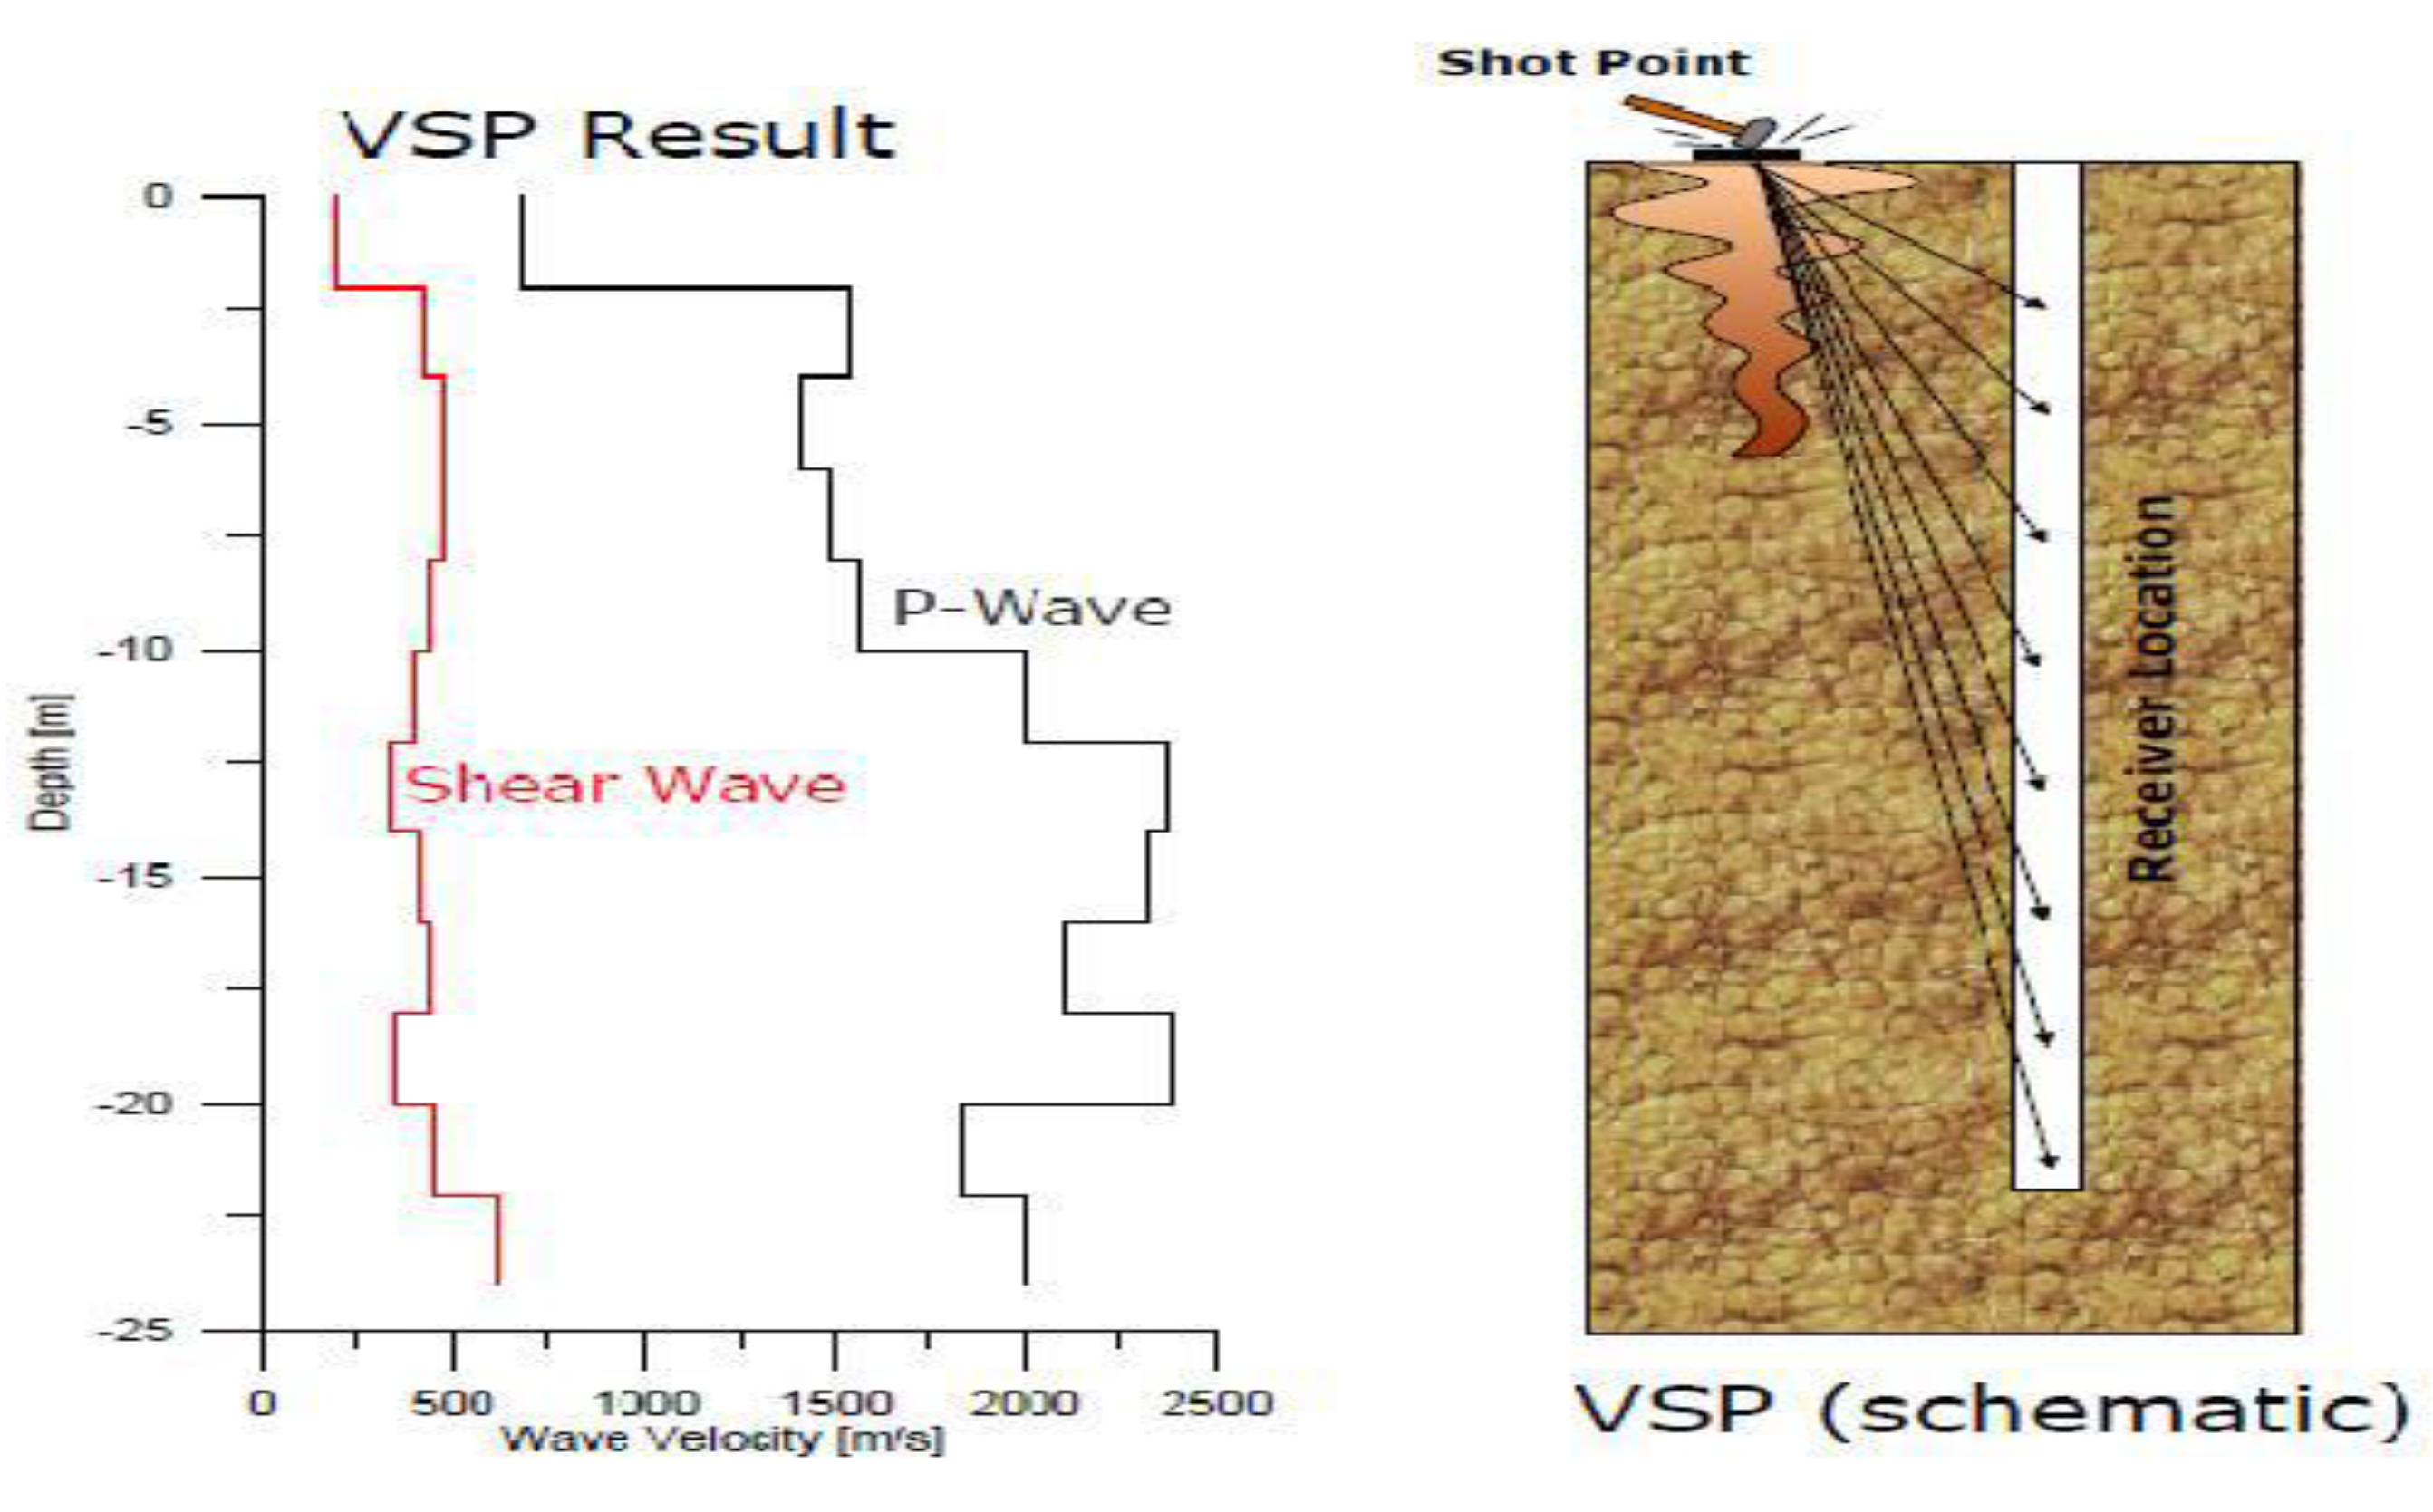
3.1. Seismic Downhole Test
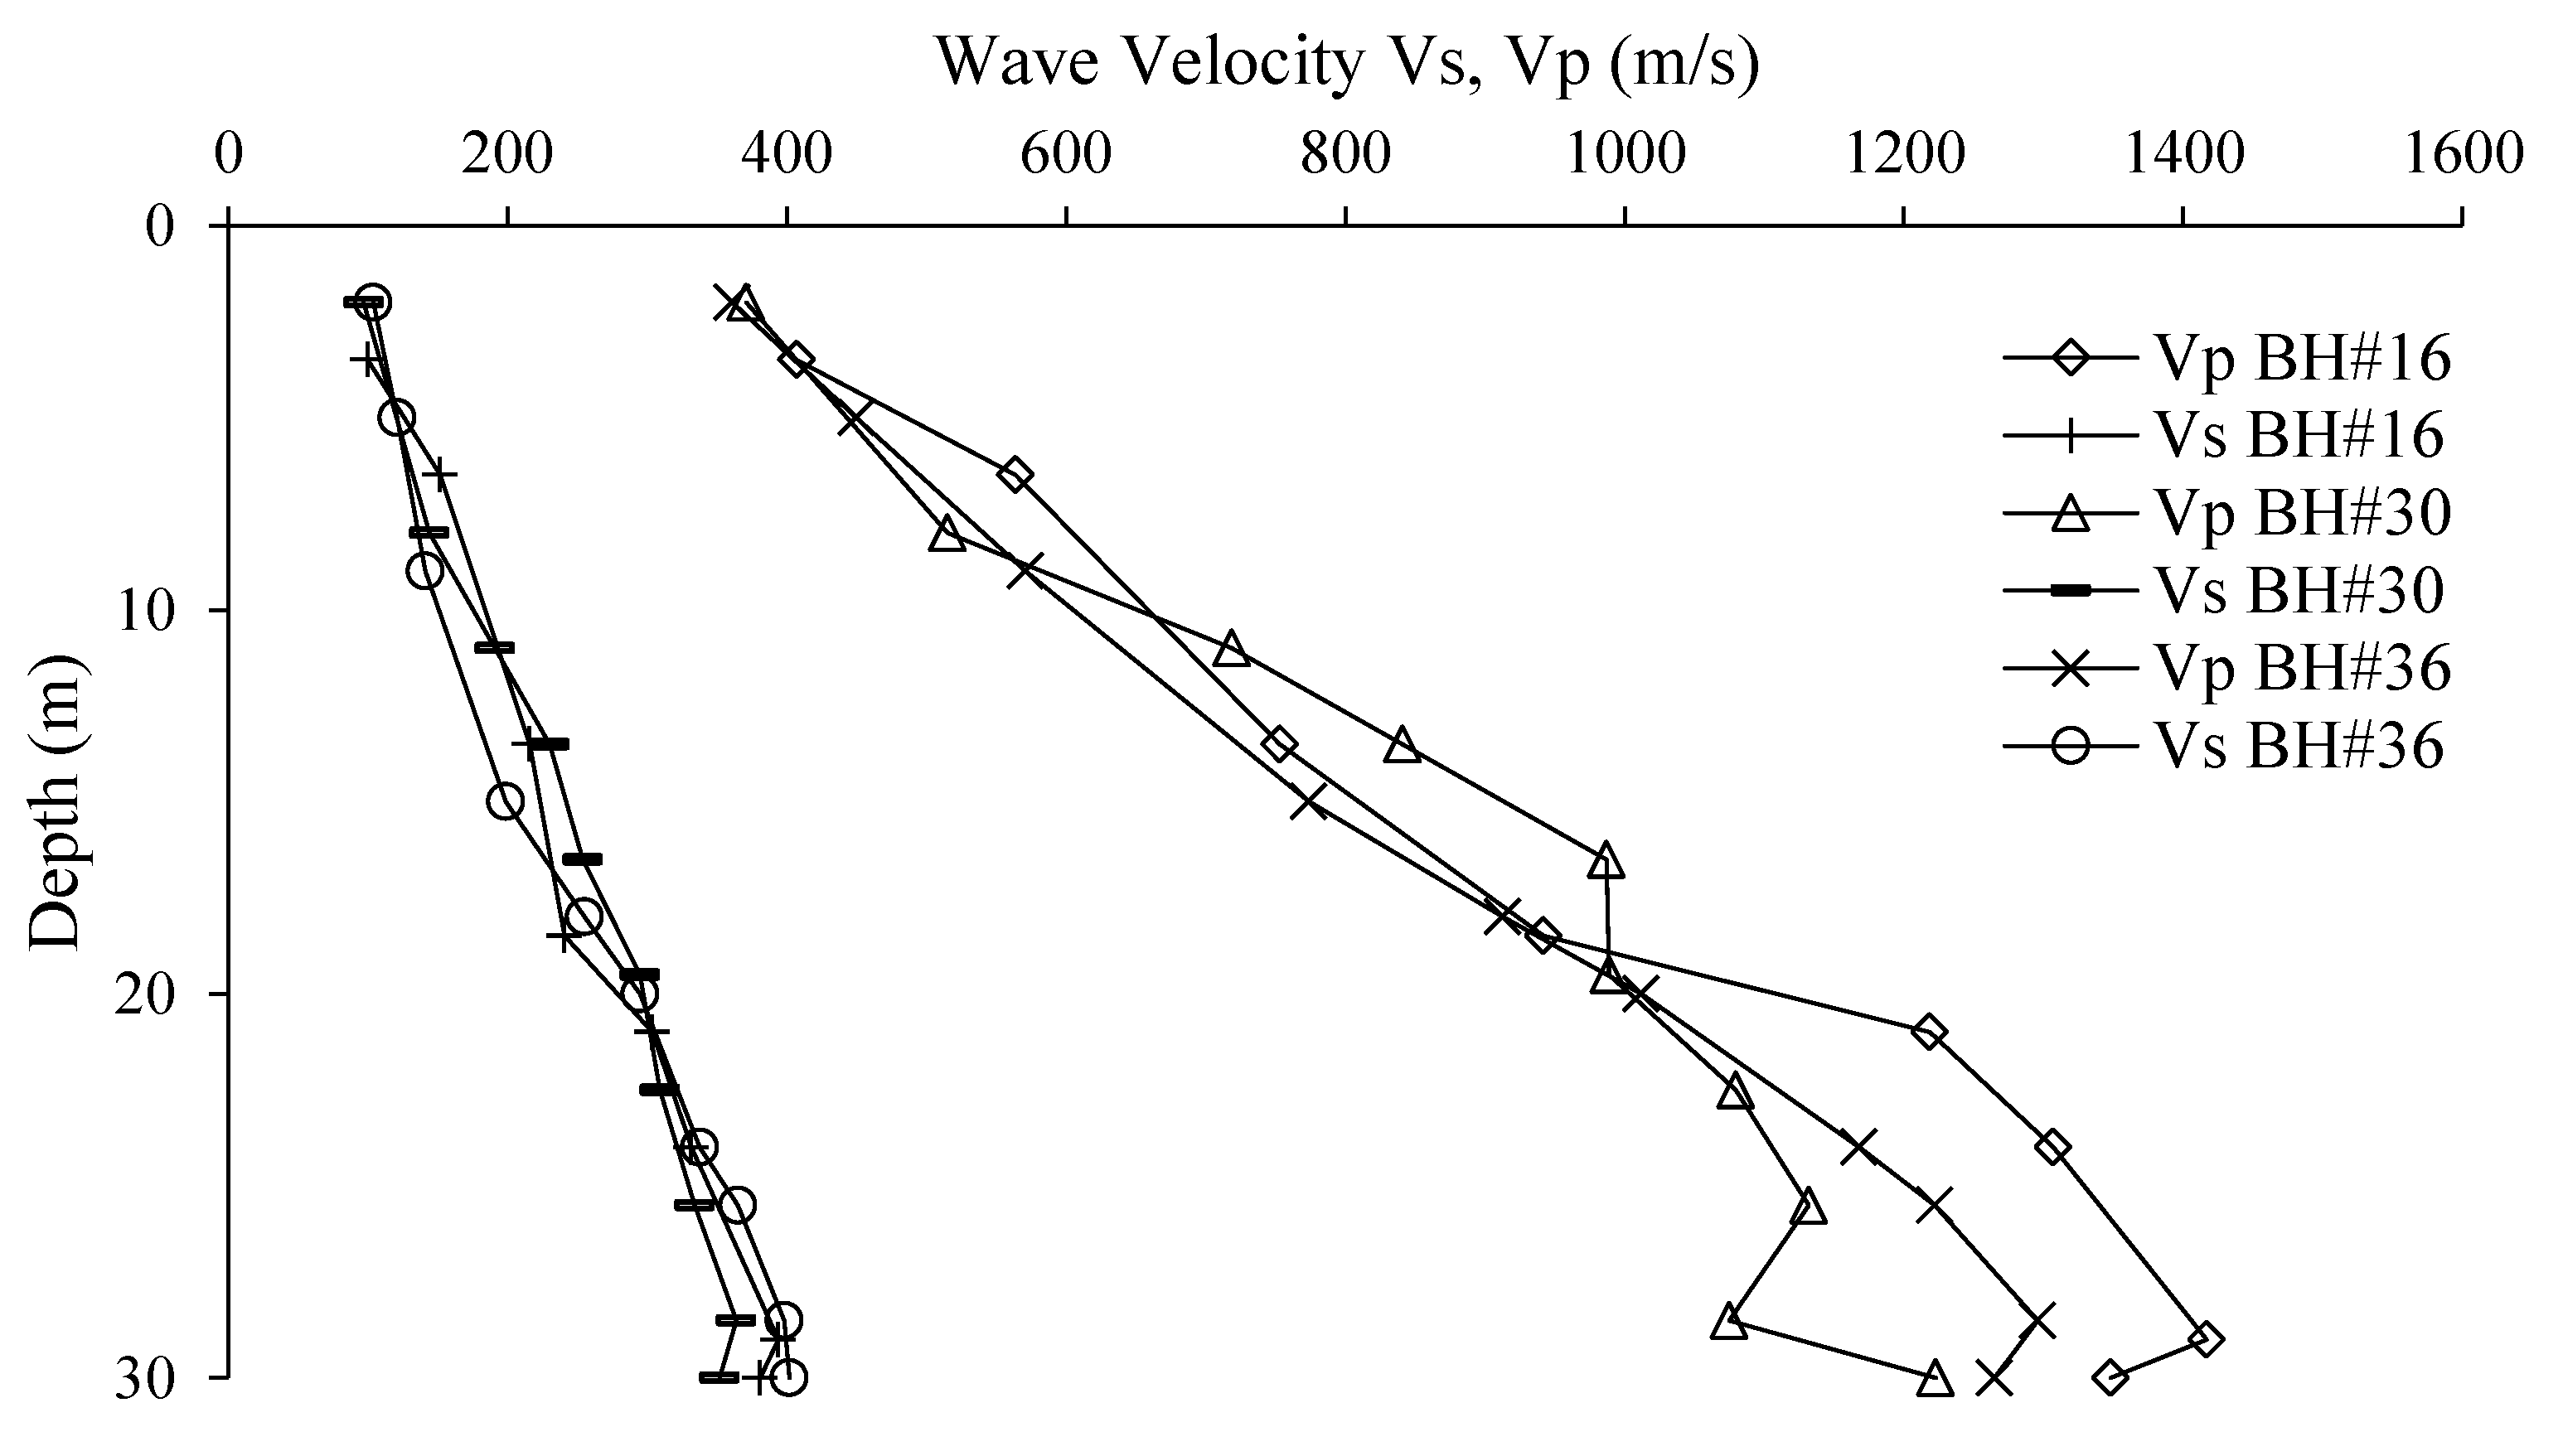
The principle of single-borehole seismic tests (downhole tests) depends on the generation of seismic waves (shear and compressional waves) at shot points on the surface, as shown in Figure 7. The shear and compressional wave velocities can be measured for subsurface soil layers by measuring the time intervals between the generation of the pulse and its reception at geophones at various distances. By knowing the density, γ, the elasto–dynamic moduli and constants for the subsurface soil layers can be determined. The related familiar equations for elastic modulus calculations are used to calculate the dynamic elastic moduli, as listed in Equations (1)–(4). Table 4 shows the symbols of the parameters and their standard units [11].
Gd = γ Vs2
Ed = 2 Gd (1 + υ)
Kd = Ed/[3 (1 2. υ)]
υ = 1 / 2 ( V p / V s ) 2 1 ( V p / V s ) 2 1
A seismic survey was carried out via the downhole method at three boreholes (boreholes #16, #30, and #38) at the site to a depth of 30 m from the NGL. The seismic parameters of the soil were calculated, and the results are shown in Table 5.

3.2. Results

The minimum and maximum values of the recorded shear and compressional wave velocities were (Vs)min,max (97–402) m/s and (Vp)min,max (361–1417) m/s, respectively. In addition, the shear and compressional wave velocities against depth for each borehole from the downhole test are shown in Figure 8. It is clear that Vs and Vp increase with depth in proportion to the bulk density, γ, which also increases with depth. Figure 9 shows that the denser the soil layers, the greater the wave velocity. This relationship was discussed by Gaviglio [12], Yasar and Erdogan [13], and Chawre [14].
The evaluated minimum and maximum dynamic moduli along the depth of the three boreholes were (Gd)min,max (15.95–302) MPa, (Ed)min,max (46.6–871.3) MPa, and (Kd)min,max (196.3–3400.7) MPa. They increase with depth, as shown in Figure 10.

3.3. Site Class and Ground Type Classification

When an earthquake occurs, waves pass through soil layers, and each type of soil transmits waves with different frequencies. In regions of low or moderate seismicity, site conditions are important in determining seismic design categories, leading to wide differences in design and detailing requirements to prevent earthquake damage. Buildings on soft or loose soils suffer more damage than comparable buildings on stiff soil or rock sites. Geotechnical engineers are responsible for performing site classification, and structural engineers can check geotechnical engineers’ classification to make valuable details and recommendations in determining seismic design forces and establishing seismic design categories that have a significant impact on the design and cost of buildings (Kelly [15]).
Geotechnical engineers are recommended to classify the soil according to the Federal Emergency Management Agency of the Department of Homeland Security (FEMA) [16] and Eurocode 8 [17] by calculating the average shear wave velocity, Vs,30, for the upper 30 m of the soil layers via Equation (5).
V s , 30 = H i = 1 , N       h i v i
where H is the depth of the soil equal to 30 m or less, hi is the thickness of the layer, and vi is the shear wave velocity of the i-th layer, in a total of N, existing in the top 30 m.
The results of Vs,30 are listed in Table 6. The table shows that the site class and ground type were E and D according to the FEMA [16] and Eurocode 8 [17], respectively. For both codes, the site of the soil is classified as soft clay; such soil is considered problematic soil (sensitive clay or liquefiable soil) that tends to collapse during earthquakes. To overcome this soft clay layer, the design of structures with pile foundations instead of shallow foundations is recommended. The designed piles are approximately 10 m long [15].

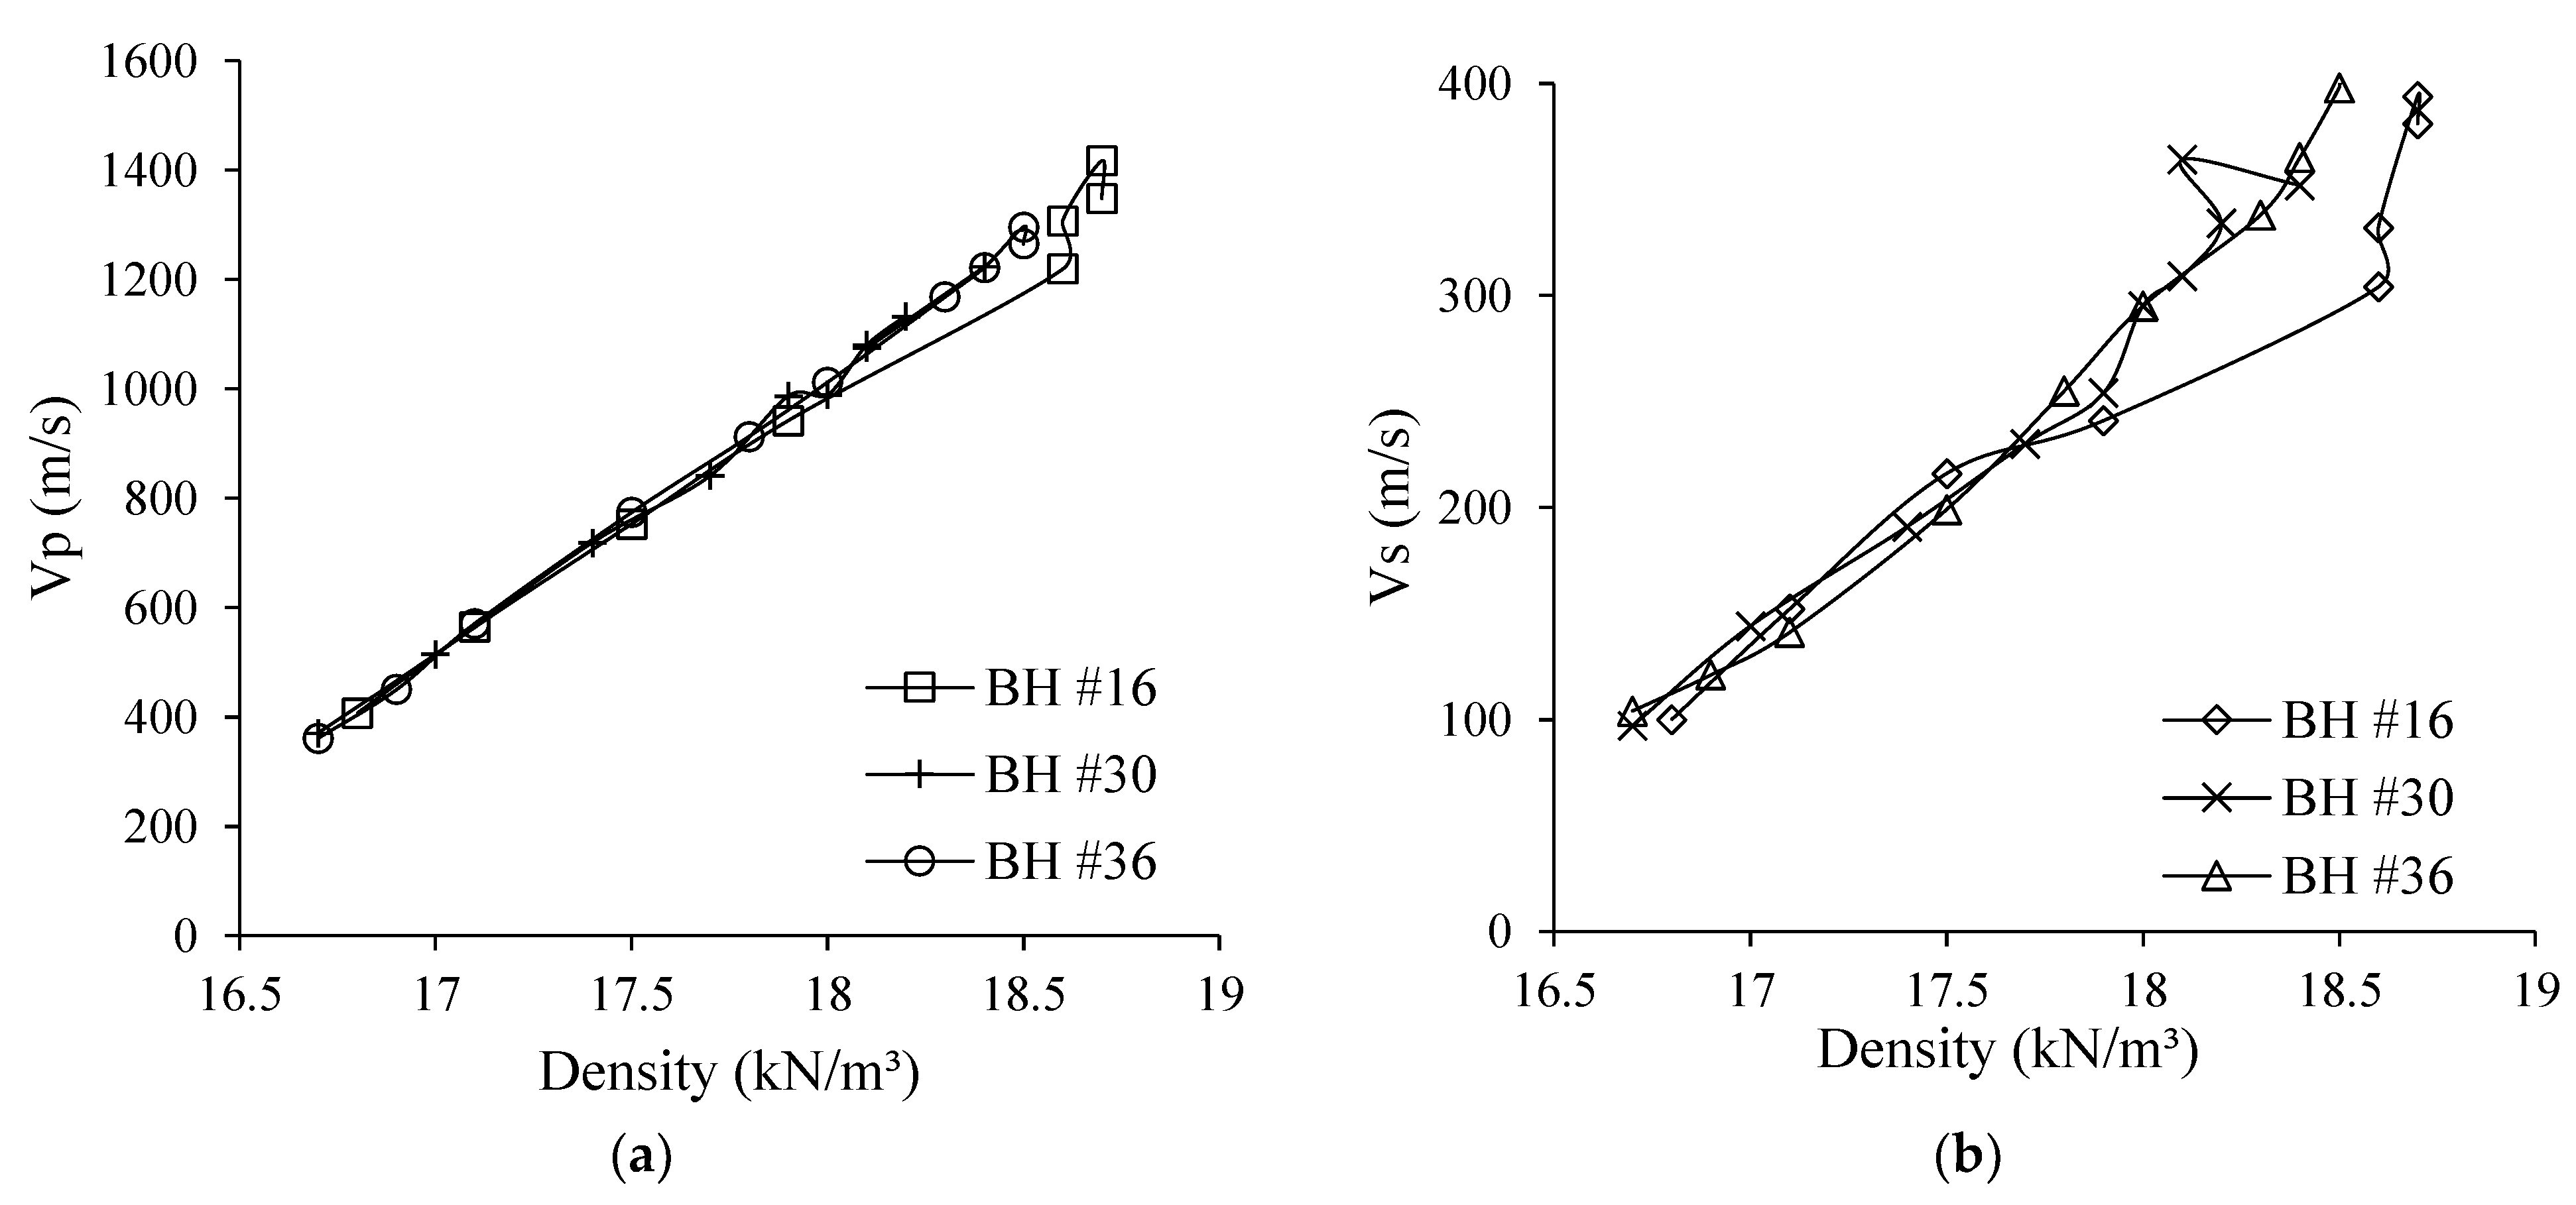
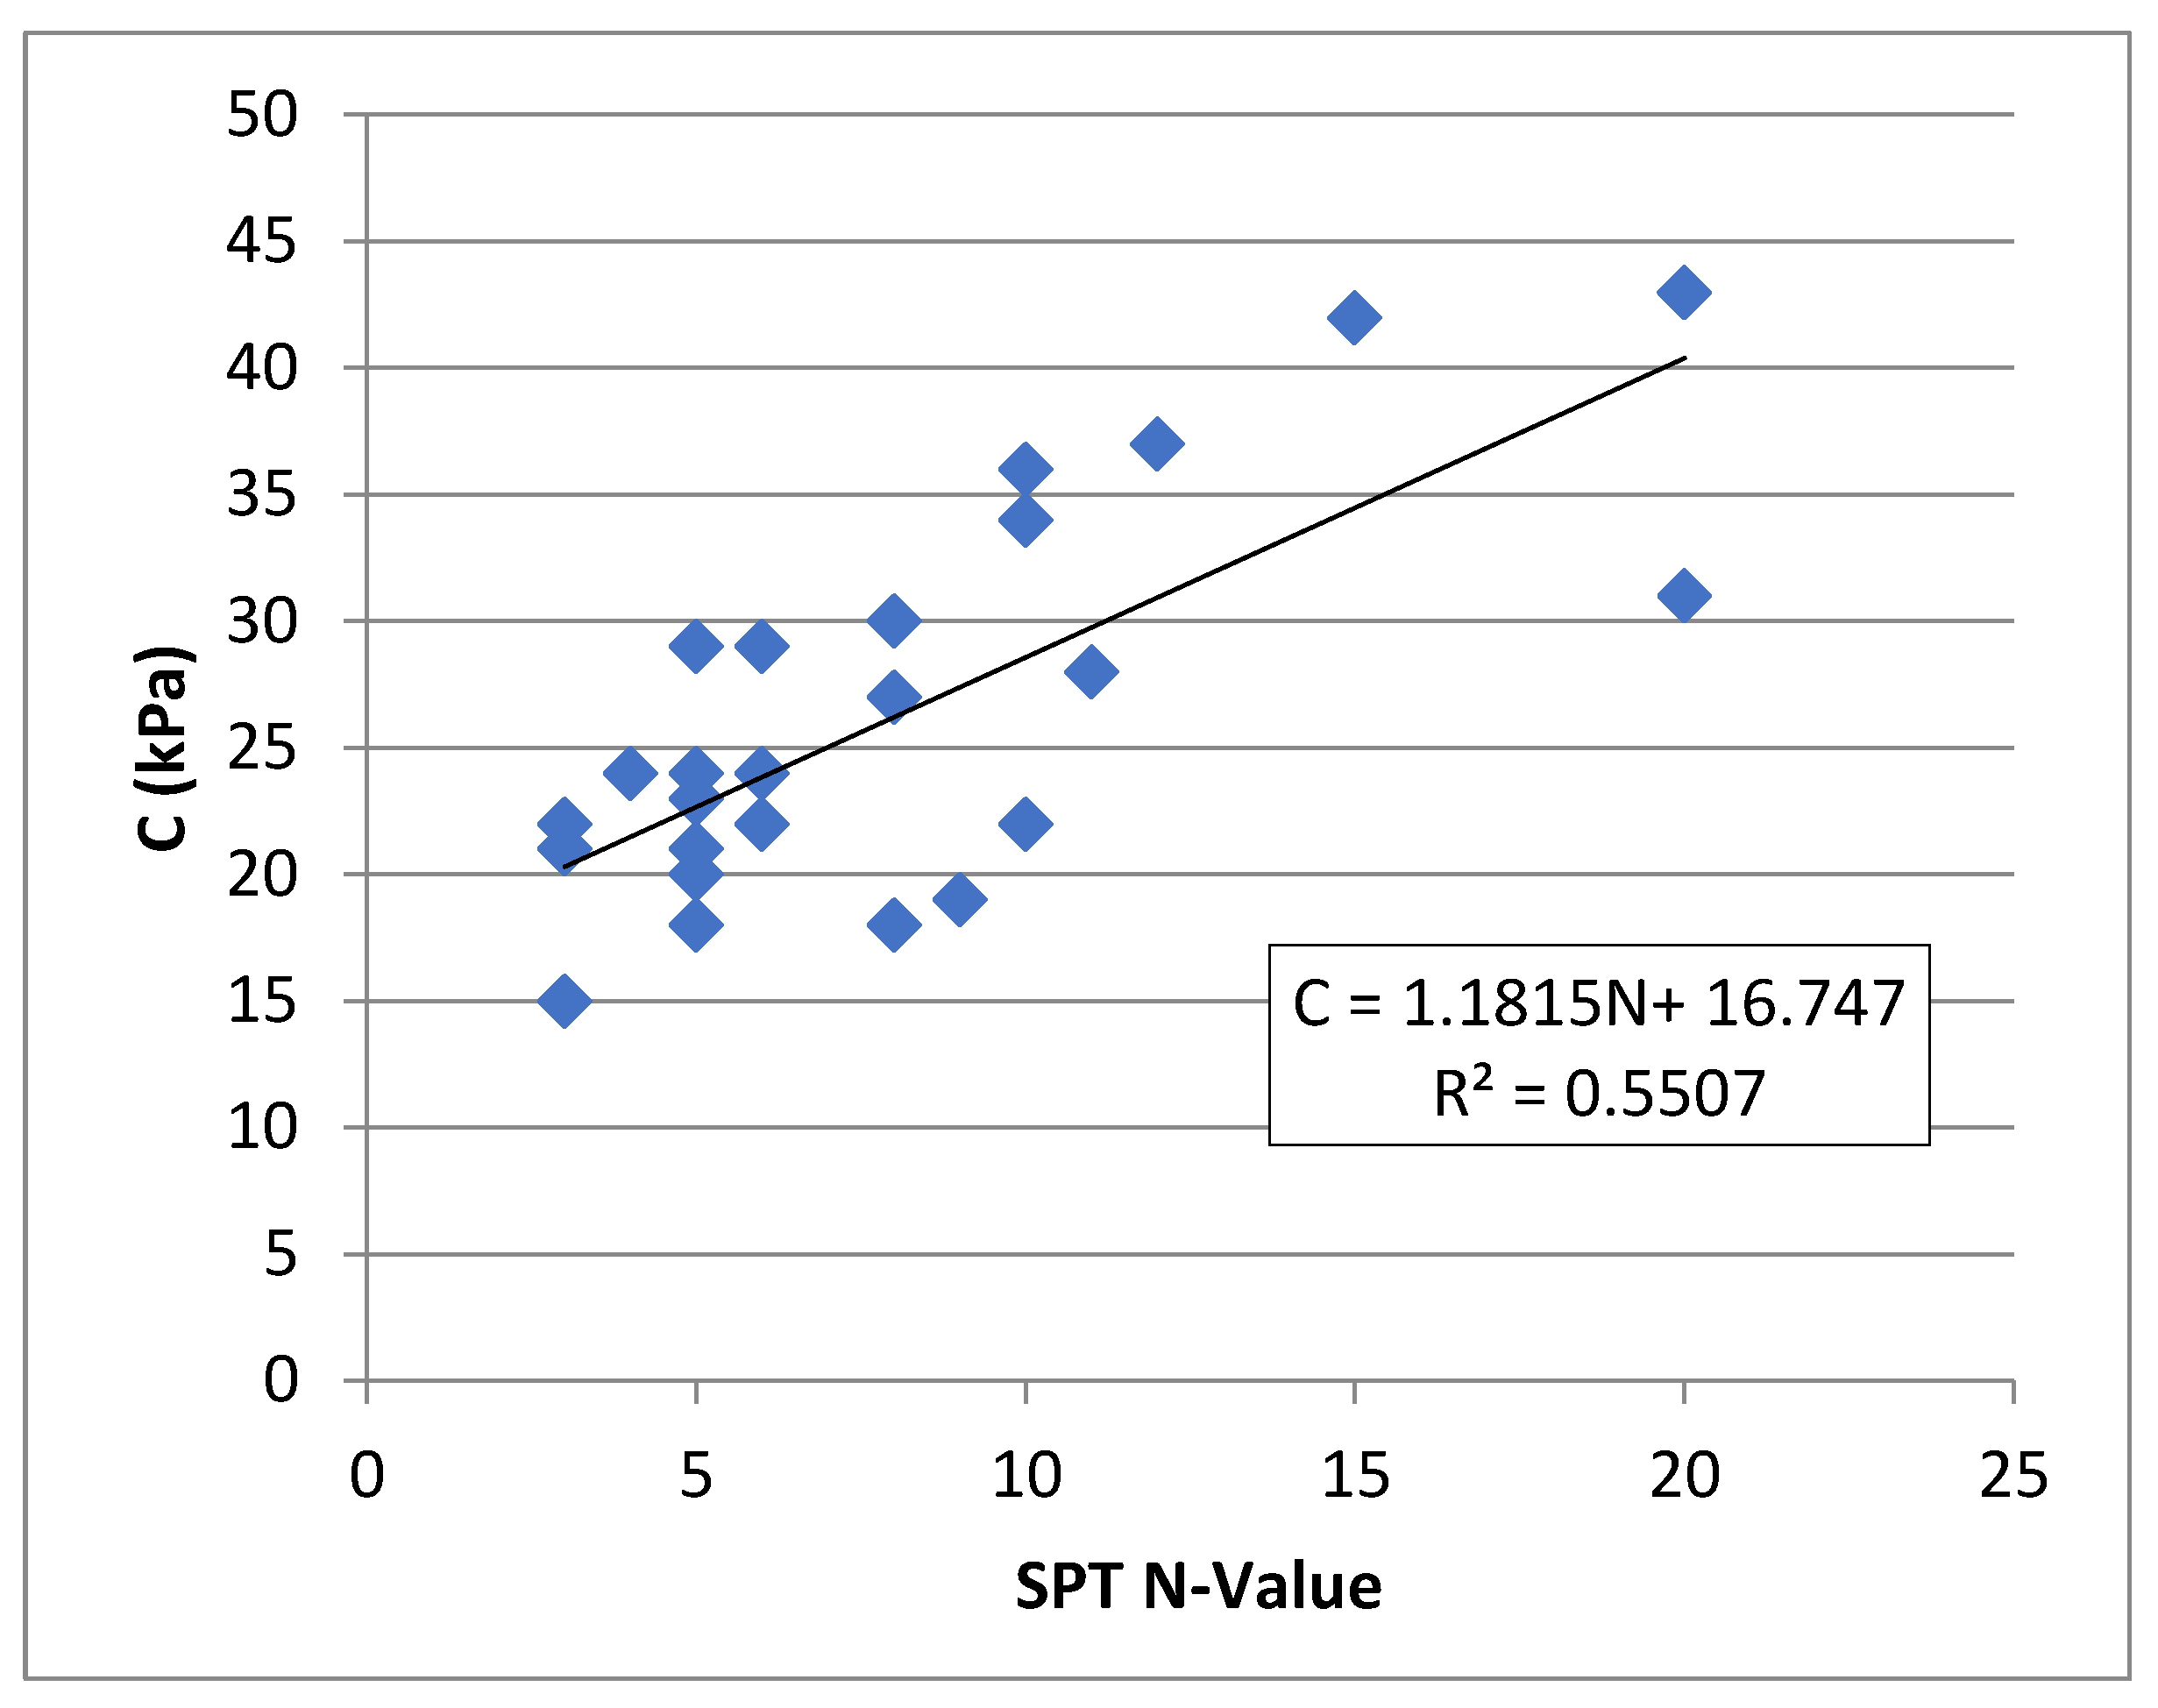
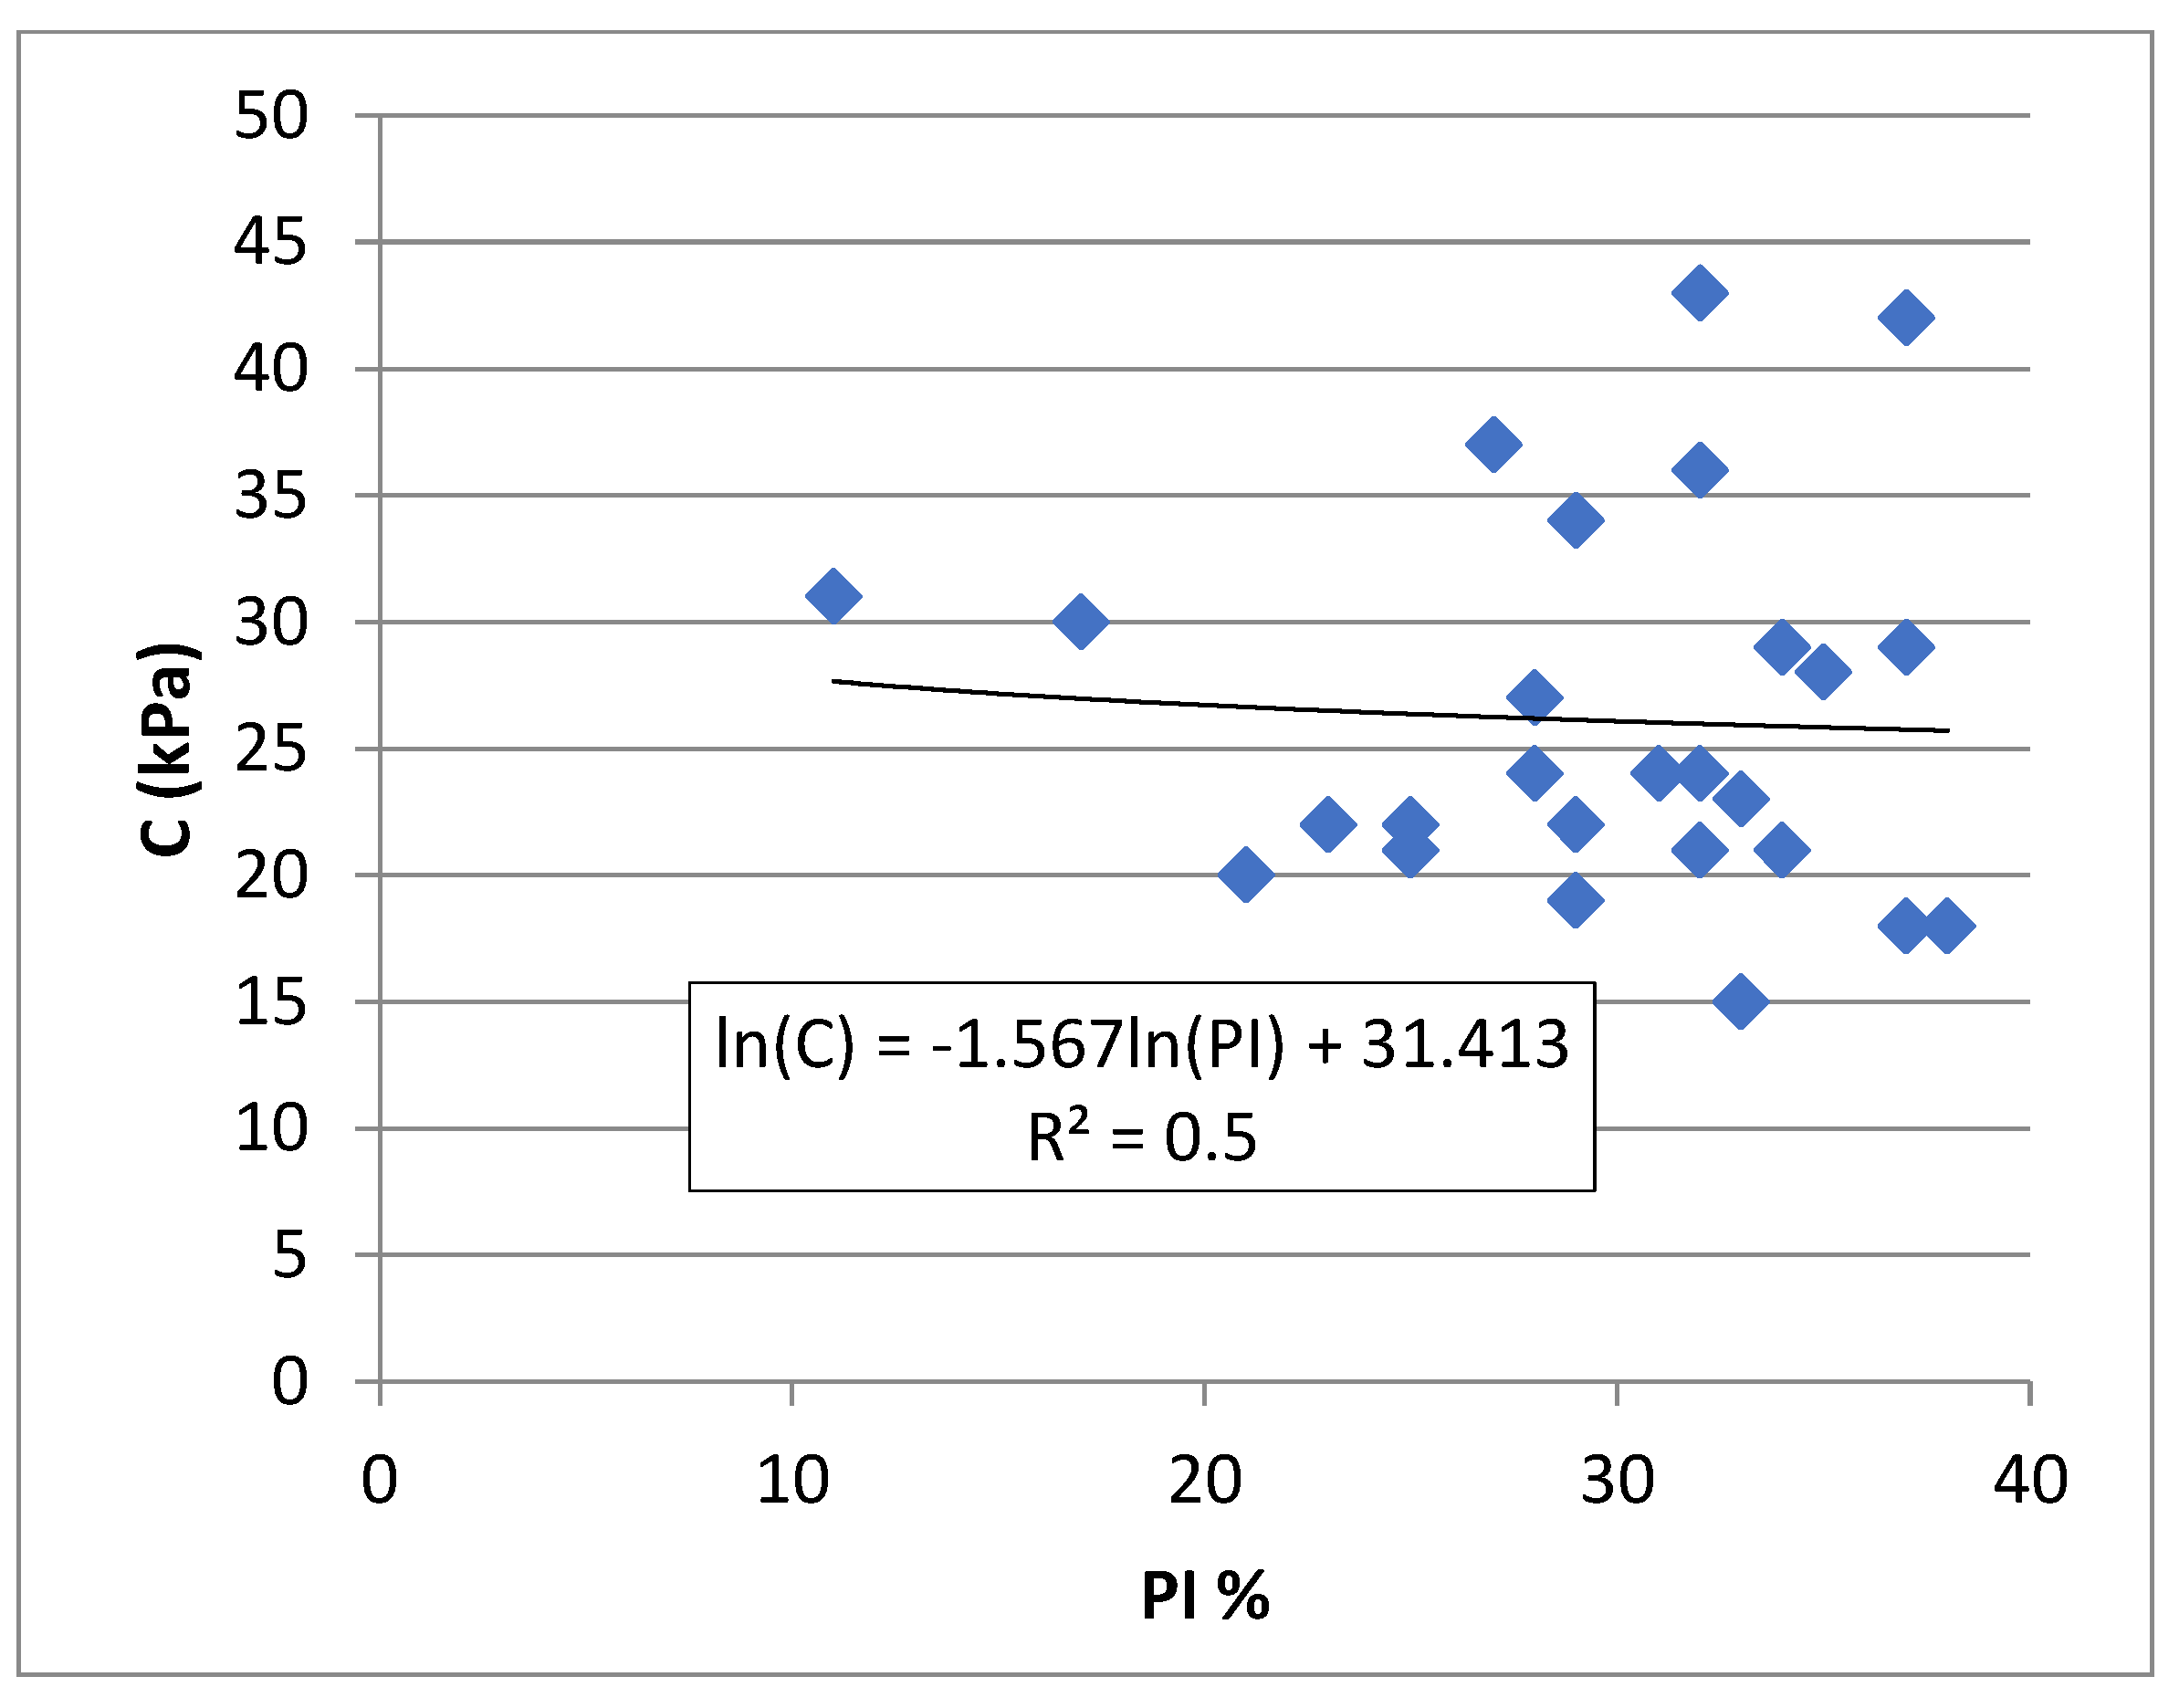
4. Geotechnical Correlations of Soil Properties

In this section, a number of soil property correlations were predicted via statistical analysis. The physical soil properties, which are illustrated in Table 2, were analyzed for different boreholes. Figure 11 shows the correlation between SPT (N value) and cohesion C (kPa) for the available data. Simple regression analysis was performed via Microsoft Excel software (2013). The correlation equation was (C = 1.1815 N + 16.747), with a coefficient of correlation of R2 = 0.5507.
The cohesion of the soil, which was evaluated via different laboratory tests, was analyzed with respect to the plasticity index (PI %), and the evaluated statistical equations were (ln(C) = −1.567ln(PI) + 31.413) and (R2 = 0.5), as shown in Figure 12. Figure 13 shows the consolidation parameter compression index (Cc) against the void ratio (e0). The resulting equation from the regression analysis is (Cc = 0.4084e° − 0.1169), with (R2 = 0.4693). These correlations are considered medium to good depending on the coefficient of correlation R2.

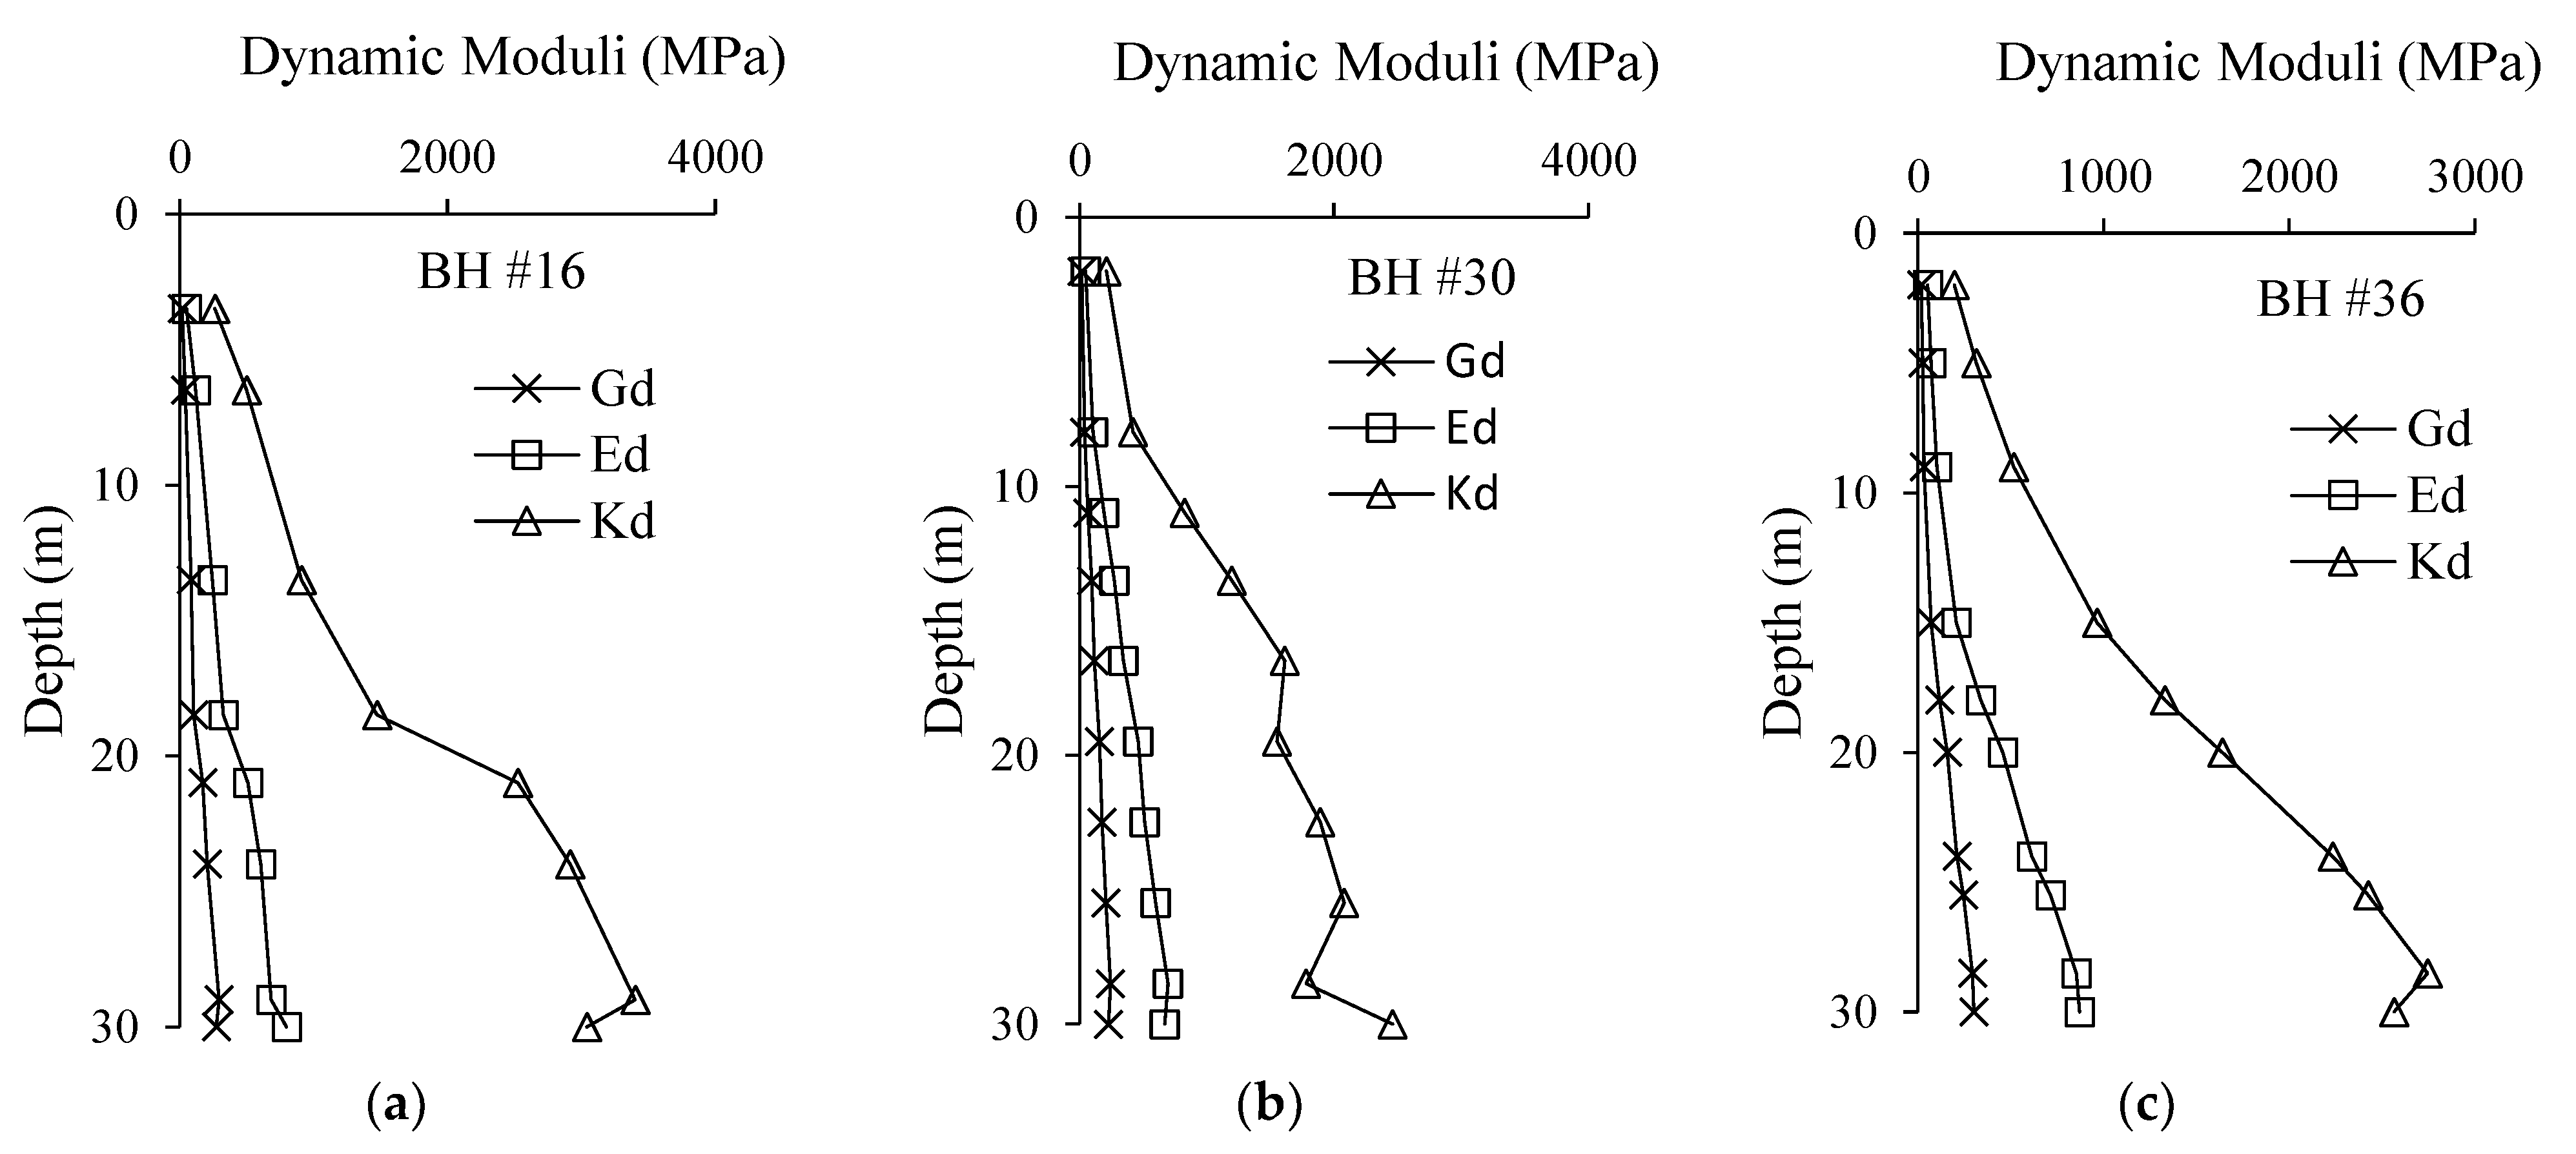
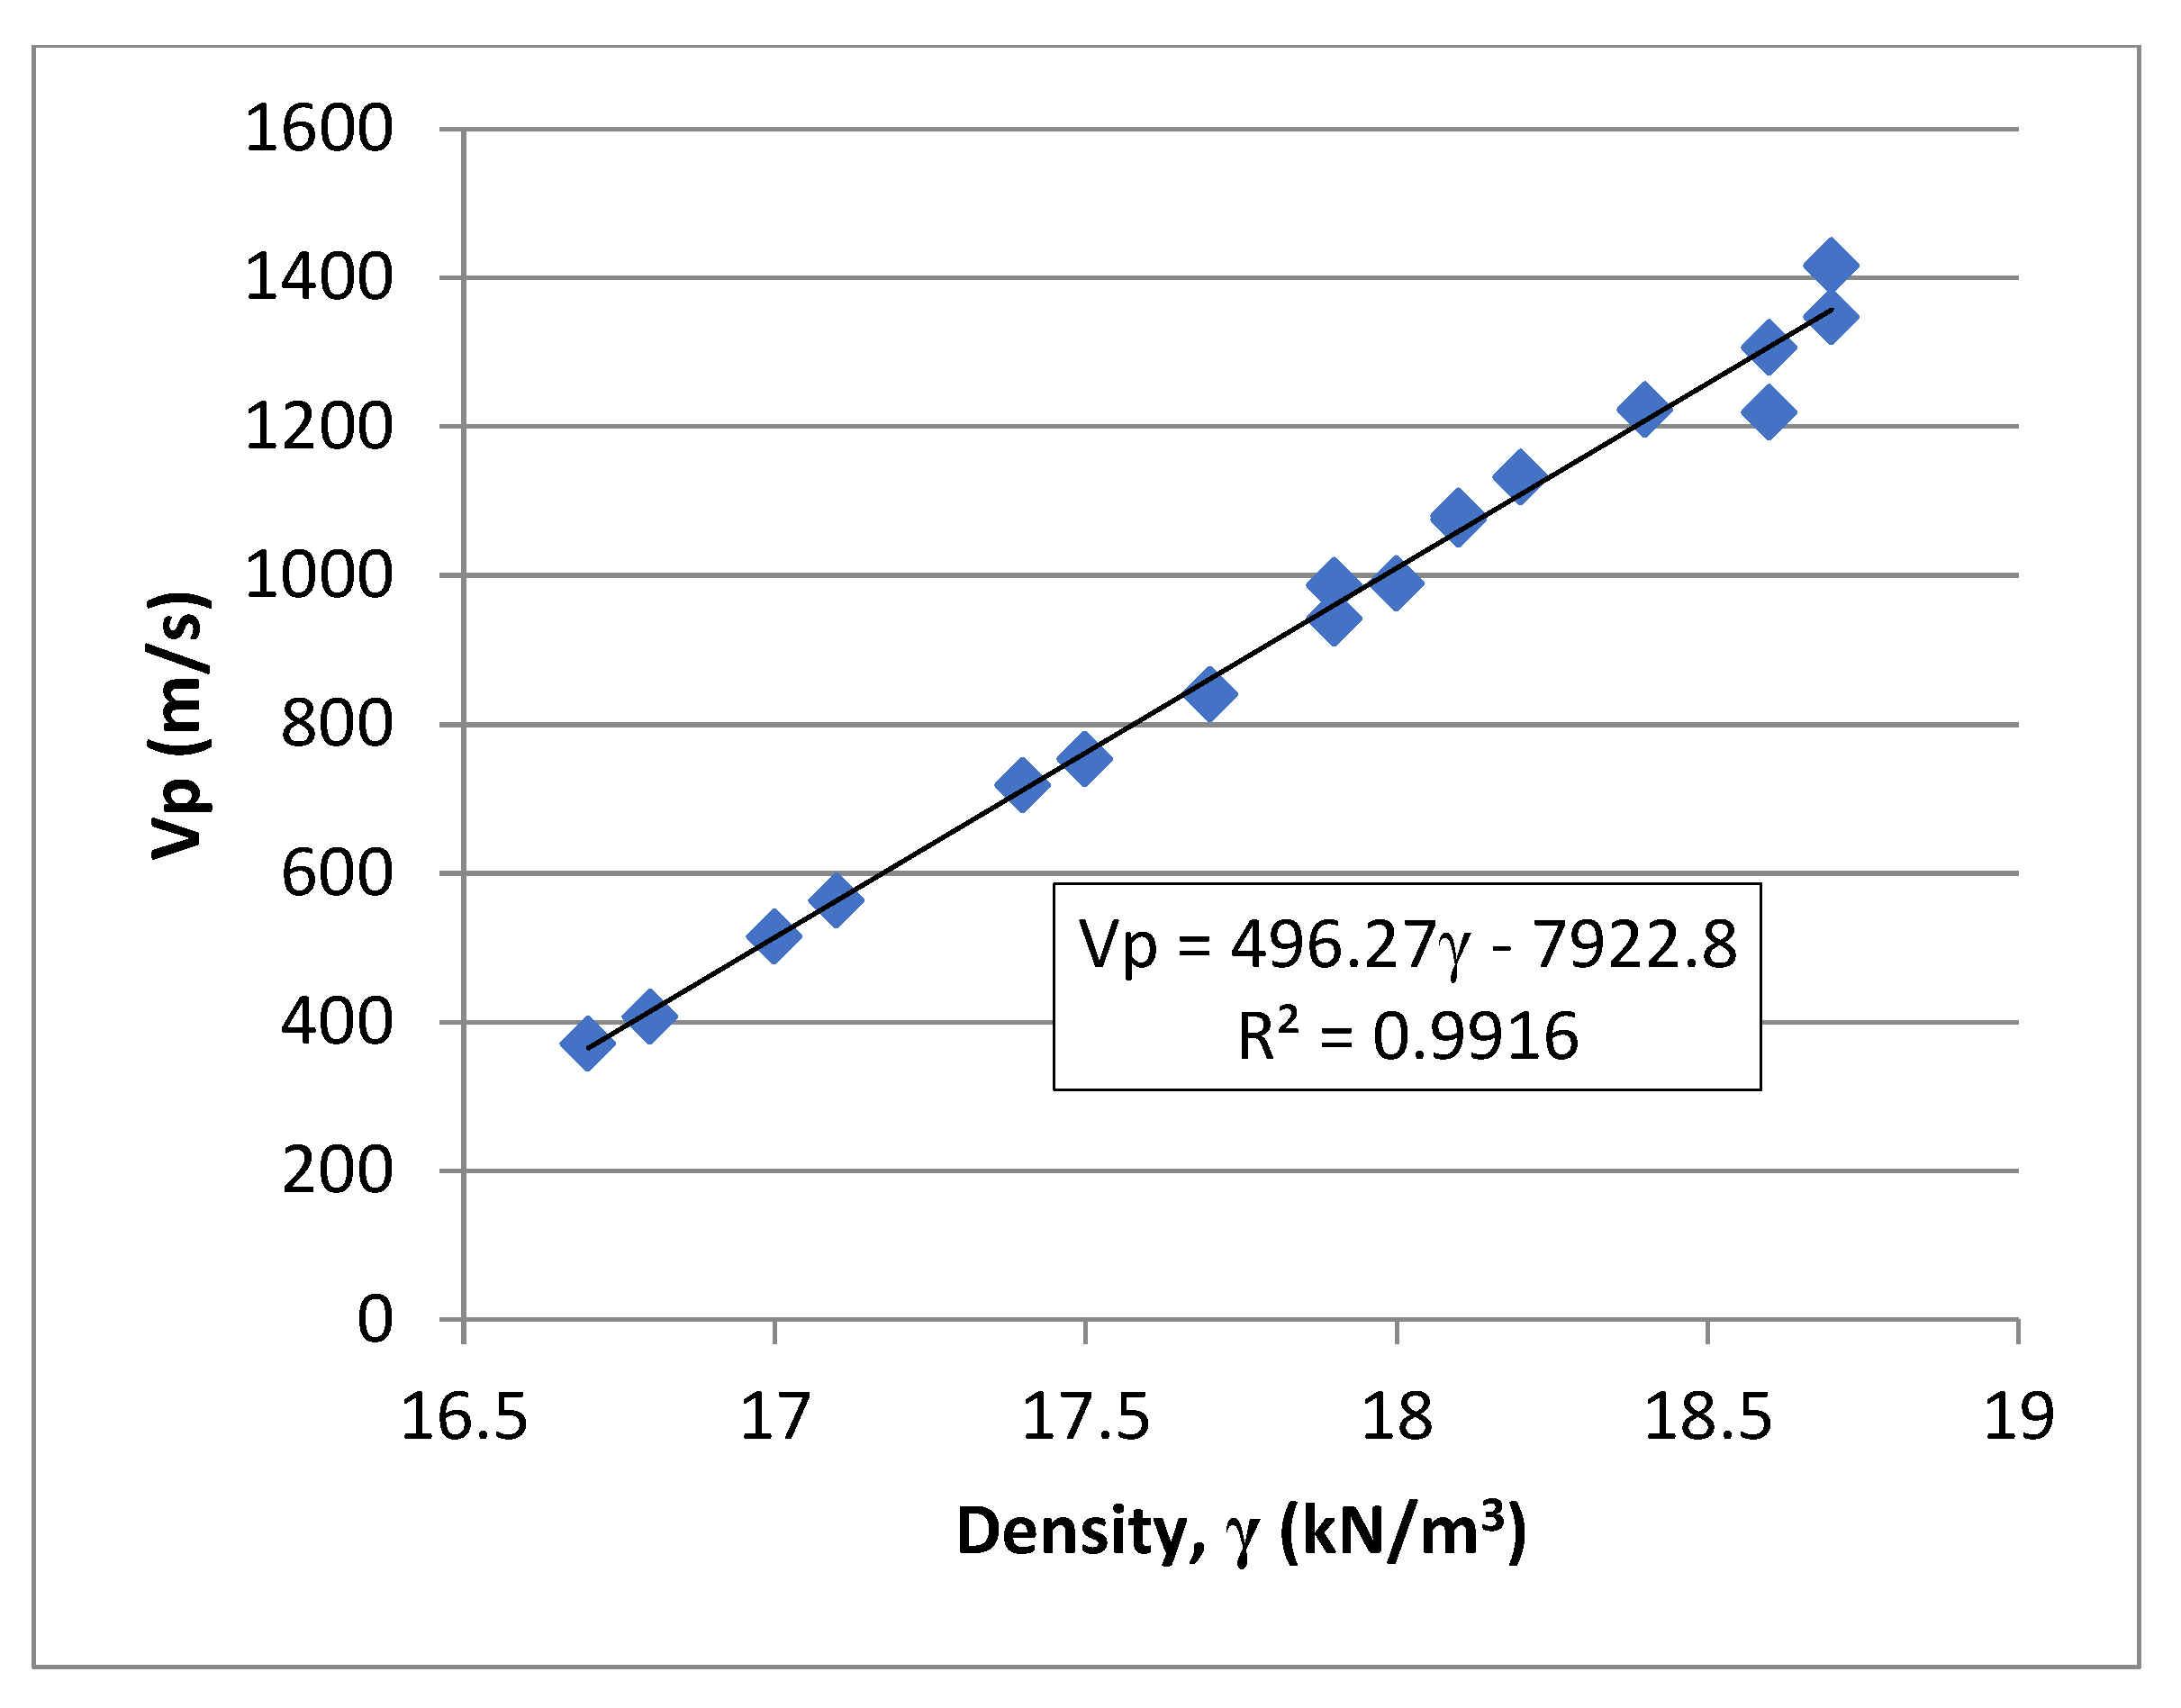
5. Dynamic Correlations of the Soil Properties

The dynamic parameter correlations were examined and analyzed statistically via Microsoft Excel regression analysis. Figure 14, Figure 15 and Figure 16 present the correlations between the density and the dynamic modulus of elasticity, compression velocity, and shear wave velocity, respectively. The results were valid and provided excellent relationships through the value of the coefficient of correlation R2. An R2 value closer to 1 for linear regression analysis means that the data are perfectly correlated.

6. Conclusions

A study of various geotechnical characteristics of the soil of Missan city is covered in this research. The outcomes are applicable to any location with a geological formation similar to that of the present study area, but the same technique can also be used in other areas. Thus, the cost of geotechnical exploration could be decreased with this strategy.
Notably, the first 45 m of the intended site is mainly silt with lower percentages of clay and sand. The cross-sectional profile of the study area revealed that the examined soil deposits seemed to be randomly distributed with depth. For the SPT tests, the number of blows increased significantly at depths greater than 25 m below ground level.
A seismic investigation of Missan soil (Missan combined-cycle power plant (MCCPP) site) was performed in this work for two important reasons: (i) the Missan governorate is located in the seismically active region in Iraq, and (ii) soils under buildings with dynamic or cycling loads should be compared with the forces of vibration. The results of the downhole test revealed that the minimum and maximum shear and compressional wave velocities were (Vs)min,max (97–402) m/s and (Vp)min,max (361, 1417) m/s, respectively. The Vs and Vp values increased with depth in proportion to the bulk density, γ, values, which also increased with depth, indicating that, the denser the soil layers, the greater the wave velocity. The evaluated minimum and maximum dynamic moduli along the depth of the three boreholes were (Gd)min,max (15.95–302) MPa, (Ed)min,max (46.6–871.3) MPa, and (Kd)min,max (196.3–3400.7) MPa. They also increase with depth. The evaluated site class and ground type were E and D according to the FEMA [12] and Eurocode 8 [13], respectively. For both codes, the soil is classified as soft clay, which is considered problematic (sensitive clay or liquefiable soil). To overcome soft soil layers, the use of pile foundations (end bearing or shaft resistance piles) approximately 10 m in length to transmit loads to stiffer underground layers, which decreases the differential settlement of the structure due to dynamic waves and prevents earthquake damage, is recommended.
Physical and dynamic soil property correlations were performed via Microsoft Excel software (2013), and, from the regression analysis, the value for the correlation equations R2 was 0.4693–0.5507 for the physical property correlations, which were considered medium-to-well-correlated, whereas the R2 for the dynamic properties was 0.8832–0.9916, which were perfectly correlated.
In recent years, the Missan governorate has witnessed urban development, as this study is applied to a limited area of the Missan governorate site, the Missan combined-cycle power plant, and some suggestions and recommendations to be considered for future studies are as follows:
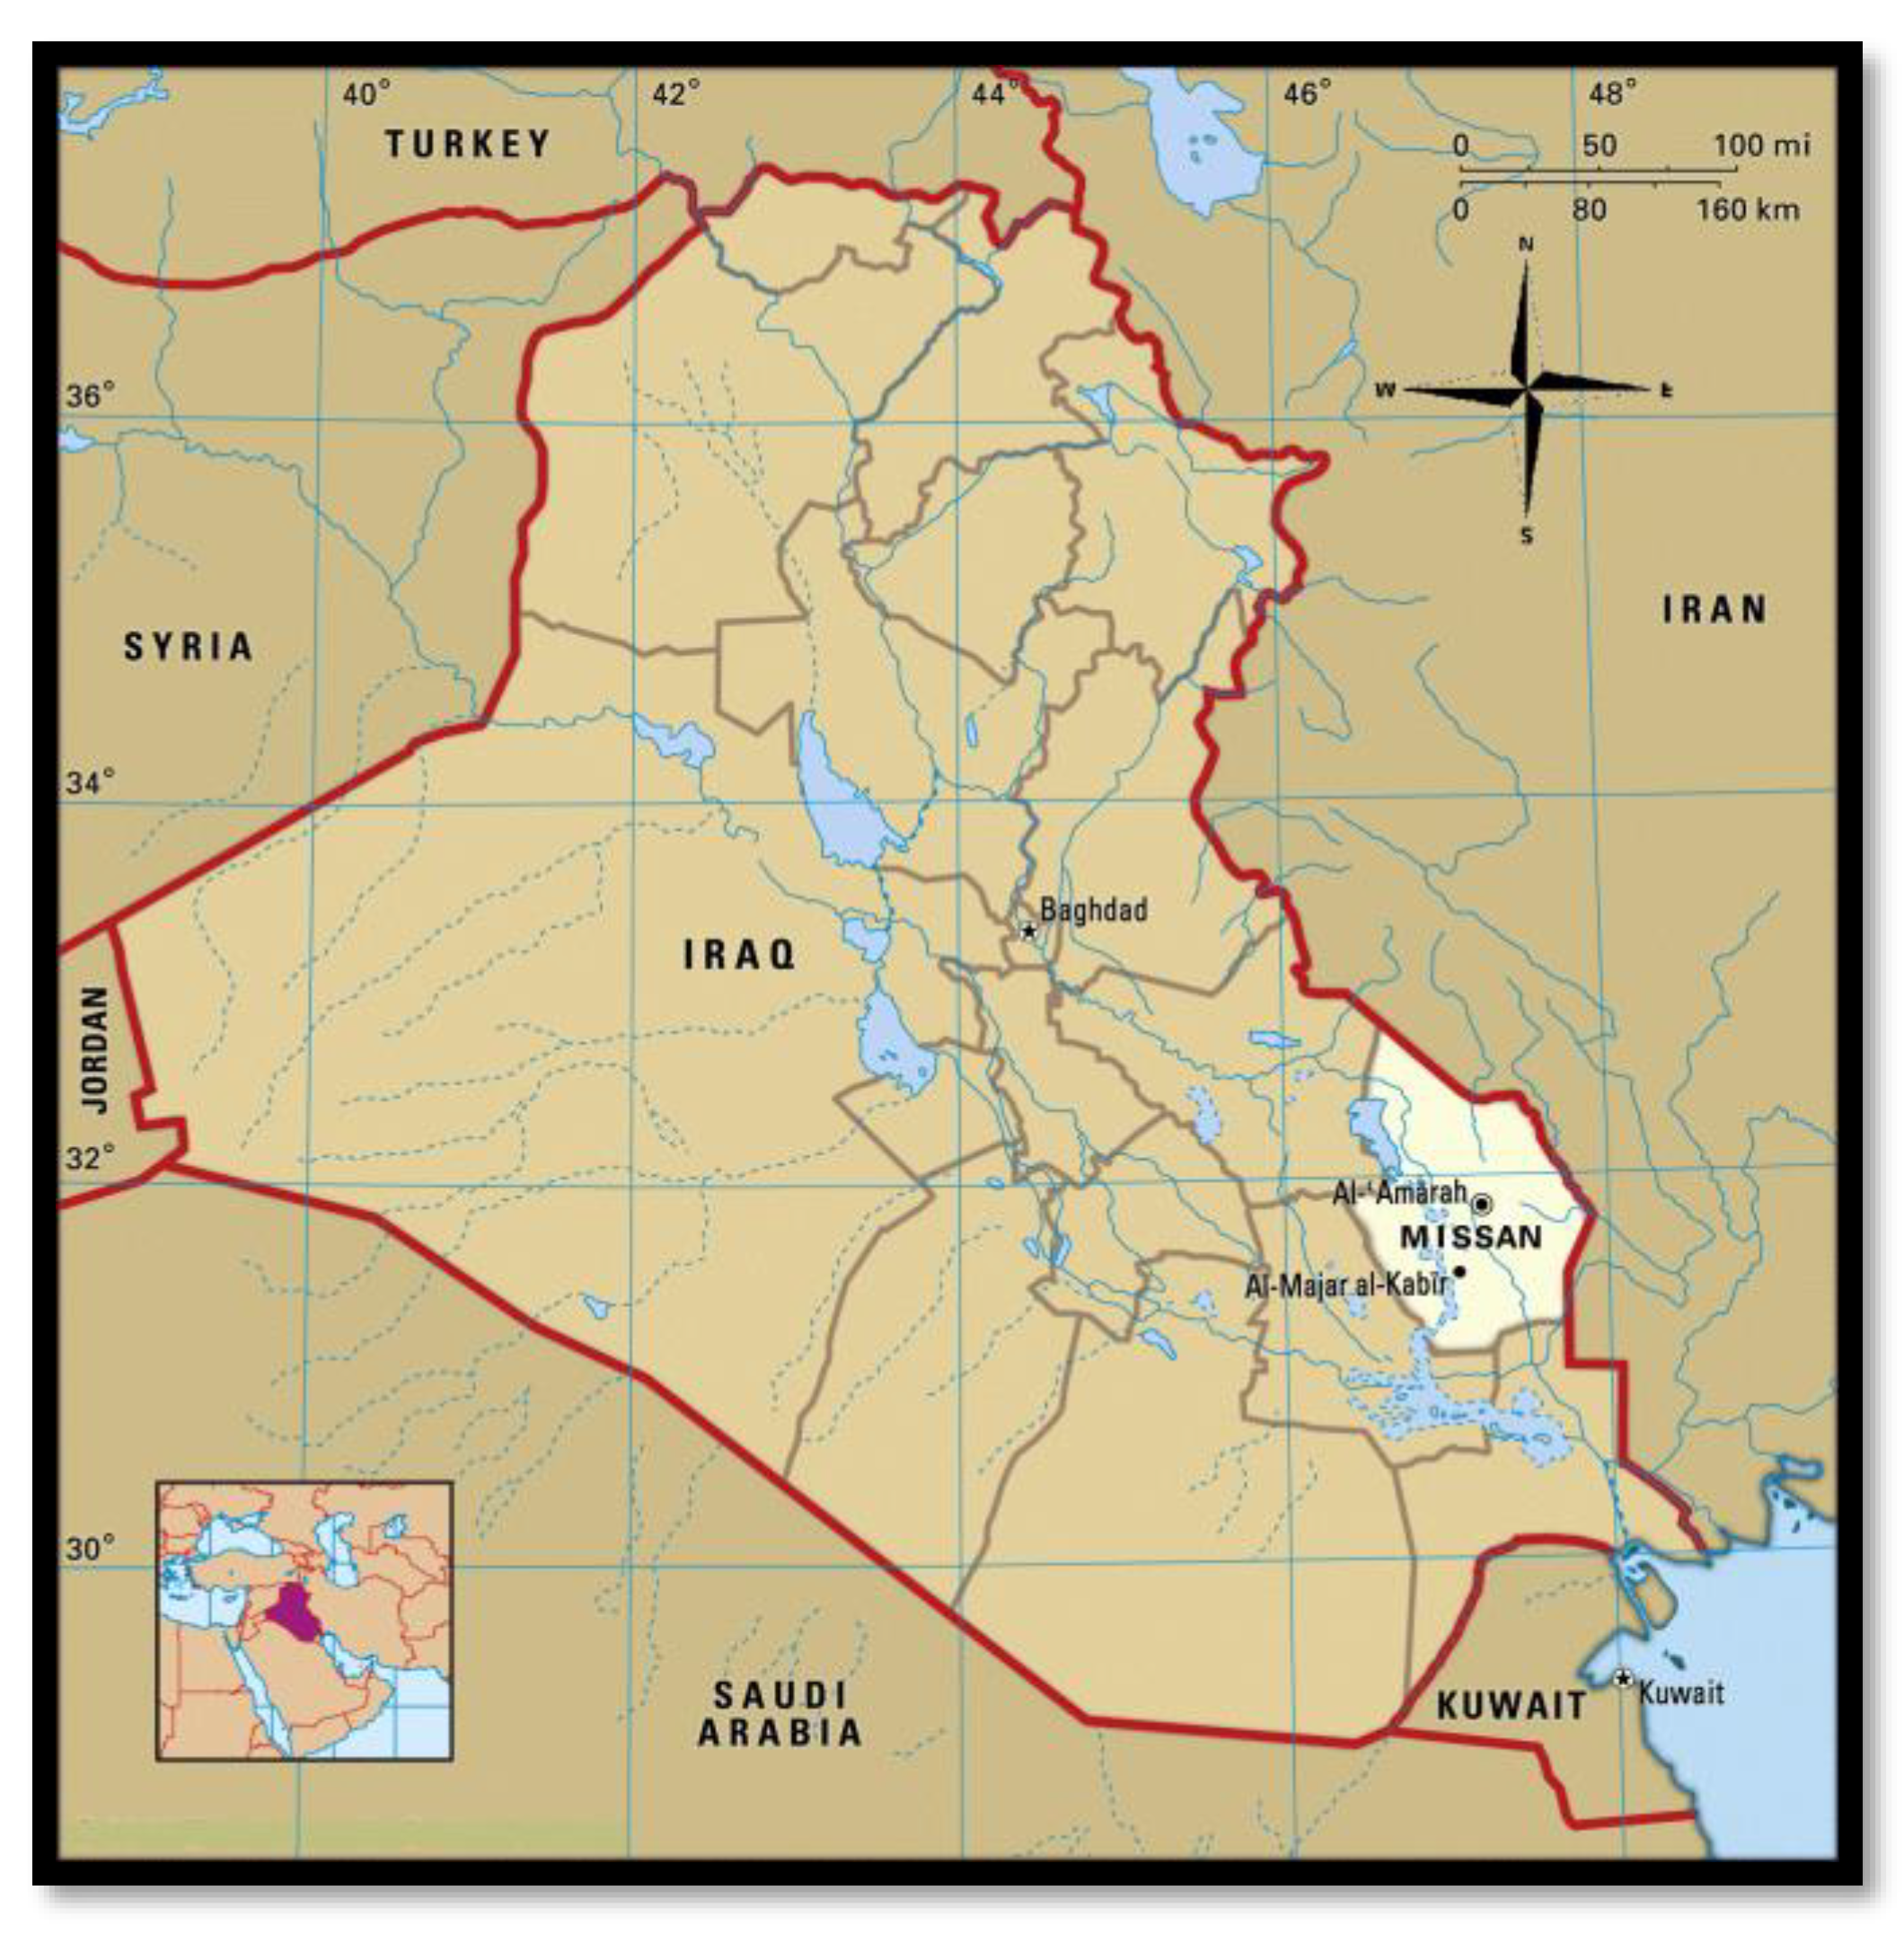
  • The study was expanded to cover a wide area of the Missan governorate;
  • The results of the current study were compared with those of other sites in Missan to validate findings across the governorate;
  • Long-term monitoring was conducted to assess how soil properties change with seasonal variations in groundwater levels;
  • Investigating the behavior of buildings due to successive earthquakes can help structural and architectural engineers design suitable buildings for the Missan environment.

Author Contributions

Data collection, D.A.-J. and R.H.S.; investigation, S.A. and R.H.S.; writing—review and editing, D.A.-J. and S.K.; review and writing—original draft preparation, L.F.A.B. and D.A.-J.; review, editing and visualization, S.A. and L.F.A.B. All authors have read and agreed to the published version of the manuscript.

Funding

This research received no external funding.

Data Availability Statement

The dataset is available upon request from the authors.

Conflicts of Interest

The authors declare that they have no conflicts of interest.

References

  1. Smith, I.; Smith, G.N. Smith’s Elements of Soil Mechanics, 8th ed.; Blackwell Science: London, UK, 2006. [Google Scholar]
  2. Adepelumi, A.A.; Olorunfemi, M.O.; Falebita, D.E.; Bayowa, O. Structural mapping of coastal plain sands using engineering geophysical technique: Lagos Nigeria case study. Nat. Sci. 2009, 1, 2–9. [Google Scholar] [CrossRef]
  3. Gelson, W.E.; Plank, G.A. The new highway bridges across the Tigris at Amara and Kut in Iraq. Proc. Inst. Civ. Eng. 1960, 16, 33–54. [Google Scholar] [CrossRef]
  4. Al-Kahdaar, R.M.; Al-Ameri, A.F.I. Correlations between physical and mechanical properties of Al-Ammarah soil in Messan governorate. J. Eng. 2010, 16, 5946–5957. [Google Scholar] [CrossRef]
  5. Salih, M.M.; Jawad, F.W.; Al-Ameri, A.F.I.; Abdulhameed, A.A. Geotechnical correlations of soil properties in Hilla City—Iraq. Open Eng. 2022, 12, 729–742. [Google Scholar] [CrossRef]
  6. Mahmood, R.A. Engineering evaluation of bearing strata at selected regions in Missan governorate/south of Iraq. Basrah J. Sci. 2014, 32, 95–117. [Google Scholar]
  7. Hossain, M.M.; Sultana, N.; Malo, R.C. Correlations between CPT, SPT and Soil Parameters for Khulna, Bangladesh; MAT Journals Pvt. Ltd.: Ghaziabad, India, 2020. [Google Scholar]
  8. Yilmaz, I. Swell potential and shear strength estimation of clays. Appl. Clay Sci. 2009, 46, 376–384. [Google Scholar] [CrossRef]
  9. Al-abboodi, I.; Hamoodi, A.Z.; Samoel, M.S. Geotechnical Evaluation of Soils in Ammarah/Central Missan, Iraq. J. Univ. Babylon Eng. Sci. 2020, 28, 73–80. [Google Scholar]
  10. Mather, B.; Etris, S.F. American society for testing and materials. In Mineralogy. Encyclopedia of Earth Science; Springer: Boston, MA, USA, 1981. [Google Scholar] [CrossRef]
  11. ISO 8502-9:2020; Part 9: Field Method for the Conductometric Determination of Water-Soluble Salts, Edition 2. International Organization for Standardization: Geneva, Switzerland, 2020; p. 7.
  12. Gaviglio, P. Longitudinal waves propagation in a limestone: The relationship between velocity and density. Rock Mech. Rock Eng. 1989, 22, 299–306. [Google Scholar] [CrossRef]
  13. Yasar, E.; Erdoga, Y. Correlating sound velocity with the density, compressive strength and Young’s modulus of carbonate rocks. Int. J. Rock Mech. Min. Sci. 2004, 41, 871–875. [Google Scholar] [CrossRef]
  14. Chawre, B. Correlations between ultrasonic pulse wave velocities and rock properties of quartz-mica schist. J. Rock Mech. Geotech. Eng. 2018, 10, 594–602. [Google Scholar] [CrossRef]
  15. Kelly, D. Seismic Site Classification for Structural Engineers. Structure 2006, 21, 21–24. [Google Scholar]
  16. FEMA. In Earthquake-Resistant Design Concepts, an Introduction to the NEHRP Recommended Seismic Provisions for New Buildings and Other Structures; National Institute of Building Sciences Building Seismic Safety Council: Washington, DC, USA, 2010; p. 749.
  17. EN 1998-1:2004; Eurocode 8: Design of Structures for Earthquake Resistance, Part 1. Enterprise Singapore: Singapore, 2013.
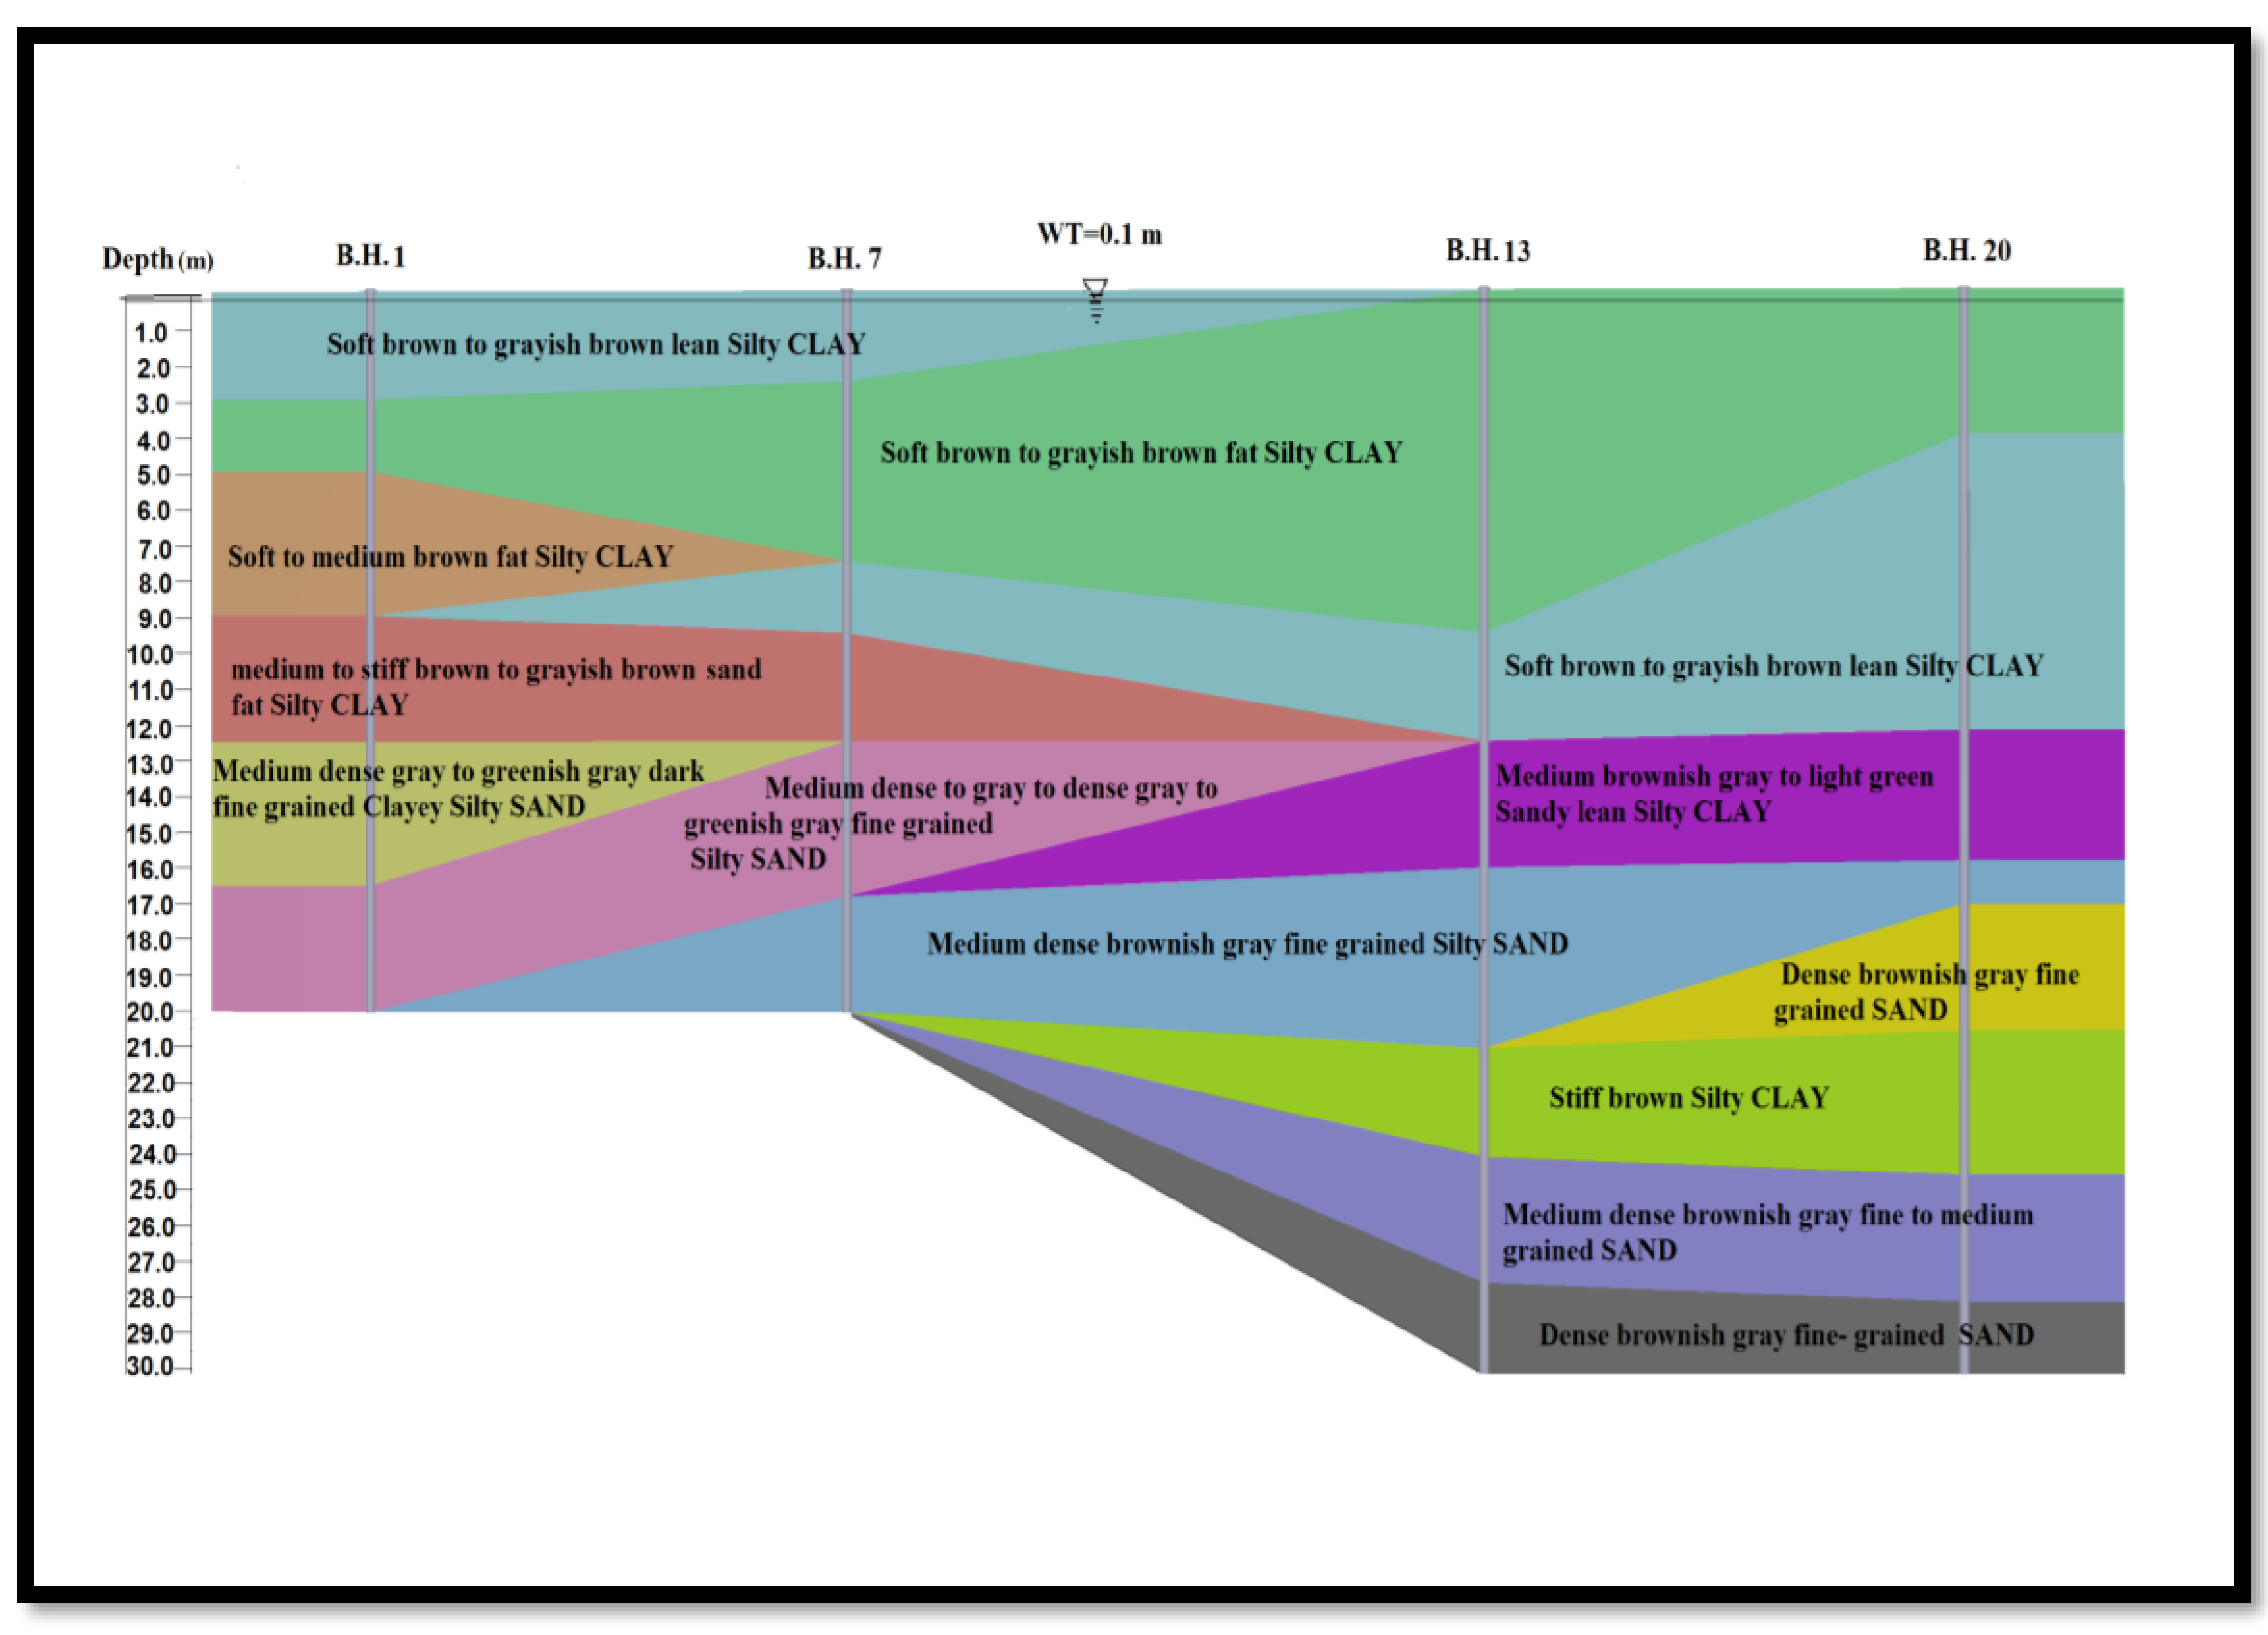
Figure 1. Iraq map representing the study area.
Civileng 05 00038 g001
Figure 2. Borehole positions within the study area.
Civileng 05 00038 g002
Figure 3. Subsurface soil layers through boreholes #1, #7, #13, and #20.
Civileng 05 00038 g003
Figure 4. Change in the SPT value with soil depth.
Civileng 05 00038 g004
Figure 5. (a) Changes in the liquid limit, (b) plastic limit, and (c) plasticity index with soil depth.
Civileng 05 00038 g005
Figure 6. (a) Changes in the compression index, (b) compression index, and (c) initial void ratio with soil depth.
Civileng 05 00038 g006
Figure 7. Single-borehole seismic method (downhole test).
Civileng 05 00038 g007
Figure 8. Shear and compressional wave velocities (Vs and Vp) with soil depth.
Civileng 05 00038 g008
Figure 9. Bulk density vs. shear and compressional wave velocities: (a) Vp and (b) Vs.
Civileng 05 00038 g009
Figure 10. The dynamic moduli with soil depth: (a) Gd, (b) Ed, and (c) Kd.
Civileng 05 00038 g010
Figure 11. Correlation of SPT (N value) vs. cohesion C (kPa).
Civileng 05 00038 g011
Figure 12. Correlation of the PI % vs. cohesion C (kPa).
Civileng 05 00038 g012
Figure 13. Correlation of void ratio e0 vs. compression index Cc.
Civileng 05 00038 g013
Figure 14. The correlation of the density, γ, with the dynamic modulus of elasticity Ed.
Civileng 05 00038 g014
Figure 15. The correlation of density, γ, with compression wave velocity, Vp.
Civileng 05 00038 g015
Figure 16. Correlation of density, γ, vs. shear wave velocity, vs.
Civileng 05 00038 g016
Table 1. Soil layer descriptions for borehole No. 35.
No. of Layers #Depth (m)Description
10.0–5.0Very soft brown fat silty clay with occasional shiny spots of soluble salts and black traces of organic matter together with gray fine-grained sand pockets.
25.0–8.0Soft grayish-brown lean silty clay with occasional shiny spots of soluble salts and black traces of organic materials.
38.0–10.5Very soft to soft brown fat silty clay with rare black traces of organic matter and gray fine- to medium-grained sand pockets in parts.
410.5–13.5Medium to stiff silty clay with rare black spots of organic material.
513.5–15.0Medium-dense brownish-gray to greenish-gray grained clayey silty sand mixture.
615.0–19.5Medium-dense greenish-dark-gray fine-grained silty sand with little clay fraction at bottom.
719.5–24.0Medium to stiff silty clay with rare tiny pieces of marine shells and black spots of organic material together
824.0–26.0Medium-dense brownish dark gray fine-grained silty sand with rare rusty spots of iron oxide compounds.
926.0–30.0Dense dark gray fine-grained silty sand with a number of spots of iron oxide compounds.
1030.0–33.0Very stiff grayish-brown fat silty clay with rare tiny pieces of marine shells and occasional gray fine-grained sand pockets
1133.0–35.0Dense grayish-brown to grayish dark green fine-grained clayey silty sand mixture.
1235.0–38.0Very dense grayish dark green fine-grained silty sand with little clay fraction at top and a number of spots of iron oxide compounds
1338.0–41.5Dense grayish dark green fine- to medium-grained silty sand.
1441.5–45.0Very dense grayish dark green fine- to medium-grained silty sand with little rusty spots of iron oxide compounds.
Table 2. Physical properties of the study area.
SamplesIndex PropertiesNatural Water Content%Dry Density KN/m3Specific Gravity
B.H.#Depth (m)Sample TypeLL%PL%PI%
13–3.5US51203127.214.52.72
6–6.5US54223230.314.12.71
33–3.5US46212528.114.32.71
6–6.5US38172129.114.92.70
9–9.5US41182328.314.52.71
73–3.5US52193328.414.22.71
6–6.5US55213429.2142.72
9–9.5US38211731.613.82.70
93–3.5US48232527.814.62.71
6–6.5US52232932.113.92.72
9–9.5US57223526.514.82.72
133–3.5US53203330.113.92.72
6.5–7US51193227.214.42.71
10–10.5US52203231.613.72.71
13–13.5DS39172229.6 2.70
24–24.5DS55213429.8 2.72
153–3.5US57233427.614.52.72
193–3.5US48202828.714.82.70
6–6.5US49212827.615.12.70
9–9.5US49202929.814.72.69
201.5–2.0DS53213227.5 2.72
4.5–5.0DS47192829.6 2.70
8–8.5DS46202628.2 2.70
213–3.5US51203131.513.92.72
10.5–11US46192728.814.22.70
21–21.5DS60243628.2
231.5–2DS47212629.8
317.5–8DS48202826.6 2.72
324.5–5DS52213134.6 2.72
7.5–8DS48202826.6 2.71
22.5–23DSNon-Plastic24.5 2.66
36–36.5DSNon-Plastic23.8 2.66
37.5–38DS68303826.3
452.5–3US58213726.415.62.72
8.5–9US68303833.214.12.71
11.5–12US49202929.814.42.69
19.5–20US36251131.314.02.68
4815–15.5US53213233.813.62.71
525.5–6US61243728.215.02.72
12.5–13DS61243726.6
5623–23.5DS52213124.8 2.71
26–26.5DS48202823.2 2.69
627–7.5US56213532.113.92.72
6714.5–15DS57213626.6
SamplesStrength TestConsolidation CharacteristicsSieve Analysis % Passing No. 200
B.H.#Triaxial CompressionDirect SheareoPcCcCr
Cohesion
(kPa)
Friction
Angle
Cohesion
(kPa)
Friction
Angle
122240.9281200.270.04996.3
365.5°0.9641350.290.05197.4
320210.9731200.230.04195.5
23200.9181300.260.03896.8
18220.8981400.340.03596.2
7 231.1041100.310.06296.4
290.9771150.280.05798.1
300.9061150.250.03780.8
924221.5°0.9881000.230.03997.1
220.9281200.290.02998.0
280.8671350.260.03697.4
1317150.5°1.0811000.310.05397.1
23210.9761250.280.04996.6
22240.8221300.170.04598.0
1518210.9071100.210.05195.1
19 240.8701100.220.05195.6
270.8041150.170.04398.1
344.5°0.7781250.180.03297.9
20
211191.0761050.420.04898.1
370.5°350.8811350.240.03779.8
23 93.8
31 95.7
32
19.8
4531290.8411300.430.06994.7
22181.1861600.390.05196.5
190.9871750.260.03996.7
3111°0.9382200.180.02670.4
48 4311°0.7431900.240.04154.2
5216180.9341300.310.04694.7
420.8071650.280.05592.2
56
74.1
6221220.8921200.240.04698.3
67 97.2
Table 3. Chemical properties of the study area.
Location of SpecimenChemical Test
B.H.#Depth (m)Sample TypeSulphate Content as SO3 for SoilAmount of Soluble Salt Content (TSS)%Organic Matter Content (OM)%PH
11.5–2DS0.130.525.188.0
7.5–8DS0.150.416.138.1
12–12.5DS0.341.063.447.9
18–18.5DS0.310.961.187.9
154.5–5DS2.2116.95.337.6
18.5–19DS0.943.621.817.9
203–3.5DS0.220.682.718.1
409–9.5DS0.371.193.727.9
15–15.5DS0.511.815.187.9
27–27.5DS0.110.623.228.1
657–7.5DS0.341.161.627.9
19.5–20DS0.411.882.747.8
25–25.5DS0.431.922.087.8
30–30.5DS0.371.791.557.9
Table 4. Parameter symbols and standard units.
SymbolMeaningUnit
VsShear wave velocitym/s
VpCompression wave velocitym/s
EdDynamic modulus of elasticityMPa
GdDynamic shear modulusMPa
KdBulk modulusMPa
υPoisson’s ratio-
Table 5. Seismic parameters of the study area.
No.B.H. #Depth
(m)
Soil TypeWT
(m)
γ
(kN/m3)
Vp
(m/s)
Vs
(m/s)
νGd
(MPa)
Ed
(MPa)
Kd
(MPa)
1.160–3.5Gray to medium-brown, soft fat silty clay with little gray bands of fine sand.0.116.84071000.4717.0850.15261.6
3.5–6.5Medium-brown lean silty clay with occasional gray fine-grained sand pockets.17.15641520.4740.01116.8497.3
6.5–13.5Medium-to-stiff, grayish-brown to brown-colored fat silty clay with cavities of gray, fine-grained sand.17.57532160.4683.32242.16906.95
13.5–18.5Medium-dense brownish-gray to brownish green fine-grained silty sand.17.99422410.47105.81327.361474.2
18.5–21Brownish-gray that is stiff to very stiff fatty sandy silty clay.18.612193040.47173.18507.92522.9
21–24Very stiff grayish-brown fat silty clay with gray fine-grained sand pockets.18.613073320.47206.46604.892913.5
24–29Dense brownish-gray to brownish green fine-grained silty sand.18.714173940.46293.52684.113400.7
29–30Dense brownish-gray fine-grained clayey silty sand mixture.18.713483810.46273.60796.793038.4
2.300–2Soft brown lean silty clay.0.116.7371970.4615.9546.6210.01
2–8Clay that is light brown with a lean aspect, fine-grained sand lines.175151440.4636.5106.43418.26
8–11Medium-brown to grayish-brown fat silty clay with rare greenish-gray fine-grained sand pockets.17.47191910.4664.76189.35824.07
11–13.5Medium to stiff grayish-green lean silty clay with a few greenish-gray fine-grained sand pockets.17.78412300.4693.5272.871197
13.5–16.5Medium-dense dark gray fine-grained sand with little silt fraction.17.99872540.46116.76342.021612
16.5–19.5Very stiff brown sandy lean silty clay.189892950.45157.8457.841550.6
19.5–22.5Very dense gray to yellowish-gray fine-grained clayey silty sand.18.110803090.46174.8508.541891.4
22.5–25.5Very stiff light gray to brownish-gray lean silty clay gray fine-grained sand pockets lines.18.211323340.45205.3596.352076.7
25.5–28.5Dense gray to dark gray fine-grained silty sand.18.110753640.43242694.441780.4
28.5–30Very dense gray to dark gray fine-grained silty sand.18.412233520.45229666.852460.4
3.360–2Soft brown lean silty clay.0.116.73611040.4518.0752.57196.3
2–5Soft to medium-brown lean silty clay, with rare greenish-gray fine-grained sand pockets.16.94501210.4624.8672.62313.96
5–9Grayish-brown to medium-brown, soft fat silty clay.17.15711410.4634.6101.67516.7
9–15Medium-brown to grayish-brown lean silty clay and rare gray fine-grained sand.17.57741990.4670.75207.06965.48
15–18Medium-dense gray to brownish-gray fine-grained clayey silty sand.17.89132550.46116.8340.31331.8
18–20Dense yellowish-green to green fine-grained silty sand.1810122950.46158459.11639.2
20–24Very stiff brown lean silty clay.18.311683380.45210.6612.42233.6
24–25.5Dense yellowish-gray to brownish-gray fine-grained clayey silty sand.18.412223650.45246.33714.812427.2
25.5–28.5Dense gray to yellowish-gray fine-grained silty sand with little brownish-gray pockets that are silty clayey in parts.18.512963980.45295.5855.12746.4
28.5–30Fine-grained clayey sand with a dense gray to brownish-gray color.18.512654020.45302871.32565.8
Table 6. Site class and ground type classification.
No.B.H.#Vs,30
(m/s)
FEMA 2010Eurocode 8, 2004
Site ClassGeneral DescriptionGround ConditionDescription of Stratigraphic Profile
11659ESoft clay soilDDeposits of loose-to-medium cohesionless or of predominantly soft-to-firm cohesive soil.
23050ED
33651ED
Disclaimer/Publisher’s Note: The statements, opinions and data contained in all publications are solely those of the individual author(s) and contributor(s) and not of MDPI and/or the editor(s). MDPI and/or the editor(s) disclaim responsibility for any injury to people or property resulting from any ideas, methods, instructions or products referred to in the content.

