Article

Carbon Fiber-Reinforced Polymer Composites Integrated Beam–Column Joints with Improved Strength Performance against Seismic Events: Numerical Model Simulation

by
Noor Alhuda Sami Aljabbri
*,
Abdulamir Atalla Karim
and
Fareed Hameed Majeed
Department of Civil Engineering, Faculty of Engineering, University of Basrah, Basrah 61004, Iraq
*
Author to whom correspondence should be addressed.
Eng 2024, 5(2), 1112-1139; https://doi.org/10.3390/eng5020061
Submission received: 11 May 2024 / Revised: 7 June 2024 / Accepted: 11 June 2024 / Published: 14 June 2024

Abstract

:
Strength enhancement of non-seismic concrete beam–column joints (NSCBCJs) via carbon fiber-reinforced polymer composites (CFRPCs) integration has become a viable strategy. However, the implementation of these NSCBCJs without transverse reinforcement shows poor performance during earthquakes in seismic locations. Thus, strengthening the anti-seismic performance of NSCBCJs to meet the acceptance criteria of ACI 374.1-05 is fundamentally significant. Yet, in addition to limited experimental results, only a few numerical studies based on the finite element model have been performed to determine the anti-seismic behavior of NSCBCJs. Consequently, the stress contribution of CFRPCs to NSCBCJs is not clearly understood. Therefore, we used a finite element model to examine the strength contribution of CFRPCs to NSCBCJs. The performance of the proposed finite element model was validated using the experimental results, demonstrating a good agreement between them. It was shown that the strength of NSCBCJs was improved due to CFRPC incorporation, thereby achieving compliance with the seismic requirements of ACI 374.1-05. In addition, CFRPCs presence could enhance the confinement, reduce the deformation of the NSCBCJs and, thus, decrease their stiffness and strength degradation, while simultaneously improving the energy dissipation.

1. Introduction

In the context of construction technology, the term “strengthening” refers to the retrofit, rehabilitation, and repair of building materials. In retrofitting, the structural components are installed with the goal of improving their overall performance in terms of shear, flexural, and compressive strength [1,2,3]. This improvement in the structural integrity becomes more significant than the initial performance. Rehabilitation is the process of reparation and restoration of the performance and strength lost in the structures under varied situations [4,5,6,7]. In the repairing process, the structural members’ quality are improved to meet the desired requirements. Over the decades, numerous experimental and analytical studies have been conducted to gain an in-depth understanding regarding the behavior of beam-to-column joints (BCJs). In the reinforced concrete structures, the critical zones are identified at the BCJ wherein the vertical and lateral loads meet and are transferred to the footing [8,9,10]. Consequently, the risk of failure at the joints is much higher compared to other structural components. During an earthquake, the plastic hinge mechanism (PHM) can potentially occur near the joints. Essentially, BCJs are a segment of columns shared by the beams at their intersections in reinforced concrete buildings [11,12,13]. Needless to say that with the increase in the frequency of earthquakes worldwide, the sustainability of building structures in the civil engineering sectors has become a major concern unless steps are taken to inhibit this damage. It has been realized that the implementation of stable and durable BCJs with high performance is essential in the construction process [14]. To determine the legitimacy of such joints, in-depth experimental, analytical, and numerical modelling and simulation studies are vital.
In recent years, many details of the BCJs have been examined to protect the BCJs from failure during seismic vibration. In this regard, impacts of several critical factors, such as the degree of steel reinforcement in various types of concretes [15], changes in the longitudinal reinforcement [16] and shear reinforcement [17,18,19,20], and the use of rebar at different diameters [21] on the BCJs were evaluated. It is established that diverse strengthening methods, like the incorporation of different carbon fiber sheets (CFRP and glass fiber-reinforced polymer (GFRP)) [22,23,24], steel plate jacketing [25], and external post-tension rods [26], can effectively be used to improve the anti-seismic behavior of BCJs. The results of several experimental and theoretical studies on the BCJs concerning influencing factors and strengthening methods have significantly contributed towards their anti-seismic performance.
The concept of using fiber-reinforced polymer (FRP) confinement involves bonding the FRP to the concrete surface with a bonding agent, such as epoxy resin. This bond allows the FRP and concrete to function as a composite structure, enhancing the BCJs’ seismic performance when properly designed and constructed [27,28]. FRP is an anisotropic material with superior engineering properties along the direction of the reinforcing fiber, but it is weak in the transverse direction. Therefore, it is highly recommended to confine the structure in the principal fiber direction of the FRP [29,30,31]. The application process of FRP begins with cleaning the concrete surface, applying a layer of primer and epoxy, and then laying up the FRP sheets with epoxy until the required number of layers is achieved. A variety of FRP materials have been used to retrofit BCJs, including CFRP [32,33,34], GFRP [35,36], aramid fiber-reinforced polymer [37], basalt fiber-reinforced polymer (BFRP) [38], FRP hybrid composites [39], quasi-isotropic laminates [40], and sprayed FRP [41]. Among these composite materials, CFRP is the most common due to its superior mechanical properties [42].
The application of CFRP has become a recognized method for strengthening or rehabilitating existing reinforced concrete elements (RCEs). Many studies have reported the excellent efficacy of CFRP in enhancing the flexural performance of RC beams under monotonic loading [29,43,44]. The main elements of the CFRP-concrete bonded system used for external reinforcement of RC structures include CFRP dry fiber sheets, adhesive, and anchors when necessary [45]. It is generally assumed that complete composite action occurs between the concrete elements, like beams, and the CFRP materials. However, the bonding quality relies heavily on the shear stiffness and strength of the adhesive, which must be sufficient to transfer shear forces between the CFRP and the concrete substrate [46,47,48]. Furthermore, the bond quality is notably affected by the properties of the concrete and the preparation of the surface.
In study conducted by Laseima et al. [49], the authors have been examined the seismic behavior of exterior RC-BCJs strengthened with CFRP. From the obtained results and compared to control specimens, the authors reported that the strengthened system improved by 62%, 209%, and 61.9% in terms of strength, energy dissipation, and ductility, respectively. In [50], the authors examined the impact of using CFRP with different anchors on the seismic performance of RC-BCJs assemblies. The results showed that the ultimate load-carrying capacity increased by between 19 and 43.6%, depending on the anchoring configurations, compared to the control specimens. Additionally, all strengthened specimens demonstrated greater total energy dissipation and damping ratios than the control specimens.
In a recent study conducted by Karayannis and Golias [51], the authors investigated full-scale RC-BCJs that were externally reinforced with CFRP ropes. The joints were strengthened using X-shaped ropes, either singly or doubly, on each side of the joint, while single or double straight ropes were applied to each side of the beam. The strengthened specimens demonstrated an improved hysteretic response compared to the unstrengthened ones. Enhancements were observed in maximum loads per loading step, stiffness, and energy dissipation. The maximum strength of the reinforced samples increased by 20% to 57%, depending on the number of CFRP ropes used.
In experiments conducted by Lim et al. [52], four RC-BCJs were retrofitted utilizing two different techniques involving CFRP grids covered with engineered cementitious composite materials and high-strength mortar. The dimensions of the retrofitted specimens were preserved by removing the concrete cover of the joint and applying a cementitious matrix. The results showed that the failure mode of the specimens could be modified by redistributing the load concentration from the joint to the beam. Additionally, the overall performance of the specimens in terms of strength improved, exhibiting greater ductility and, therefore, delaying failure.
For instance, Atari et al. [53] strengthened ten BCJs through different types of fibers and evaluated their influence on the ductility, durability, strength performance, and energy dissipation capacity against earthquakes. Golias et al. [54] examined six external joints subjected to seismic loads, where three of them were strengthened with carbon fiber ropes of different shapes. In addition, Mady et al. [55] designed five T-shaped joints to withstand seismic loads wherein the effects of some vital factors, like the details of the reinforcement with carbon fiber GFRP in strengthening the performance were determined. Bsisu and Hiari et al. [56] theoretically studied the behavior and strength of CFRPG-reinforced joints to examine the feasibility of improving their performance against seismic loading. Ercan et al. [57] used four different strengthening patterns for the joints to examine their anti-seismic response. These joints were strengthened from the inside by changing the reinforcement details and from the outside with carbon fiber CFRPCs.
In early structural designs, the significance of BCJs is frequently overlooked, making the retrofitting of these joints crucial for structural stability. Over time, external confinement has proven to be one of the most effective retrofit methods. Nevertheless, its practical application is hindered by several factors, such as the absence of comprehensive guidelines for analysis, design, and confinement schemes. Few studies have examined the seismic performance of reinforced concrete structures enhanced with carbon fiber-reinforced polymers.
Considering the basic significance of and applied interest in high-performance CBCJs, we performed a numerical study to determine the possibility of strengthening NSCBCJs by integrating CFRPCs. The results obtained from the numerical model simulation were compared with the state-of-the-art experimental findings available in the literature. In addition, more details about the selected specimens and evaluation methods are presented. The results revealed NSCBCJ strength enhancement because of CFRPC integration, fulfilling the compliance with the seismic requirements standard ACI 374.1-05.

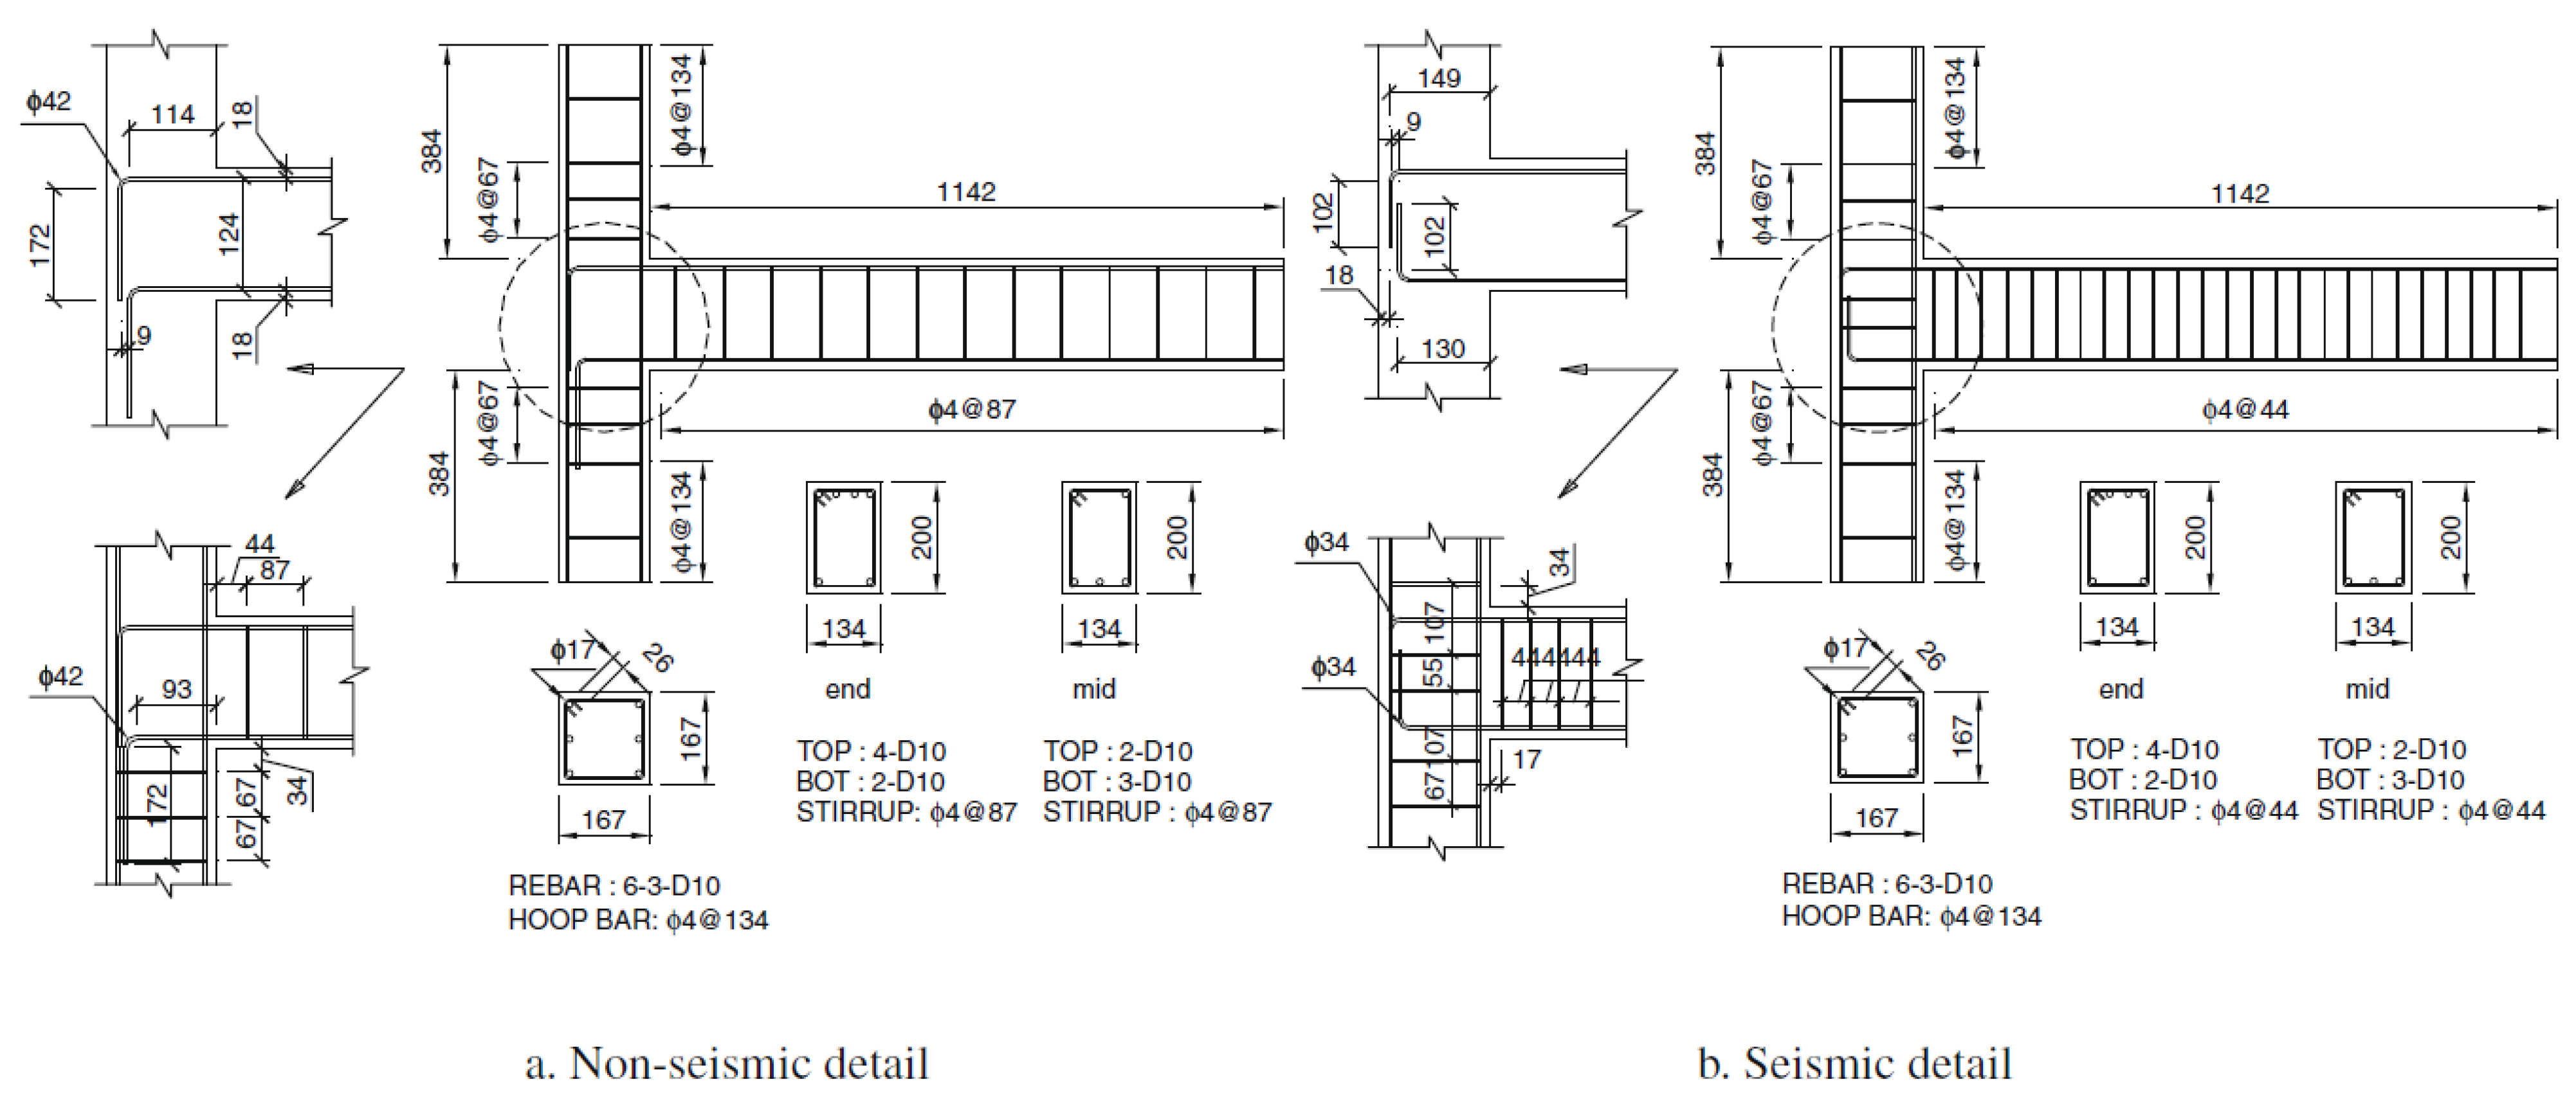
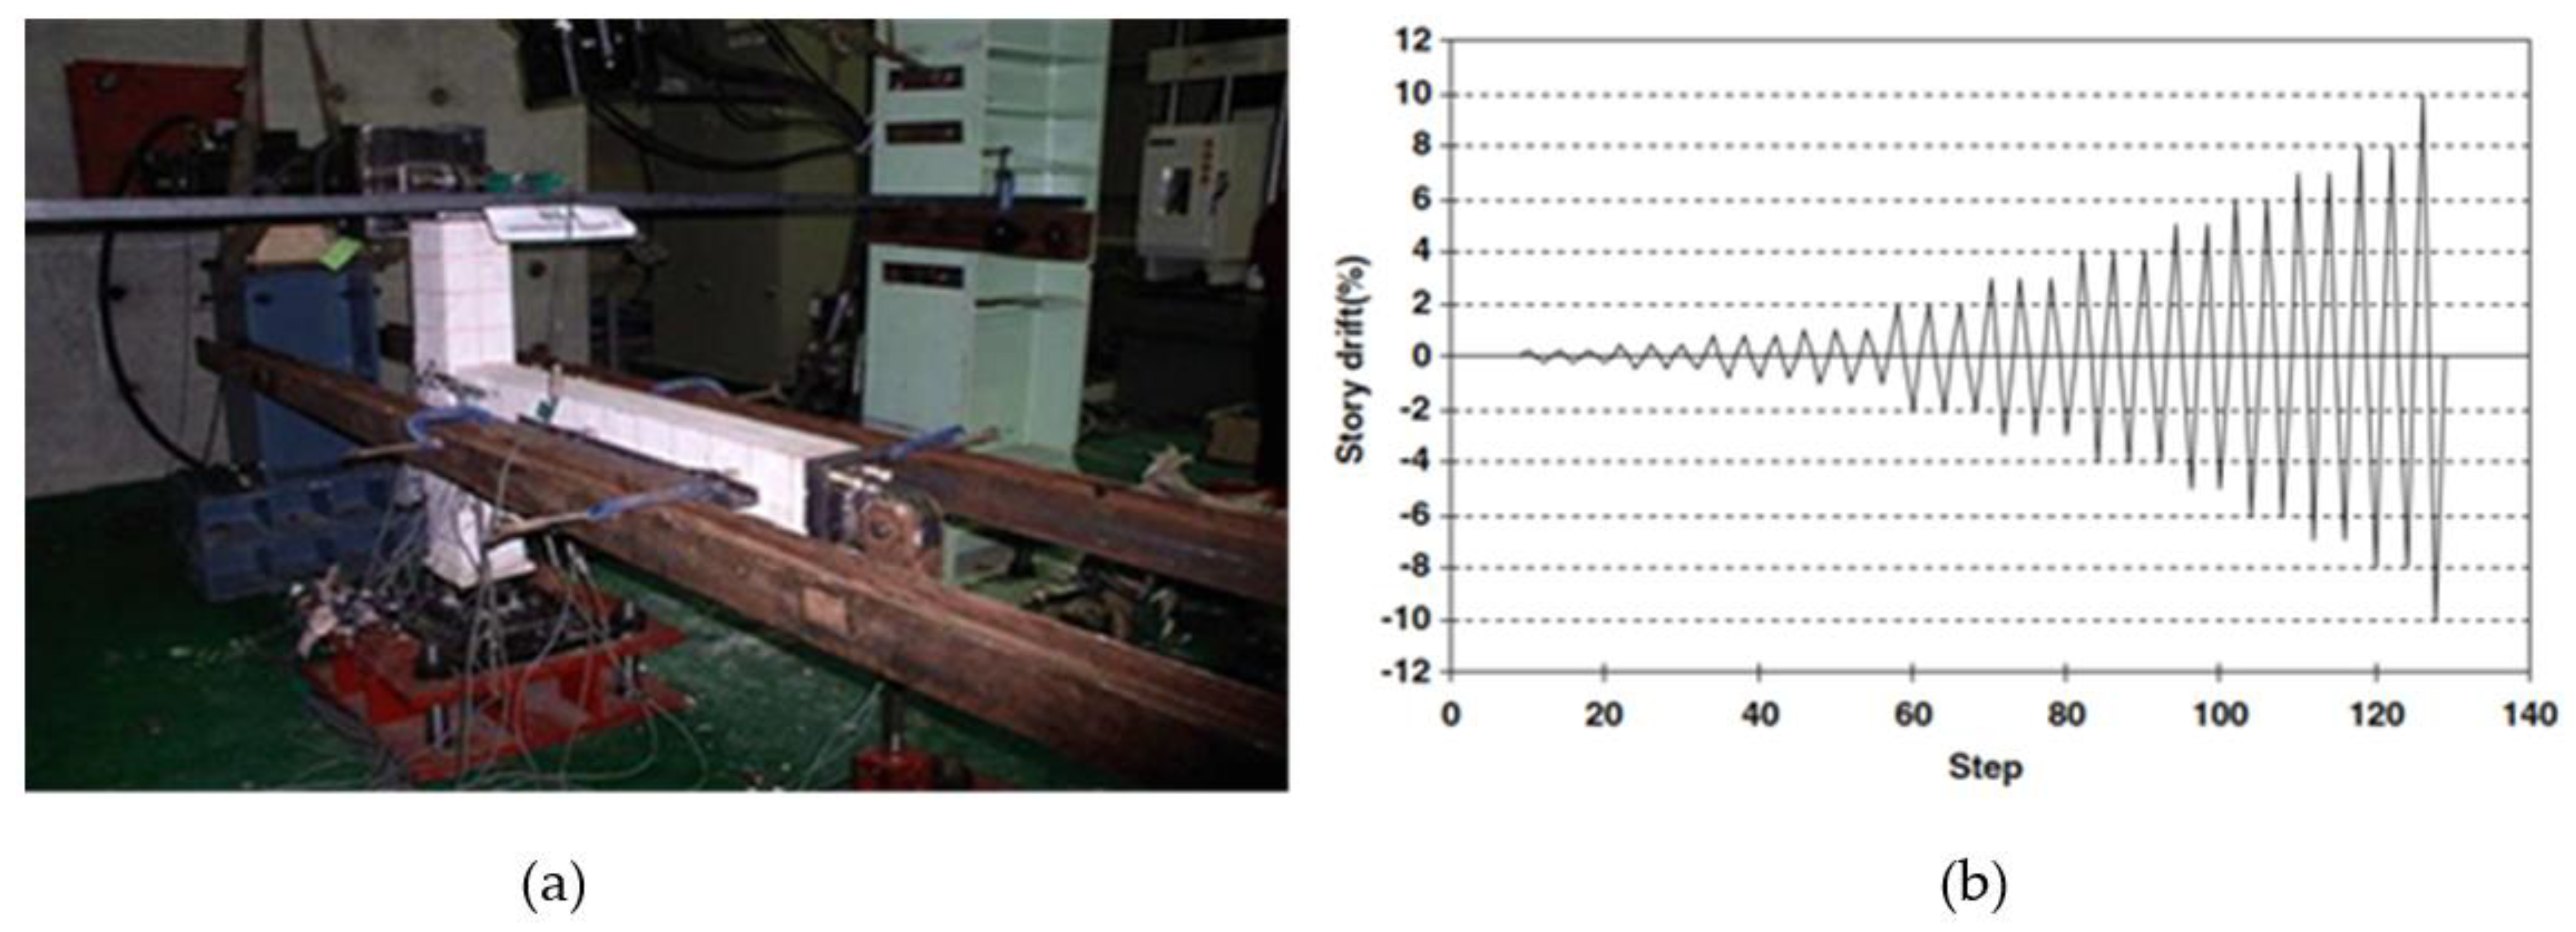
2. Experimental Work

Following the recommendation of Trung et al. [58], this work selected four concrete specimens to examine the anti-seismic behavior of the proposed NSCBCJ-integrated CBCJs. The first specimen was designed using non-seismic details. The second specimen was made based on the first specimen details of CFRPC to strengthen the joint, beam area, and volume adjacent to the joint. Those specimens had identical dimensions and degrees of reinforcement. Figure 1 illustrates the reinforcement details of specimens for the non-seismic (NS) and seismic design (SD). The designed specimens (NS and SD) had identical dimensions and the same number of longitudinal reinforcements. The NS specimen differed from the SD specimen in that it lacked transverse reinforcements in the beam–column joint region, had relatively large stirrup spacing in the beam, and featured down-bending anchorage of beam bars away from the joints. In contrast, the SD specimen was designed to meet the requirements for an intermediate moment frame as specified by the ACI 318-02 code [59], which included confinement reinforcement in the beam–column joint region and relatively small stirrup spacing in the beam. Comparing the behaviors of these two specimens under cyclic loading can reveal the impact of adequate transverse reinforcement on the shear capacity and ductility of the joints. Figure 2a shows the experimental design for testing the specimens. The joint supports were fixed to the columns and beams at both ends to indicate the inflection points in the element’s central span. Next, the joint support was attached under the column to the strong floor. The roller support was connected at the end of the beam to enable rotation and longitudinal movements only. In contrast, the column base was connected to a hinge support. The load on the specimens (at the end of the column) was applied using a 500 kN actuator. The cyclic load test was conducted under displacement control, as described by Trung [58] in the figure below (Figure 2b). A displacement-controlled quasi-static analysis was performed in ABAQUS using the dynamic implicit method, which is optimal for simulating the nonlinear behavior of beam–column joints. The default full Newton solving algorithm was utilized. The mesh was refined to increase node points, ensuring a reasonable mesh density in the joint areas with an acceptable aspect ratio of the elements. The two materials shared the same nodes because the steel reinforcing truss element was connected between the nodes of each concrete element to create an embedded bond. The embedded bond assumption used in the structural modeling did not result in significant errors in the predicted load and displacement response. In the CFRP specimen, full contact was simulated at the interface between the CFRP shell elements and the solid concrete elements.

3. Model Simulation Using Abacus

3.1. Element Type

The steel reinforcing bar and concrete are the two main components of any reinforced CBCJs. Moreover, the key components of the retrofitted CBCJs are the concrete, steel reinforcement bars, and external CFRP sheet. To introduce a realistic model under cyclic force, it is necessary to accurately replicate the real material characteristics of every component. The ABAQUS 19 library (computer software, user’s manual, Providence, RI, Rising Sun Mills) offers effective material models for three-dimensional (3D) continuum elements that can simulate the actual behavior of each component with acceptable accuracy. Using three different element types, including solid, shell, and link, various geometries were modeled. We used a 3D eight-node linear brick element with reduced integration and hourglass control (C3D8R) for the solid section, like concrete (Figure 3a). The linear brick components were chosen because they can be utilized with contact, unlike the quadratic brick elements that require more time to compute the constant nodal loads over the surface. The truss elements T3D2 (Figure 3b) used for the steel bars were embedded in the concrete. The discrete reinforcement bars in the CBCJ are modeled as T3D2 elements. Four-node, doubly curved, linear, three-dimensional general-purpose shell elements with decreased integration and hourglass control (S4R5) were used in the CFRP plate (Figure 3c). Since the nodes of a conventional shell element are situated in a well-defined planar dimension, the thickness of this shell element can be determined by the section properties. The conventional shell elements are regarded to be more accurate in contact modelling than continuum shell elements because they can measure strain or slip without affecting the thickness of the CFRP composite plates. Furthermore, the conventional shell elements have exceptional computational efficiency.

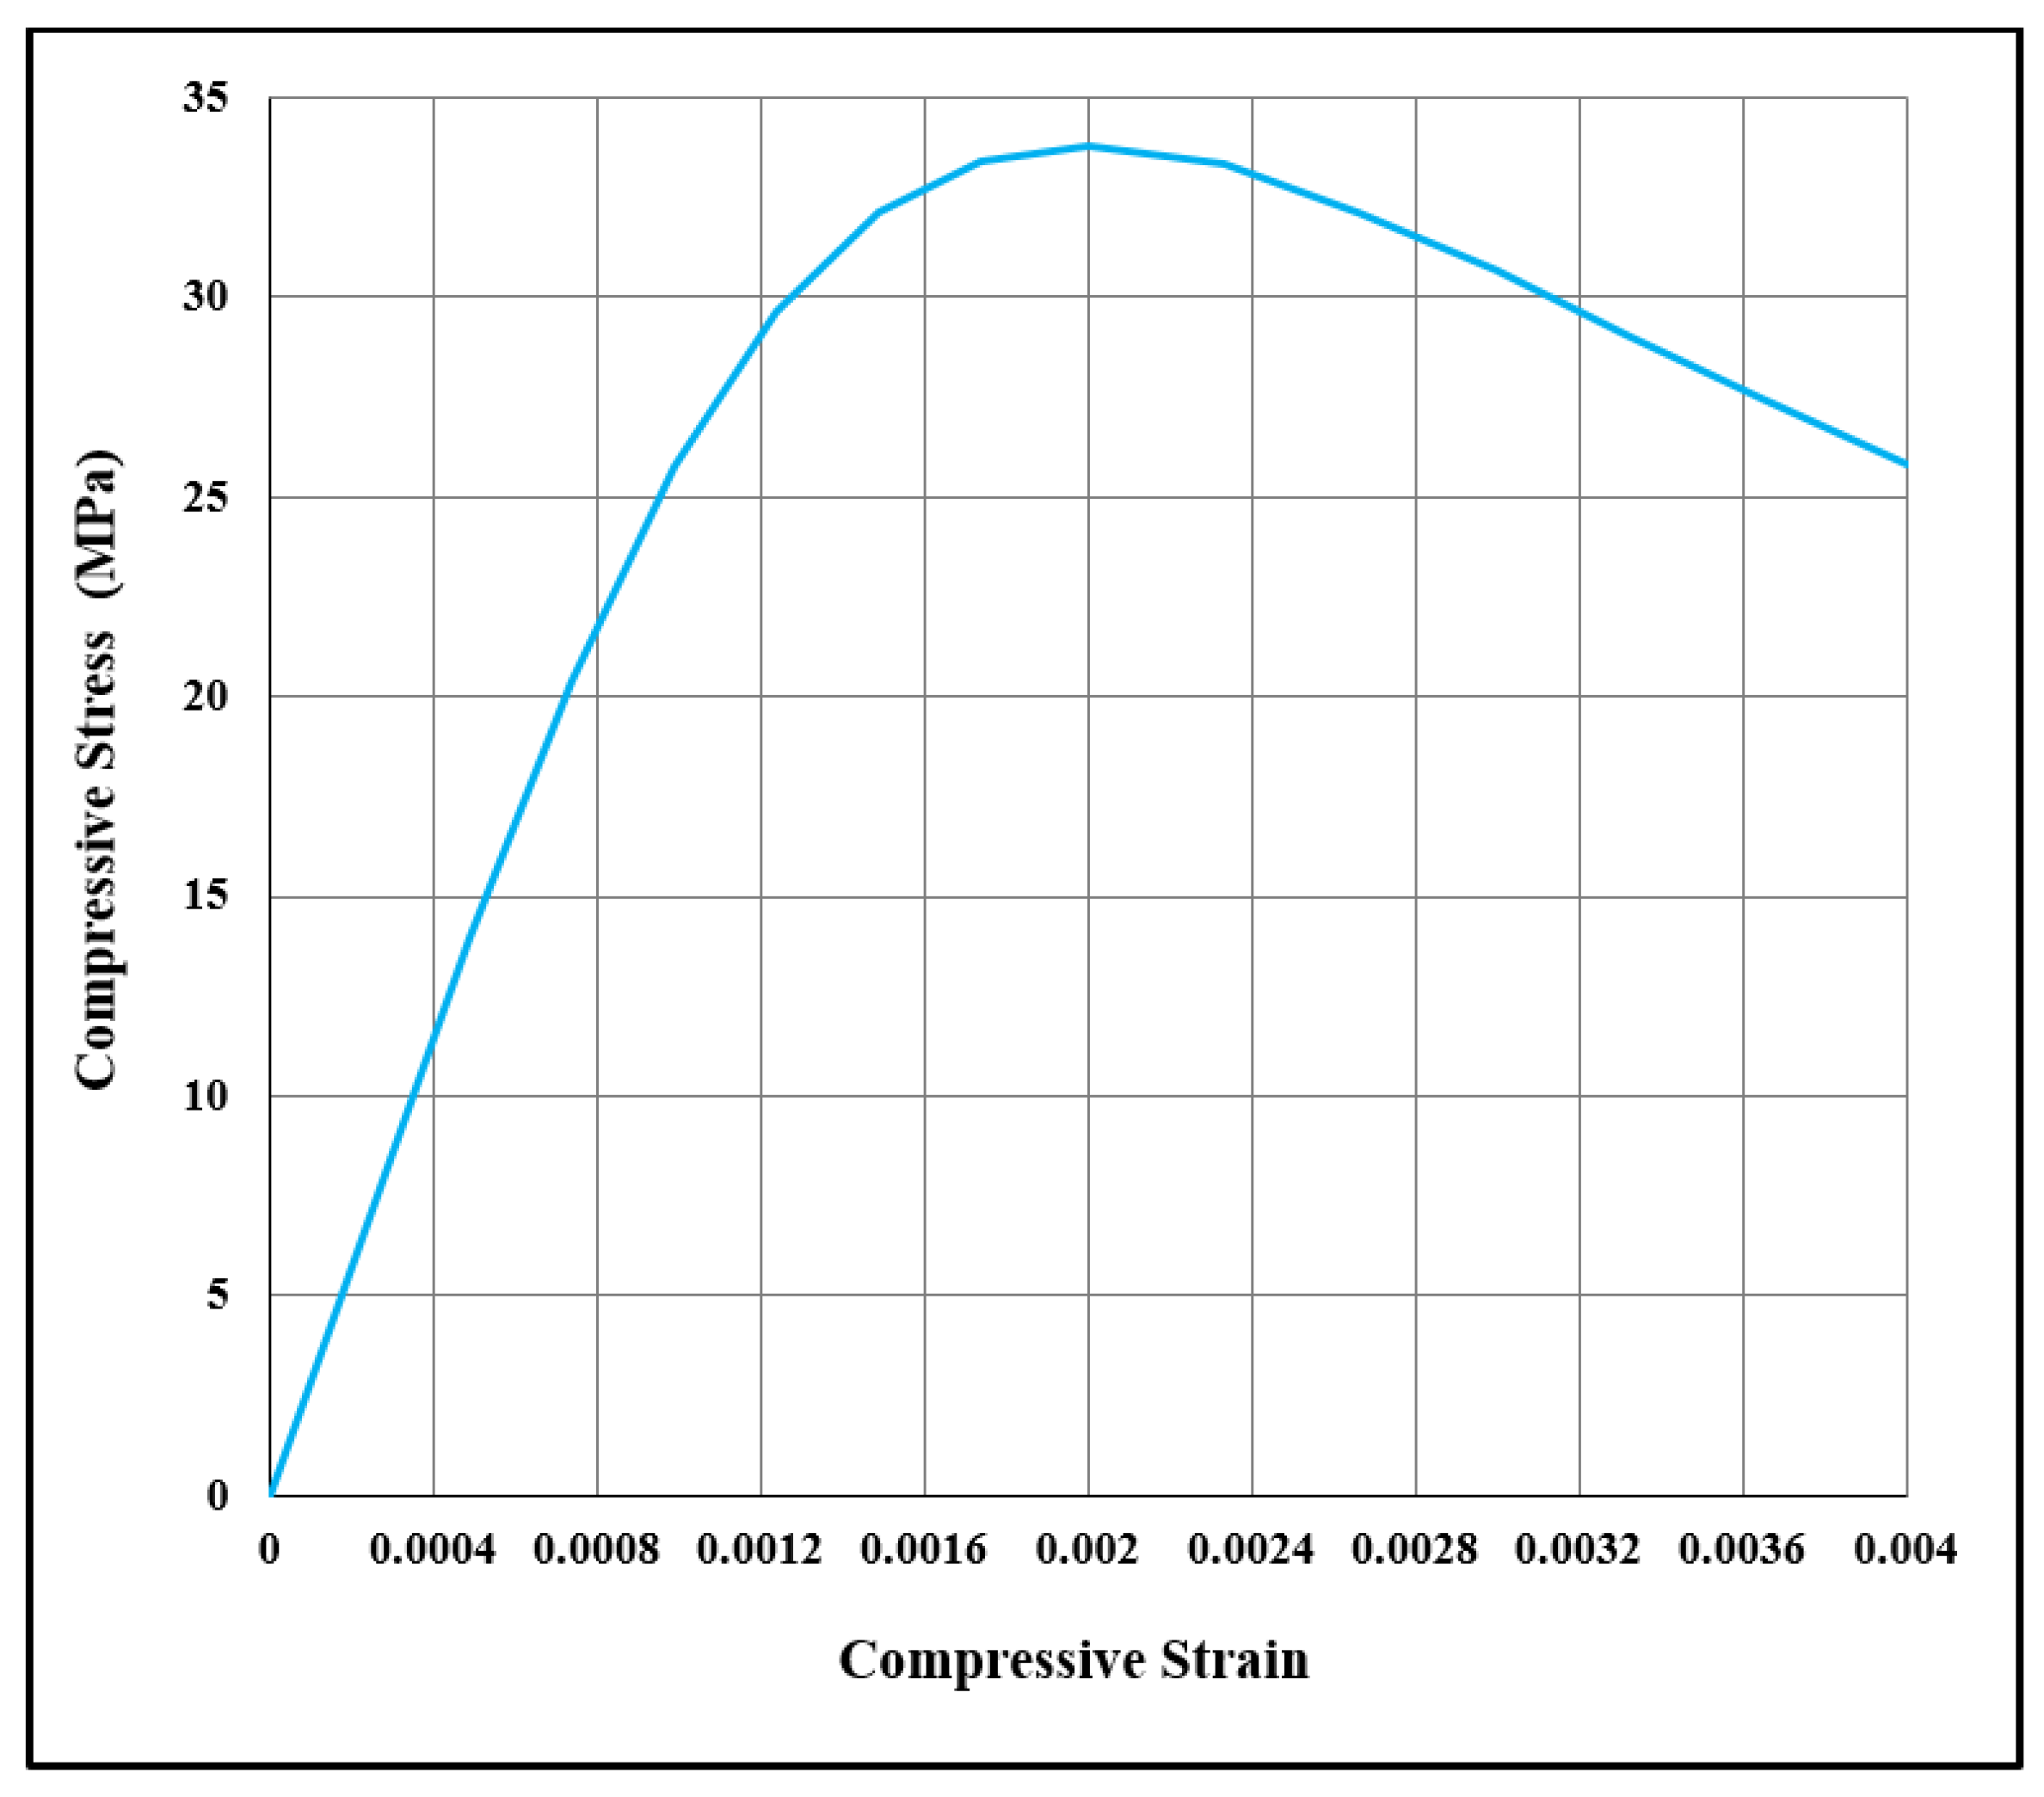
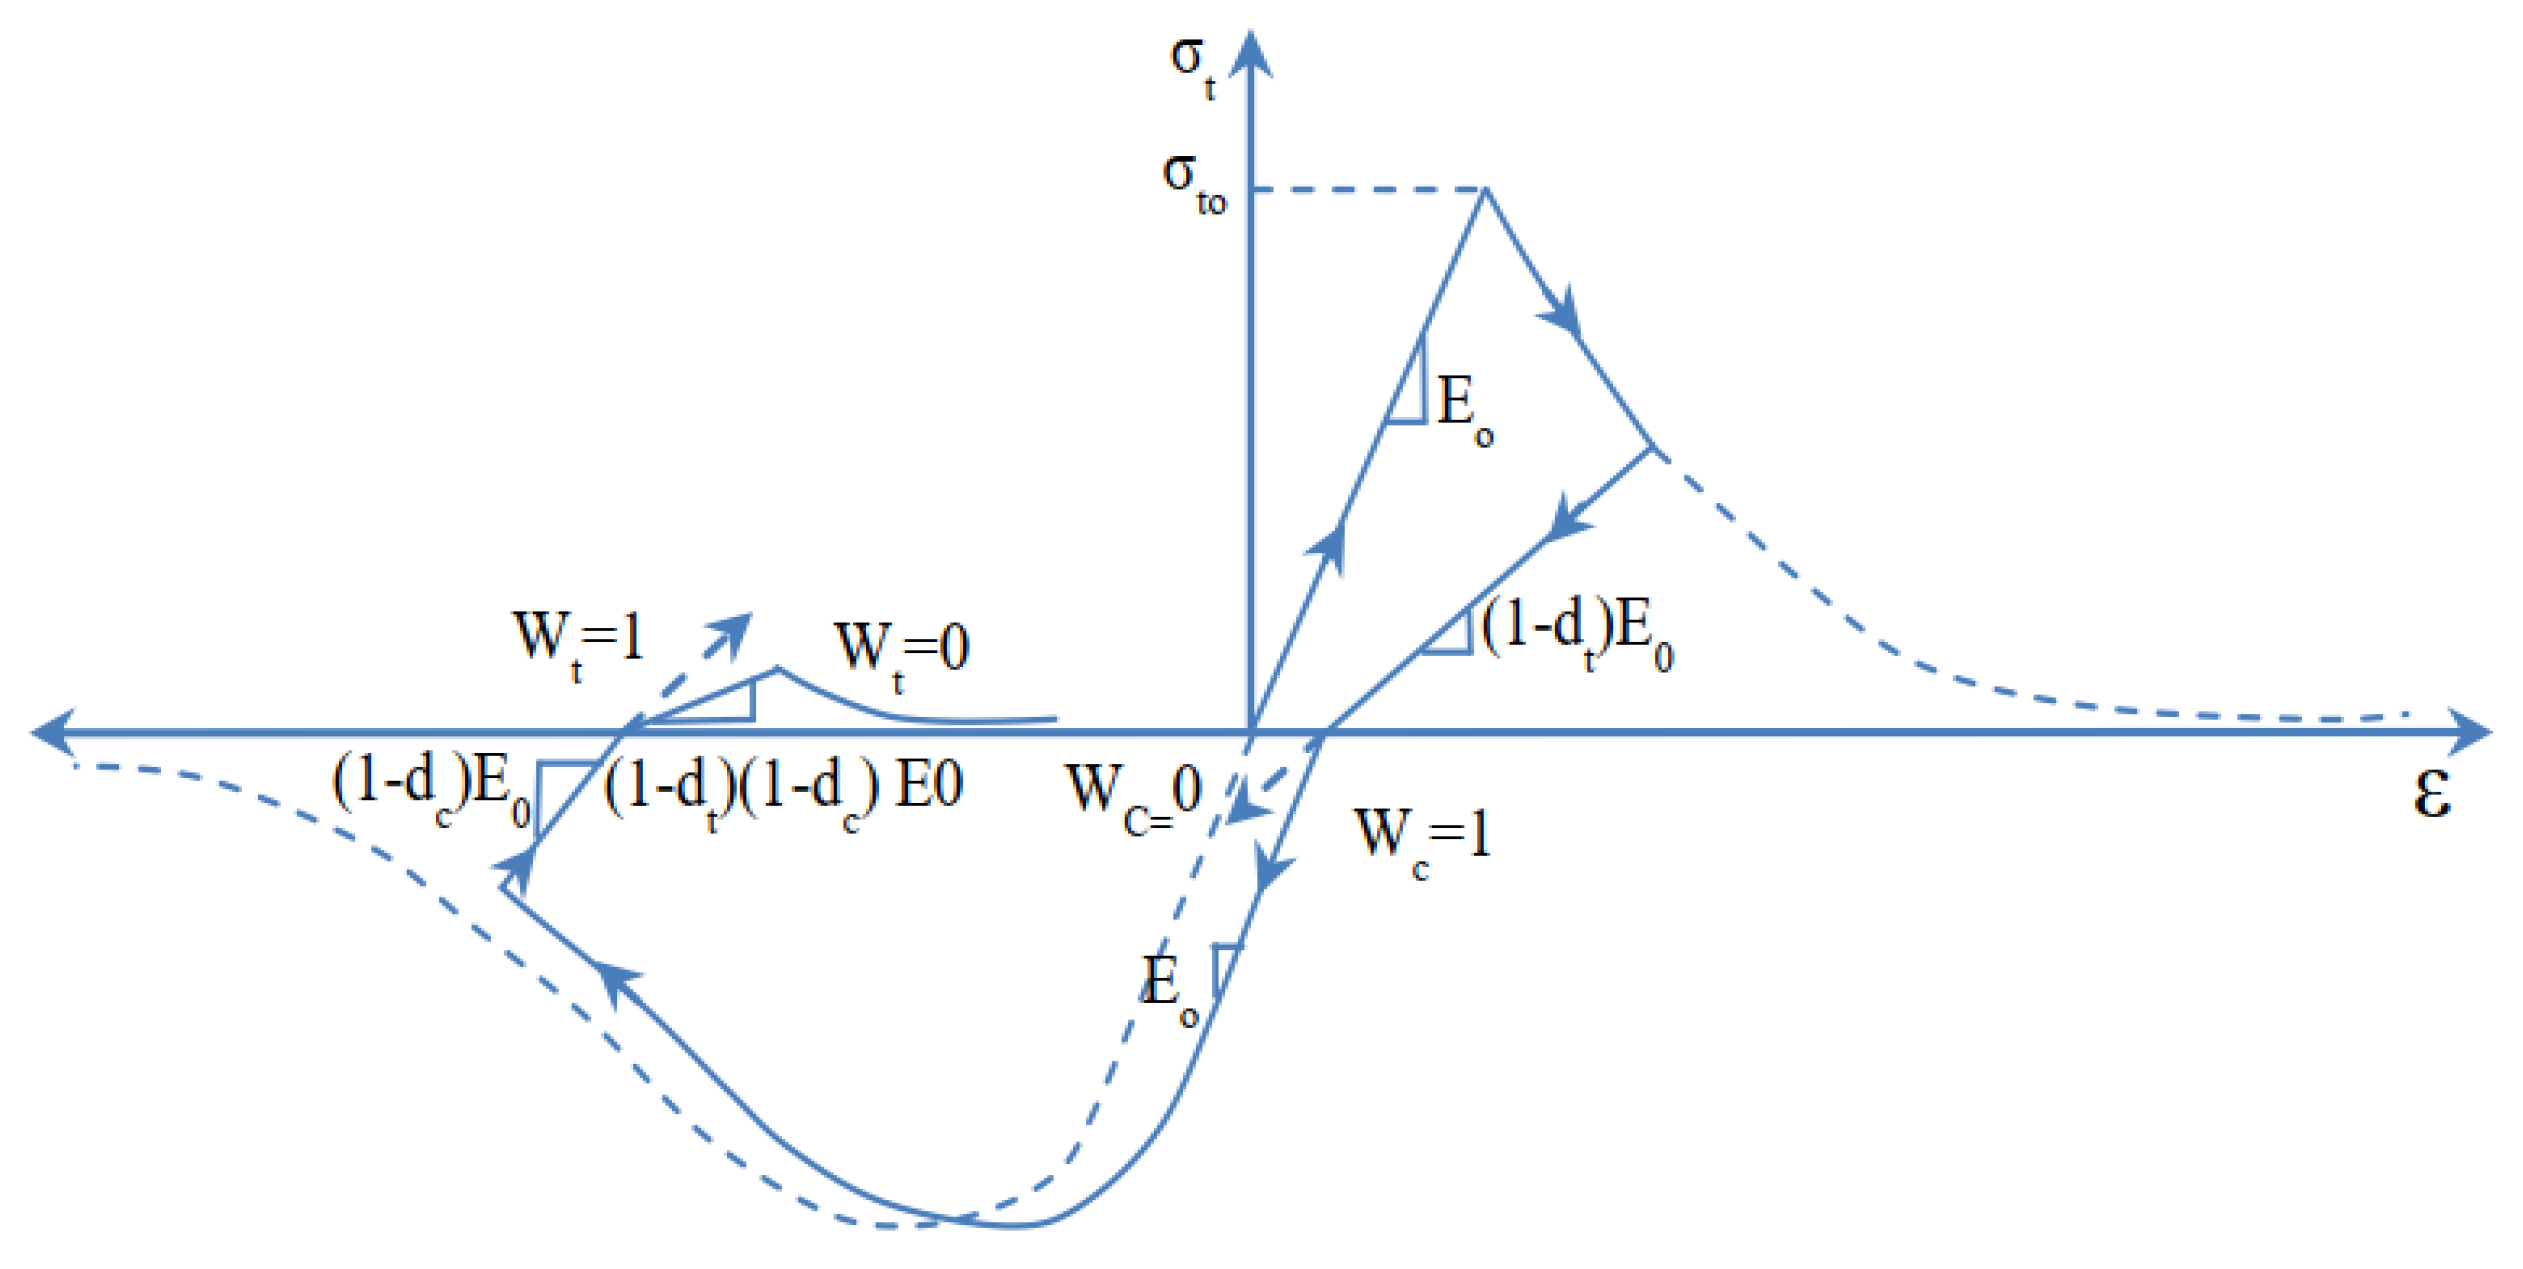
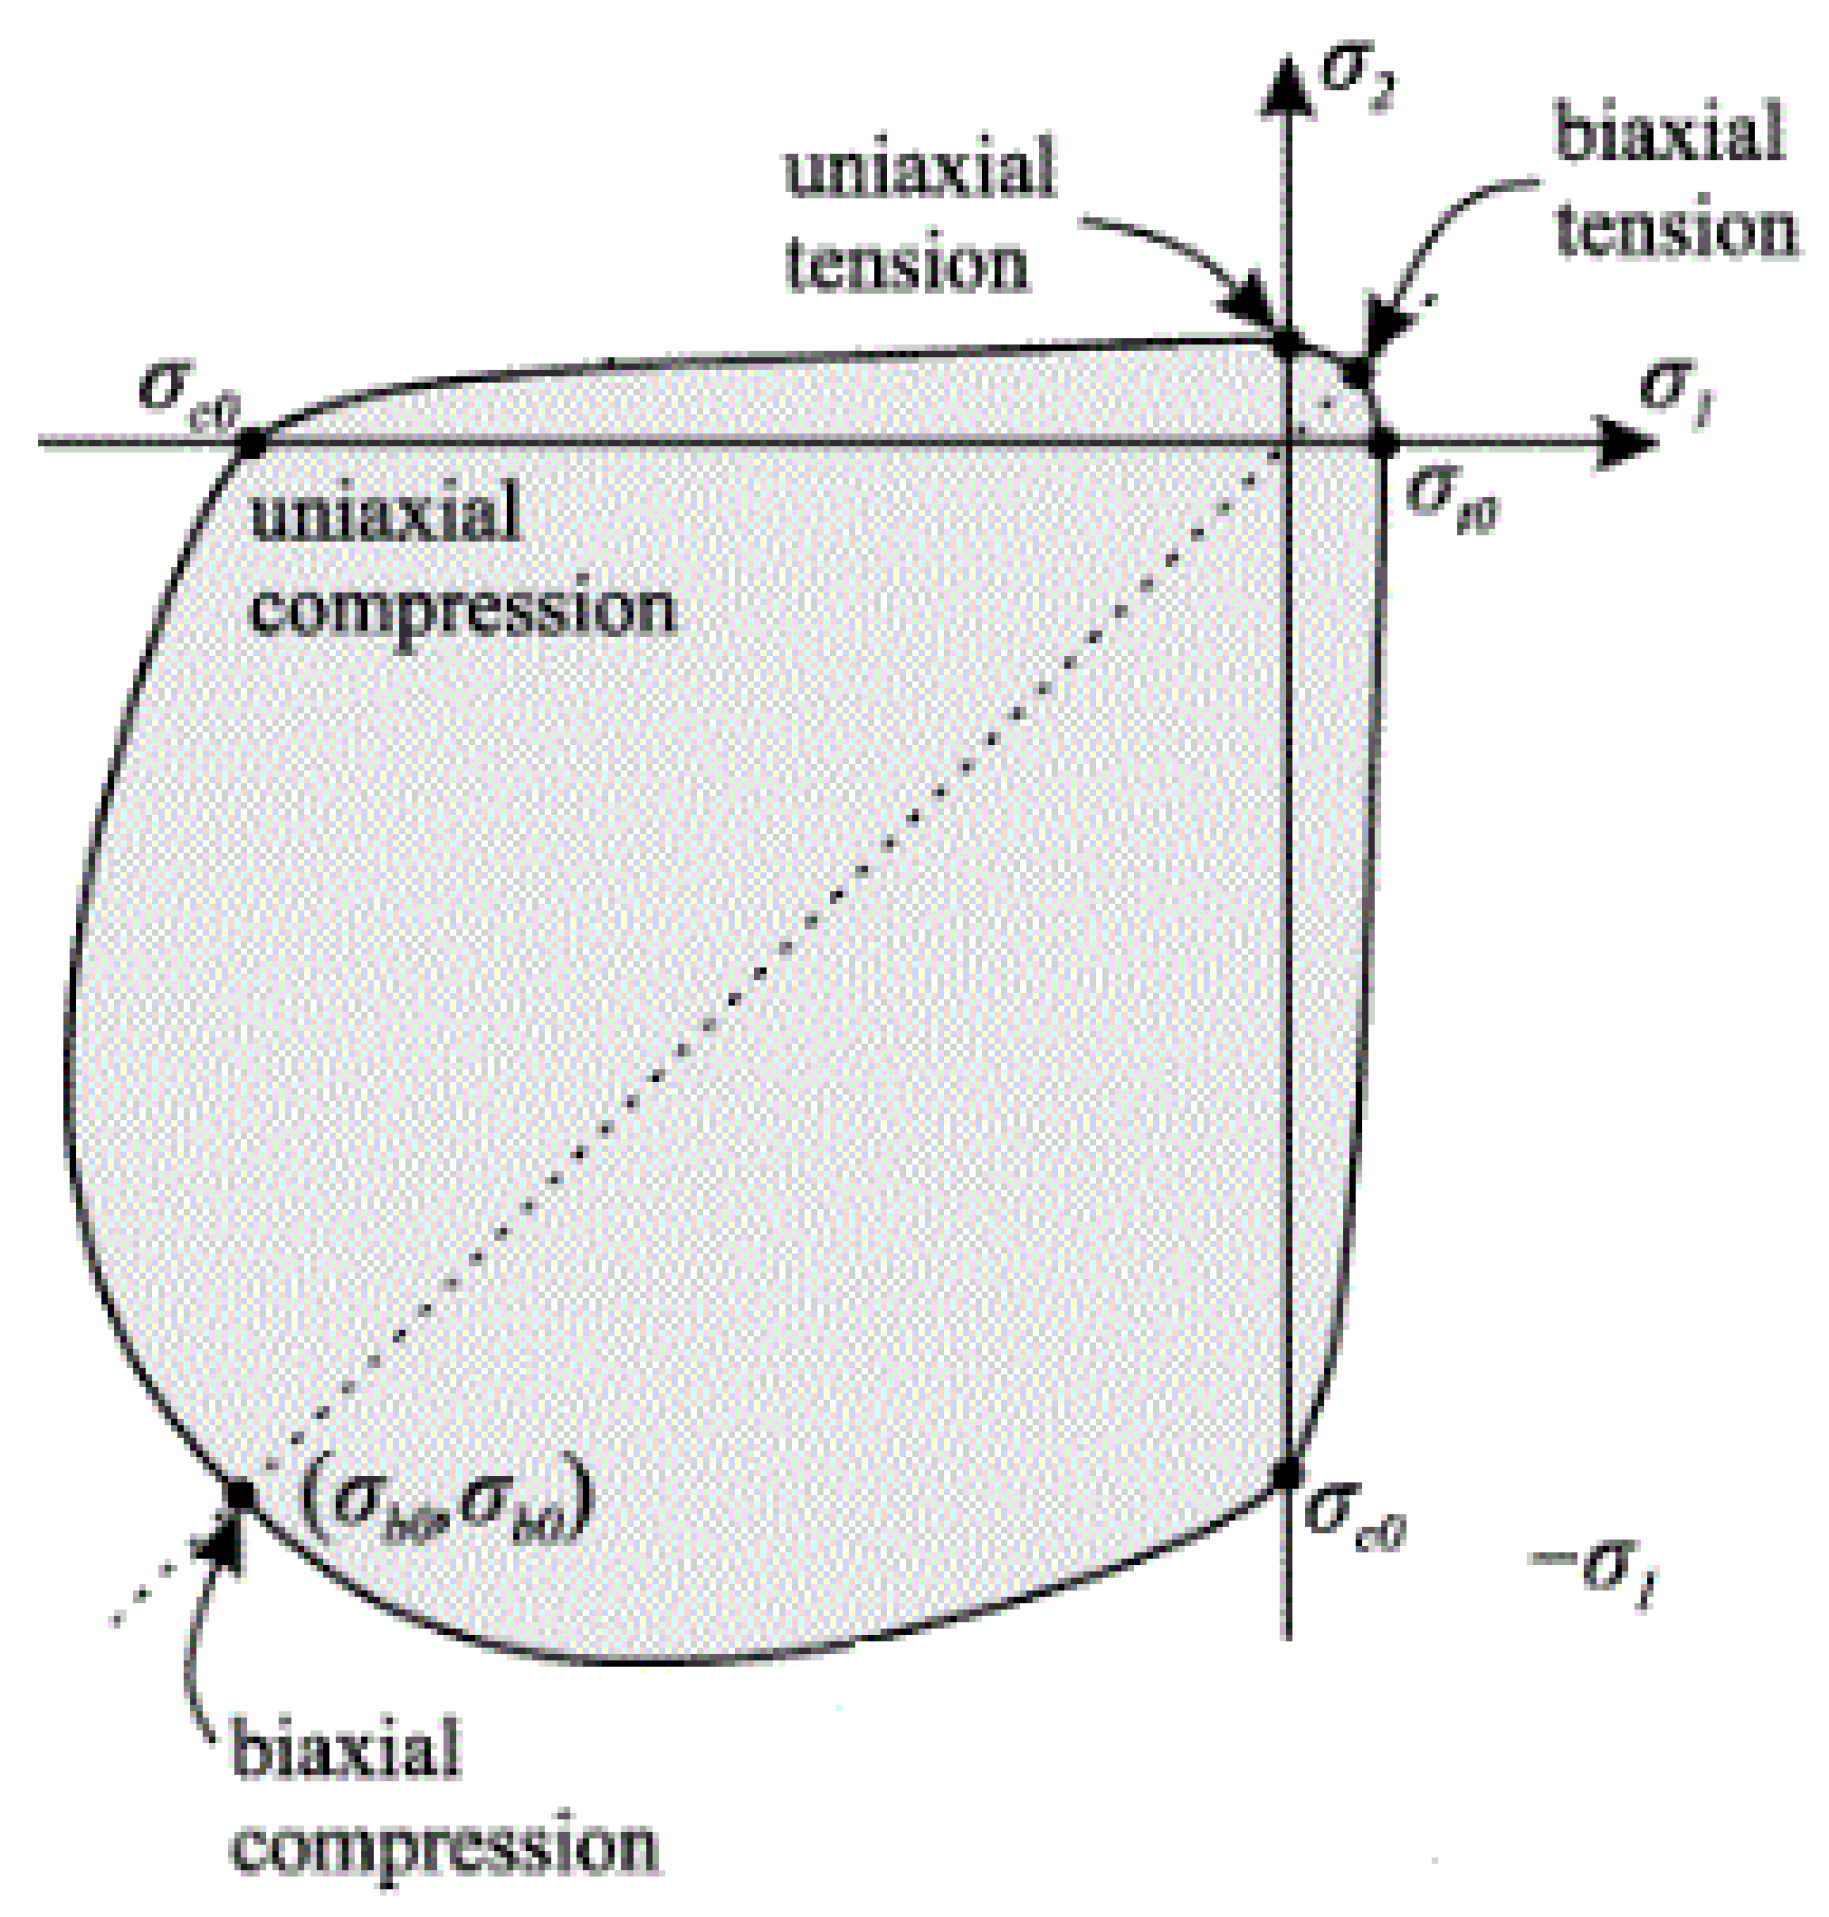
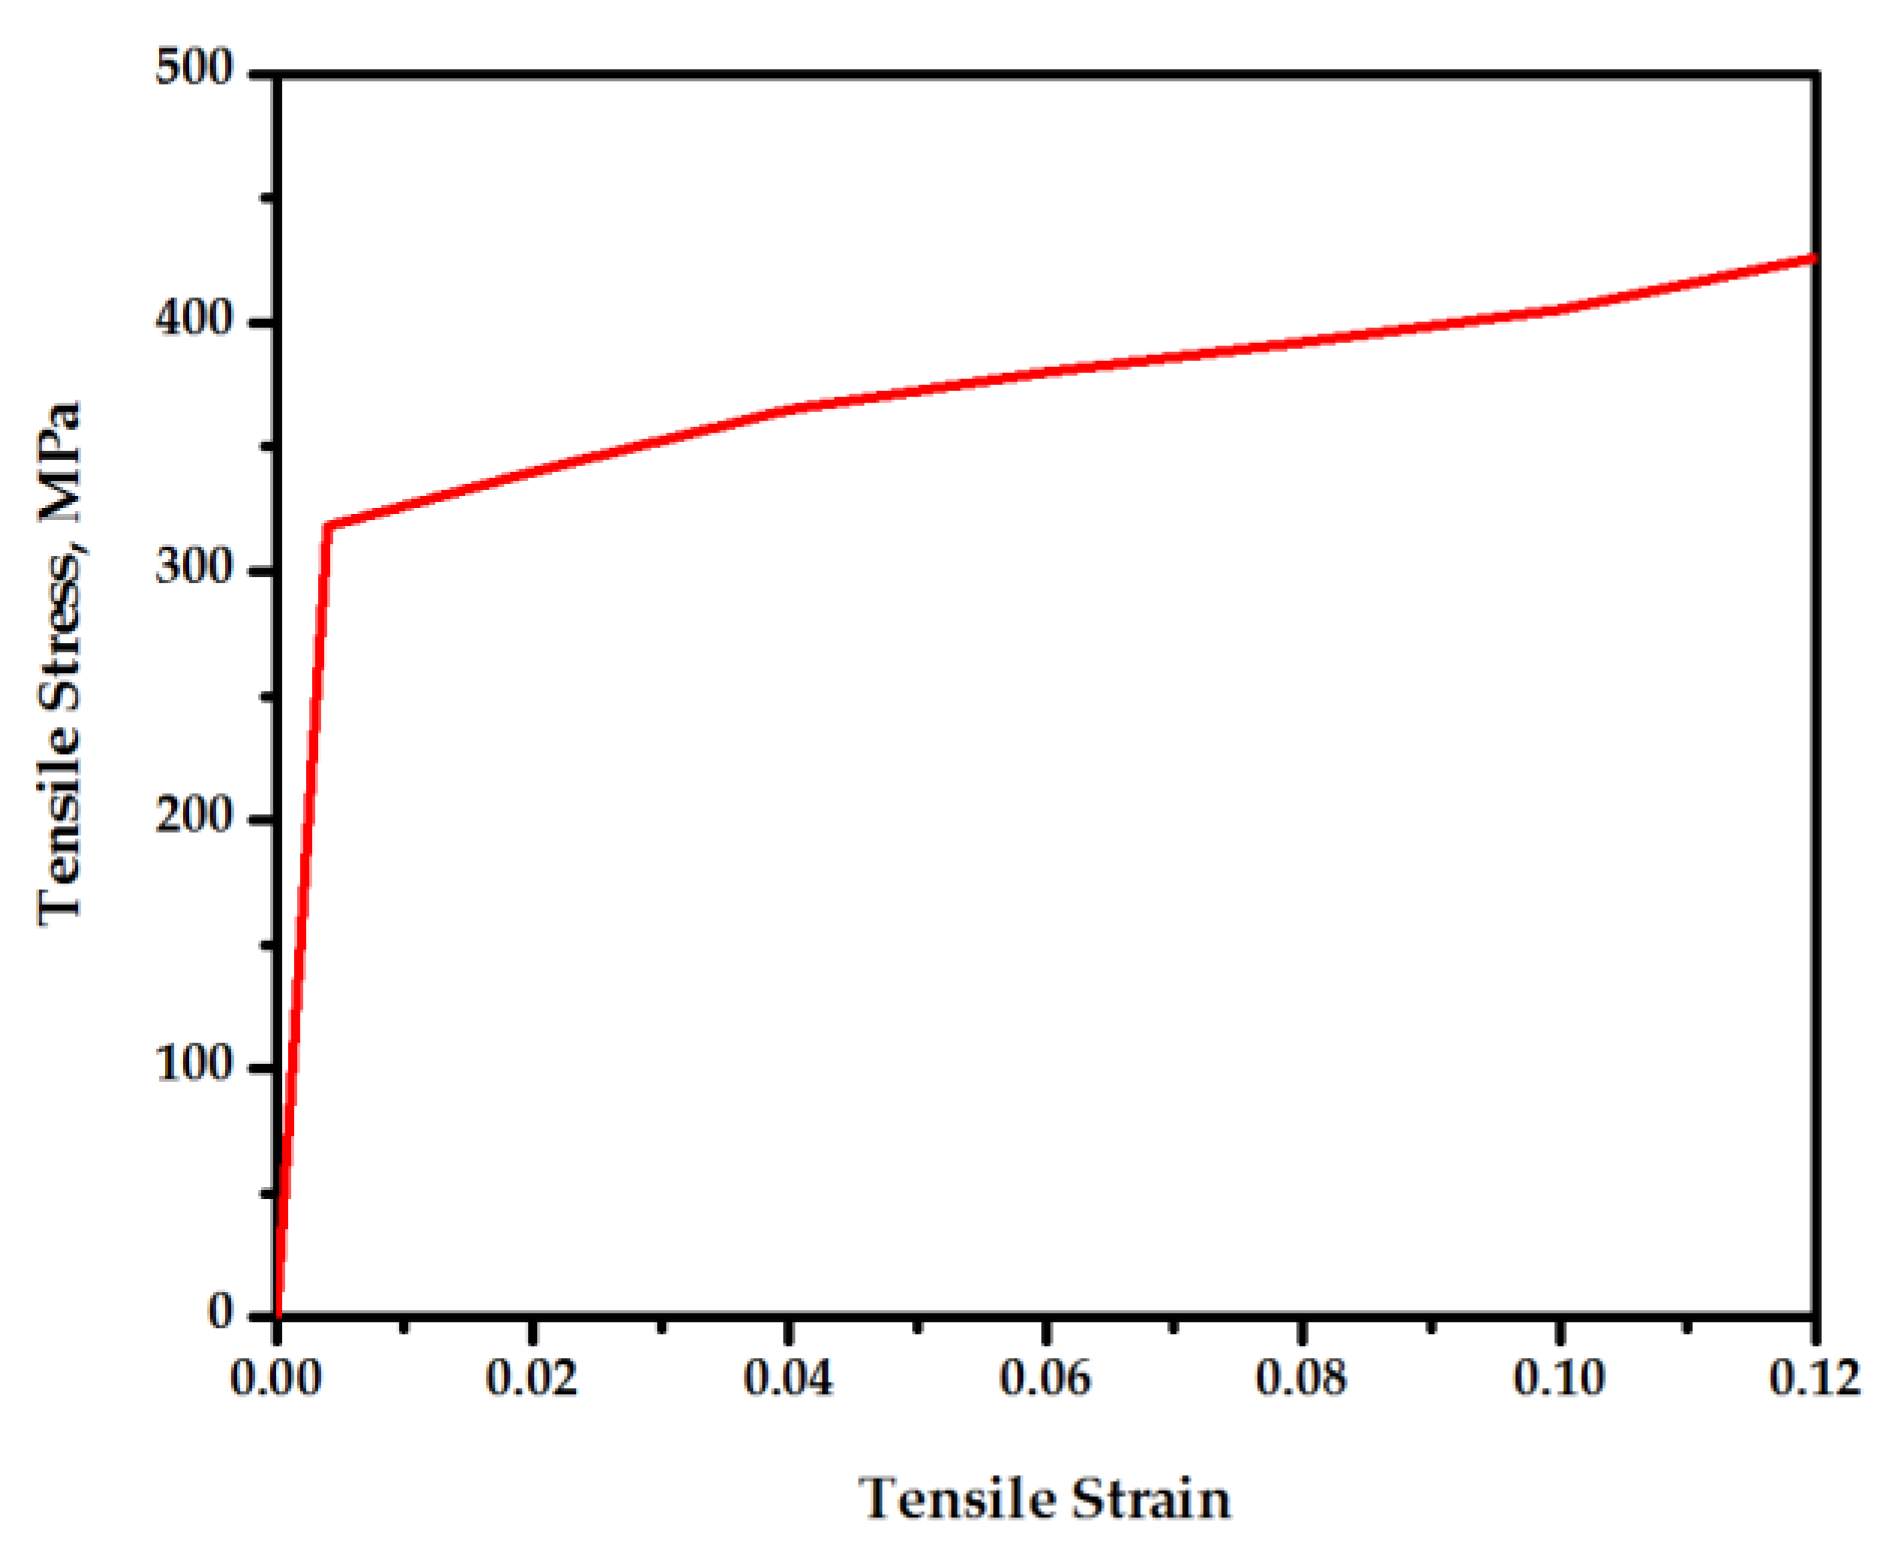
3.2. Material Properties

In this study, the material properties used to prepare the specimens, such as concrete compressive strength and splitting tensile strength, longitudinal reinforcement and stirrups’ yield strength, as well as the tensile strength and the elastic modulus of CRFP and epoxy, are summarized in Table 1. Concrete is known to exhibit a high compressive strength (CS) and low tensile strength (TS), and it is prone to fracture when subjected to tensile loads. This is mainly due to the susceptibility of aggregates in concrete that can endure compressive stress and, thus, allow it to carry compressive loads. However, cracks that separate the cement particles in the aggregates are generated due to tensile stresses. The separation of cement particles causes the entire structure to fail as cracks start propagating. The issue with concrete can be addressed via the reinforcing of elements, such as metallic bars or fibers. These components serve as the framework of the entire construction and can support the aggregates when subjected to tensile forces. This process is referred to as concrete reinforcing. The term “brittle material” might apply to concrete. The difference in behavior between concrete and ductile materials, like steel, is due to their distinct load responses. Brittle materials tend to develop tensile fracture perpendicular to the direction of the largest tensile strain. Thus, the cracks tend to develop parallel to the maximum compressive stress when a concrete specimen is subjected to a uniaxial compressive load. In compression, the stress–strain curve of concrete being elastic can gradually reach up to the maximum CS followed by a decrease into a softening region and eventually crushing failure at an ultimate strain. Tao et al. [60] and Chen et al. [61] modeled the normal concrete stress–strain relationship (Figure 4). The stress–strain characteristics of concrete can be expressed as follows:
f c   = E 0   ε c 1 + E 0   ε c f p 2 ε c ε p + ε c ε p 2
where f c   , ε c , f p   , ε p , and E 0 are the concrete’s corresponding stress (in MPa), strain, maximum experimental stress (in MPa), strain at maximum experimental stress (taken as 0.002), and elastic modulus (in MPa), E 0   = 4700 f c   , respectively.
The stress–strain curve of concrete under tension is approximately linearly elastic up to the maximum TS. After this point, the cracks and strength of concrete decrease gradually to zero [26,27]. The uniaxial TS of concrete can be modeled via the following equation:
f t = 1.4 f p 8 10 2 / 3
The damaged plasticity model in ABAQUS is characterized by the degradation of the compression and tension. When plasticizers are introduced, the elastic stiffness of the material decreases due to its deterioration, making it unable to restore the original elastic stiffness. This is crucial for cyclic loading, as the two damage parameters are considered to be dependent on the plastic strains, indicating a reduction in the elastic stiffness. Figure 5 displays the stress–strain curve for tension and compression modeled using the damage plasticity model.
The element develops cracks and eventually damages the material when it experiences a tension that surpasses its TS. This behavior can be expressed by a variable called the damage parameter (dt). Furthermore, the behavior of the element under CS is represented by the variable damage parameters (dc). Generally, the developed cracks do not affect the stiffness in compression unless the degradation and compression stiffness reach the same level as the stiffness in tension, in which the dc becomes zero. Following the experimental results of Trung [58], this study used (in ABAQUS for the concrete material) a CS value of 33.8 MPa, a Young’s modulus of 27,324 MPa, and a Poisson’s ratio of 0.2. Five parameters were considered to describe the Drucker–Prager flow potential yield surface that was first developed by Lubliner et al. [62] and then upgraded by Lee et al. [63]. To accurately determine the values of the selected parameters, several tests were conducted in the model wherein the default parameters of ABAQUS were used. These parameters included (1) the dilation angle equal to 31 that denoted the volume change to shear strain ratio, (2) the eccentricity equal to 0 when the flow potential approaches a straight line or 0.1, (3) the initial uniaxial to biaxial CS ratio of 1.16 (Figure 6), (4) the viscosity that represented the relaxation time of the visco-plastic system that was assumed to be zero because the BCJ model caused a severe convergence difficulty, enabling us to improve the convergence of the model in the softening region, and (5) the yield surface on the deviatoric plane defined by the ratio of the second stress invariant on the tensile to the compressive meridian was equal to 2/3.
The linear isotropic and bilinear kinematic model was applied to simulate the elastic and inelastic behavior of the steel components in the reinforcement bar. The material model in ABAQUS used the Young’s modulus value of 200,000 MPa and Poisson’s ratio of 0.3 to accurately represent the behavior of steel. Following the tensile test conducted by Trung [58], the steel material parameters utilized in the finite element models were derived. These properties were then incorporated into the model (Table 2 and Figure 7). An orthotropic elastic material was used to represent CFRPCs. Following the report of Narayanan [65], the material properties were determined. The required material properties for the 3D analysis of CFRP are displayed in Table 1. The model assumed full bonding between CFRP and concrete.

3.3. Geometry

As mentioned previously, to accurately represent the geometrical configuration and dimensions of the test specimens’, 3D numerical models were developed. The mesh for the beam and columns was chosen so that the solid elements’ node points could line up with the real positions of the reinforcement. The mesh was subdivided to obtain more node points, resulting in a reasonable mesh density in the joint areas with the acceptable aspect ratio of the elements. The two materials shared the same nodes because the steel reinforcing truss element was attached between the nodes of each concrete element to create a perfect bond. It is worth noting that the perfect bond assumption used in the structural model did not cause a significant error in the predicted load-displacement response. In the CFRPC, the full contact was simulated at the interface between the CFRPC shell and the concrete elements. Values for the cross-sectional area and initial strain of reinforcement as well as the CFRP were entered. A value of zero was entered for the initial strain due to the absence of initial stress on the reinforcement. Figure 8 illustrates the finite element mesh and geometry of the joints. Four joints were modeled including non-seismic detail, seismic detail, CFRPC to strengthen the NSCBCJs, and two layers of CFRPC specimens for strengthening the NSCBCJs.

3.4. Boundary Condition

The loads and limitations applied in the finite element models were identical to the conducted test. In addition, the lateral cyclic loading was carried out at each drift ratio in the finite element models. Herein, UX, UY, and UZ are the displacement in the direction of x (beam axis), y (column axis), and z (displacement perpendicular to the x and y axis) axis, respectively. The z-direction displacements were completely restrained at the top of the column (Uz = 0) and the lateral displacements were applied in the x-axis direction. To simulate the hinge support, the displacements in the column bottom at each direction were restrained (Ux = Uy = Uz = 0). Additionally, the displacements in the y and z directions were restricted (Uy = Uz = 0) at the end of the beam to indicate roller support. Figure 9 shows the boundary condition used in finite element analysis.

4. Results and Discussion

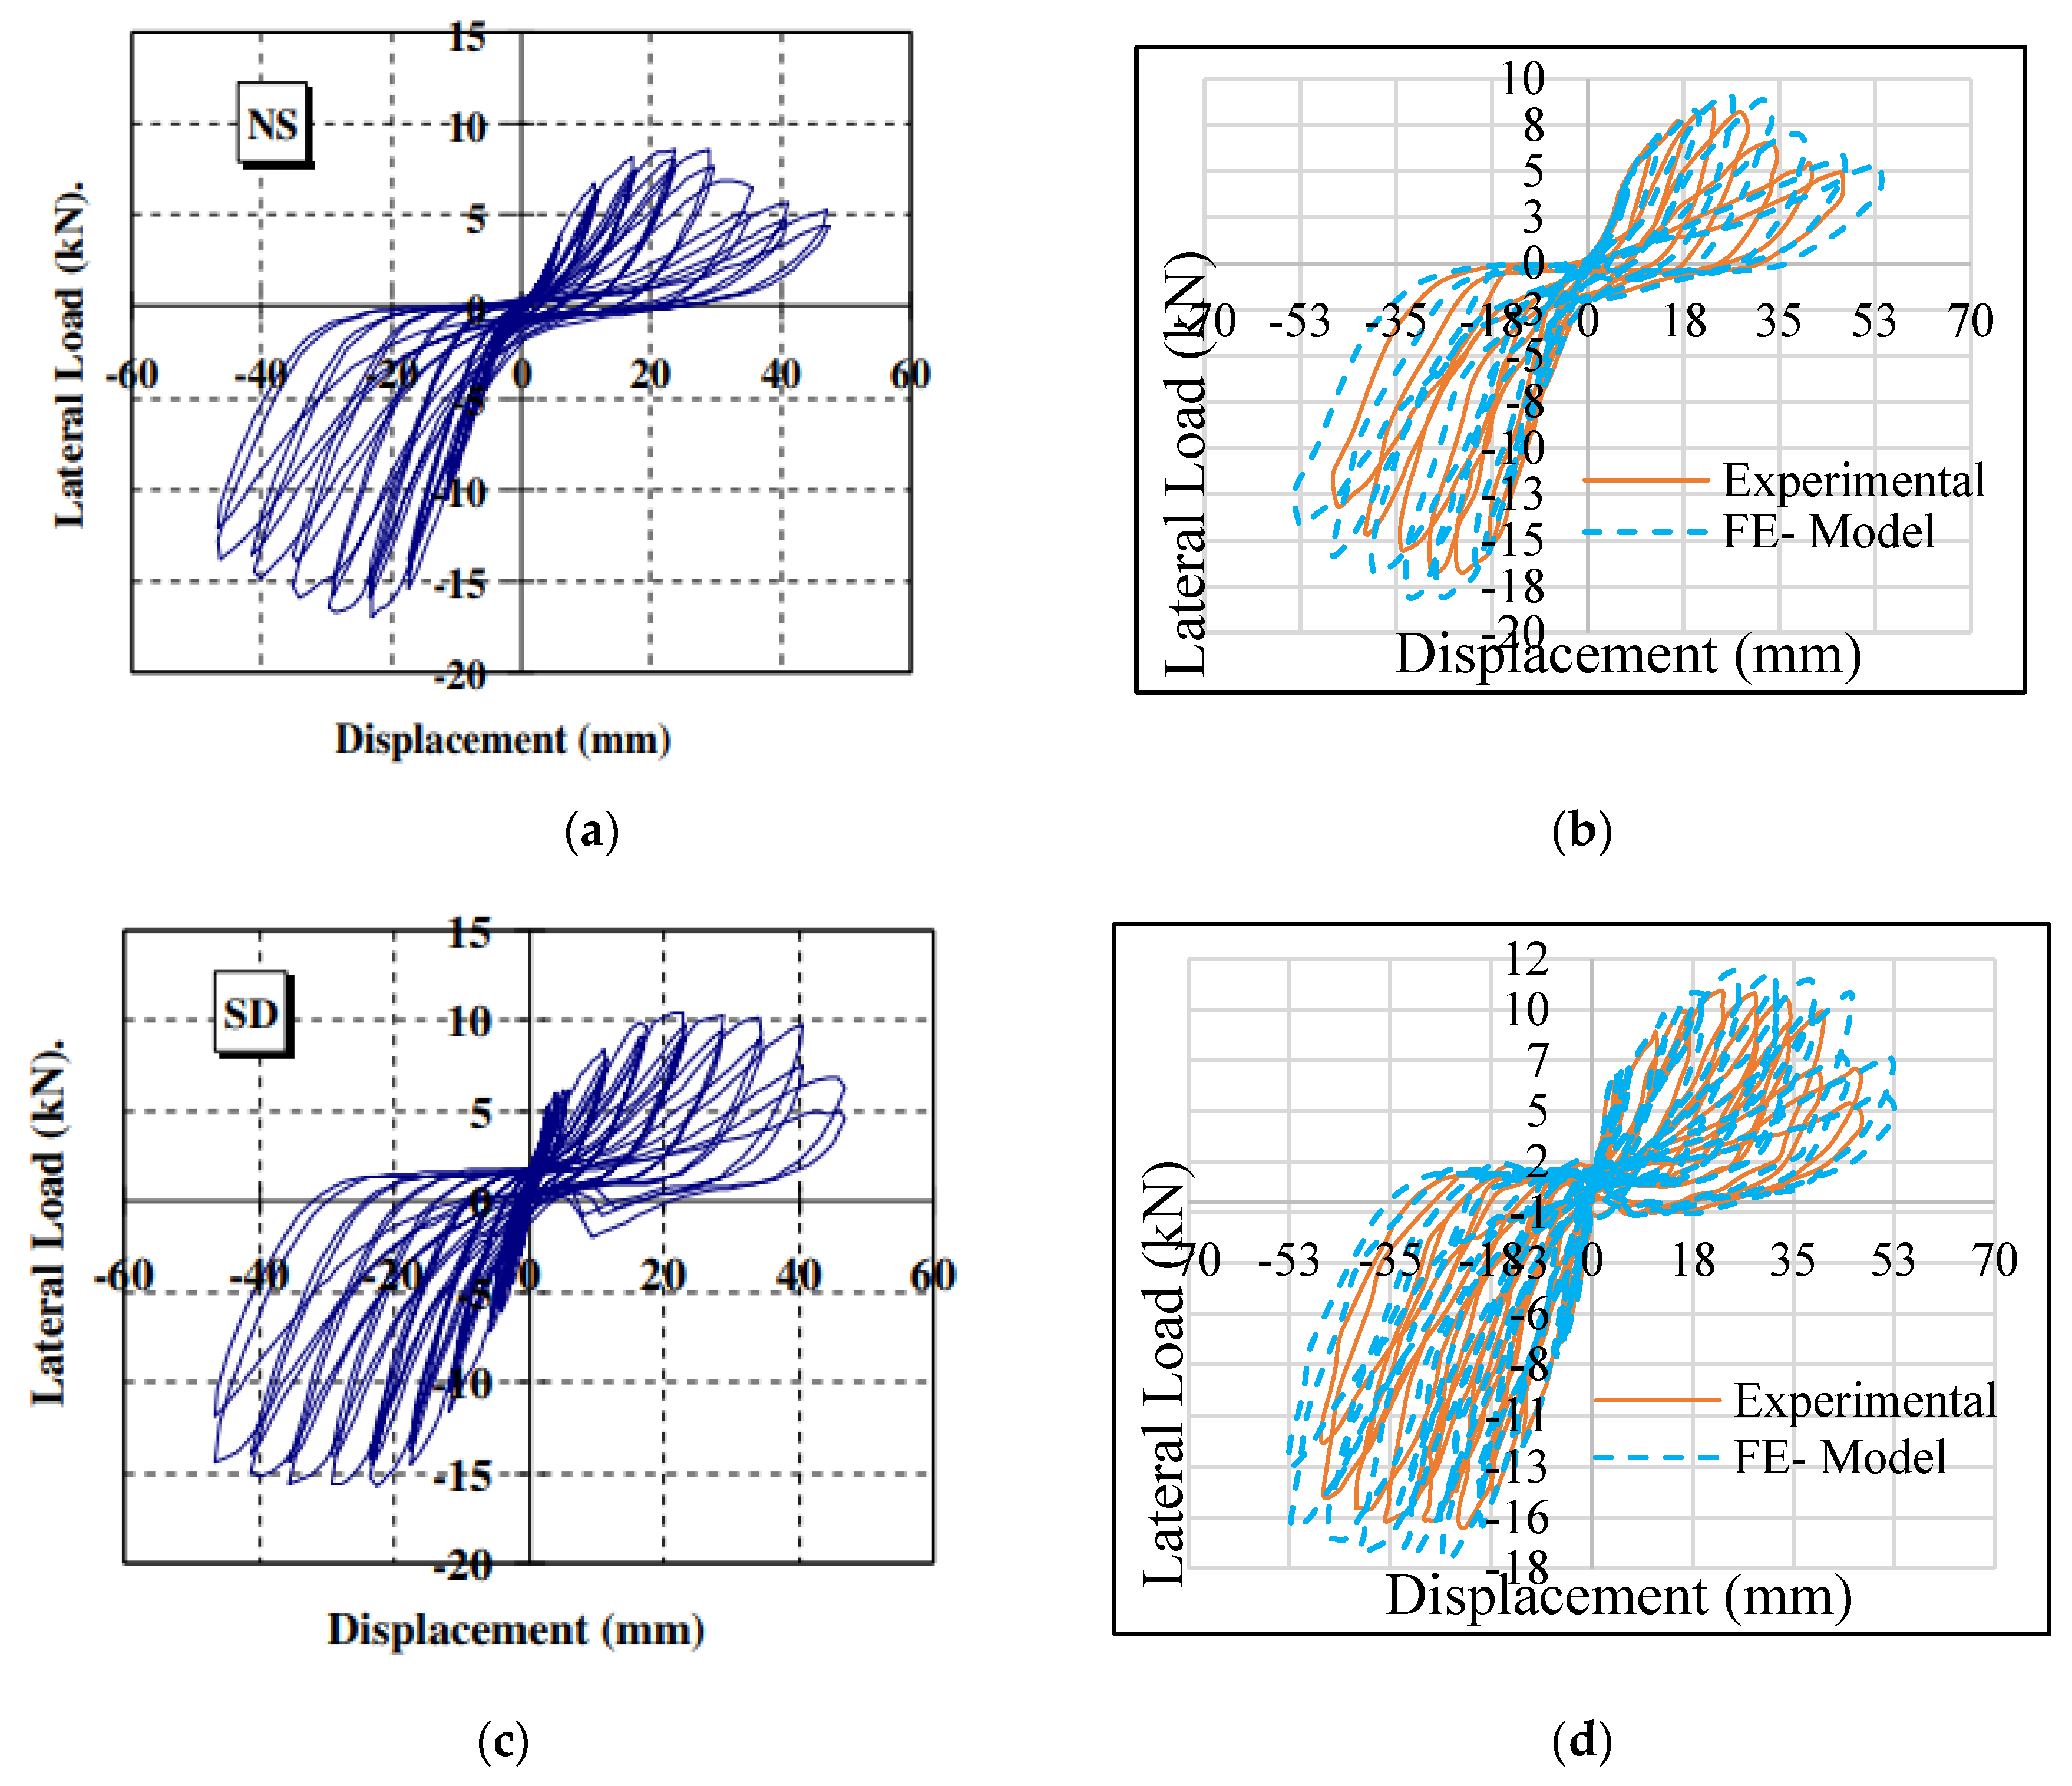
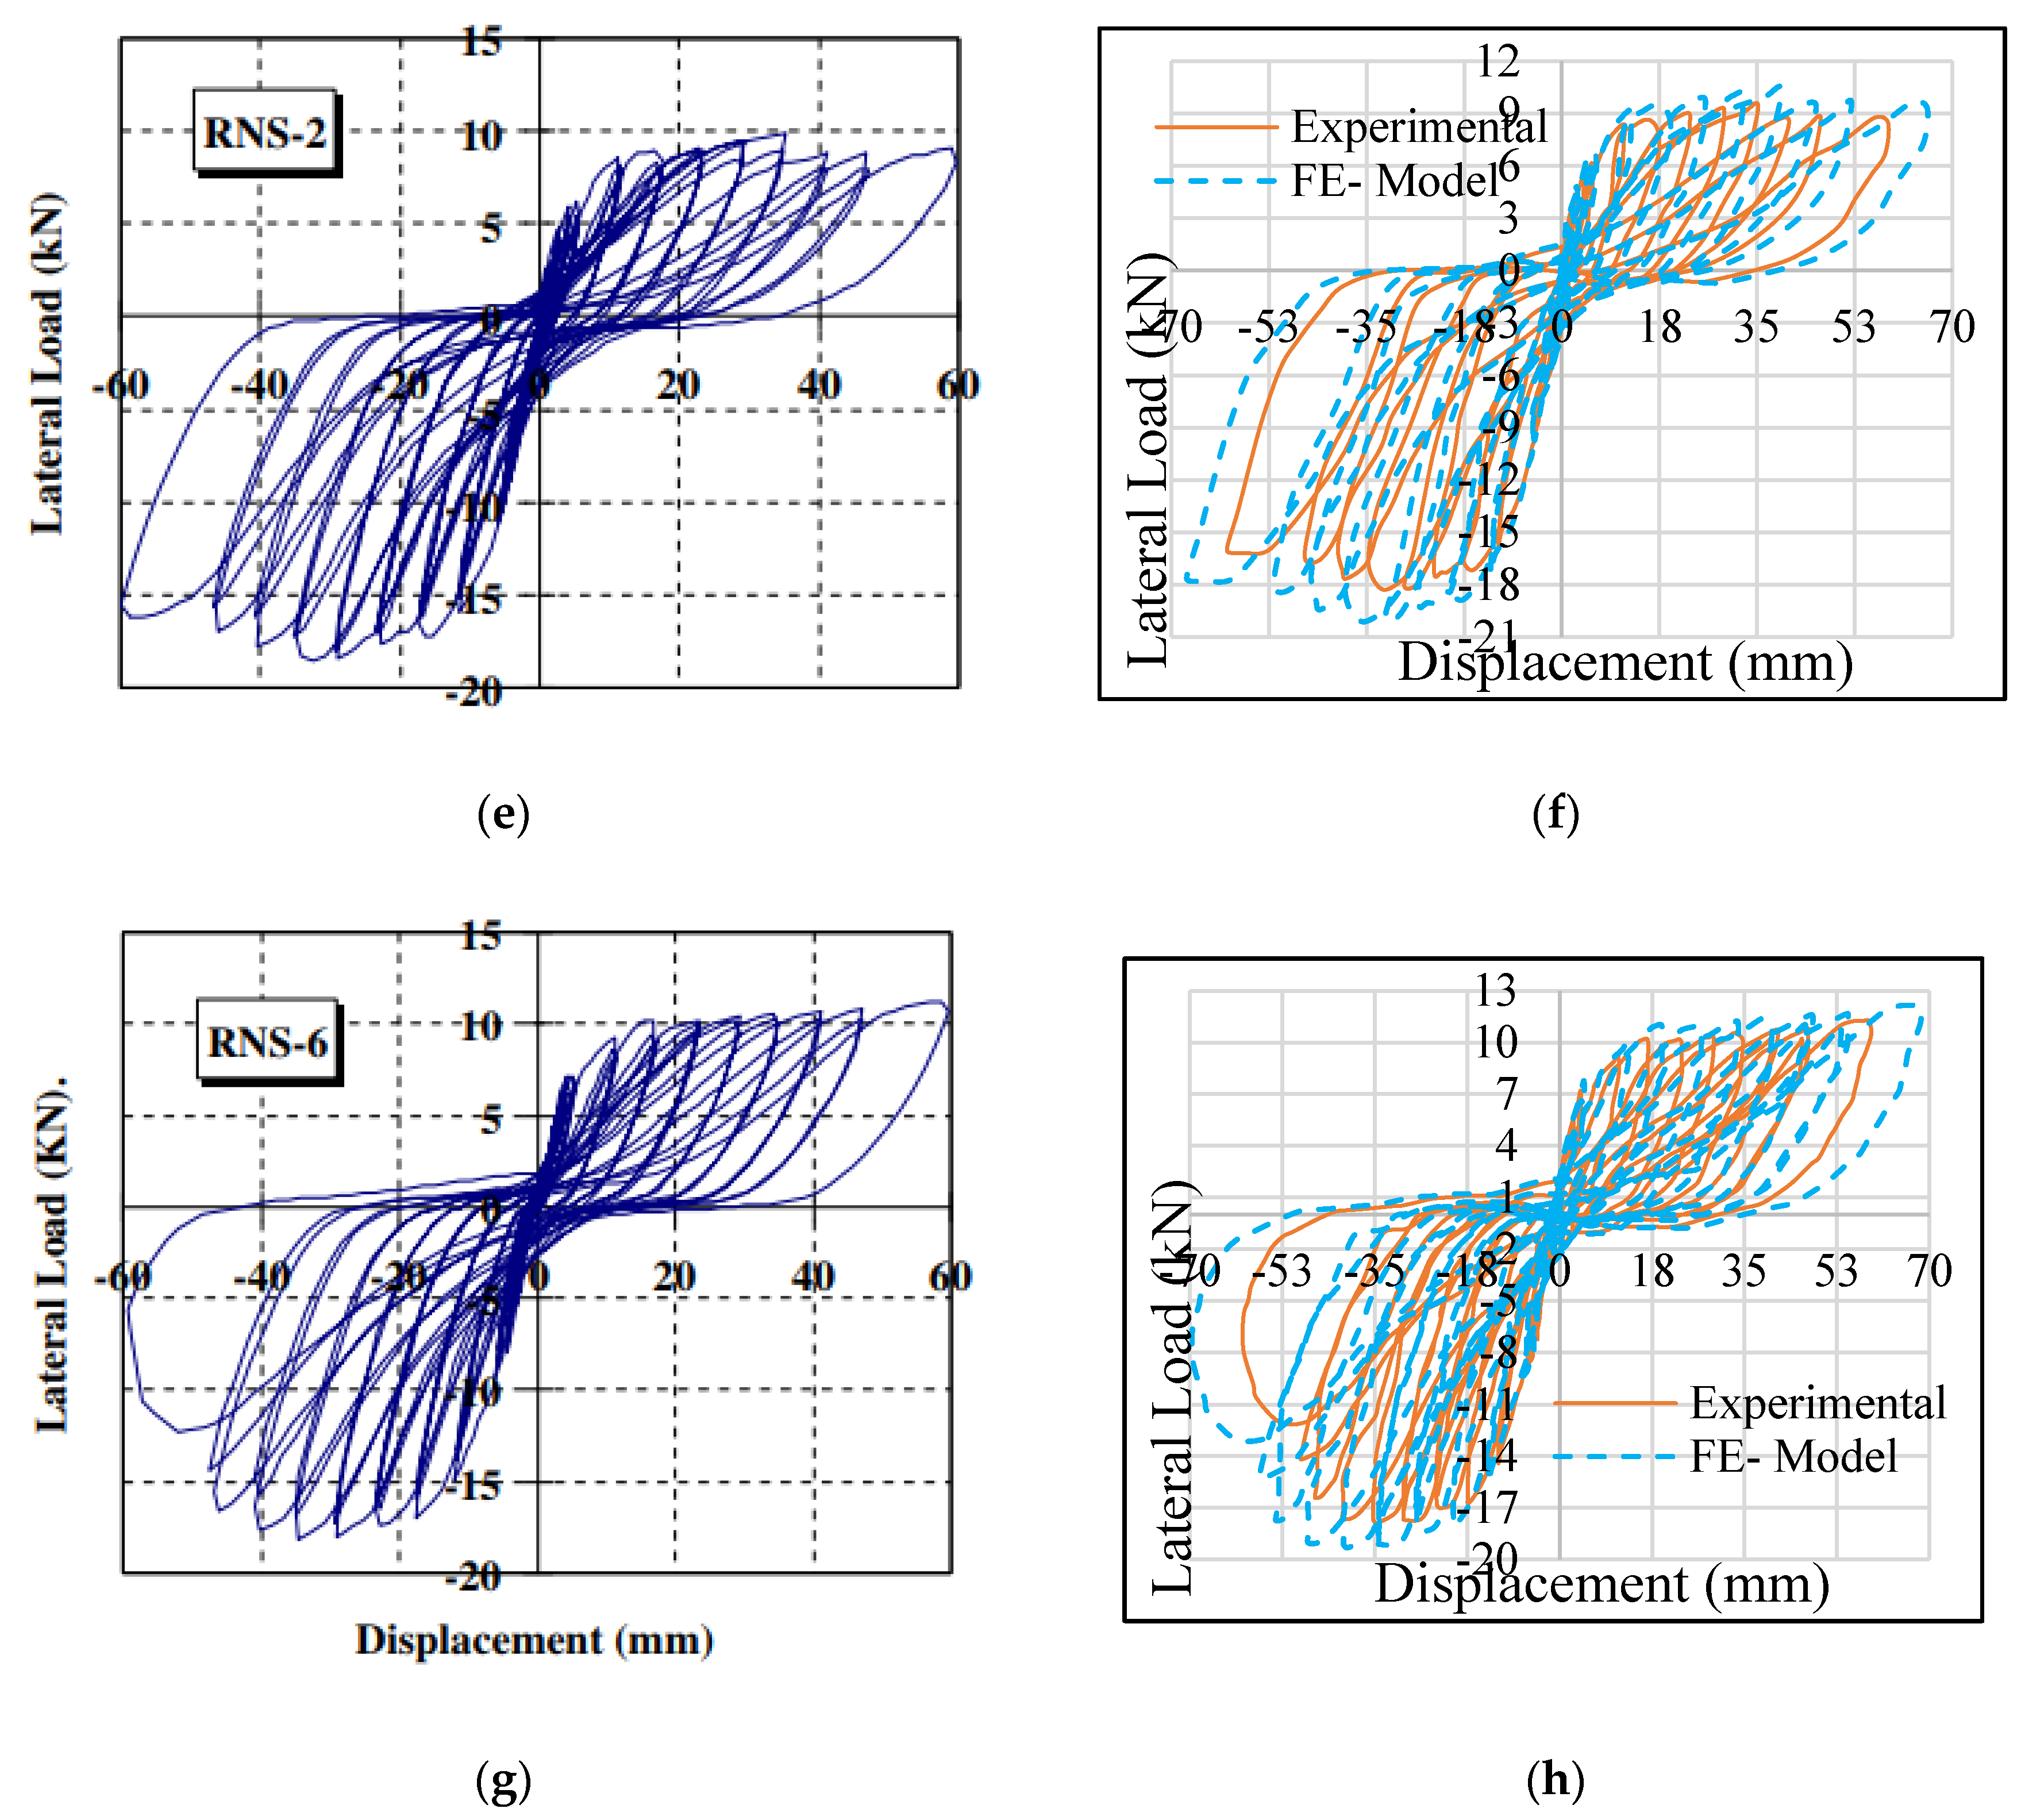
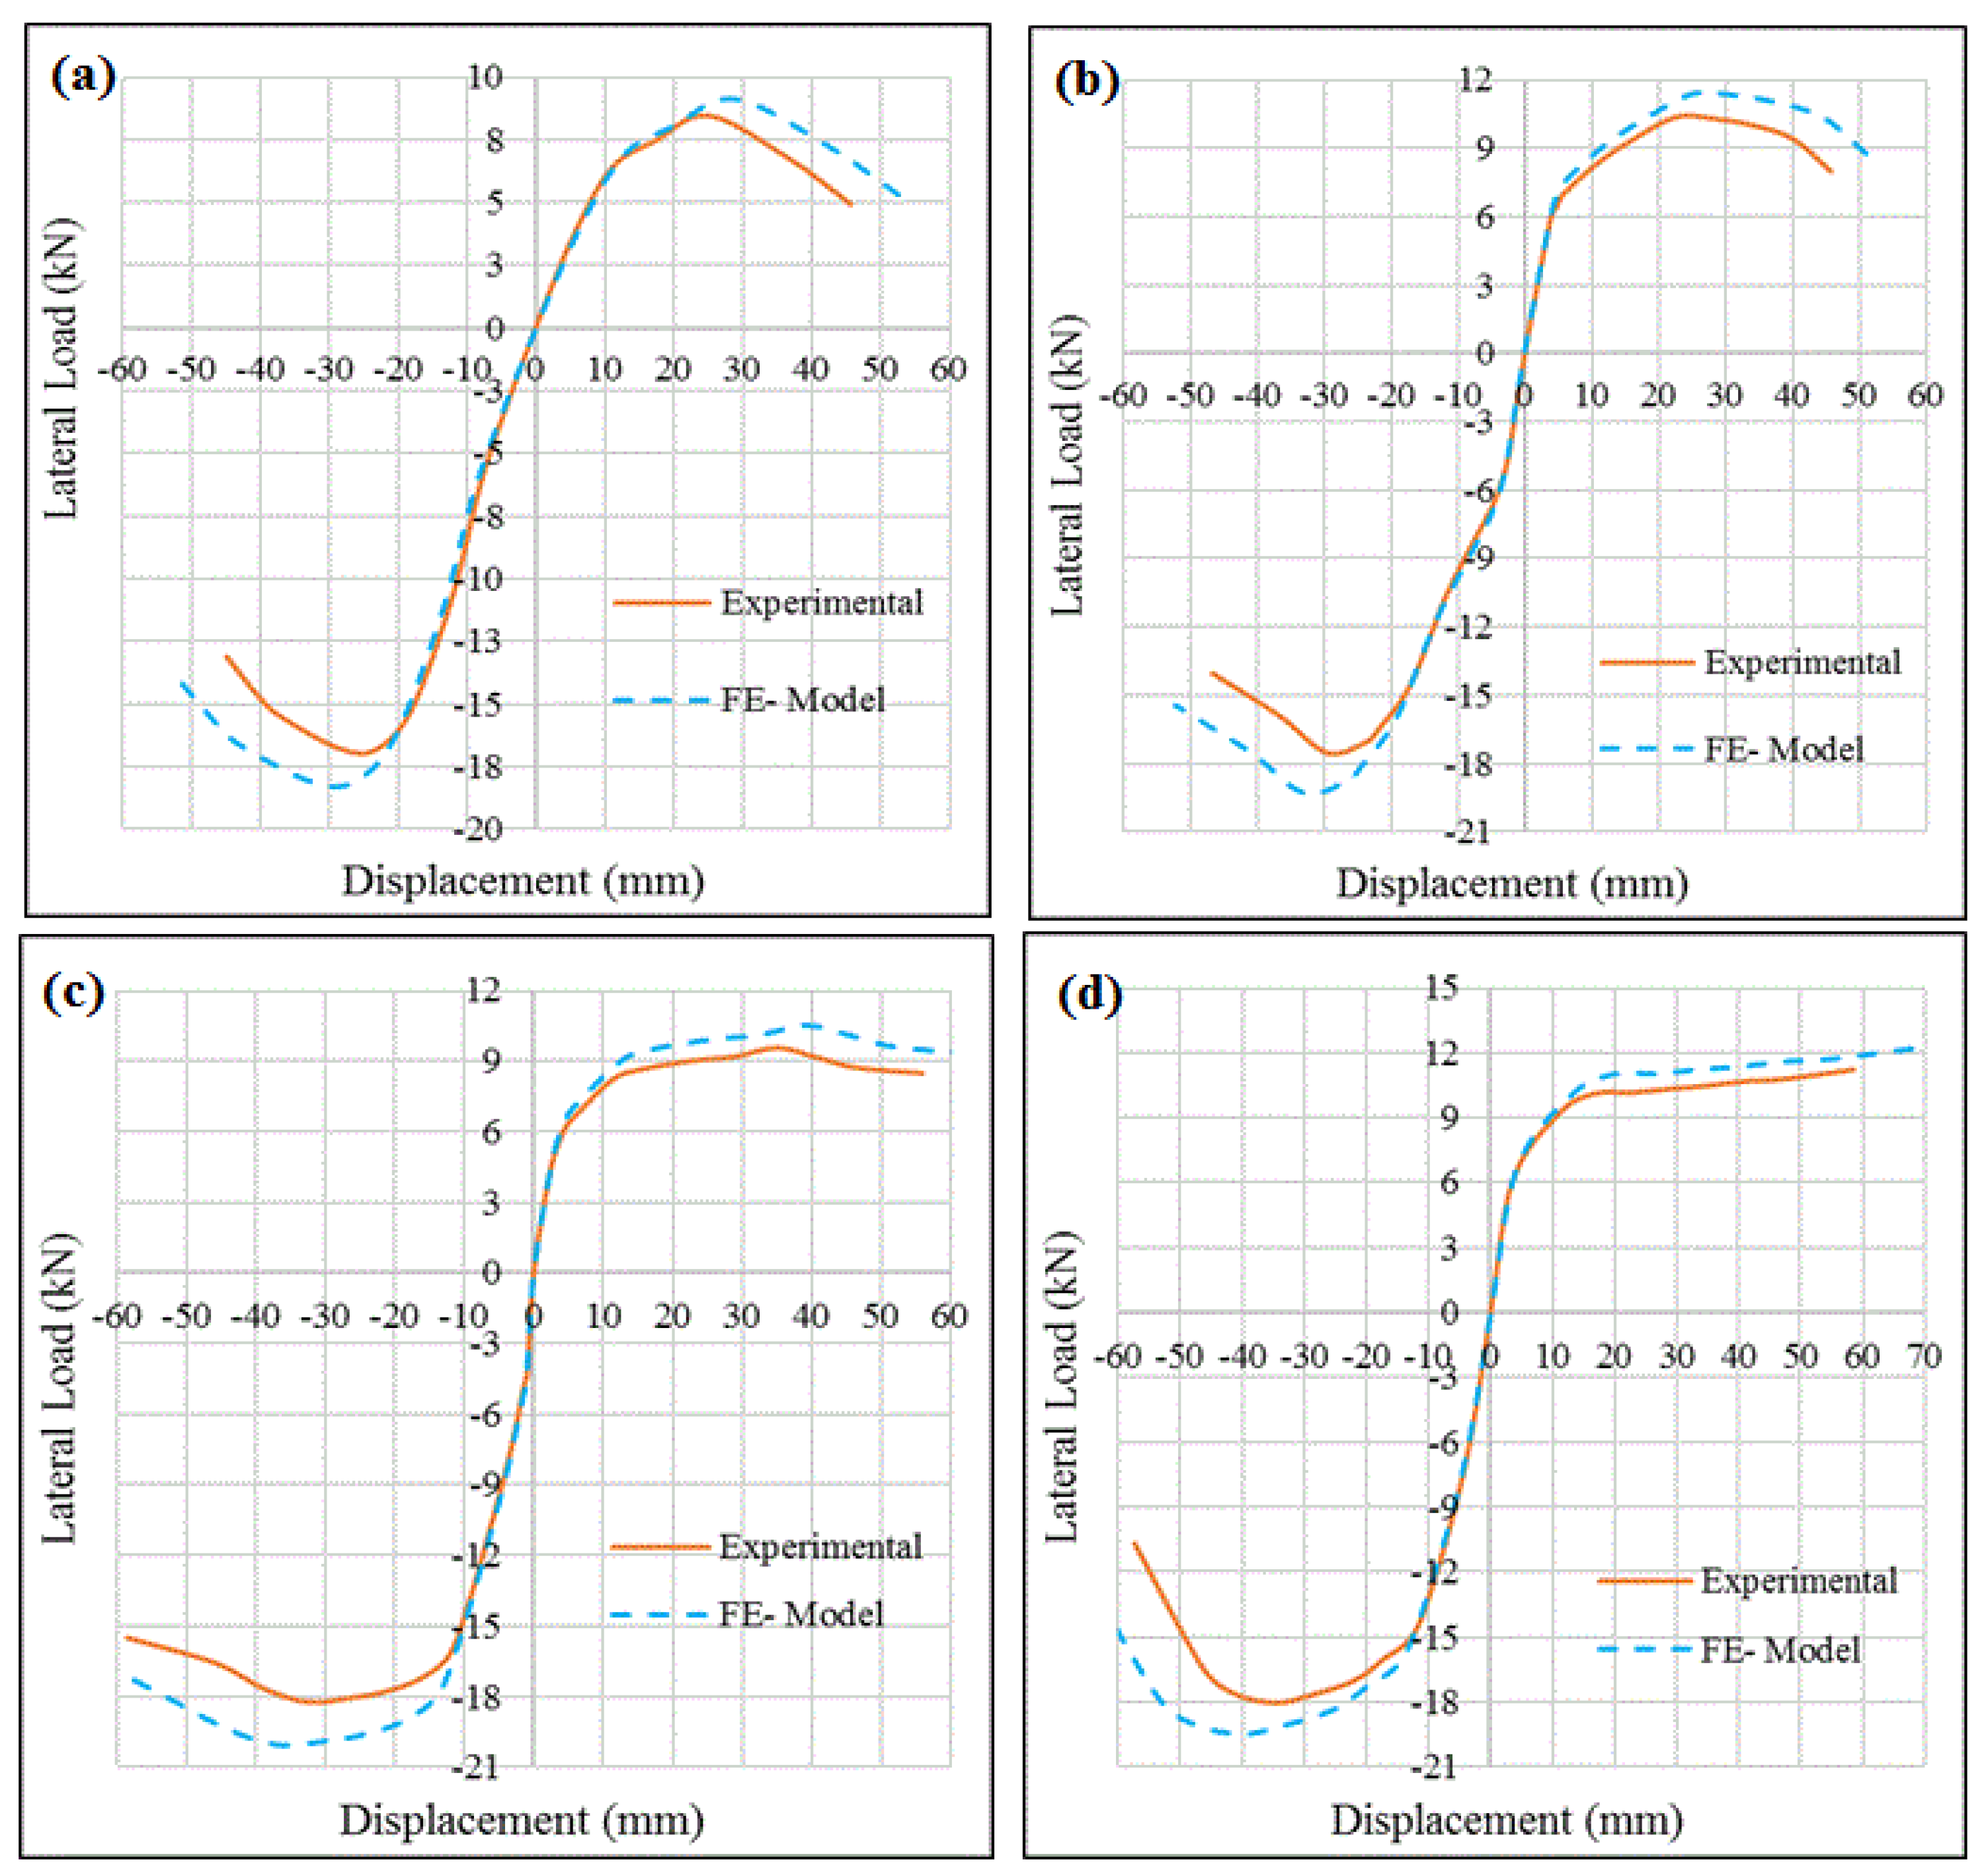
4.1. Verification of the Finite Element Models with Experiments

4.1.1. Force versus Displacement Curves

To confirm the viability of the simulated finite element models, the force–displacement curves of four specimens obtained in the current study were compared with the experimental findings of Trung [58] as shown in Figure 10. The finite element results were observed to be consistent with the experimental ones (Table 3). It was asserted that the simulated finite element model is able to predict the inelastic response of the test specimens. The observed slight difference between the finite element model simulations and experimental results may be due to (1) unexpected occurrences in the experimental work, (2) variables, like the concrete’s tensile and compressive properties selection, (3) the refinement of meshes, (4) the use of idealized boundary conditions in the finite element models, and (5) nonlinearity in the materials’ behavior (materials’ properties modeled in ABAQUS).
Instead of comparing the results of every load cycle, the backbone curve should be developed from the experimental and numerical data for each direction of loading with unique behavior. The curve should be plotted in a single quadrant (positive force versus positive displacement or negative force versus negative displacement; consequently, the backbone curve created by connecting the first cycle peak points with the related displacement is shown in Figure 11. The results indicated that the backbone curve (envelope curve) obtained from the finite element analysis was in good agreement with the experimental results, indicating a considerable correlation at all stages of the lateral cycling loading.
The results of the finite element studies showed that a total of 30 cycles at 12 different drift levels varied from 0 to 10% applied to the specimens. The compression axial load on the column was not considered based on the experimental work. The total deformations that occurred near the top end of the columns were measured with a Linear Variable Differential Transformer as mentioned by Trung [58]. The hysteretic curves were initially linear and elastic. With the increase in displacement, the specimens were converted into an inelastic response due to the occurrence of pinch effects. The experimental and finite element results proved that the NSCBJ specimens were strengthened due to the integration of CFRPCs, displaying a good seismic behavior with endurance strength at the test end. In short, the specimens showed maximum lateral strength and no crushing of the concrete occurred. In addition, the observed difference in the main reinforcement bar that caused the force–displacement curves was different in the positive and negative direction of loading therefore it differed in the lateral resistance of the peaks.
The ideal bilinear drawing demonstrated by Paulay and Priestley and described in Section 3.4 was used to obtain the first yield and ultimate strengths, respectively, from the experimental ( Q y e ) and finite element models ( Q y F E M ). The ultimate strengths from the finite element and experimental model are Q u e and Q u F E M , respectively. The experimental and numerical results showed that the capacity of the seismic design specimen is improved by 32% compared to the non-seismic specimen. Also, the strengthened specimen with one layer of CFRPC showed a maximum ultimate strength of specimen greater than the non-seismic one because of the rise in the strength capacity of the BCJ by 28%. Finally, the specimen strengthened with two layers of CFRPC revealed better performance when the ultimate load reached to 11.2 kN, with an increase in ultimate load capacity by 41% compared to the NS specimen.

4.1.2. Failure Modes

To further verify the finite element models, the failure modes of four joint specimens simulated by ABAQUS were validated by the experimental work (Figure 12, Figure 13, Figure 14 and Figure 15). The model simulation results of the failure modes were in good agreement with the experimental findings, indicating the precision of the established model calculation. According to the experimental results of Trung [58], the failure mode of the NS specimen was the joint shear failure with the beam and column bending cracks. Shear failure of the joint happened because of the transverse reinforcement deficiency in the joint. The specimen designed according to the seismic details showed the beam flexural cracks near the joint. Compared to the non-seismic specimen, the seismic specimen developed more surface cracks in the beam generated from the bending. The shear cracks at the joint for the specimen made with the seismic detail were fewer, due to sufficient joint transverse reinforcement. Thus, it can be concluded that the transverse reinforcement restricted the joint shear failure in the beam. Rao [66] acknowledged that the failure mode in the specimen strengthened by CFRPC is mainly due to the following factors: (1) concrete crushing in compression before the yield of the longitudinal steel bar, (2) the steel yield in tension with the debonding of the CFRPC sheet, (3) the steel yield in tension with the concrete crushing, and (4) the spalling of the concrete cover.
The single-layer CFRPC-integrated specimen showed the improved strength of the beam, column, and joint. In addition, experimental results of the CFRPC-strengthened specimen exhibited fewer cracks because the restraint provided by the two strips [U-shaped] reduced the T-shaped sheets’ debonding in the column. Finally, the presence of CFRPC could debond at a large lateral displacement, classifying the failure mode as steel yield (Figure 14c) in tension with debonding of the CFRPC sheet. The behavior of the specimen made with two layers of CFRPC integration was same as the single-layer specimen, except that there was an improvement in the performance. This was mainly due to the increased confinement of the joint and the reduced shear cracks of the joint, meaning that the specimen attained larger lateral strength compared to the others. To understand the joint performance more precisely, the failure mechanisms of the specimens were assessed while taking the parameters, like concrete tensile and compressive damage, Von-Mises’s stress of the reinforcement, and maximum principal plastic strain. In brief, the finite element models simulated the joint nonlinear behavior appropriately. Figure 12a clearly indicated that the NS beam–column developed joint, column, and beam tensile damage. From the joint to the beam, the concrete exhibited tensile damage. The longitudinal bars in the beam were found to be in tension, while yielding of the transverse joint bars occurred. Concrete damage developed in the joint. The NS specimen failed due to extensive cracking of the concrete at the joint as its ultimate strength was attained. Figure 12b shows the concrete damage under compression. The concrete damage that originated from the repeated loading was cumulative, leading to the strength and stiffness degradation. The principal plastic strain value served as an indicator for the occurrence of cracks in the concrete damage model. The cracks formed for the positive value of the principal plastic strain. Figure 12d shows that the joint failed in the concrete diagonal crack region, which refers to the same crack pattern obtained by the finite element model (Figure 12e).
Figure 13a revealed that the SD beam–column suffered from beam tensile damage wherein the concrete’s tensile damage mostly spread in the beam. The yielding of the longitudinal bars occurred without yielding of the transverse joint bars (Figure 13c). In addition, the concrete’s damage developed in the joint. The failure of this specimen occurred due to cracking of the concrete beam. The principal plastic strain showed the formation of cracks in the beam which is very similar to the crack pattern obtained by the finite element model (Figure 14d).
Figure 14 and Figure 15 elucidate the finite element output and comparison between the failure mode at ultimate strength for the specimens strengthened by one and two layers of CFRPC. The stress contribution of the CFRPC sheet to the concrete was observed, damaging the concrete under tension. The compression value of the CFRPC specimen was lower compared to the NS specimen. This finding indicated that the cracks in the CFRPC-integrated specimen were lower than the NS specimen, as mentioned above. In addition, the maximum plastic strain distribution for the specimen was mainly concentrated at the beam end and joint, indicating the appearance of same crack pattern as observed in the experiment.

4.2. Requirement of ACI 374.1-05

To achieve a joint that can be used in the high seismic risk area, the test results obtained by Trung were checked with the ACI 374.1-05. According to this standard, three criteria including energy dissipation, strength, and stiffness must be checked.

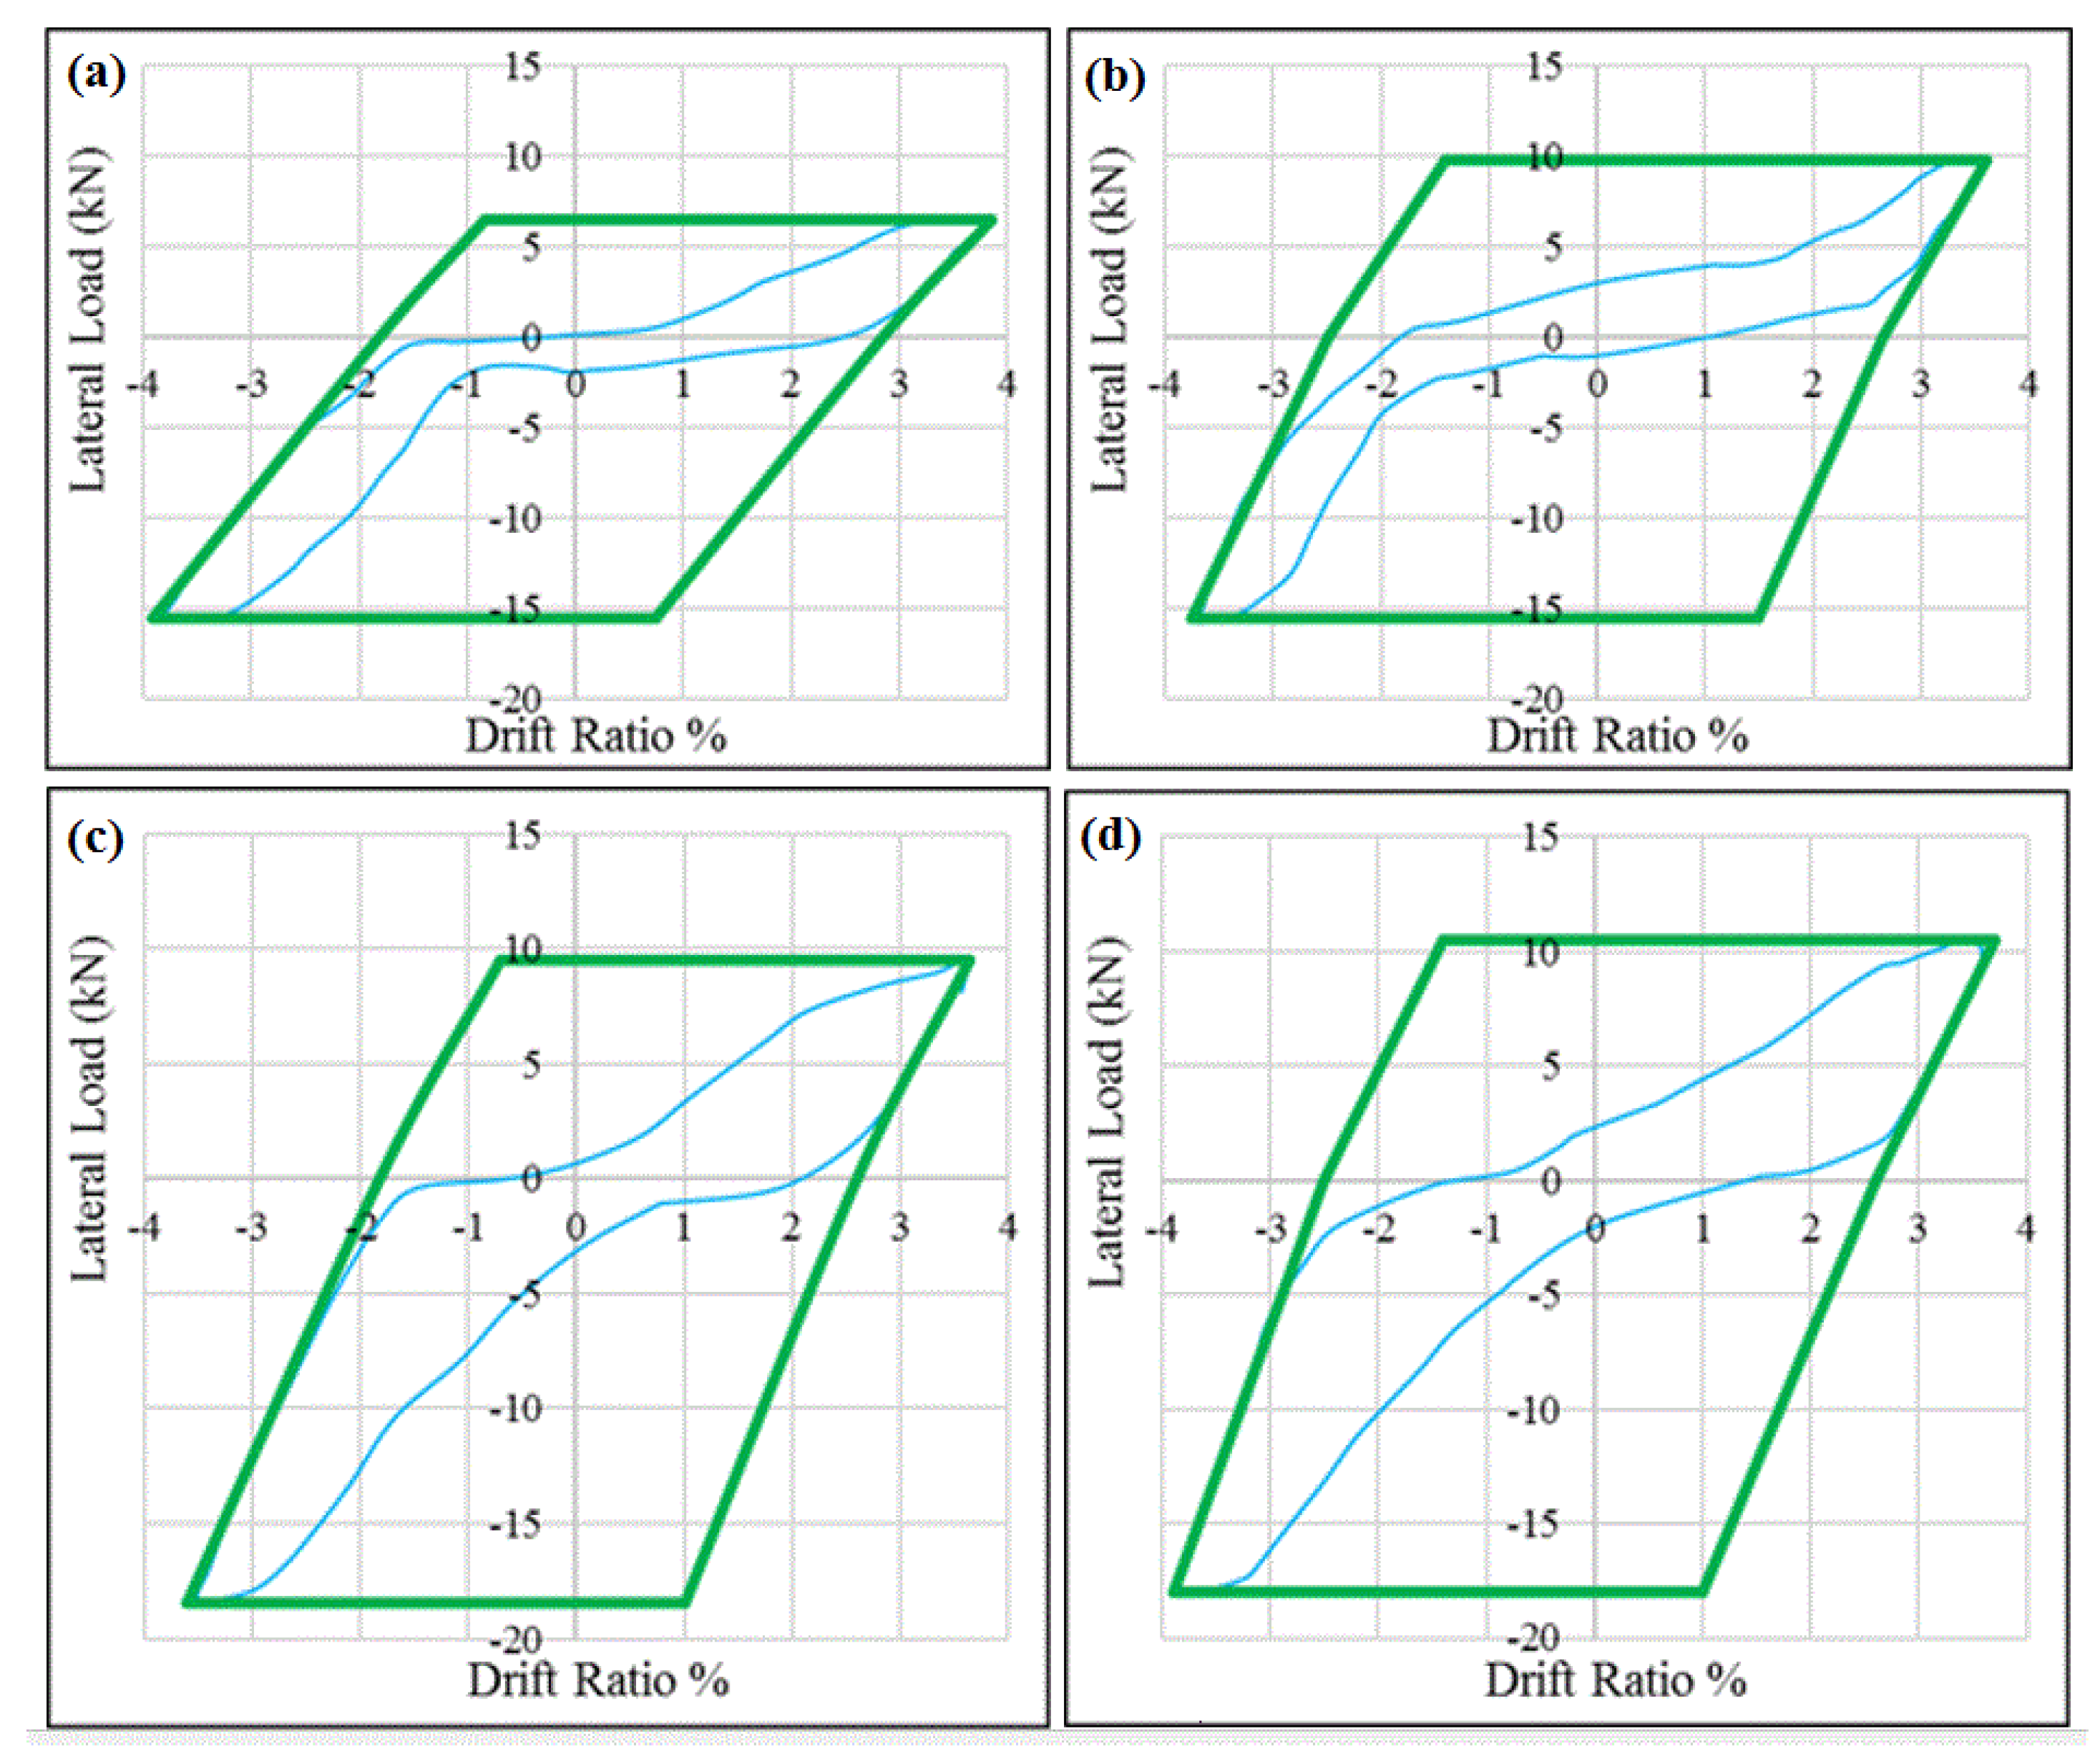
4.2.1. Relative Energy Dissipation

To ensure that the joints have a good damping after seismic action, relative energy dissipation at 3.5% of the drift ratio must exceed 0.125. If the beam–column joint fails to meet this condition, the structure will experience excessive oscillation after a seismic event. The dissipation energy in the cycle represents the elastic–plastic behavior. ACI 374.1-05 stipulates that the energy is calculated from the hysteric curve area at drift ratio of 3.5% (area parallelogram). The parallelogram was created by two horizontal lines and four parallel lines, with first positive stiffness on the upper parallel lines and initial negative stiffness on the bottom parallel lines. Figure 16 shows the calculated relative energy dissipation obtained from the definition of the parallelograms. Table 4 displays the specimens’ relative energy dissipation ratios.
The obtained relative energy ratio values in the table are above 0.125, which clearly shows that the specimens could meet the requirement of the standard. This can be assigned to the design of the specimens that follow the criteria of a weak beam/strong column. Consequently, plastic hinges can occur at the end of beam near joint, making the energy dissipation in plastic hinge region. In addition, transverse joint reinforcement was observed to reduce the joint shear distortion and joint cracks, resulting in higher performance of the specimens made using seismic details compared to the non-seismic specimens. The better energy dissipation obtained in the specimen strengthened by two layers of CFRPC can be ascribed to the increase in the confinement of the joint by double layers of CFRPC integration.

4.2.2. Strength Criteria

In the standard mandates, the test specimen model must adhere to the principle of a strong column and weak beam. The maximum lateral load of the model specimen ( E m a x ) must be lower than λ E n (where E n represents the nominal strength of the specimen calculated using a strength reduction factor of 1 and where λ is the percentage ratio of column strength to beam strength). Trung’s test result revealed that the lateral load varies in the positive and negative loading directions, thus necessitating separate checks for   E m a x in each direction. Table 5 shows the evaluation of the strength criteria. The specimen meets this requirement since the value of E m a x was below λ E n . The failure mode of NS is the flexural crack of the beam followed by shear failure in the joint. For the CFTPC-strengthened specimen, the crack was smaller in the retrofitted area. Thus, the obtained values of λ indicated the occurrence of beam flexural failure in the specimen.
The joints must meet the requirement of the strengths degradation as specified by the standard. The strength degradation of the joints is assessed at a drift level of 3.5% (Table 6) and should exceed 0.75 E m a x for the same loading direction. The results in Table 6 showed that the NSCBCJs failed to satisfy the strength criteria. Conversely, in the specimens strengthened by CFRPC and seismic details, the beam–column joint met the strength criteria. The deficiency in transverse reinforcement in the joint led to a high loss of lateral resistance capacity at a later stage. In the NS specimen, the value strength dropped dramatically by about 58% at a drift ratio of 3.5% due to the cracking of the concrete joint. The reason for an abrupt reduction in the strength value might be due to the bond failure of the longitudinal reinforcement. On the contrary, the CFRPC-strengthened specimens achieved excellent strength values due to the increased confinement provided by the CRFPC to the joint, thereby leading to a reduction in the joint cracks and bond failure.

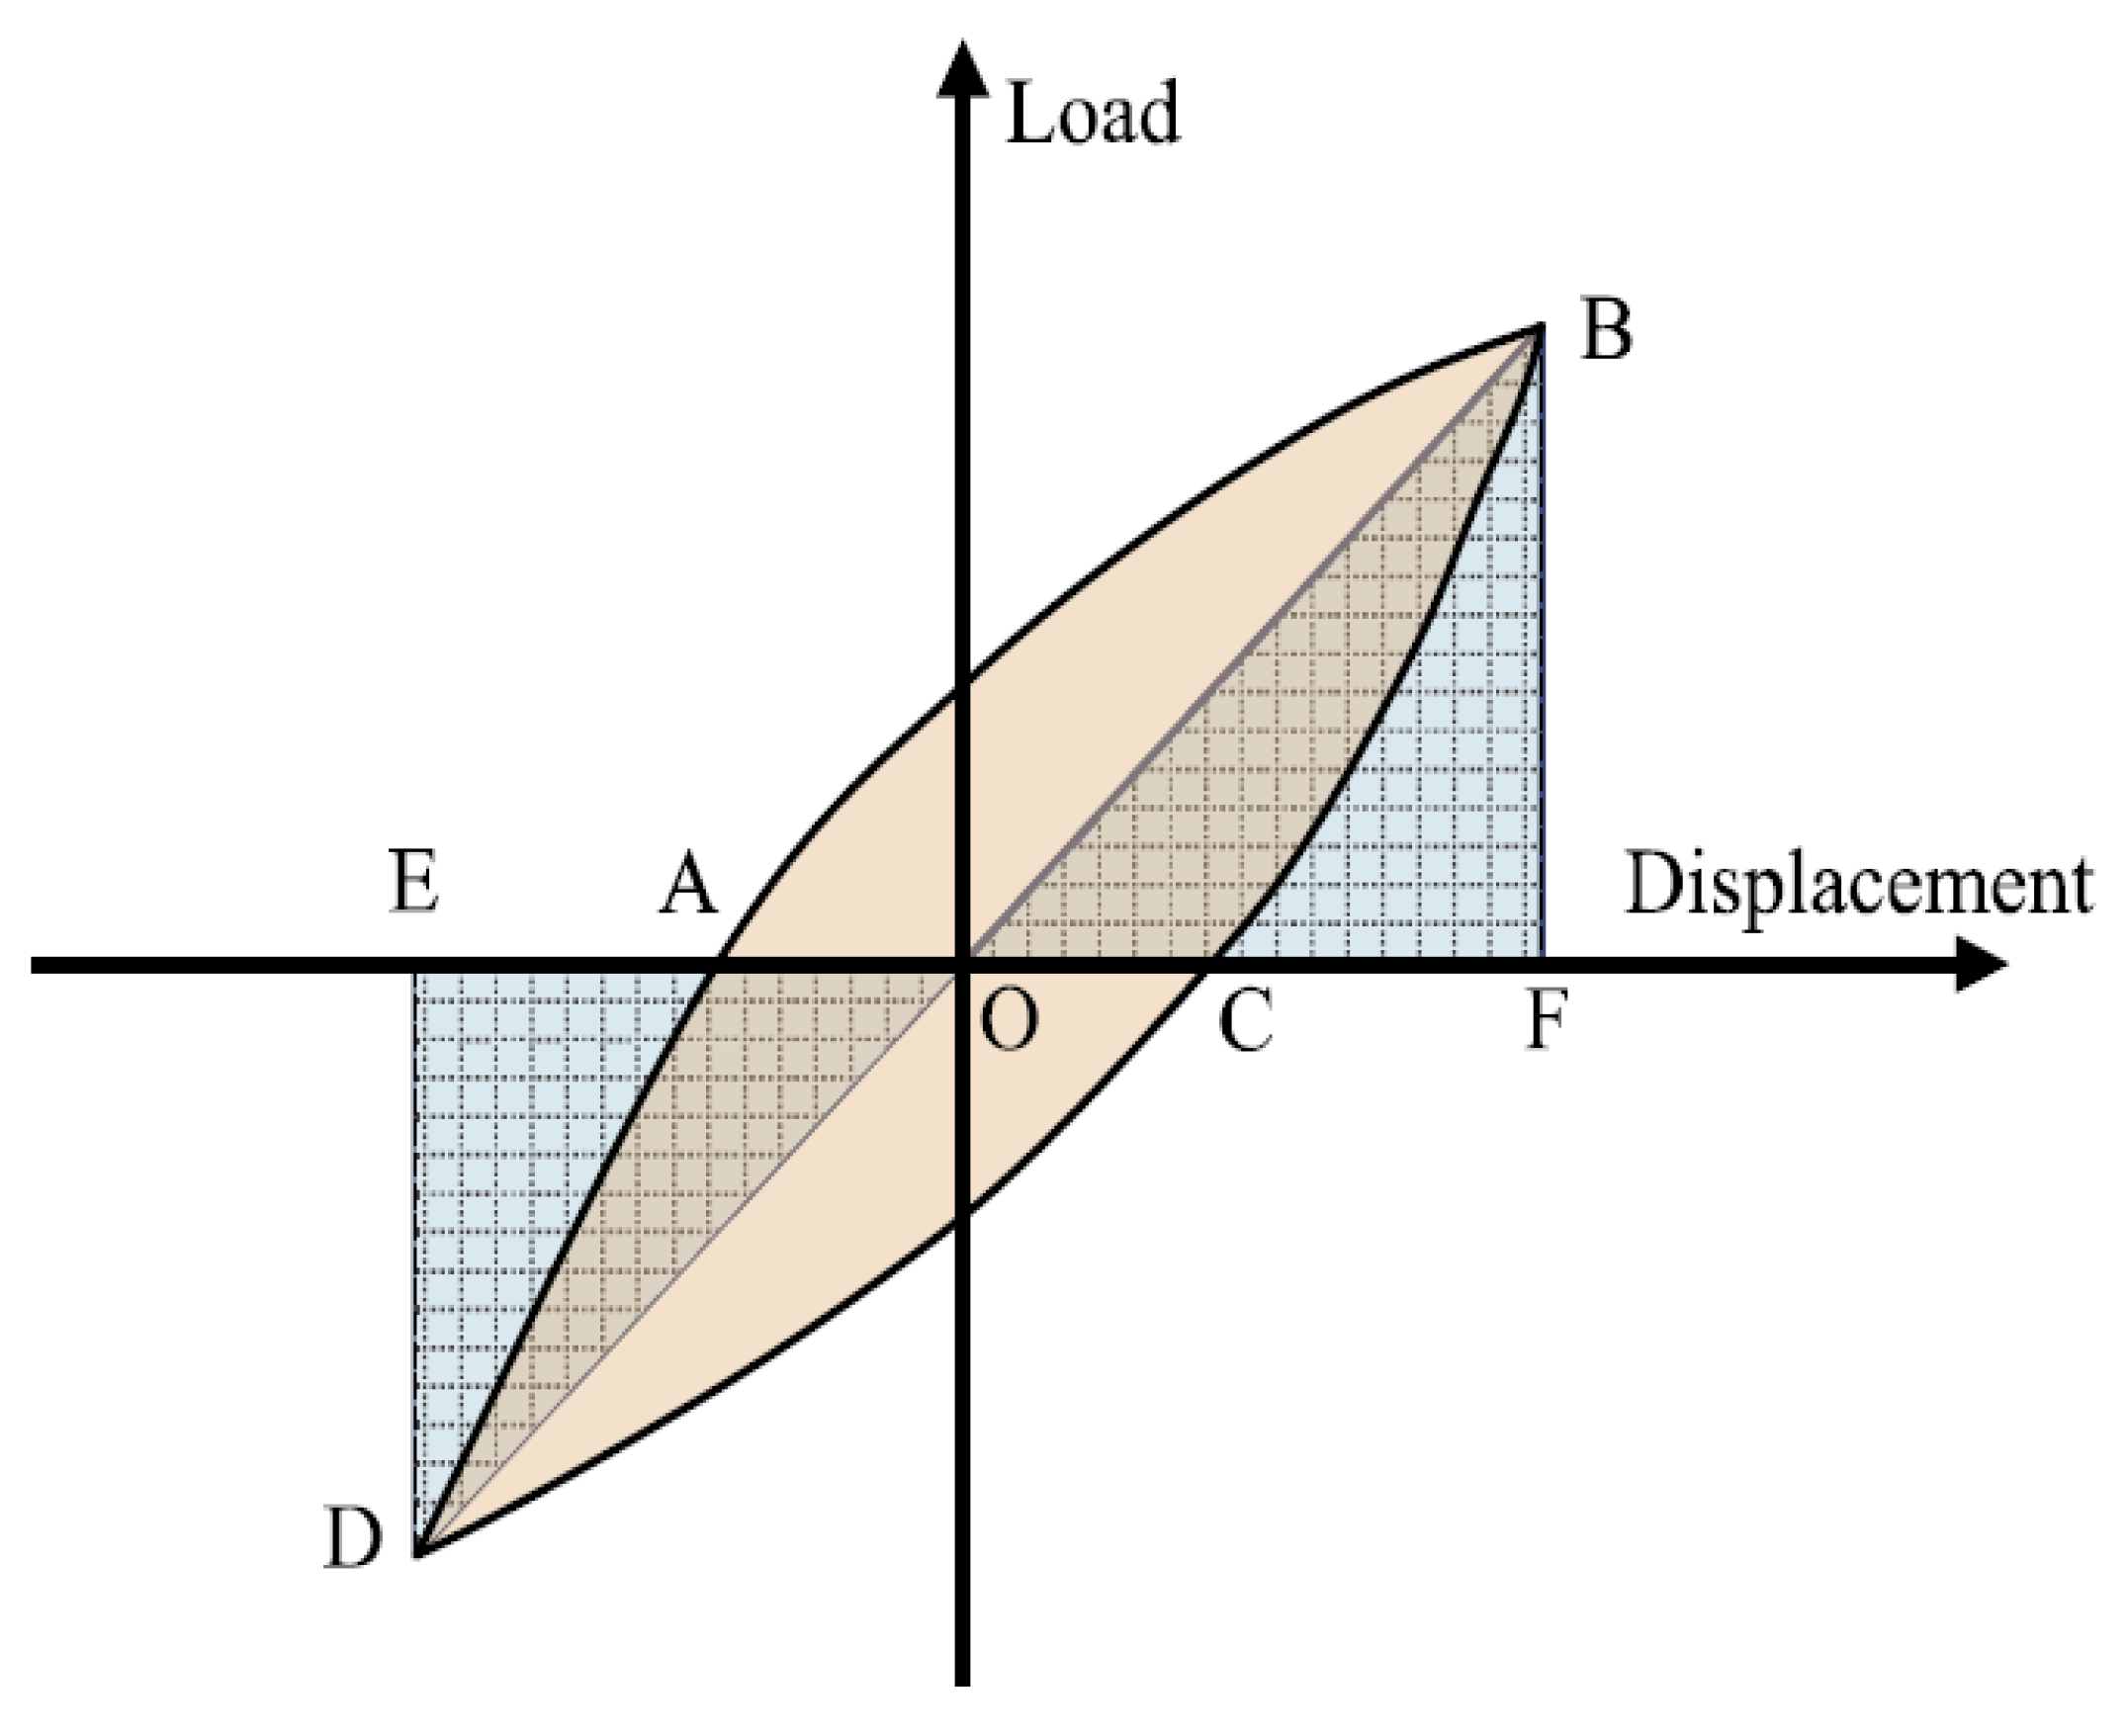
4.2.3. Stiffness Criteria

After the seismic action, damage occurred in the frame structure during a large lateral displacement under a small lateral load. To overcome this effect, the standard requires that the stiffness of the joints be high (0.05) compared to the initial stiffness. The standard requires that the criterion be checked at a drift range of −0.35% to 0.35% using the secant stiffness, and it must meet the prescribed limitation. The initial positive and negative stiffnesses were calculated by dividing the load per associated displacement. Table 7 shows the results for the stiffness criterion validation of the joints, wherein the specimens were observed to satisfy this criterion. Comparing the seismic and strengthened specimens against the specimen made with non-seismic details against the requirement of ACI 374.1-05 for stiffness, it was found that the non-seismic joint had lower initial and secant stiffness due to the lack of transverse reinforcement in the joint. The specimen with seismic details demonstrated a good performance, since this specimen was designed by providing the reinforcement according to the requirement of the ACI 318-19, wherein the transverse reinforcement reduces the cracks in the joints area leading to an increase in the stiffness. This improvement was attributed to the presence of CFRPC, which enabled us to increase the strength of the beam, column, and joint. Consequently, the stiffness was increased. In short, the CFRMC-strengthened specimens demonstrated improvements in their initial and secant stiffness values.
The main remarks obtained from the data analysis can be described as follows: (1) the CFRPC-strengthened specimens showed an increase in lateral resisting force without any spalling of concrete; (2) compared to the non-seismic specimens, both CFRPC-strengthened specimens displayed a good amount of energy dissipation, which was increased from 40 to 57%; (3) at the end of loading, the secant stiffness of the CFRPC-strengthened specimens was higher than that of the non-seismic specimen, indicating an increase in their initial stiffness; (4) a comparative evaluation of the acceptance criteria of ACI 374-05 showed that the specimens with seismic details achieved superior seismic performances.

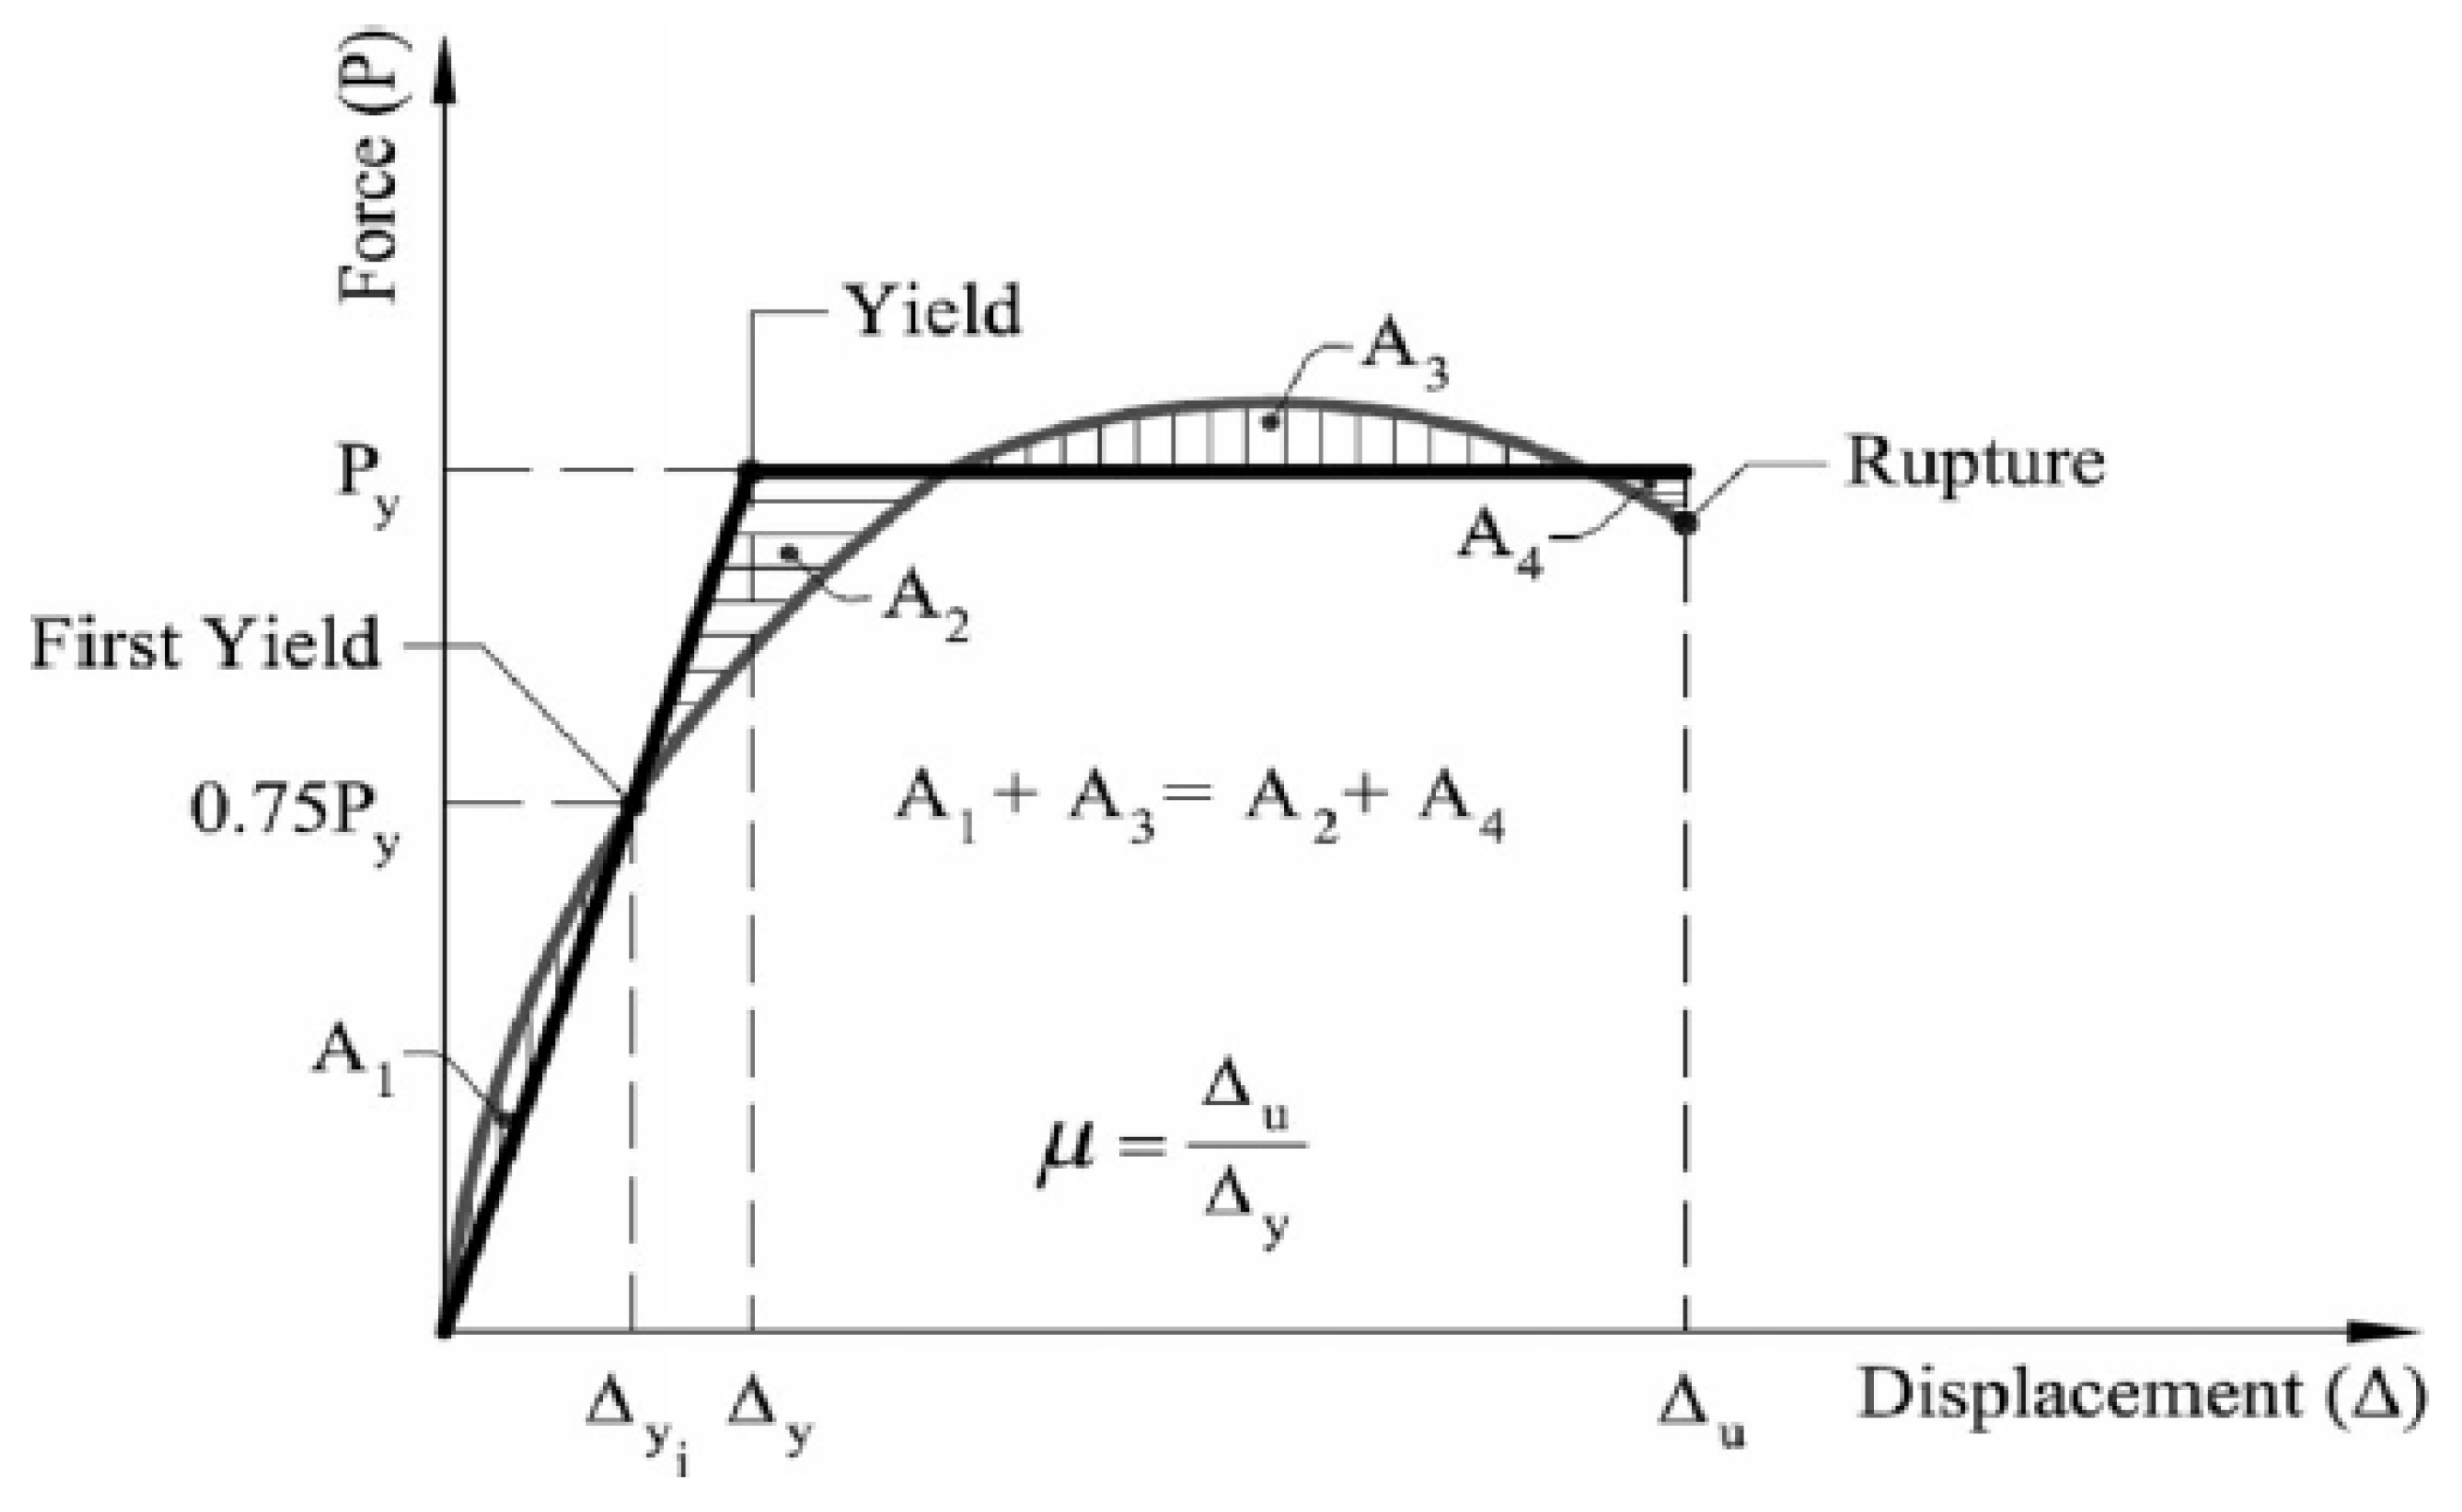
4.2.4. Effective Elastic Stiffness and Displacement Capacity

The backbone curve of all specimens was developed depending on the data obtained from the experiential study by Trung. The results were verified using the finite element model calculation for each loading direction, revealing a unique behavior. The curve was plotted in a single quadrant (positive force with associated positive displacement, and negative force with associated negative displacement) and the backbone curve was created by connecting the first cycle peak points from each drift level (Figure 17). The backbone curve provided the information related to the peak load ( P y ) in each loading direction, effective elastic stiffness (Ke), yield displacement ( Δ y ), ultimate displacement ( Δ u ), and displacement ductility factor (µ). The determination of the yield displacement was challenging due to the absence of a clear yield displacement in the load-displacement curve of a joint. To begin with, the nonlinear capacity curve was simplified by representing it as a bilinear curve that included a specified yield displacement. The values of ( Δ y ) for various specimens were calculated following the recommendation of Paulay and Priestley [67]. Figure 18 illustrates an idealized bilinear curve for the joints, which is then utilized to derive the ductility parameters. The values of Ke were determined using the tangent line of the secant slope from the original point and the point when the line had 0.75 of the yield load, where Δ y i is the displacement corresponding to 0.75 P y in the ascending part of the tangent line. The following relation must satisfy the intersection of the horizontal by trial and error of the line drawn in the failure part to the line drawn from the original by slope provided the Δ y .
A1 + A2 = A3 + A4
The specimen’s displacement ductility factor (µ) was calculated by dividing its ultimate displacement by the yield displacement via the following equation:
μ =   Δ u Δ y
The bilinear diagram was used to represent the backbone curve. The effective stiffness ( K e ) and the deformation capacity ( Δ y , Δ u , and µ) in the negative and positive loading directions of the specimens are enlisted in Table 7. The results clearly indicated that the ductility factor ranged from 3.10 to 6.16, which was larger than the suggested ductility for reinforced concrete structures (µ ≥ 2) as obtained by Peng, Zhong, et al. [68]. It can be asserted that the ductility of the specimens was higher than the suggested ductility for the reinforced concrete type of structures. Also, the CFRPC-strengthened specimens and the specimen with seismic details had higher ductility factors compared to the non-seismic specimen. Table 8 shows the values for the effective stiffness ( K e ) and the displacement capacity ( Δ y , Δ u ) in both the negative and positive loading directions for the specimen. The effective stiffness of the CFRPC-reinforced specimens was observed to be higher than that of the non-seismic specimen, which was mainly due to the presence of CFRPC in the structure, leading to an enhancement in the strength performance of the specimen. The specimen containing two layers of CFRPC showed higher effective stiffness than the specimen designed with one layer of CFRPC. The effective stiffness of the specimen designed with seismic details was higher than that of the non-seismic specimen. This strength enhancement can be ascribed to the seismic reinforcement details of the specimen.

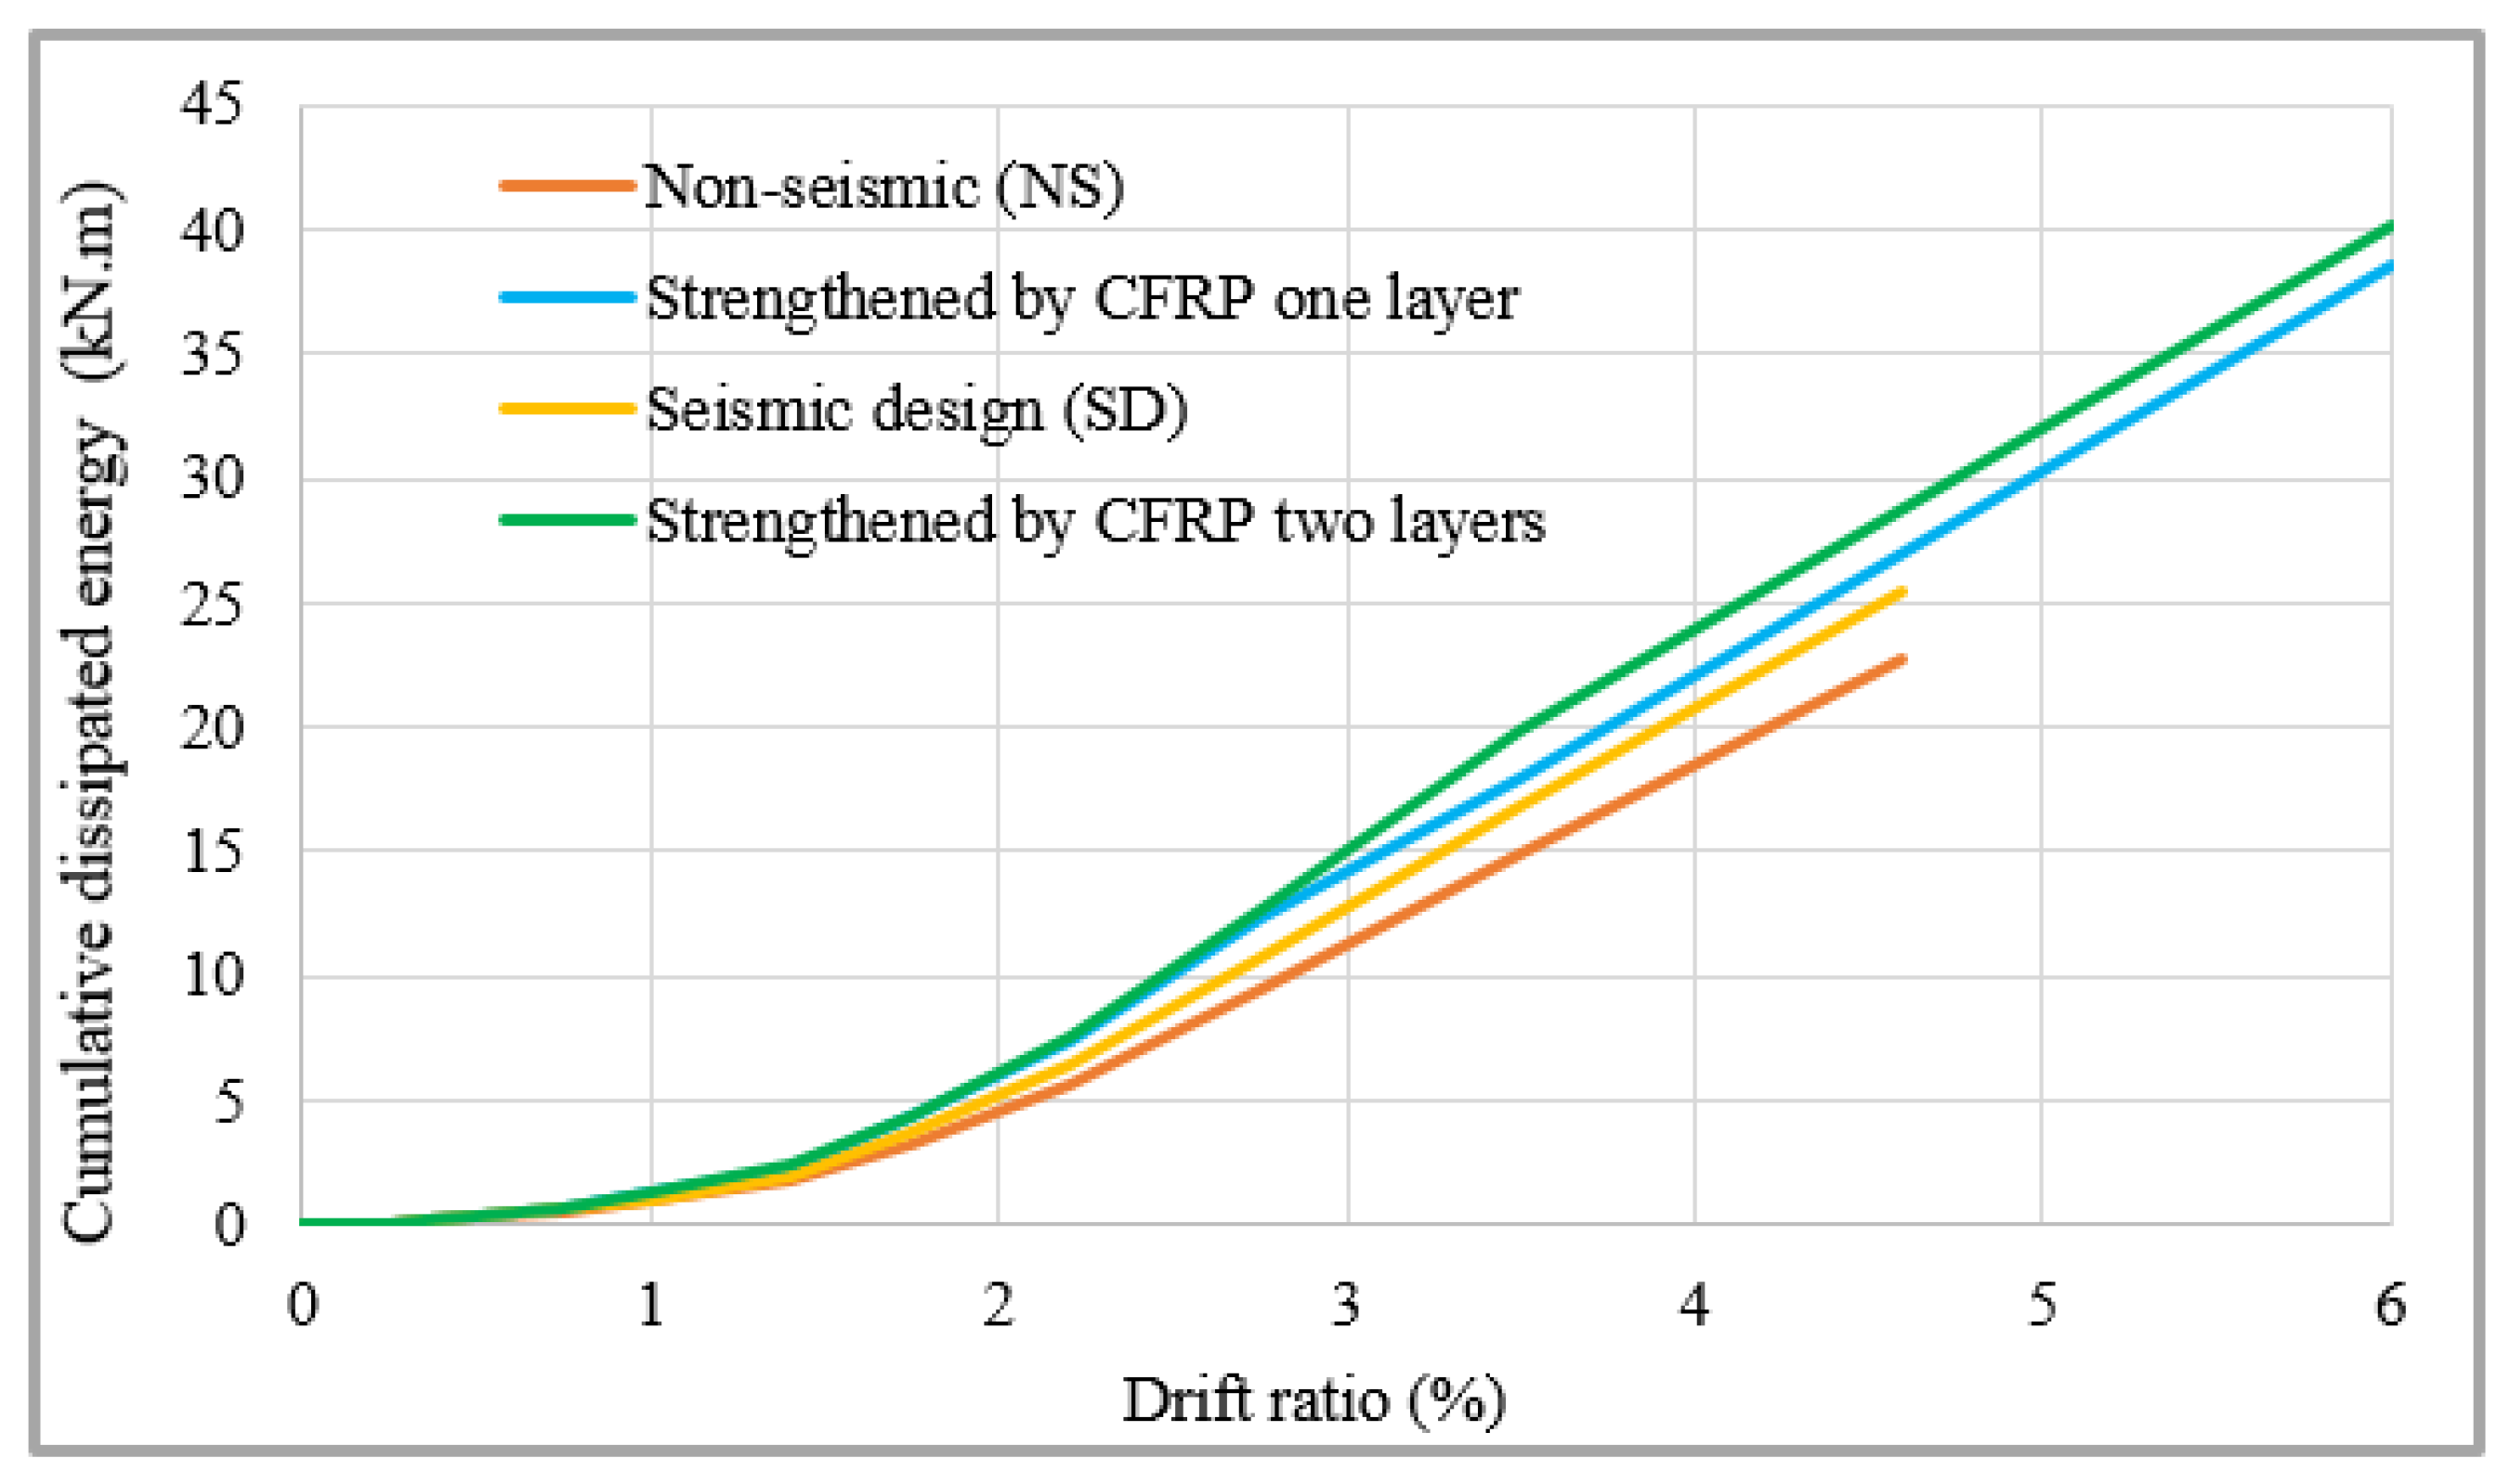
4.2.5. Damping Ratio and Energy Dissipation

Figure 19 shows the drift ratio-dependent variation in the cumulative dissipated energy of various specimens. The energy dissipation capacity was determined using the enclosed loop area of each specimen in the hysteresis curve. The non-seismic specimen experienced pinching behavior during testing. This observation can be mainly attributed to the occurrence of cracks in the joint, leading to a decrease in the energy dissipation in the specimen. The presence of CFRPC significantly increased the energy dissipation. At the final loading, the energy dissipation capacity of the two-layer CFRPC-integrated specimen was approximately 43% higher than the one obtained for the non-seismic specimen. In addition, the one-layer CFRPC-strengthened specimen showed an increase in energy dissipation of 25% compared to the non-seismic specimen. Generally, the specimens reinforced with CFRPC exhibited a greater ability to dissipate the energy compared to the non-seismic specimen. In brief, the specimens reinforced with CFRPC displayed higher flexural strength due to the presence of CFRPC material at the beam–column junction, producing an enhanced energy dissipation. It is worth noting that the energy dissipation was directly impacted by the presence of transverse reinforcement in the joint. During the final loading stage, the seismic specimen exhibited an energy dissipation capacity approximately 20% more than that of the non-seismic specimen. Essentially, the confinement effect on the core concrete was enhanced by the transverse reinforcement, leading to a reduction in joint cracking. In contrast, the non-seismic specimen showed a smaller energy dissipation compared to the others until the end of the test.
Figure 20 shows the simplified hysteresis loop that consists of the lateral load versus the displacement. The equivalent damping coefficient ( h e ) of the studied specimens was calculated to evaluate the actual energy dissipation ability via the following equation:
h e = 1 2 π S ABC + S CDA S OBF + S ODE
where S A B C is the area of the curve ABC (Figure 20), wherein similar definitions were used for S C D A , S O B F , and S O D E .
Figure 21 shows the drift ratio-dependent variation in the equivalent damping coefficient. The value of ( h e ) is about 0.1 for the normal reinforcement concrete joints and 0.3 for the joints with steel beam reinforcement concrete columns joints [68]. The obtained results indicated that the joints’ capability for energy dissipation was within the range of reinforcement concrete joints and that it was lower than that of steel beam reinforcement concrete column joints. In the present case, the non-seismic specimen showed lower values of ( h e ) compared to other specimens, while the two-layer CFRPC-strengthened sample showed the best performance.

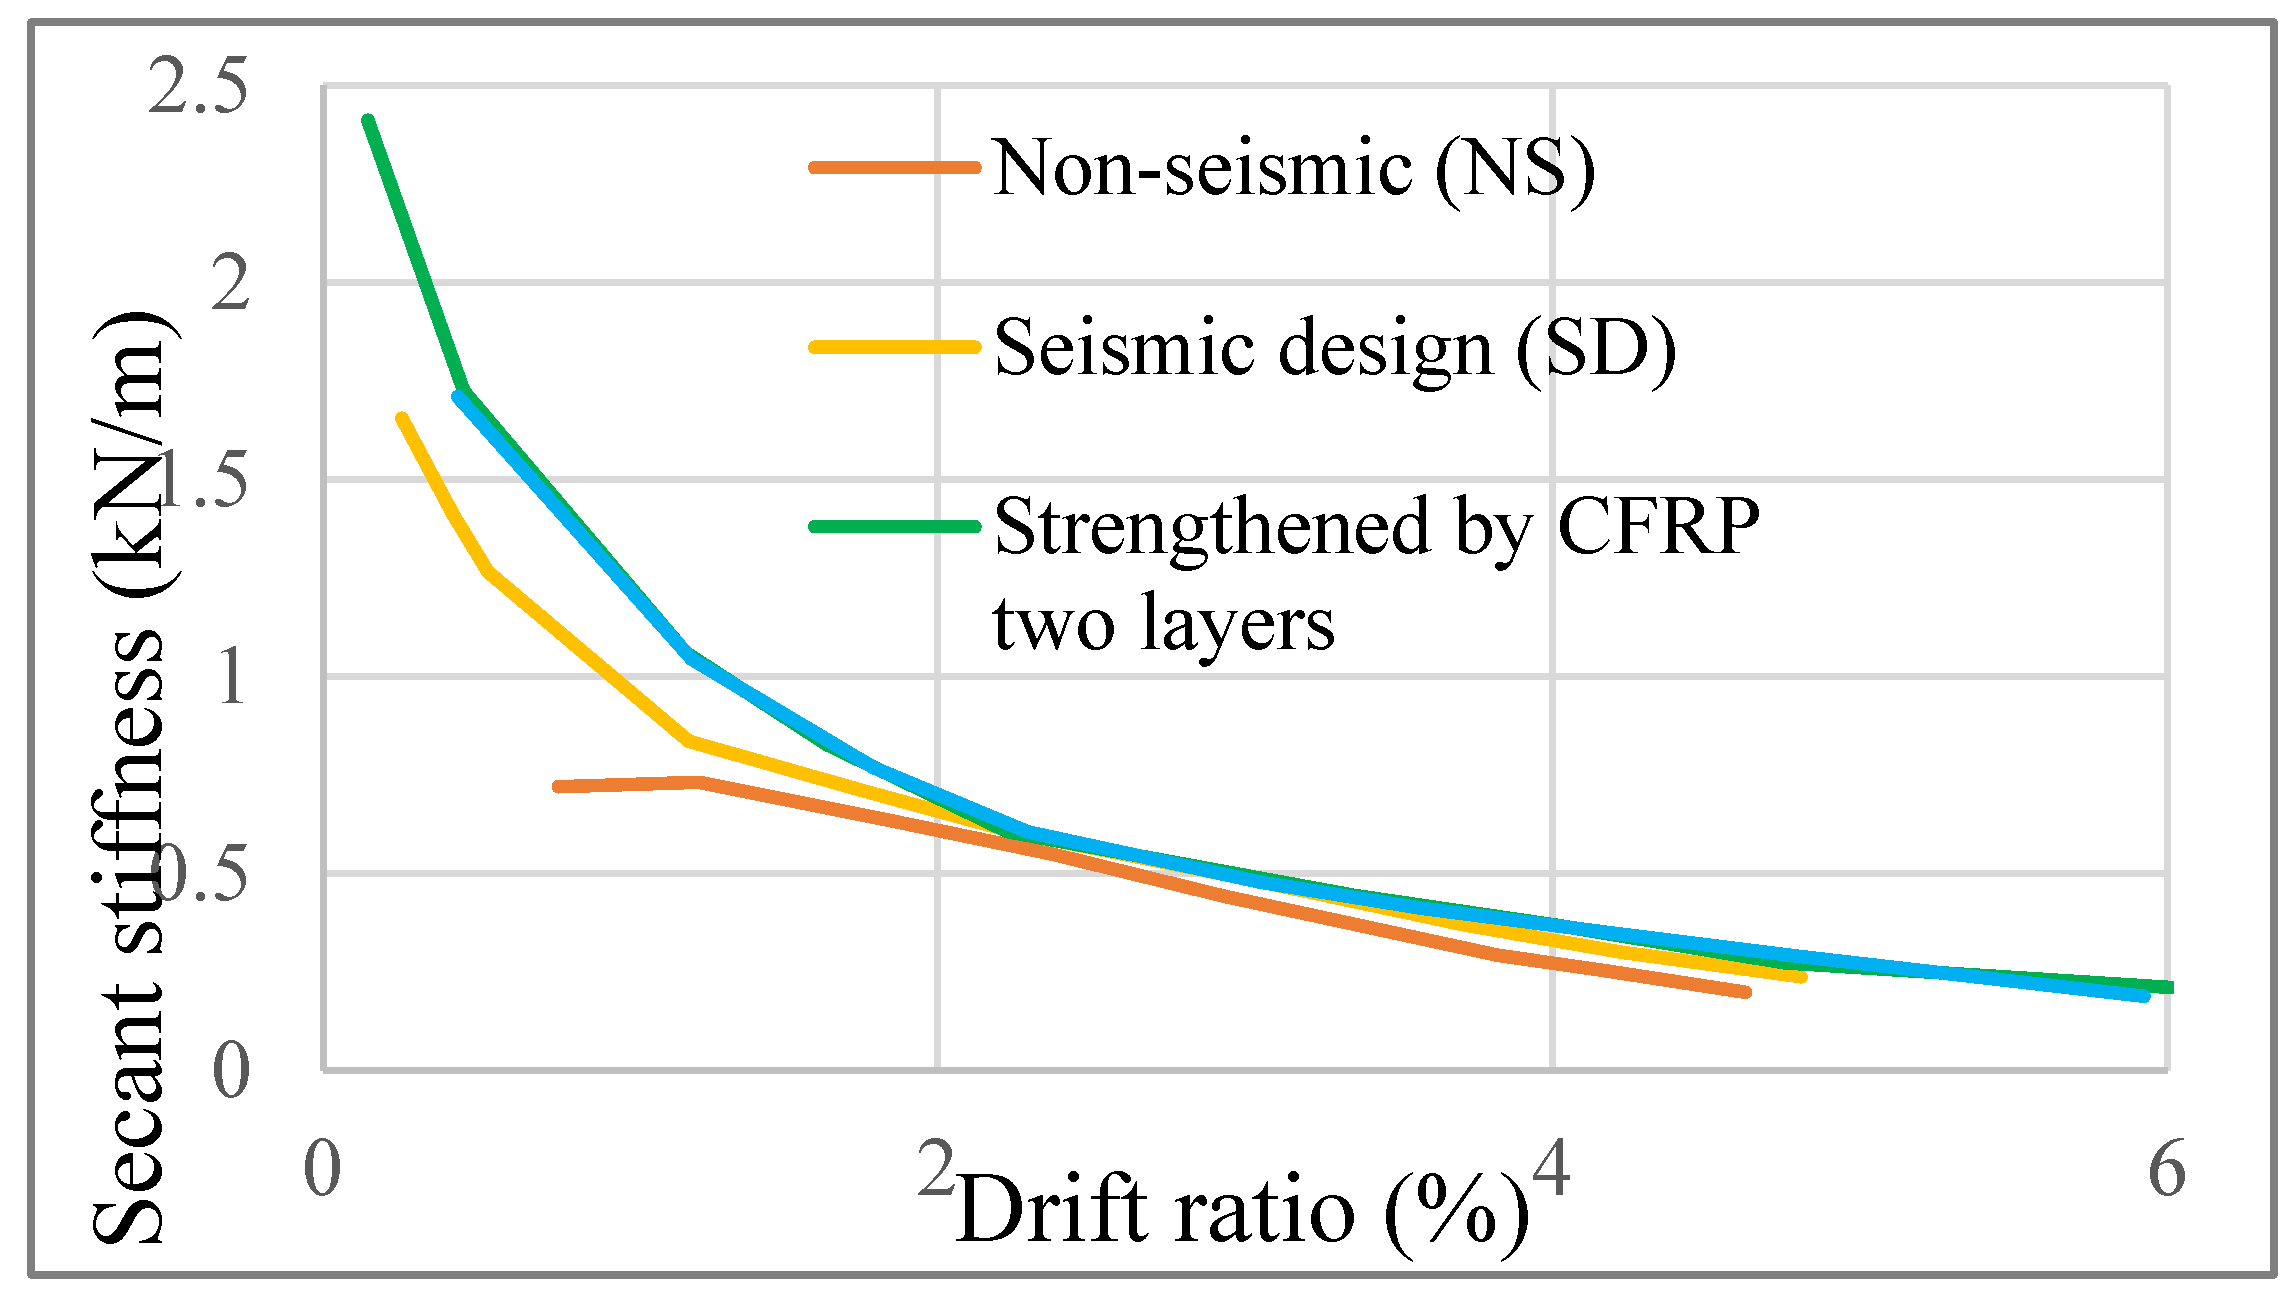
4.3. Stiffness Degradation

Figure 22 displays the drift ratio-dependent variation in the secant stiffnesses for all the studied specimens. The degradation of the secant stiffness for the beam–column joint in each loading cycle was computed using the following equation:
K i j = + F i j + F i j + Δ i j + Δ i j
where + F i j , ( F i j ) is the positive (negative) peak load and + Δ i j , ( Δ i j ) is the displacement associated with the positive (or negative) ultimate lateral strength [34].
The degradation of the secant stiffness values for all specimens increased with the increase in drift ratio (lateral displacement) at various load steps, significantly impacting the specimens’ stiffness degradation. The stiffness of the specimens was reduced with the increase in the load step. The non-seismic specimen showed lower stiffness than other specimens. Specimen strengthened by two layers of CFRPC showed higher stiffness, since all the specimens had the same value in terms of the beam reinforcement ratio. In essence, the confinement given by the presence of CFRPC to the beam–column joint could mitigate the distortion of the joint panel, hence enhancing its strength and reducing crack formation in the surrounding area. In short, CFRPC-integrated NSCBCJs showed improved performance against seismic events.

5. Conclusions

Based on the obtained results, the following conclusions can be drawn:
  • The strengthening of NSCBCJs using CFRPC reinforcement enabled us to reduce crack formation in the plastic hinge location, thus leading to a reduced risk of building collapse during seismic events. The plastic hinges for the frame of the reinforced concrete building were placed near the column and beam joint.
  • The strengthening of the NSCBCJs was appropriate when assessing the behavior of non-seismic details due to the overall lateral displacement increase that produces an increase in ductility demand.
  • The NSCBCJs being non-ductile meant that they could display large lateral displacement which can be attributed to the significant cracks and deformation of the joint area. Consequently, the observed large lateral displacement can cause severe failure in the frame building during strong seismic vibration.
  • The proposed NSCBCJs showed significant joint shear failure together with the beam and column flexural failure. However, the seismic joint failure was beam flexural, while CFRPC-integrated joints showed beam flexural failure with the debonding of the CFRPC sheet. Since the studied joints had beam flexural strength, the lateral load capacity difference can be mainly ascribed to the transverse reinforcement and strengthening of the joint.
  • Both seismic and CFRPC-strengthened joints revealed good strength, stiffness, ductility, and energy-dissipation capabilities.
  • Both seismic and CFRPC-strengthened joints achieved the required seismic code provisions of ACI 374.1-05. Conversely, the NSCBCJs failed to satisfy the desired requirement due to a failure in achieving the strength criteria.
  • The finite element model simulation results for the stress and strain response demonstrated the considerable impact of CFRPC integration into NSCBCJs, leading to a reasonable strength capacity enhancement in the joints, thereby reducing the joint cracks.
  • It is established that the present comprehensive numerical modeling and simulation study may contribute to the development of CFRPC-reinforced high-performance anti-seismic CBCJs, thus contributing towards the sustainable construction sector.

Author Contributions

Conceptualization, N.A.S.A. and A.A.K.; methodology, N.A.S.A.; software, F.H.M.; validation, A.A.K. and F.H.M.; formal analysis, N.A.S.A.; investigation, N.A.S.A.; resources, N.A.S.A.; data curation, N.A.S.A.; writing—original draft preparation, N.A.S.A.; writing—review and editing, A.A.K.; visualization, F.H.M.; supervision, A.A.K.; project administration, N.A.S.A.; funding acquisition, A.A.K. All authors have read and agreed to the published version of the manuscript.

Funding

This research received no external funding.

Institutional Review Board Statement

Not applicable.

Informed Consent Statement

Not applicable.

Data Availability Statement

The original contributions presented in the study are included in the article, further inquiries can be directed to the corresponding author.

Acknowledgments

The authors thank Basrah University for them support.

Conflicts of Interest

The authors declare no conflicts of interest.

References

  1. Sultan, H.K.; Huseien, G.F. Minimum Shear Reinforcement for Reactive Powder Concrete Beams. Eng 2024, 5, 801–818. [Google Scholar] [CrossRef]
  2. Cascardi, A.; Verre, S.; Sportillo, A.; Giorgio, G. A Multiplex Conversion of a Historical Cinema. Adv. Civ. Eng. 2022, 2022, 2191315. [Google Scholar] [CrossRef]
  3. Sultan, H.K.; Noor, A.A.A.; Huseien, G.F. Performance Evaluation of Self-Compacting Glass Fiber Concrete Incorporating Silica Fume at Elevated Temperatures. Eng 2024, 5, 1043–1066. [Google Scholar] [CrossRef]
  4. Saleh, S.M.; Majeed, F.H. Shear strength of headed stud connectors in self-compacting concrete with recycled coarse aggregate. Buildings 2022, 12, 505. [Google Scholar] [CrossRef]
  5. Falih, Z.F.M.; Dakhi, A.J.; Saleh, S.M. Numerical Solution for Masonry Wall Using General Static Step with ABAQUS/Standard. Math. Model. Eng. Probl. 2023, 10, 2142–2148. [Google Scholar] [CrossRef]
  6. Saleh, S.M.; Majeed, F.H.; Al-Salih, O.; Hussain, H.K. Torsional Behavior of Steel-Concrete-Steel Sandwich Beams with Welded Stirrups as Shear Connectors. Civ. Eng. J. 2023, 9, 208–219. [Google Scholar] [CrossRef]
  7. Karim, A.A.; Abd Matooq, J.; Abdulrazzaq, O.A.; Majeed, F.H.; Saleh, S.M. The behavior of Shear Connectors in Steel-Normal Concrete Composite Structure under Repeated Loads. Civ. Eng. J. 2024, 10, 210–221. [Google Scholar] [CrossRef]
  8. Deaton, J.B. Nonlinear Finite Element Analysis of Reinforced Concrete Exterior Beam-Column Joints with Nonseismic Detailing. 2013. Available online: https://repository.gatech.edu/entities/publication/78302263-8d44-44c4-bbc2-c064816bf6de (accessed on 10 May 2024).
  9. Tahnat, Y.B.A.; Samaaneh, M.A.; Dwaikat, M.M.; Halahla, A.M. Simple equations for predicting the rotational ductility of fiber-reinforced-polymer strengthened reinforced concrete joints. Structures 2020, 24, 73–86. [Google Scholar] [CrossRef]
  10. Gao, F.; Tang, Z.; Mei, S.; Hu, B.; Huang, S.; Chen, J. Seismic behavior of exteriorbeam–column joints with high-performance steel rebar: Experimental and numerical investigations. Adv. Struct. Eng. 2021, 24, 90–106. [Google Scholar] [CrossRef]
  11. Yu, F.; Wu, C.; Xu, B.; Guan, Y.; Zhu, X.; Fang, Y. Study on shear bearing capacity of PVC-CFRP confined concrete column-RC beam exterior joint with core steel tube. Constr. Build. Mater. 2024, 410, 134197. [Google Scholar] [CrossRef]
  12. Samadi, M.; Baghban, M.H.; Kubba, Z.; Faridmehr, I.; Abdul Shukor Lim, N.H.; Benjeddou, O.; Ariffin, N.F.B.; Huseien, G.F. Flexural behavior of reinforced concrete beams under instantaneous loading: Effects of recycled ceramic as cement and aggregates replacement. Buildings 2022, 12, 439. [Google Scholar] [CrossRef]
  13. Kularni, S.; Patil, Y.D. A novel reinforcement pattern for exterior reinforced concrete beam-column joint. Procedia Eng. 2013, 51, 184–193. [Google Scholar] [CrossRef]
  14. Abdalla, K.M.; Al-Rousan, R.; Alhassan, M.A.; Lagaros, N.D. Finite-element modelling of concrete-filled steel tube columns wrapped with CFRP. Proc. Inst. Civ. Eng.-Struct. Build. 2020, 173, 844–857. [Google Scholar] [CrossRef]
  15. Kaliluthin, A.; Kothandaraman, S.; Ahamed, T.S. A review on behavior of reinforced concrete beam column joint. Int. J. Innov. Res. Sci. Eng. Technol. 2014, 3, 11299–11312. [Google Scholar]
  16. Kiran, R.; Genesio, G. A case study on pre 1970s constructed concrete exterior beam-column joints. Case Stud. Struct. Eng. 2014, 1, 20–25. [Google Scholar] [CrossRef]
  17. Rajagopal, S.; Prabavathy, S. Exterior beam-column joint study with non-conventional reinforcement detailing using mechanical anchorage under reversal loading. Sadhana 2014, 39, 1185–1200. [Google Scholar] [CrossRef]
  18. Rajagopal, S.; Prabavathy, S. Seismic behavior of exterior beam-column joint using mechanical anchorage under reversal loading: An experimental study. Iran. J. Sci. Technol. Trans. Civ. Eng. 2014, 38, 345. [Google Scholar]
  19. Fan, G.; Song, Y.; Wang, L. Experimental study on the seismic behavior of reinforced concrete beam-column joints under various strain rates. J. Reinf. Plast. Compos. 2014, 33, 601–618. [Google Scholar] [CrossRef]
  20. Al-Rousan, R.Z.; Alhassan, M.A.; Al-omary, R.J. Response of interior beam-column connections integrated with various schemes of CFRP composites. Case Stud. Constr. Mater. 2021, 14, e00488. [Google Scholar] [CrossRef]
  21. Patel, R.S.; Nambiyanna, B.; Prabhakara, R. An experimental study on effect of diameter of rebar on exterior beam column joint. Int. J. Innov. Res. Sci. 2015, 4, 5984–5991. [Google Scholar]
  22. Rodríguez, V.; Guerrero, H.; Alcocer, S.M.; Tapia-Hernández, E. Rehabilitation of heavily damaged beam-column connections with CFRP wrapping and SFRM casing. Soil Dyn. Earthq. Eng. 2021, 145, 106721. [Google Scholar] [CrossRef]
  23. Moskaleva, A.; Safonov, A.; Hernández-Montes, E. Fiber-reinforced polymers in freeform structures: A review. Buildings 2021, 11, 481. [Google Scholar] [CrossRef]
  24. Al-Rousan, R.Z.; Alkhawaldeh, A. Behavior of heated damaged reinforced concrete beam-column joints strengthened with FRP. Case Stud. Constr. Mater. 2021, 15, e00584. [Google Scholar] [CrossRef]
  25. Ruiz-Pinilla, J.G.; Pallarés, F.; Gimenez, E.; Calderón, P. Experimental tests on retrofitted RC beam-column joints underdesigned to seismic loads. General approach. Eng. Struct. 2014, 59, 702–714. [Google Scholar] [CrossRef]
  26. Yurdakul, Ö.; Avşar, Ö. Strengthening of substandard reinforced concrete beam-column joints by external post-tension rods. Eng. Struct. 2016, 107, 9–22. [Google Scholar] [CrossRef]
  27. Ong, C.; Chin, C.; Ma, C.; Tan, J.; Awang, A.; Omar, W. Seismic retrofit of reinforced concrete beam-column joints using various confinement techniques: A review. Structures 2022, 42, 221–243. [Google Scholar] [CrossRef]
  28. Abdalla, J.A.; Mhanna, H.H.; Hawileh, R.A.; Sharafi, M.; Al-Marzouqi, A.; Al-Teneiji, S.; Al-Ali, K. Shear Strengthening of Reinforced Concrete T-Beams using Carbon Fiber Reinforced Polymer (CFRP) Anchored with CFRP Spikes. Procedia Struct. Integr. 2022, 42, 1223–1230. [Google Scholar] [CrossRef]
  29. Fang, H.; Bai, Y.; Liu, W.; Qi, Y.; Wang, J. Connections and structural applications of fibre reinforced polymer composites for civil infrastructure in aggressive environments. Compos. Part B Eng. 2019, 164, 129–143. [Google Scholar] [CrossRef]
  30. Jia, J.; Zandi, Y.; Rahimi, A.; Pourkhorshidi, S.; Khadimallah, M.A.; Ali, H.E. Numerical performance evaluation of debonding strength in fiber reinforced polymer composites using three hybrid intelligent models. Adv. Eng. Softw. 2022, 173, 103193. [Google Scholar] [CrossRef]
  31. Zhang, J.-g.; Yang, G.-c.; Ma, Z.-h.; Zhao, G.-l.; Song, H.-y. A stacking-CRRL fusion model for predicting the bearing capacity of a steel-reinforced concrete column constrained by carbon fiber-reinforced polymer. Structures 2023, 55, 1793–1804. [Google Scholar] [CrossRef]
  32. Vatani-Oskouei, A. Repairing of seismically damaged RC exterior beam—Column connection using CFRP. J. Reinf. Plast. Compos. 2010, 29, 3257–3274. [Google Scholar] [CrossRef]
  33. Eslami, A.; Ronagh, H.R. Experimental investigation of an appropriate anchorage system for flange-bonded carbon fiber–reinforced polymers in retrofitted RC beam–column joints. J. Compos. Constr. 2014, 18, 04013056. [Google Scholar] [CrossRef]
  34. Zgür Yurdakul, Ö.; Avşar, Ö. Structural repairing of damaged reinforced concrete beam-column assemblies with CFRPs. Struct. Eng. Mech. 2015, 54, 521–543. [Google Scholar] [CrossRef]
  35. Sasmal, S.; Novák, B.; Ramanjaneyulu, K.; Srinivas, V.; Roehm, C.; Lakshmanan, N.; Iyer, N.R. Seismic retrofitting of damaged exterior beam–column joints using fibre reinforced plastic composite–steel plate combined technique. Struct. Infrastruct. Eng. 2013, 9, 116–129. [Google Scholar] [CrossRef]
  36. Agarwal, P.; Gupta, A.; Angadi, R.G. Effect of FRP wrapping on axial behavior of concrete and cyclic behavior of external RC beam column joints. KSCE J. Civ. Eng. 2014, 18, 566–573. [Google Scholar] [CrossRef]
  37. Granata, P.J.; Parvin, A. An experimental study on Kevlar strengthening of beam–column connections. Compos. Struct. 2001, 53, 163–171. [Google Scholar] [CrossRef]
  38. Zhoudao, L.; Lei, S.; Jiangtao, Y. Experimental study on the seismic behaviour of strengthened concrete column-beam joints by simulated earthquake. Procedia Eng. 2011, 14, 1871–1878. [Google Scholar] [CrossRef]
  39. Allam, K.; Mosallam, A.S.; Salama, M.A. Experimental evaluation of seismic performance of interior RC beam-column joints strengthened with FRP composites. Eng. Struct. 2019, 196, 109308. [Google Scholar] [CrossRef]
  40. Mosallam, A. Strength and ductility of reinforced concrete moment frame connections strengthened with quasi-isotropic laminates. Compos. Part B Eng. 2000, 31, 481–497. [Google Scholar] [CrossRef]
  41. Yang, Z.; Liu, Y.; Li, J. Study of seismic behavior of RC beam-column joints strengthened by sprayed FRP. Adv. Mater. Sci. Eng. 2018, 2018, 3581458. [Google Scholar] [CrossRef]
  42. Mukherjee, A.; Joshi, M. FRPC reinforced concrete beam-column joints under cyclic excitation. Compos. Struct. 2005, 70, 185–199. [Google Scholar] [CrossRef]
  43. Alshamrani, S.; Rasheed, H.A.; Salahat, F.H.; Borwankar, A.; Divilbiss, N. Seismic flexural behavior of CFRP strengthened reinforced concrete beams secured with fiber anchors. Eng. Struct. 2024, 305, 117728. [Google Scholar] [CrossRef]
  44. Smith, S.T.; Rasheed, H.A.; Kim, S.J. Full-range load-deflection response of FRP-strengthened RC flexural members anchored with FRP anchors. Compos. Struct. 2017, 167, 207–218. [Google Scholar] [CrossRef]
  45. Rasheed, H.A.; Pervaiz, S. Bond slip analysis of fiber-reinforced polymer-strengthened beams. J. Eng. Mech. 2002, 128, 78–86. [Google Scholar] [CrossRef]
  46. Gao, W.; Teng, J.; Dai, J.-G. Effect of temperature variation on the full-range behavior of FRP-to-concrete bonded joints. J. Compos. Constr. 2012, 16, 671–683. [Google Scholar] [CrossRef]
  47. Khodadadi, N.; Roghani, H.; Harati, E.; Mirdarsoltany, M.; De Caso, F.; Nanni, A. Fiber-reinforced polymer (FRP) in concrete: A comprehensive survey. Constr. Build. Mater. 2024, 432, 136634. [Google Scholar] [CrossRef]
  48. Azuwa, S.B.; Yahaya, F.B.M. Experimental investigation and finite element analysis of reinforced concrete beams strengthened by fibre reinforced polymer composite materials: A review. Alex. Eng. J. 2024, 99, 137–167. [Google Scholar] [CrossRef]
  49. Laseima, S.Y.; Mutalib, A.; Osman, S.; Hamid, N. Seismic behavior of exterior rc beam-column joints retrofitted using CFRP sheets. Lat. Am. J. Solids Struct. 2020, 17, e263. [Google Scholar] [CrossRef]
  50. Saqan, E.I.; Rasheed, H.A.; Alkhrdaji, T. Seismic Behavior of Carbon Fiber-Reinforced Polymer-Strengthened Reinforced Concrete Members with Various Anchors. ACI Struct. J. 2020, 117, 3–14. [Google Scholar]
  51. Karayannis, C.G.; Golias, E. Full-scale experimental testing of RC beam-column joints strengthened using CFRP ropes as external reinforcement. Eng. Struct. 2022, 250, 113305. [Google Scholar] [CrossRef]
  52. Lim, C.; Jeong, Y.; Kim, J.; Kwon, M. Experimental study of reinforced concrete beam-column joint retrofitted by CFRP grid with ECC and high strength mortar. Constr. Build. Mater. 2022, 340, 127694. [Google Scholar] [CrossRef]
  53. Attari, N.; Youcef, Y.S.; Amziane, S. Seismic performance of reinforced concrete beam–column joint strengthening by frp sheets. Structures 2019, 20, 353–364. [Google Scholar] [CrossRef]
  54. Golias, E.; Zapris, A.G.; Kytinou, V.K.; Osman, M.; Koumtzis, M.; Siapera, D.; Chalioris, C.E.; Karayannis, C.G. Application of X-shaped CFRP ropes for structural upgrading of reinforced concrete beam–column joints under cyclic loading–experimental study. Fibers 2021, 9, 42. [Google Scholar] [CrossRef]
  55. Mady, M.H.A. Seismic Behaviour of Exterior Beam-Column Joints Reinforced with Frp Bars and Stirrups; University of Manitoba (Canada): Winnipeg, MB, Canada, 2011. [Google Scholar]
  56. Bsisu, K.; Hiari, B.O. Finite element analysis of retrofitting techniques for reinforced concrete beam-column joint. J. Am. Sci. 2015, 11, 48–56. [Google Scholar]
  57. Ercan, E.; Arisoy, B.; Ertem, O.B. Experimental assessment of RC beam-column connections with internal and external strengthening techniques. Adv. Civ. Eng. 2019, 2019, 2828353. [Google Scholar] [CrossRef]
  58. Le-Trung, K.; Lee, K.; Lee, J.; Lee, D.H.; Woo, S. Experimental study of RC beam–column joints strengthened using CFRP composites. Compos. Part B Eng. 2010, 41, 76–85. [Google Scholar] [CrossRef]
  59. ACI Committee. Building Code Requirements For Structural Concrete (ACI 318-02) and Commentary (ACI 318R-02). Available online: https://agussugiantocom.files.wordpress.com/2016/07/aci318-02-building-code-for-structural-concrete.pdf (accessed on 10 May 2024).
  60. Tao, Y.; Chen, J.-F. Concrete damage plasticity model for modeling FRP-to-concrete bond behavior. J. Compos. Constr. 2015, 19, 04014026. [Google Scholar] [CrossRef]
  61. Chen, G.; Chen, J.; Teng, J. On the finite element modelling of RC beams shear-strengthened with FRP. Constr. Build. Mater. 2012, 32, 13–26. [Google Scholar] [CrossRef]
  62. Lubliner, J.; Oliver, J.; Oller, S.; Oñate, E. A plastic-damage model for concrete. Int. J. Solids Struct. 1989, 25, 299–326. [Google Scholar] [CrossRef]
  63. Lee, J.; Fenves, G.L. Plastic-damage model for cyclic loading of concrete structures. J. Eng. Mech. 1998, 124, 892–900. [Google Scholar] [CrossRef]
  64. Neuberger, Y.M.; Andrade, M.V.; de Sousa, A.M.D.; Bandieira, M.; da Silva Júnior, E.P.; dos Santos, H.F.; Catoia, B.; Bolandim, E.A.; de Moura Aquino, V.B.; Christoforo, A.L. Numerical Analysis of Reinforced Concrete Corbels Using Concrete Damage Plasticity: Sensitivity to Material Parameters and Comparison with Analytical Models. Buildings 2023, 13, 2781. [Google Scholar] [CrossRef]
  65. Narayanan, R.; James, R. Microwave nondestructive testing of galvanic corrosion and impact damage in carbon fiber reinforced polymer composites. Int. J. Microw. Appl 2018, 7, 1. [Google Scholar] [CrossRef]
  66. GangaRao, H.V.; Vijay, P. Bending behavior of concrete beams wrapped with carbon fabric. J. Struct. Eng. 1998, 124, 3–10. [Google Scholar] [CrossRef]
  67. Torabi, A.; Maheri, M.R. Seismic repair and retrofit of RC beam–column joints using stiffened steel plates. Iran. J. Sci. Technol. Trans. Civ. Eng. 2017, 41, 13–26. [Google Scholar] [CrossRef]
  68. Peng, Z.; Dai, S.-B.; Pi, Y.-L.; Zhang, Y.-C.; Huang, J. Seismic performance of end-plate connections between T-shaped CFST columns and RC beams. J. Constr. Steel Res. 2018, 145, 167–183. [Google Scholar] [CrossRef]
Figure 1. Details of designed non-seismic beam–column joint [58].
Eng 05 00061 g001
Figure 2. (a) The proposed experimental setup; (b) lateral displacement applied to the model [58].
Eng 05 00061 g002
Figure 3. Elements used in ABAQUS to model: (a) C3D8R for concrete, (b) T3D2 for longitudinal and transverse reinforcement, and (c) the S4R5 four-node shell for FRP.
Eng 05 00061 g003
Figure 4. Uniaxial stress–strain curve of concrete.
Eng 05 00061 g004
Figure 5. Stiffness recovery curve of concrete under tension and compression.
Eng 05 00061 g005
Figure 6. Model representing the failure surface of concrete [64].
Eng 05 00061 g006
Figure 7. Stress–strain curve of steel.
Eng 05 00061 g007
Figure 8. 3D finite element model for the analysis of NSCBCJ- and CFRPC-integrated NSCBCJs. (a) NSCBCJ specimen, (b) seismic specimen, (c) one and two layers of the CFRPC specimen, (d) longitudinal and transverse reinforcement of the NSCBCJ specimen, (e) longitudinal and transverse reinforcement of the seismic specimen, and (f) mesh of all models.
Eng 05 00061 g008
Figure 9. The boundary conditions used in the model simulation.
Eng 05 00061 g009
Figure 10. Comparison force–displacement curves for the non-seismic specimen (NS), seismic specimen (SD), strengthened one-layer CFRPC specimen, and strengthened two-layer CFRPC specimen. (a) Experimental results of Trung [58] on NSCBCJ; (b) comparison of the proposed model results with experiments with NSCBCJ; (c) experimental results of Trung [58] with SD; (d) comparison of the proposed model results with experiments with SD; (e) experimental results of Trung [58] with one-layer CFRPC; (f) comparison of the proposed model results with experiments with one-layer CFRPC; (g) experimental results of Trung [58] on two-layer CFRPC; (h) comparison of the proposed model results with experiments of two-layer CFRPC.
Eng 05 00061 g010aEng 05 00061 g010b
Figure 11. Comparison of backbone curves. (a) NSCBCJ, (b) SD, (c) strengthened one-layer CFRPC specimen, and (d) strengthened two-layer CFRPC specimen.
Eng 05 00061 g011
Figure 12. Finite element output of the NS beam–column joint. (a) Concrete tensile damage; (b) concrete compressive damage; (c) stress in the reinforcement; (d) FE crack pattern; (e) experimental crack pattern [58].
Eng 05 00061 g012aEng 05 00061 g012b
Figure 13. Finite element output of the seismic beam–column joint. (a) concrete tensile damage; (b) concrete compressive damage; (c) stress in the reinforcement; (d) FE crack pattern; (e) experimental crack pattern [58].
Eng 05 00061 g013
Figure 14. Finite element output of the single-layer CFRPC-strengthened beam–column joint. (a) Concrete tensile damage; (b) concrete compressive damage; (c) stress in the reinforcement; (d) stress in the CFRP; (e) FE crack pattern; (f) experimental crack pattern [58].
Eng 05 00061 g014
Figure 15. Finite element output of double-layer CFRPC-strengthened beam–column joint. (a) Concrete tensile damage; (b) concrete compressive damage; (c) stress in the reinforcement; (d) stress in the CFRP; (e) FE crack pattern; (f) experimental crack pattern [58].
Eng 05 00061 g015
Figure 16. Relative energy dissipation parallelograms at drift ratios of 3.5% for (a) NS, (b) SD, (c) the one-layer CFRPC specimen, and (d) the two-layer CFRPC specimen.
Eng 05 00061 g016
Figure 17. Normalization process of the backbone curve for (a) NS, (b) SD, (c) one-layer CFRPC-integrated specimen, and (d) two-layer CFRPC-strengthened specimen.
Eng 05 00061 g017
Figure 18. Ideal bilinear load–displacement behavior of the specimen.
Eng 05 00061 g018
Figure 19. Drift ratio-dependent variation in the cumulative dissipated energy.
Eng 05 00061 g019
Figure 20. Simplified hysteresis loop.
Eng 05 00061 g020
Figure 21. Drift ratio-dependent variation in the equivalent damping coefficient.
Eng 05 00061 g021
Figure 22. Drift ratio-dependent variation in the secant stiffnesses.
Eng 05 00061 g022
Table 1. Concrete, steel bars, CFRP and epoxy properties.
Properties of Used Materials
ConcreteCompressive strength, MPaWater curing33.8
Air curing36.5
Tensile strength, MPaWater curing4.0
Air curing3.8
Steel barsYield strength, MPaD10324
Ø4459
CFRP (CF720)Tensile strength 0°, MPa4965.8
Elastic modulus, GP240.5
Elastic modulus 90°, GPa10
In-plane shear modulus, GPa5
Tensile strength 90°, MPa50
Compressive strength 0°, MPa1200
Compressive strength 90°, MPa250
In-plane shear strength, MPa70
Sheet thickness, mm0.33
Major Poisson’s ratio0.3
Density, g/cm31.6
Epoxy topcoat (CLR67)Tensile strength, MPa59.5
Elastic modulus, GP3.7
Epoxy primer (CLR67)Tensile strength, MPa56.8
Elastic modulus, GP3.7
Table 2. Model properties of reinforcement material.
Model NumberMaterialsMaterial Properties
1Deformed steel bar (10 mm)Linear isotropicYoung’s modulus, MPa200,000
Poisson’s ratio0.3
Bilinear kinematicStrain–stress, MPa0—0
0.00162—324
0.12—420
2Deformed steel bar (4 mm)Linear isotropicYoung’s modulus, MPa200000
Poisson’s ratio0.3
Bilinear kinematicStrain–stress, MPa0—0
0.0022—459
0.008—620
Table 3. Comparison between experimental and finite element results.
SpecimenLoading DirectionYield Lateral Resistance (kN)Ultimate Lateral Resistance (kN)
Q y e Q y F E M Q y F E M / Q y e Q u e Q u F E M Q u F E M / Q u e
Non-seismic (NS)Positive5.405.9251.097.37.91.08
Negative11.7012.91.1015.7617.21.09
Seismic design (SD)Positive7.307.821.079.710.751.10
Negative13.1513.851.0516.1518.231.13
Strengthened by CFRP (one layer)Positive6.757.421.099.1010.151.12
Negative12.9514.251.1017.2319.071.11
Strengthened by CFRP (two layers)Positive7.958.41.0510.611.201.06
Negative13.8014.351.0416.8017.801.06
Table 4. Validation of relative energy dissipation ratios of various specimens.
SpecimenDrift Ratio (%)Parallelograms
Area
Area of Hysteretic LoopRelative Energy
Dissipation Ratio β
Check to Meet
the Criteria ≥ 0.125
NS3.591.7518.300.20Ok
SD3.5130.3341.200.32Ok
1-layer CFRPC-integrated3.5124.6443.870.35Ok
2-layer CFRPC-integrated3.5144.0872.600.5Ok
Table 5. Validation of maximum lateral load resistance for various specimens.
Specimenλ E n (kN) λ E n (kN) E m a x (kN)Remarks
NS1.318.411.008.65Ok
SD1.318.411.0010.42Ok
1-layer CFRPC-integrated1.3112.6516.579.87Ok
2-layer CFRPC-integrated1.3116.0220.9811.27Ok
Table 6. Assessment of joint strength degradation at a drift level of 3.5%.
SpecimenDirectionUltimate Lateral Force in kN3.5% (Drift Ratio)
Force in kNRatio of the Strength
> 0.75
NSPositive8.566.300.73 *
Negative16.7715.500.92
SDPositive10.4210.010.96
Negative16.2015.670.96
1-layer CFRPC-integratedPositive9.879.580.97
Negative18.2318.000.98
2-layer CFRPC-integratedPositive11.2710.500.93
Negative17.8617.980.99
* Less than the ratio of the strength.
Table 7. Validation of the secant stiffness of various specimens.
SpecimenDirectionDrift Ratioδ (mm)F (kN)Secant Stiffness
(kN/mm)
Initial Stiffness
(kN/mm)
Ratio between Secant Stiffness and Initial StiffnessCheck to Meet
the Criteria ≥ 0.05
NSPositive3.533.886.300.180.660.27Ok
Negative33.8815.500.450.760.59Ok
SDPositive3.533.8810.010.291.530.19Ok
Negative33.8815.670.461.830.25Ok
1-layer CFRPC-integratedPositive3.533.889.580.281.820.15Ok
Negative33.8818.000.531.840.28Ok
2-layer CFRPC-integratedPositive3.533.8810.500.311.700.18Ok
Negative33.8817.800.531.710.31Ok
Table 8. Effective stiffness and ductility of various specimens.
SpecimenDirection 0.75 P y
(kN)
Δ y i (mm) K e
(KN/m)
Avg .   K e
(KN/m)
Δ y
(mm)
Δ u
(mm)
µAverage
µ
NSPositive5.478.77623745.511.7045.723.93.10
Negative11.7513.587019.7044.792.3
SDPositive7.307.121025973.59.5045.904.833.63
Negative13.1514.2592219.1046.552.43
1-layer CFRPC-integratedPositive6.756.375105912628.5056.036.595.95
Negative12.958.80146511.0058.595.32
2-layer CFRPC-integratedPositive7.956.97114013019.3058.506.296.16
Negative13.809.3014629.5257.536.04
Disclaimer/Publisher’s Note: The statements, opinions and data contained in all publications are solely those of the individual author(s) and contributor(s) and not of MDPI and/or the editor(s). MDPI and/or the editor(s) disclaim responsibility for any injury to people or property resulting from any ideas, methods, instructions or products referred to in the content.

