

Correlation Analysis between Young Driver Characteristics and Visual/Physiological Attributes at Expressway Exit Ramp


Abstract
:1. Introduction
2. Literature Review
3. Experimental Design
3.1. Participants
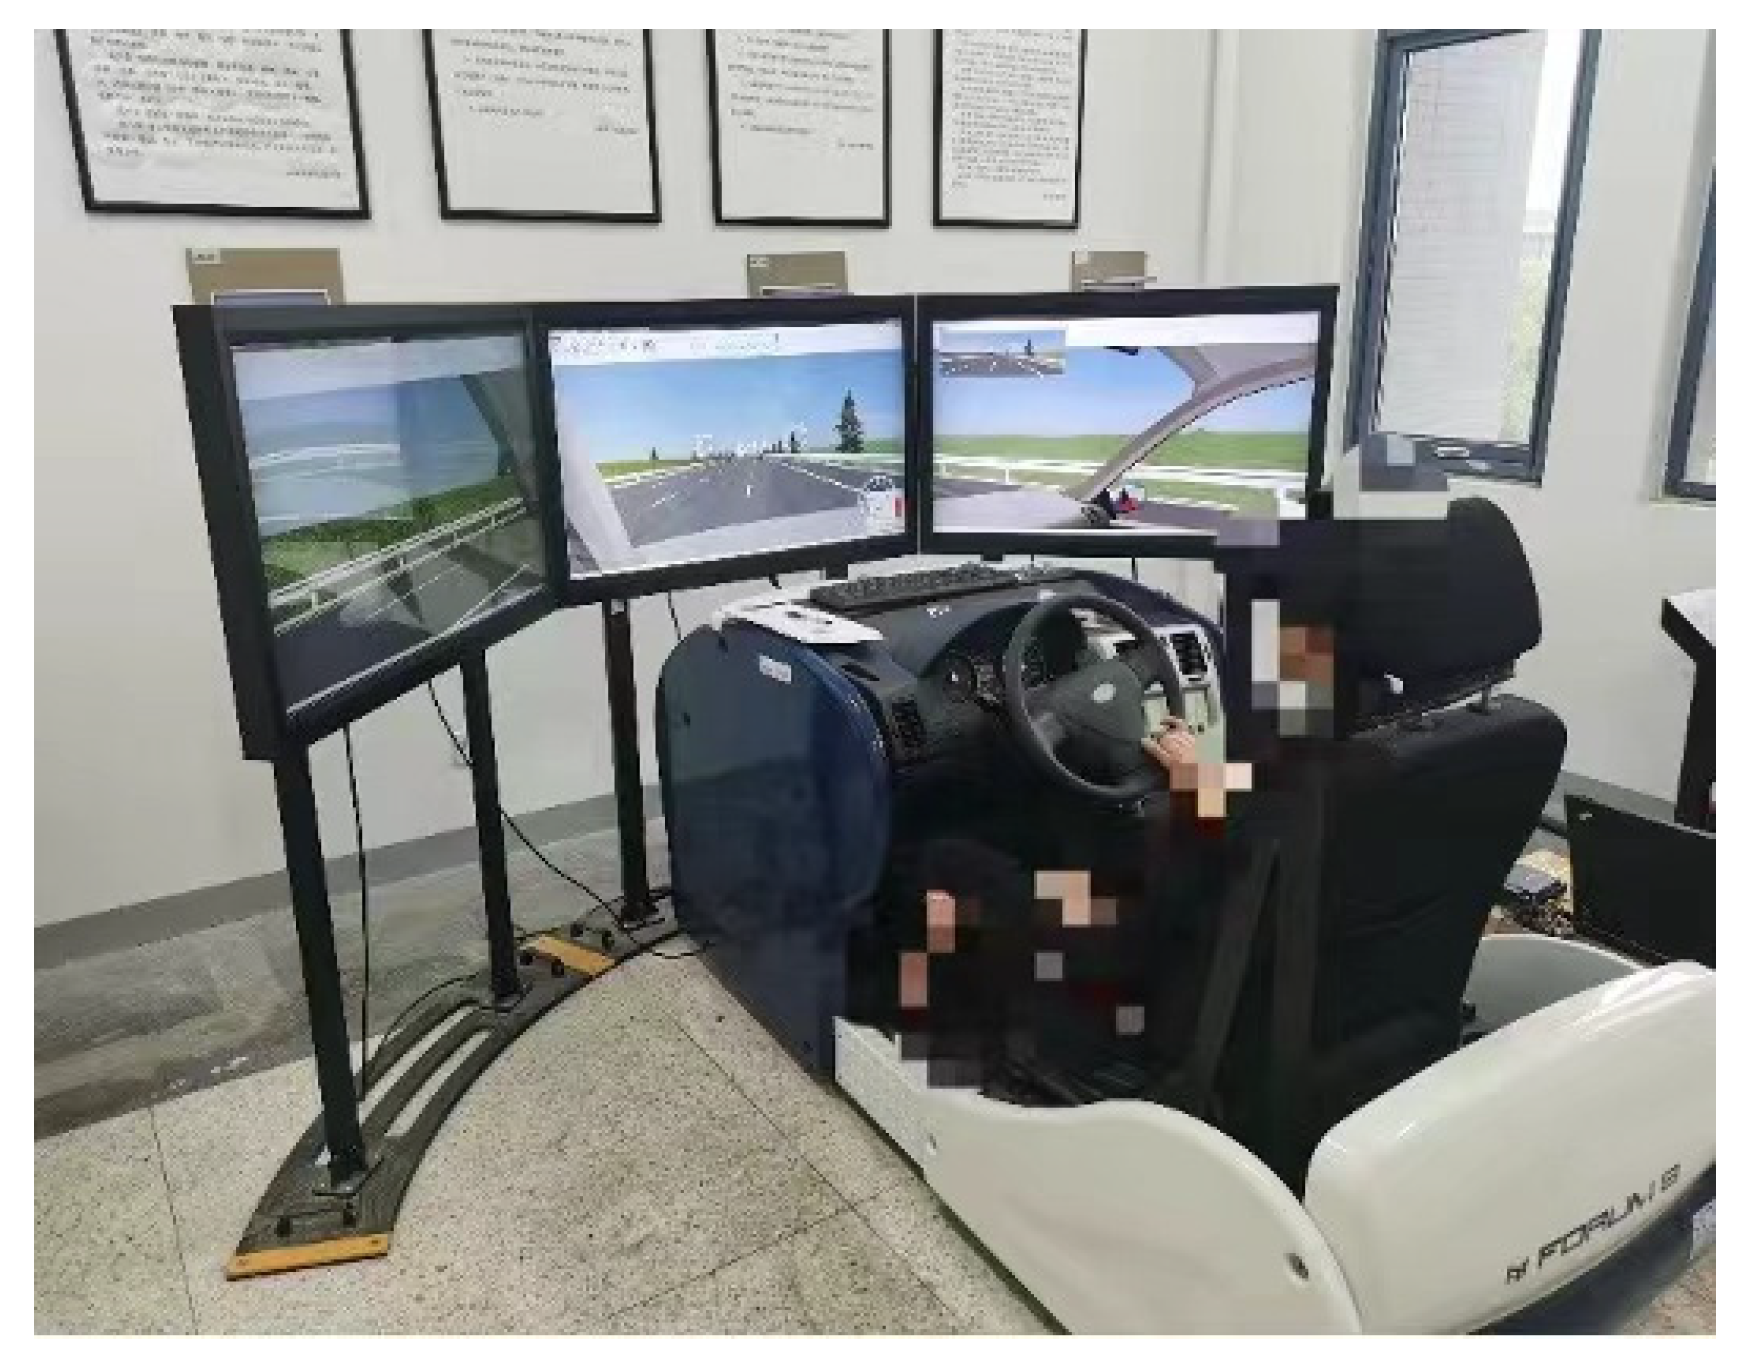
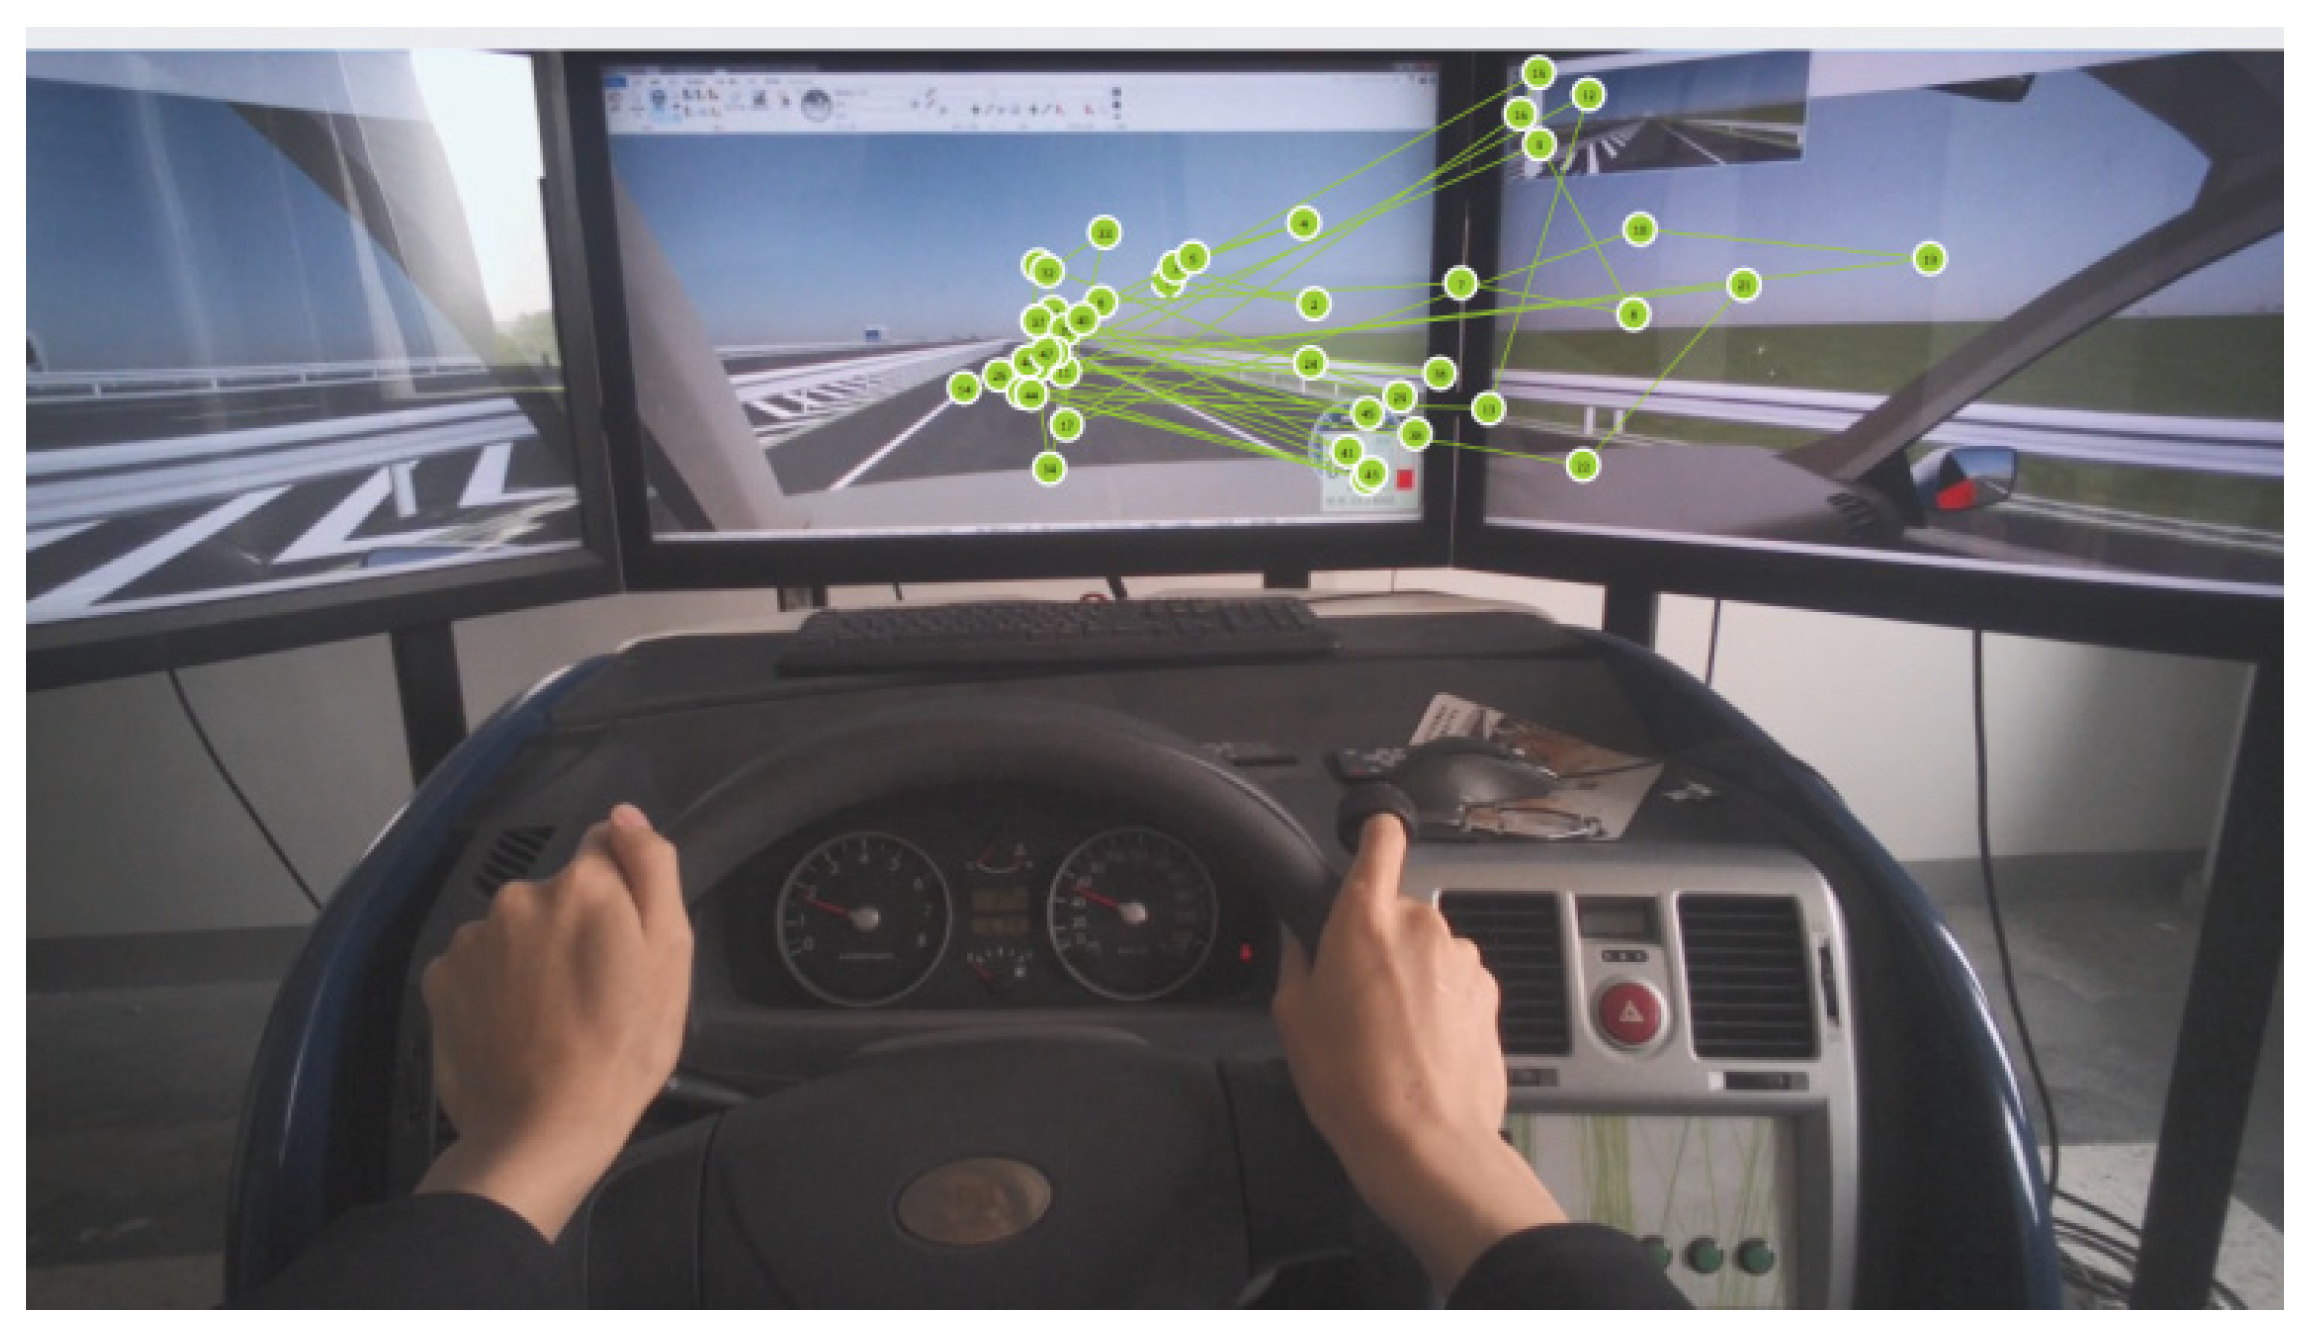
3.2. Material
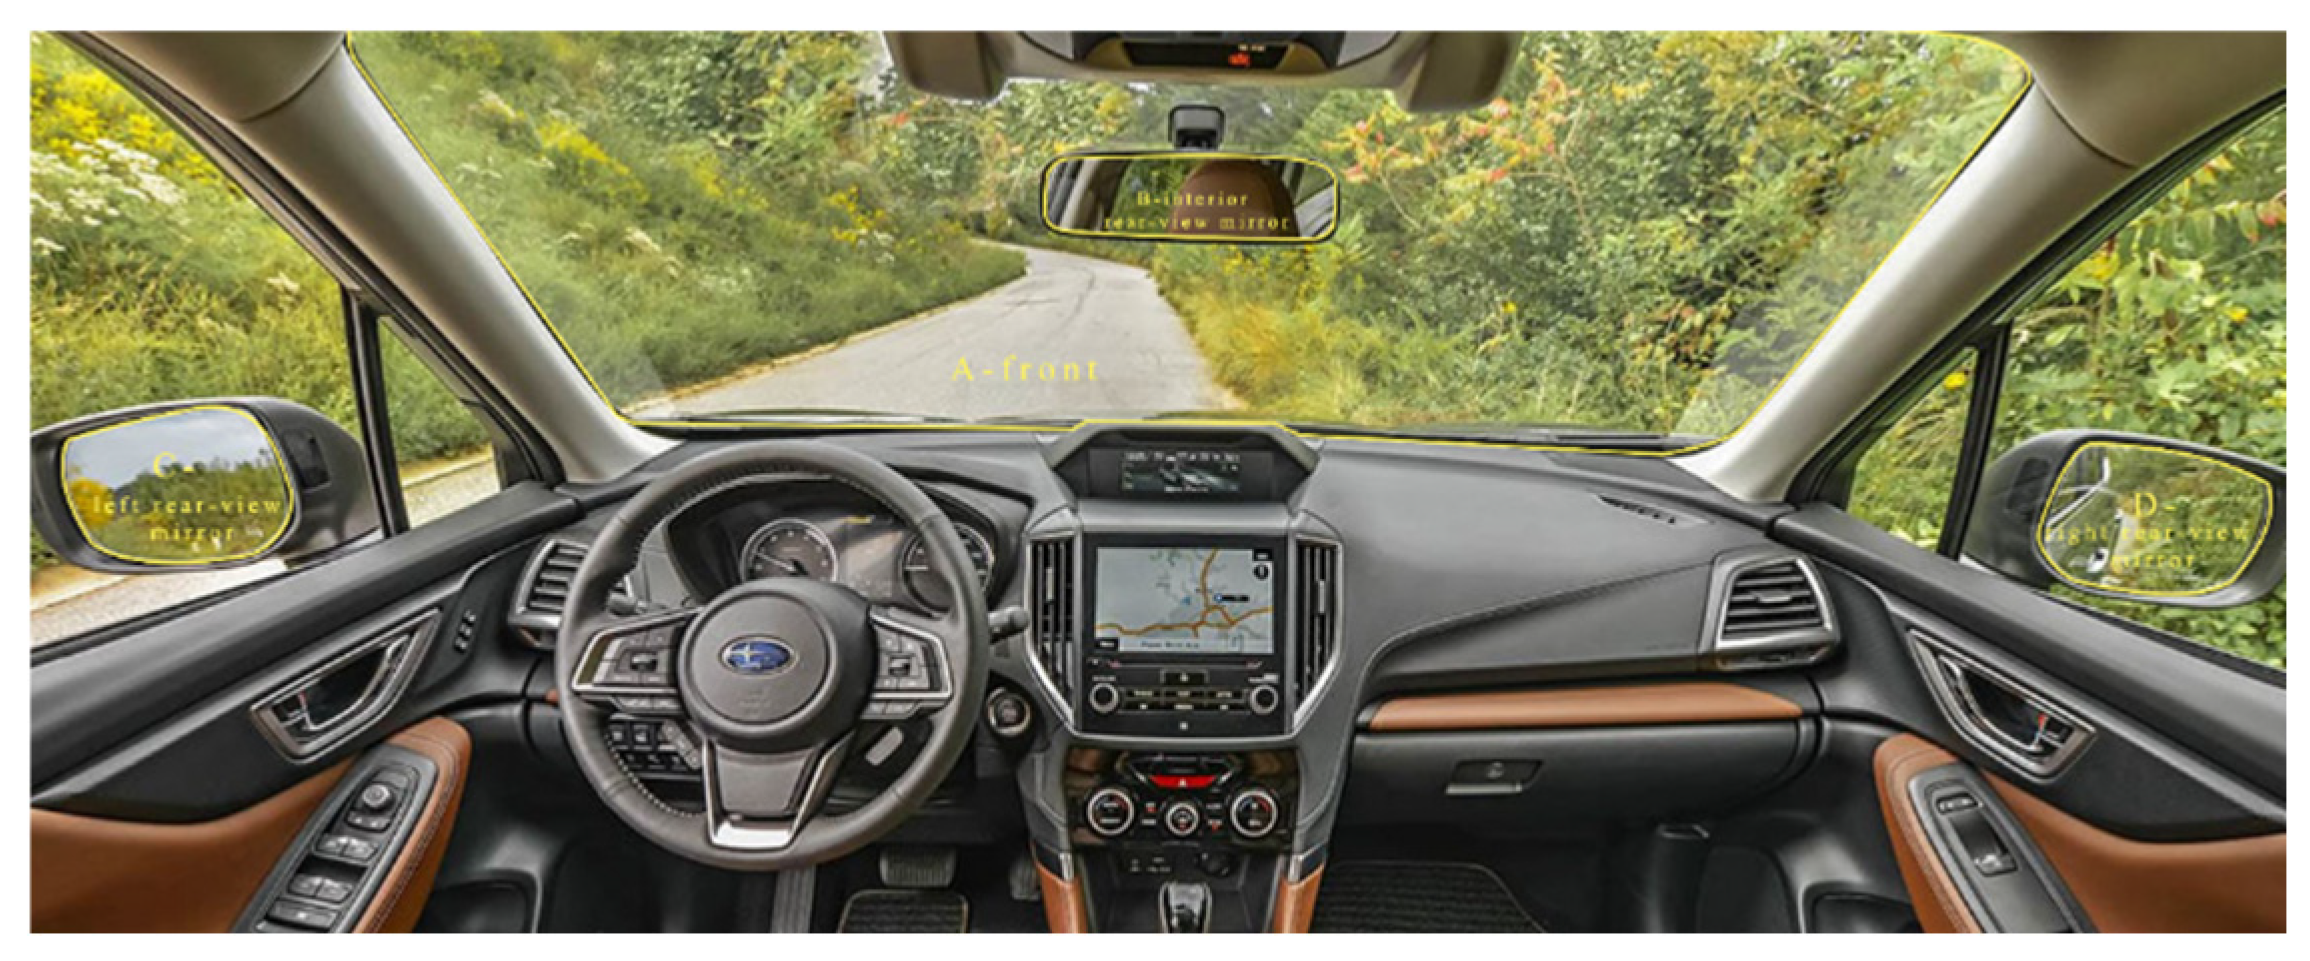
3.3. Driver Attributes
3.4. Experimental Process
- Step 1: Questionnaire filling stage
- Step 2: Instrument Configuration
- Step 3: Driving Simulation
4. Methodology
4.1. Design of the -Means Clustering Algorithm
- Step1: Select objects from data objects as the initial clustering center, and the similarity of the remaining points can be derived from the following formula:
4.2. Clustering Algorithm Results
5. Correlation Analysis
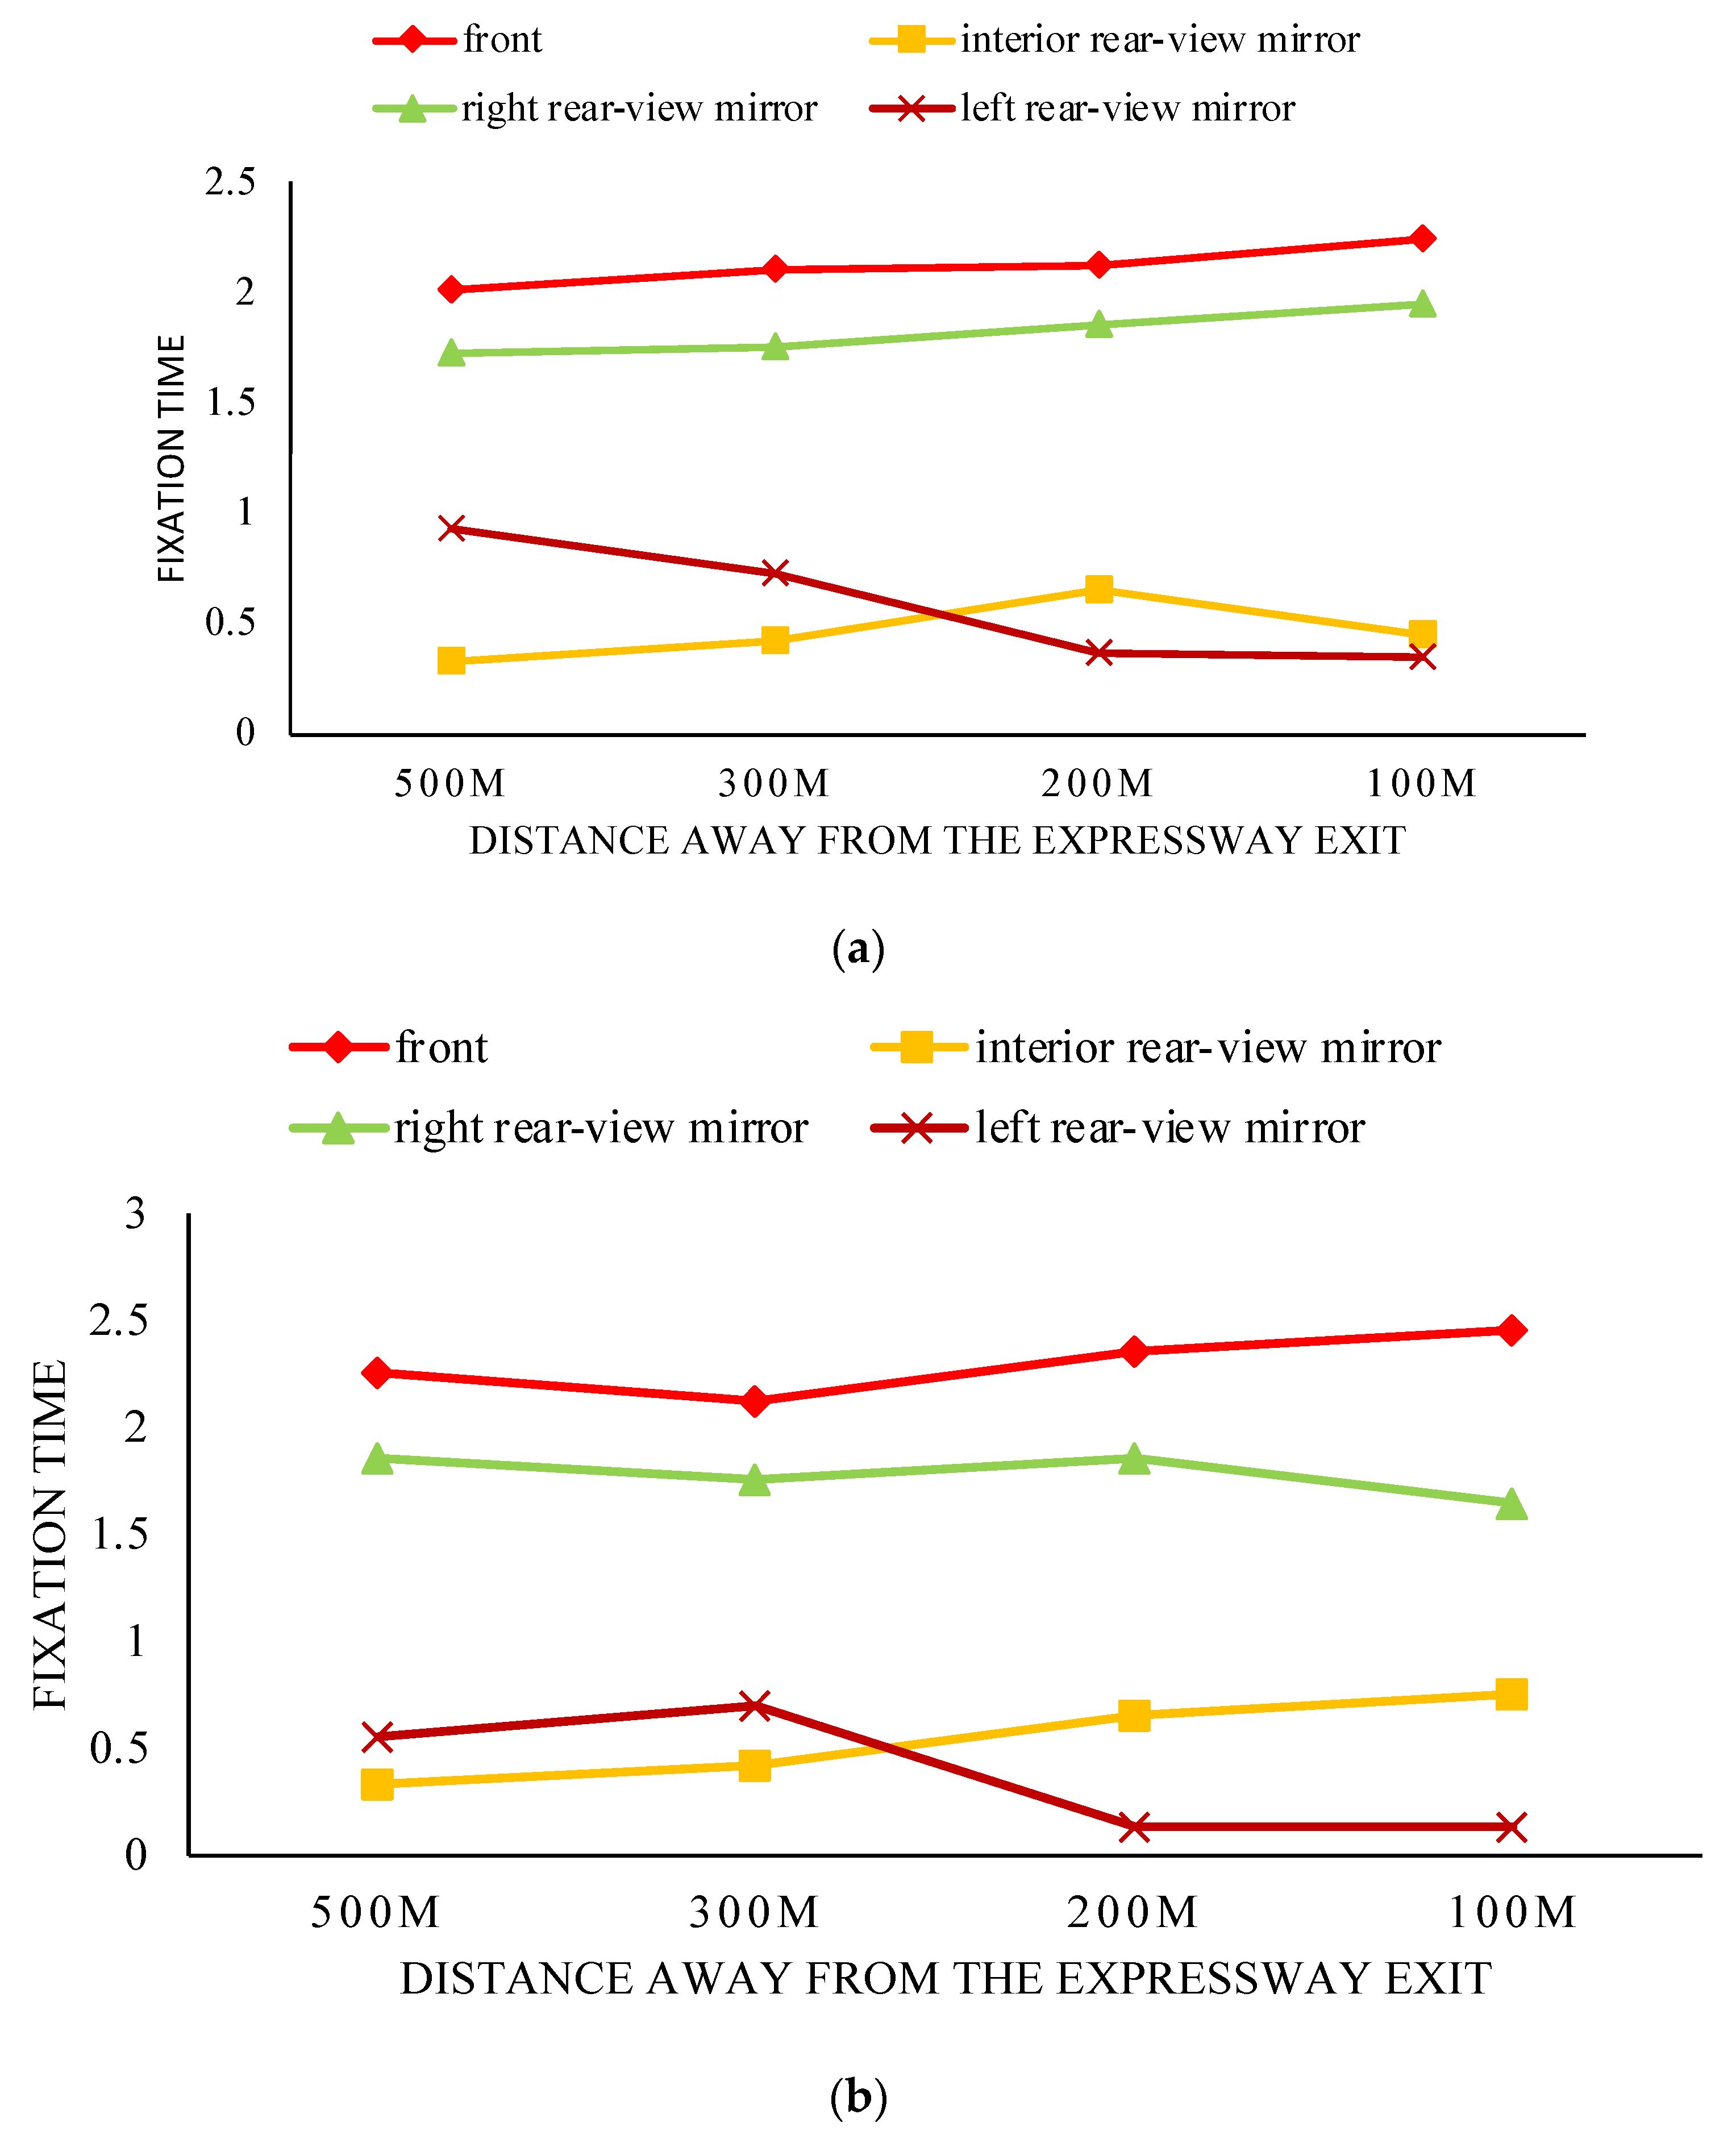
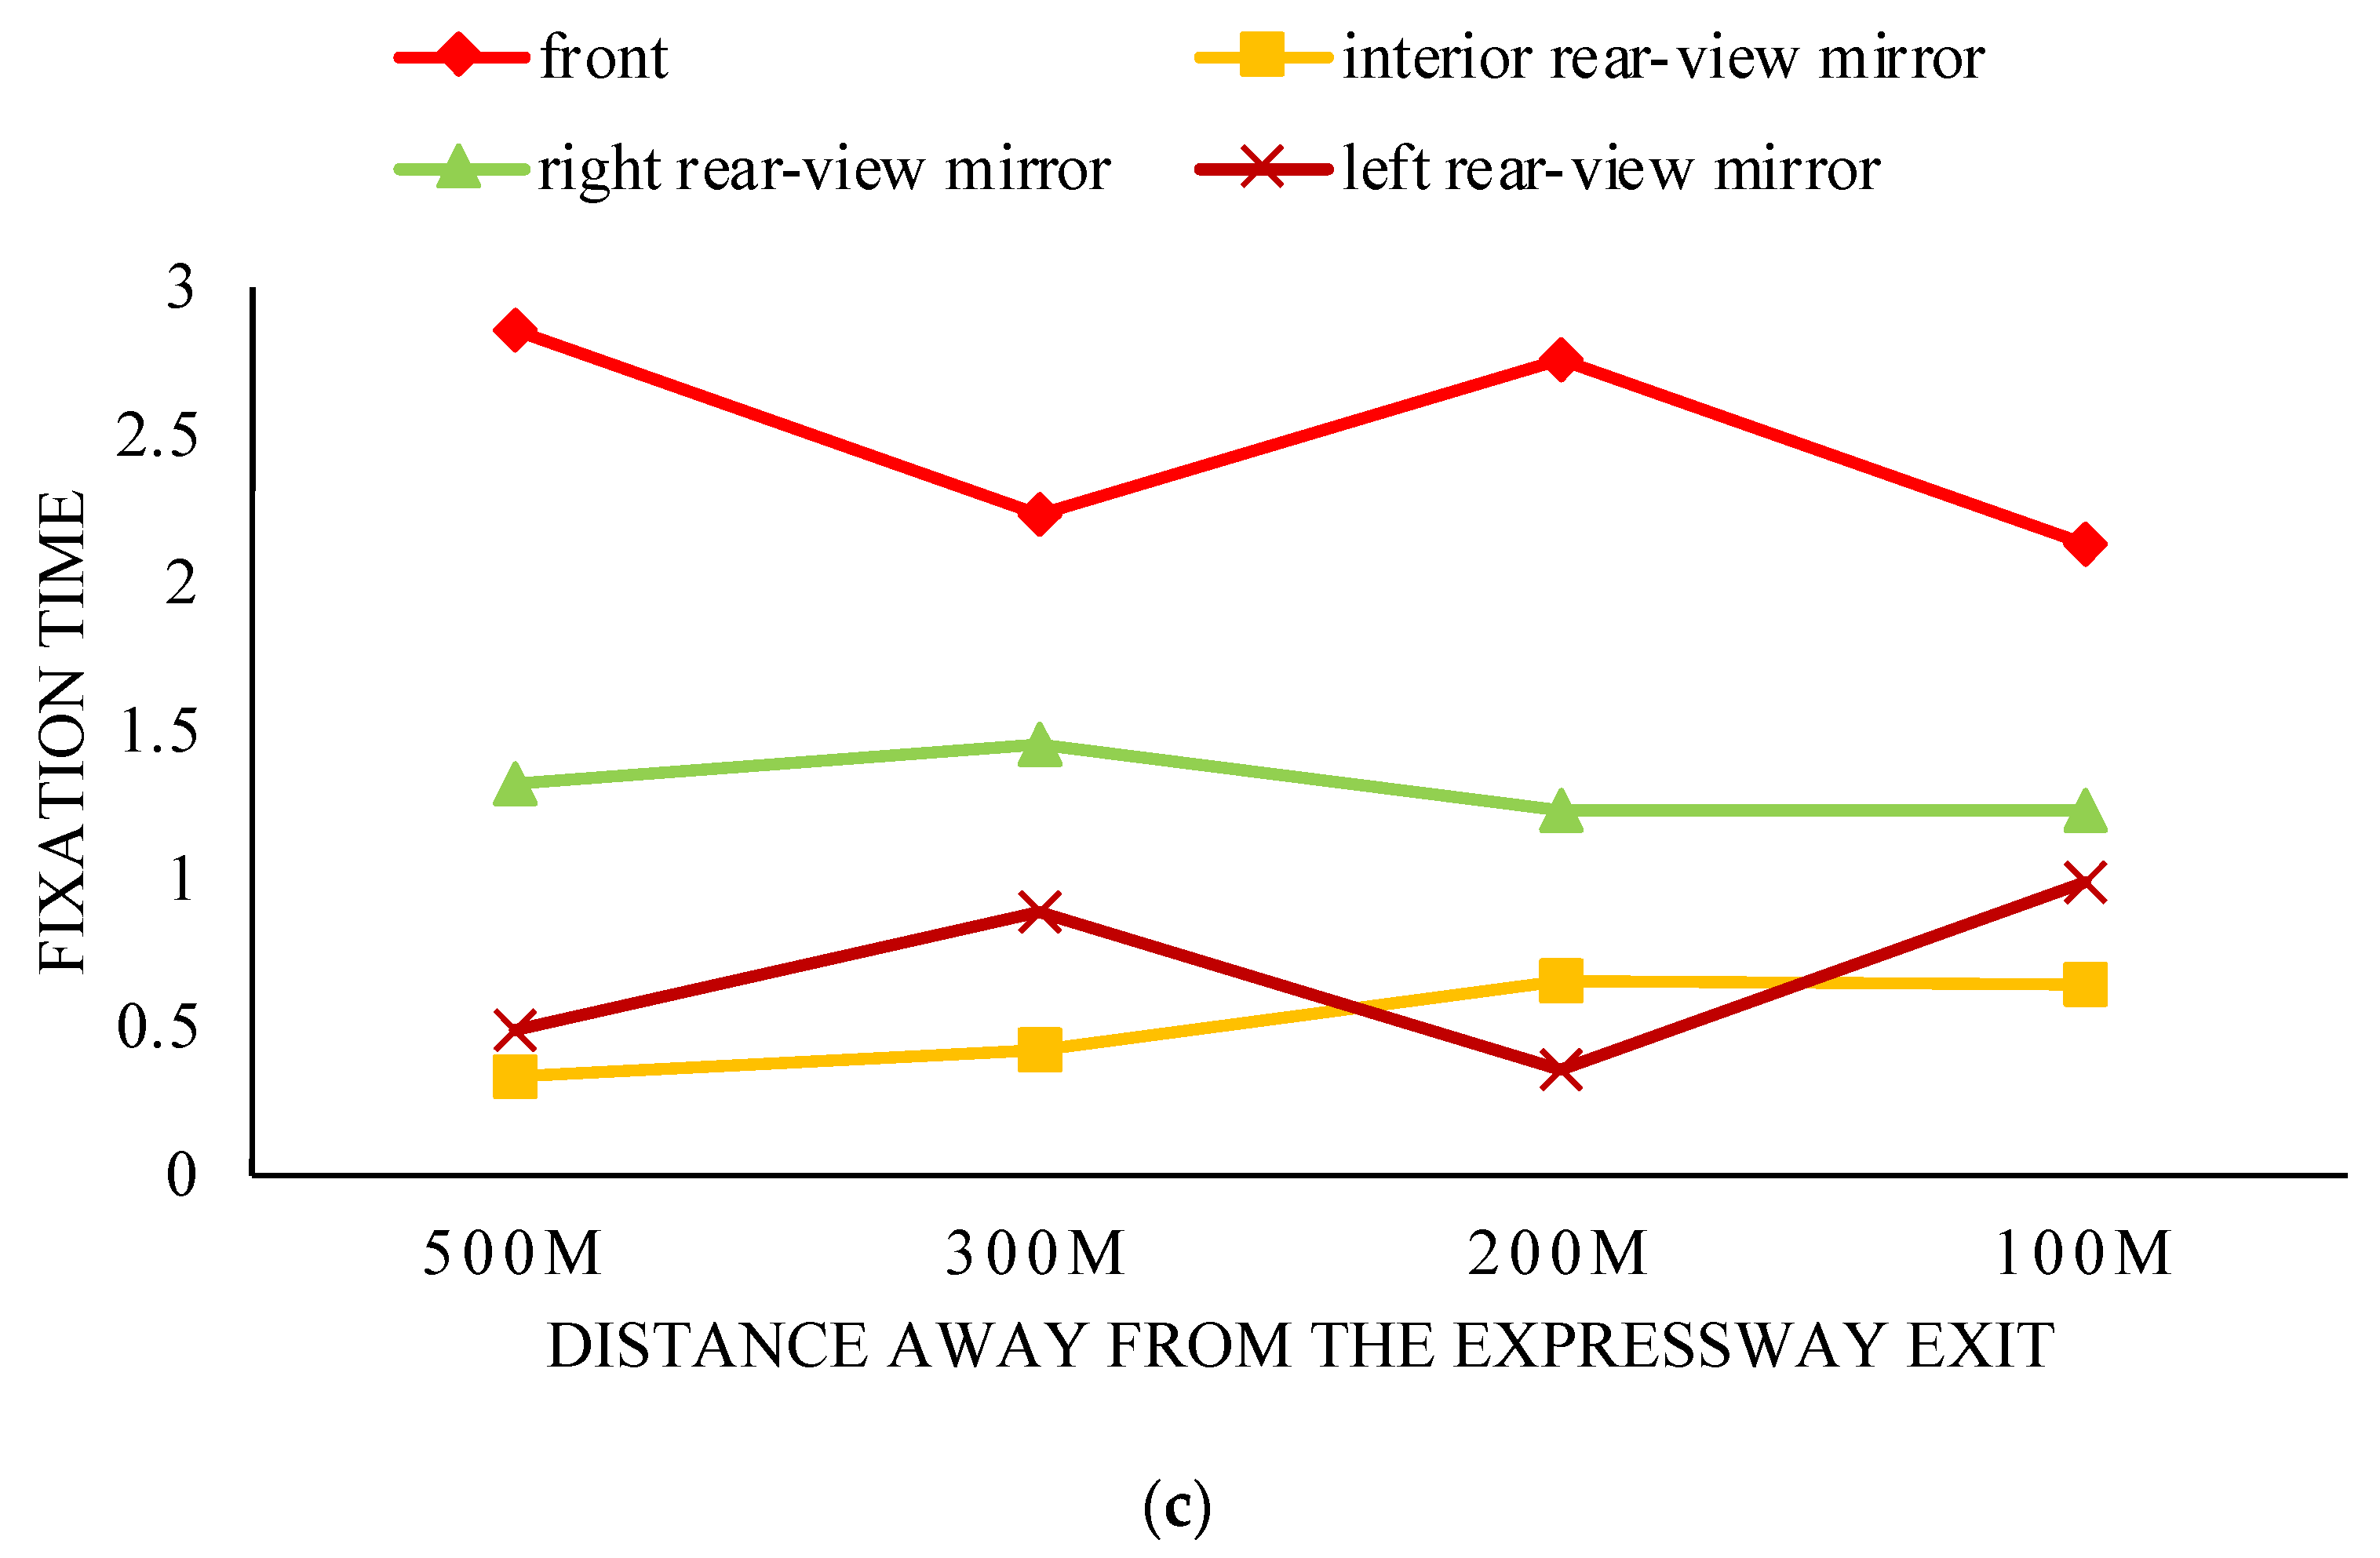
5.1. Fixation Times
5.1.1. Fixation Times by Gender
5.1.2. Fixation Times by Driving Experience
5.1.3. Fixation Times by Driving Mileage
5.2. Average Saccade Amplitude
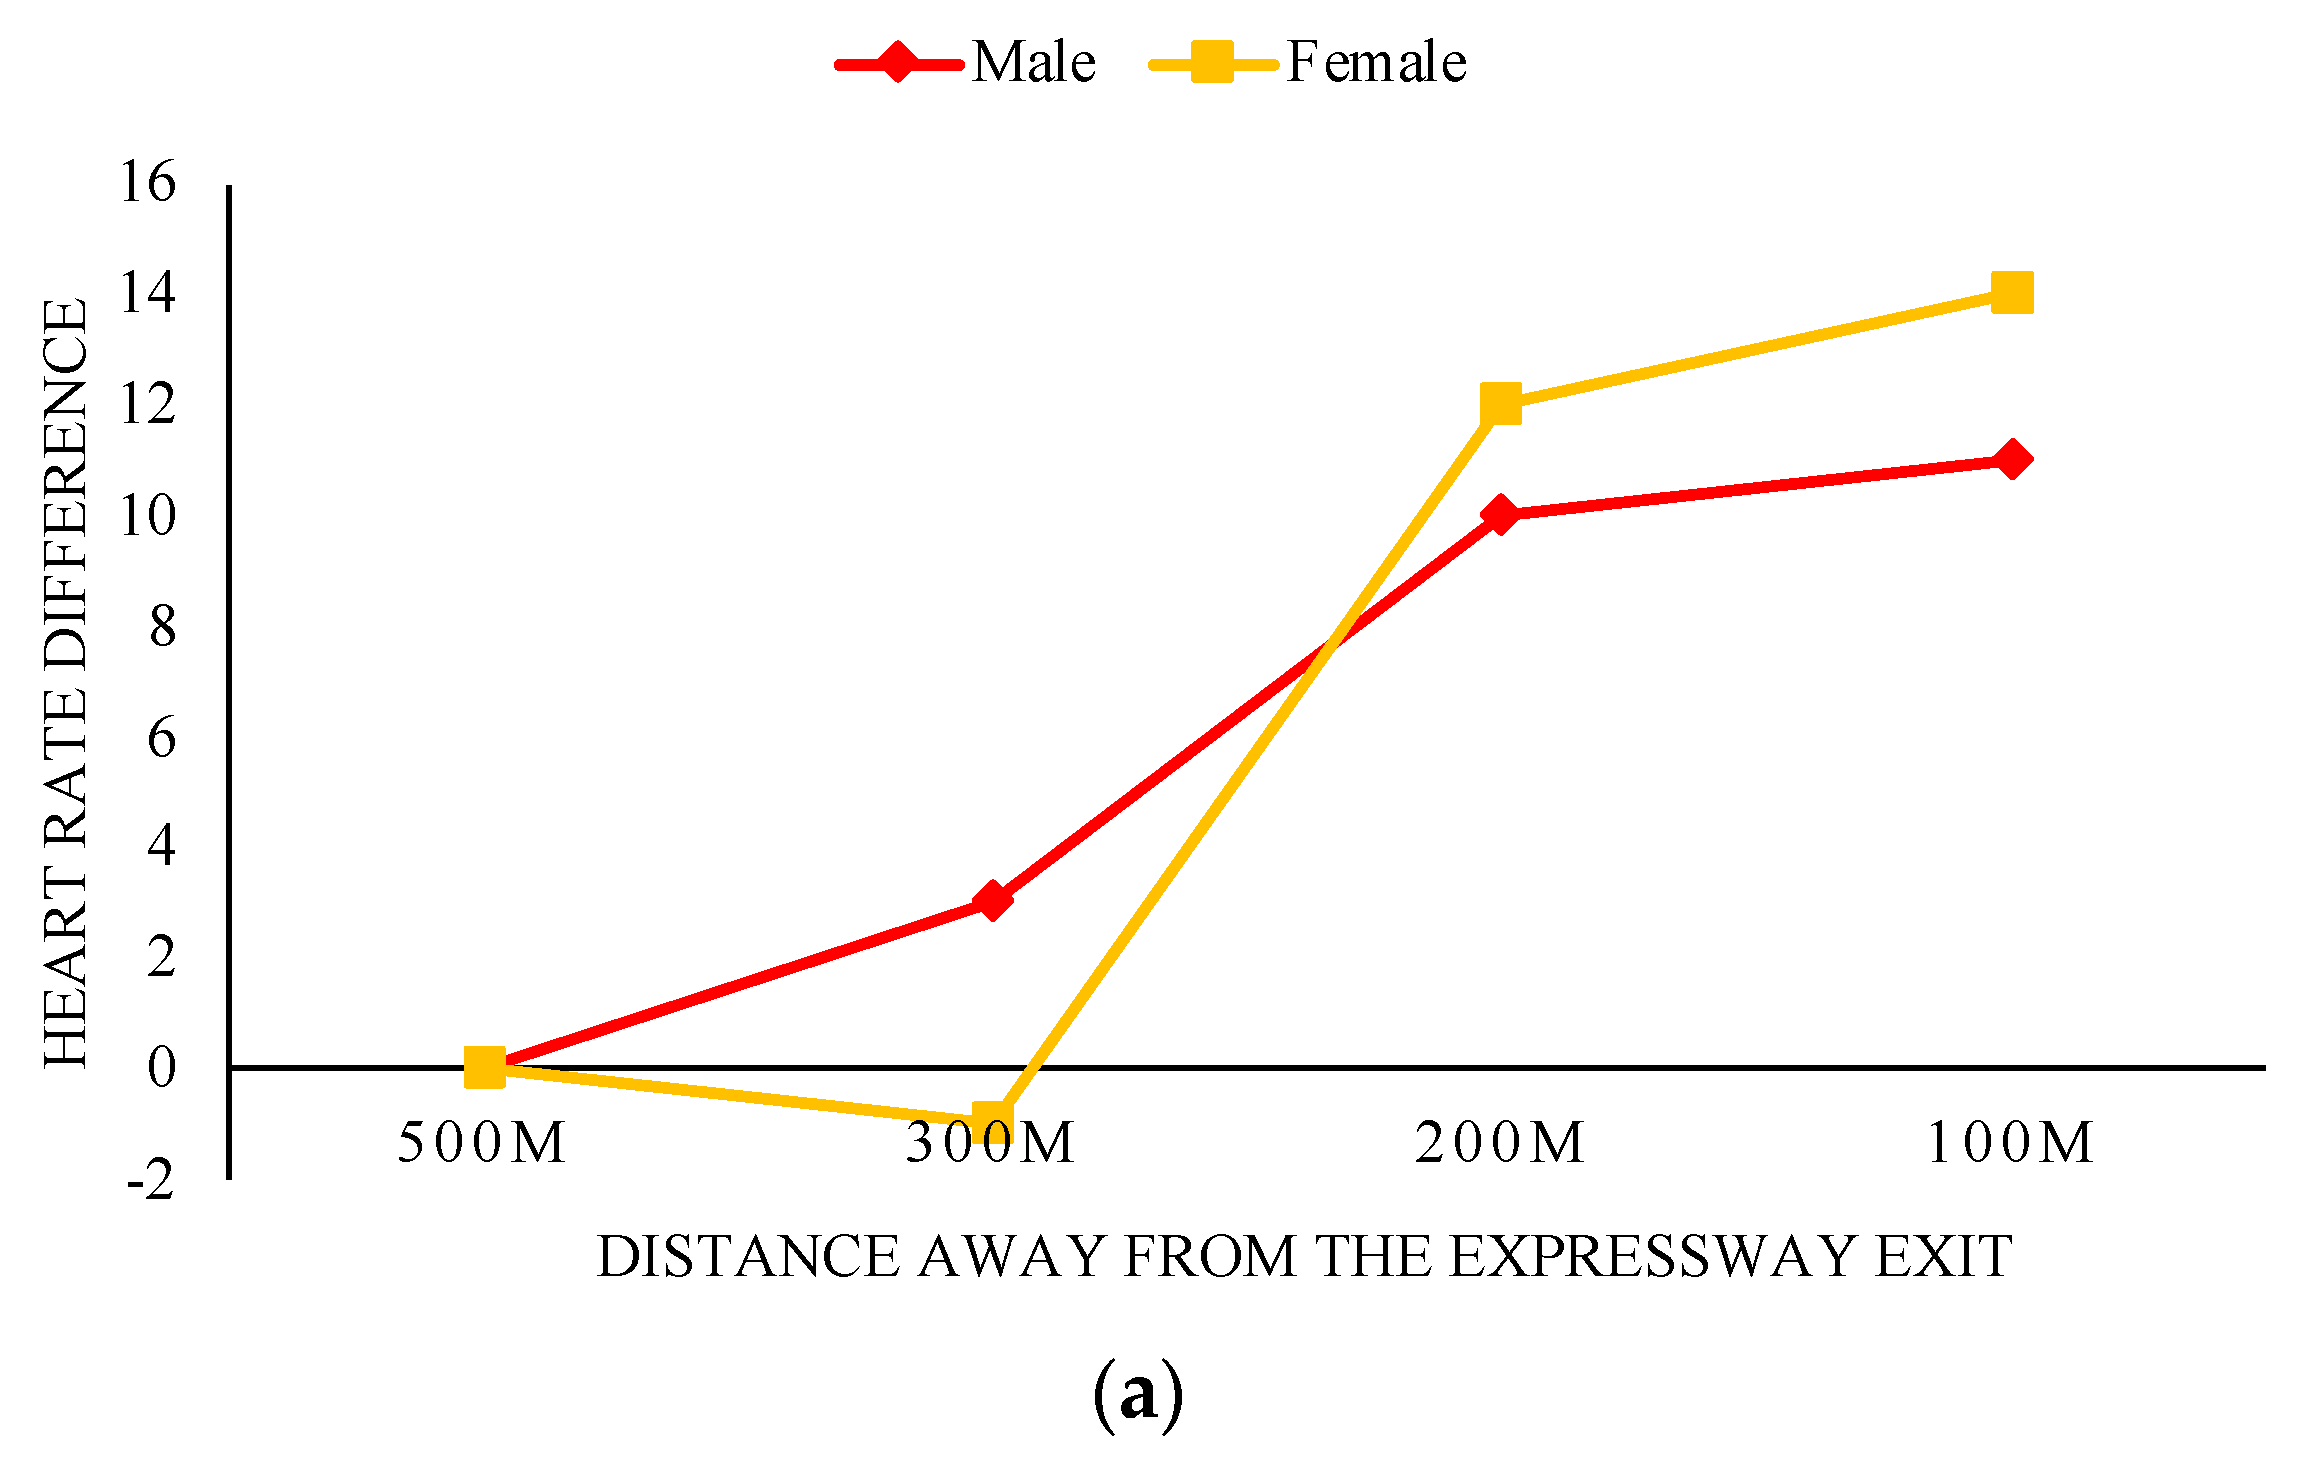
5.3. Heart Rate
6. Concluding Remarks
- The influence of the driver’s characteristics on the number of fixation times is mainly studied for the fixation behavior. The results showed that gender, driving mileage, and fixation number strongly correlate. In contrast, the driving experience has almost no correlation with the fixation behavior characteristics of young drivers at an expressway exit.
- The effect of driver characteristics on the average saccade magnitude showed that the average saccade magnitude could be affected by gender and driving mileage. At the same time, the driving experience has almost no correlation with the saccade behavior characteristics of young drivers at an expressway exit.
- Concerning the heart rate, previous studies have shown a significant individual difference in the heart rate and considerable uncertainty in the case of small samples. Therefore, this study mainly analyzed the difference in the heart rate. The correlation between gender and the heart rate was weak, while the correlation between driving experience and driving mileage was strong for the change in the heart rate at an expressway exit.
- Interestingly, the correlation between the driver’s age, the number of fixation times, and the average saccade amplitude was low for young drivers. This is because the number of fixation times and the average saccade are related to the driver’s driving experience. The longer the driving experience, the smaller the average saccade, and the less frequently an experienced driver looks at the right rearview mirror since the experienced driver quickly determines the road conditions and opts for the appropriate driving behavior.
- Most young drivers in China do not necessarily have an immediate chance of obtaining a driver’s license. After obtaining their license, they may still go to school or own a vehicle, so the age-responsive driving experience is unacceptable for young drivers. In contrast, driving mileage is a parameter that directly reflects the driver’s driving experience. Therefore, the driving experience is directly related to the driver’s driving mileage, so driving mileage is strongly related to the number of fixation times and the average saccade range.
- Several practical implications could be developed based on such findings. For instance, the young drivers could practice their driving skills under the supervision of an experienced driver. An education program could be effective for the young drivers to improve their driving skills and form safe driving habits. The parents are also encouraged to be actively involved in the young drivers’ driving education and monitor their progress, such as leaving an expressway at an exit. Moreover, more effective measurements should be set up to improve the driving safety on expressway exit ramps for the highway planners and designers.
Author Contributions
Funding
Institutional Review Board Statement
Informed Consent Statement
Data Availability Statement
Conflicts of Interest
References
- Ji, W. Research on Urban Road Vehicle Lane Change Model Based on Driving Behavior Analysis. Master’s Thesis, Harbin University of Technology, Harbin, China, 2018. [Google Scholar]
- Sun, H.; Liu, X.; Huang, K. Driver following characteristics based on high-speed natural driving data. J. Shandong Jiaotong Univ. 2020, 28, 23–29+62. [Google Scholar]
- Xiong, X.; Chen, L.; Liang, J.; Cai, Y.; Jiang, H.; Chen, Y. Research on Prediction Method of Dangerous Lane-changing Driving Behavior. Automot. Eng. 2017, 39, 1040–1046+1067. [Google Scholar]
- Portera, A.; Bassani, M. Factors influencing driver behaviour along curved merging interchange terminals. Transp. Res. Part F Psychol. Behav. 2020, 75, 187–202. [Google Scholar] [CrossRef]
- Yuan, W. Experimental Study on Dynamic Visual Characteristics of Automobile Drivers in Urban Road Environment. Ph.D. Thesis, Chang’an University, Xi’an, China, 2008. [Google Scholar]
- Yu, Y.; Liang, J.; Chen, L.; Chen, X.; Zhu, N.; Hua, G. Emergency lane-changing behavior prediction method based on Gauss Mixed Hidden Markov Model and Artificial Neural Network. China Mech. Eng. 2020, 31, 2874–2882+2890. [Google Scholar]
- Ji, B. Research on Driving Behavior Forecasting Method Based on Driver Visual Characteristics. Ph.D. Thesis, Jilin University, Changchun, China, 2014. [Google Scholar]
- Hou, H. Research on Methods for Identifying Drivers’ Interchange Intent on Expressway. Ph.D. Thesis, Jilin University, Changchun, China, 2013. [Google Scholar]
- Feng, J. Research on Driving Characteristics of Lane-Changing Vehicles Based on Driver Behavior. Master’s Thesis, Wuhan University of Technology, Wuhan, China, 2018. [Google Scholar]
- Sheng, Y. Driver Model Considering Visual Cognitive Characteristics. Master’s Thesis, Jilin University, Changchun, China, 2020. [Google Scholar]
- Tang, L. Analysis and optimization of safety influencing factors at the entrance and exit of Expressway. Transp. World 2020, 19, 38–39. [Google Scholar]
- Wei, C. Driver Changing Behavior Forecast Based on Deep Learning. Master’s Thesis, Chang’an University, Xi’an, China, 2020. [Google Scholar]
- Wang, Y.; Yin, H. Driving behavior prediction based on AIOHMM model. Inf. Commun. 2019, 3, 120–123. [Google Scholar]
- Cheng, J. Research on the Impact of Emotion on Driving Behavior. Master’s Thesis, Southwest Jiaotong University, Chengdu, China, 2019. [Google Scholar]
- Cheng, J.; Zhang, Y. Prediction of Vehicle Driving Behavior under Different Emotions. J. Transp. Eng. Inf. 2019, 17, 125–132. [Google Scholar]
- Mahmud, M.; Gates, T.; Savolainen, P.; Safaei, B. Driver response to a dynamic speed feedback sign at a freeway exit ramp considering the sign design and installation characteristics. Transp. Res. Rec. 2023, 2677, 289–301. [Google Scholar] [CrossRef]
- Tian, X. Evaluation and Application of Driver’s Mental Load Based on Heart Rate Variability. Master’s Thesis, Northern University of Technology, Beijing, China, 2016. [Google Scholar]
- Chen, X.; Liu, S.; Zhao, J.; Wu, H.; Xian, J.; Montewka, J. Autonomous port management based AGV path planning and optimization via an ensemble reinforcement learning framework. Ocean. Coast. Manag. 2024, 251, 107087. [Google Scholar] [CrossRef]
- Zhang, D.; Chen, F.; Zhu, J.; Wang, C.; Cheng, J.; Zhang, Y.; Bo, W.; Zhang, P. Research on drivers’ hazard perception in plateau environment based on visual characteristics. Accid. Anal. Prev. 2022, 166, 106540. [Google Scholar] [CrossRef] [PubMed]


| Previous Research Efforts | Findings | Research Gap |
|---|---|---|
| Ji [1] and Sun et al. [2] | The authors classified lane-changing behavior into two categories according to the purpose of lane changing: subjective lane-changing behavior (driven by the driver’s subjective desire for better lane-changing benefits) | However, drivers’ forced lane-changing behavior at an expressway exit was not analyzed. |
| Ji [1] and Xiong et al. [3] | They analyzed the conditions of these behaviors and the main influencing factors of drivers’ lane-changing behavior, such as drivers’ characteristics, vehicle type, traffic flow environmental impact, and road conditions. Finally, they established an urban road vehicle lane-changing model based on driving behavior (subjective lane-changing model, forced lane-changing model) | However, there was no specific correlation analysis between drivers’ characteristics and the characterization parameters of lane-changing behavior. |
| Portera and Bassani [4] | They studied the influencing factors on driving behavior at expressway off-ramps and on-ramps. It was proposed that the radius of the lane circle curve, the position of the entrance and exit ramps, and the length of the ramps significantly influence drivers’ driving behavior. | However, the parameters, such as the radius of the lane circle curve, were not mapped to the characterization parameters, such as drivers’ visual characteristics. |
| Yuan [5] and Yu et al. [6] | They fitted the distribution functions of three parameters, i.e., fixation duration, saccade amplitude, and saccade speed. They found that they had approximately logarithmic, exponential, and logarithmic normal distributions, respectively. The proficiency level significantly influences four parameters, by comparing and counting the parameters of proficient and unskilled drivers. The dynamic clustering theory was used to determine the fixation area and to divide the various fixation areas. | However, the differences in proficiency among various types of drivers and their correlation with visual characteristics were not specifically analyzed. |
| Ji [7] | Three evaluation indexes of visual characteristics were determined: fixing characteristics’ evaluation indexes (fixation times, fixation duration, line of vision transfer probability); evaluation indexes of saccade characteristics (saccade duration, saccade range, and saccade speed); head motion evaluation indexes (rotation angle of vertical motion, rotation angle of horizontal motion). The drivers were classified into various styles, and their correlations to fixation, saccade, and head movement behaviors were analyzed. | The influence of drivers’ characteristics on visual characteristics was neglected. |
| Hou [8] and Feng [9] | They determined the driving intent time windows according to the driving style of various drivers. They built GM-HMM and SVM models based on the difference significance analysis [10]. Finally, they concluded that the parameters of drivers’ perceptual characteristics of lane-changing intention were the number of rearview mirror views, the average saccade amplitude, and the standard deviation of the head horizontal angle [11]. | |
| Wei [12] | They studied the predictions of drivers’ lane-changing behavior based on in-depth learning and correlated the visual characteristics with drivers’ behavior characteristics. | However, the driver’s features were not related to visual attributes. |
| Wang and Yin [13] | They concluded that driving behavior is influenced by drivers’ driving intentions and the driving environment outside the vehicle. | However, the driver’s features and psychological characteristics were not analyzed. |
| Cheng [14], and Cheng and Zhang [15] | They preprocessed and extracted physiological signal data and designed neural network architecture. The changing regularity of drivers’ psychological and physiological characteristics during driving was analyzed. | |
| Mahmud et al. [16] | The effectiveness of dynamic speed feedback signs (DSFSs) as a speed reduction countermeasure was evaluated. | |
| Tian [17] | The heart rate variability parameter was mainly used to obtain the time-frequency domain index of the ECG signal. The authors studied this aspect and proposed that in the element of ECG detection, the ECG data should generally be paid attention to, mainly analyzing the time-frequency domain index of the ECG signal. | The change in the driver’s heart rate during a lane change at an expressway exit was not analyzed. |
| Sun et al. [2] | They analyzed the correlation between drivers’ characteristics and psychophysiological characteristics under natural driving conditions on the expressway. |
| Variable | Variable Name | Instruction |
|---|---|---|
| Independent Variable | Driver Characteristics | Gender, Driving Experience, Driving Mileage |
| Dependent Variable | Visual attribute (Fixation) | Fixation Times, Percentage of Cumulative Fixation Duration |
| Visual attribute (Saccade) | Average Saccade Amplitude, Average Saccade Speed |
| Question | Answer Form |
|---|---|
| Name | Fill in the Blanks |
| Gender | Multiple-choice |
| Driving Experience | Multiple-choice |
| Whether or Not Owns a Car | Multiple-choice |
| Driving Hours Per Day | Multiple-choice |
| Mileage Per Week | Multiple-choice |
| Mileage Per Year | Multiple-choice |
| Number of Violations in One Year | Multiple-choice |
| Number of Accidents in a Year | Multiple-choice |
| Points Deducted from Driving License within a Year | Fill in the Blanks |
| Category | Initial Cluster Center | Final Cluster Center | Number of Cases |
|---|---|---|---|
| = 4) | |||
| 1 | (−55.96, −16.88) | (−46.54, 13) | 13 |
| 2 | (35.36, 3.28) | (22.18, 2.76) | 17 |
| 3 | (50.99, −20.40) | (44.77, −19.65) | 121 |
| 4 | (18.44, 21.05) | (18.83, 22.04) | 12 |
| = 5) | |||
| 1 | (−54.77, −16.45) | (−46.54, 13) | 14 |
| 2 | (17.45, 22.17) | (23.64, 5.63) | 23 |
| 3 | (−8.55, −6.04) | (2.845, −6.44) | 137 |
| 4 | (−47.11, 22.16) | (−20.44, −3.39) | 7 |
| 5 | (−14.48, −42.37) | (−10.81, −27.67) | 14 |
| = 6) | |||
| 1 | (17.65, −14.34) | (23.00, 7.45) | 21 |
| 2 | (−11.33, 1.48) | (0.75, −3.91) | 21 |
| 3 | (−13.88, −43.58) | (−19.92, −9.66) | 145 |
| 4 | (−47.45, 21.68) | (−20.68, 4.22) | 6 |
| 5 | (47.65, −22.34) | (47.66, −12.53) | 14 |
| 6 | (16.63, −27.77) | (5.33, −7.44) | 3 |
Disclaimer/Publisher’s Note: The statements, opinions and data contained in all publications are solely those of the individual author(s) and contributor(s) and not of MDPI and/or the editor(s). MDPI and/or the editor(s) disclaim responsibility for any injury to people or property resulting from any ideas, methods, instructions or products referred to in the content. |
© 2024 by the authors. Licensee MDPI, Basel, Switzerland. This article is an open access article distributed under the terms and conditions of the Creative Commons Attribution (CC BY) license (https://creativecommons.org/licenses/by/4.0/).
Share and Cite
Wang, Z.; Qi, X.; Wang, C.; Easa, S.M.; Chen, F.; Cheng, J. Correlation Analysis between Young Driver Characteristics and Visual/Physiological Attributes at Expressway Exit Ramp. Eng 2024, 5, 1435-1450. https://doi.org/10.3390/eng5030076
Wang Z, Qi X, Wang C, Easa SM, Chen F, Cheng J. Correlation Analysis between Young Driver Characteristics and Visual/Physiological Attributes at Expressway Exit Ramp. Eng. 2024; 5(3):1435-1450. https://doi.org/10.3390/eng5030076
Chicago/Turabian StyleWang, Zeng’an, Xinyue Qi, Chenzhu Wang, Said M. Easa, Fei Chen, and Jianchuan Cheng. 2024. "Correlation Analysis between Young Driver Characteristics and Visual/Physiological Attributes at Expressway Exit Ramp" Eng 5, no. 3: 1435-1450. https://doi.org/10.3390/eng5030076