Abstract
This research focuses on cylindrical helical springs with circular cross-sections made from carbon steel (SH 0.82% C) and stainless steel (AISI 302). The transformation from a linear bar to a circular spiral involves numerous factors such as material mechanical behavior, stress–strain relationships and residual stresses. This research investigates the spring-back phenomenon, which affects the final diameter of helical springs post-manufacture, using analytical, experimental and numerical methods. An analytical model, derived from the mechanical bending process, was proposed to predict spring-back, and its accuracy was validated against experimental data. This study also employed finite element simulations to analyze elastic recovery, confirming the analytical predictions. Results indicated that the spring-back ratio k could be expressed as an exponential function of the spring index C (the ratio between the final diameter of the spring D2 and the diameter of the wire DW), with a maximum error of 4.80% for stainless steel and 3.62% for carbon steel. This study’s findings provide valuable insights into optimizing the spring manufacturing process, enhancing the precision of spring diameter predictions, and potentially reducing production errors and material waste.
1. Introduction
Springs are one of the most important components used in various industrial applications. Broadly speaking, it can be said that there are no machines that do not utilize this component. The primary applications of springs include addressing vibration-related problems to reduce dynamic effects, preventing shock loads, applying force in a specific pattern, and more.
For the purposes mentioned above, numerous types of springs are used in the automotive sector. For example, Salah [1] discussed the design of coil springs for automotive suspension systems, while Solazzi [2] presented the design of a torsion spring bar for the cab suspension system of an industrial vehicle.
One of the most important parameters in the design of springs is the evaluation of their dynamic behavior, which is related to both the natural frequencies of vibration and the displacement of the spring under a specific load. This aspect is crucial because it can either increase or decrease the displacement or transmission force between the two elements connected by the spring [3,4,5].
The static axial load also influences the magnitude of natural frequencies [6]. The design problem of coil springs, particularly the estimation of deflections or the stress state of the wire, is highly complex due to its nonlinear nature [7]. This can be evaluated using analytical or numerical methods [8,9,10]. Recently, to reduce component weight, innovative materials have been introduced for the construction of coil springs [11,12,13].
Both the design and manufacturing processes of coil springs are very complicated. This complexity arises because the process begins with a linear straight bar that is transformed into a circular spiral, forming the coil spring. This process involves many factors, such as the mechanical behavior of the material, including the stress–strain curve (particularly Young’s modulus and yield stress [14], plasticity, and residual stress [15,16]. Additionally, whether the material exhibits kinematic or isotropic hardening [14] significantly affects the mechanical behavior.
Helical compression springs for automotive suspensions are made using either cold coiling or hot coiling processes. In hot coiling, steel wire is heated above the austenitizing temperature, coiled, quenched, and tempered, which can cause decarburization and surface scaling, detrimental to fatigue performance. In cold coiling, wire is coiled at room temperature, preset with torsion residual stress, and shot peened, avoiding decarburization and scaling since stress relief occurs below the austenitizing temperature. Optimizing stress management in springs involves balancing stress relief temperature, wire strength, shot peening intensity, and presetting conditions. Understanding the effects of each processing step on residual coiling stresses is essential for achieving optimal residual stress in helical springs. Kobelev [16] presented a model to simulate residual stresses in helical springs due to pre-setting, using the deformational theory of plasticity. It provided analytical formulas to assess residual stresses, changes in spring shape, and pre-setting force over spring travel. The method allowed expressing torque as a function of spring travel and residual stresses in a closed form. The analysis included elastic–plastic bending and torsion, offering closed-form solutions for preset moments and elastic spring-back.
There is little literature on experimental measurements of spring-back in helical springs and its analytical prediction based on experimental values. In this paper, we focused on cylindrical helical springs with circular cross-sections made of two different steels. The bending theory of plates was applied to verify its applicability in spring production. In plate production, elastic recovery can simply be measured as the variation in the angle between the bent part before and after recovery, in relation to the angle produced by the tool, or by the ratio of these angles. Numerous diagrams allow manufacturers to account for recovery in sheet production, typically reporting the recovery with respect to the ratio between the angle after recovery and plate thickness. Marciniak [17] and Gardiner [18] first proposed an analytical solution to predict elastic recovery, but they only hypothesized a perfectly plastic elastic behavior. Gonzalez-Coleo et al. [15] later introduced a model that considered hardening after yielding. The main drawback of these studies is that they are based on the elastic curve formulation, which is consistent with small thickness geometries; indeed, in these studies, the error in the estimation of recovery increased with increasing sheet thickness. Furthermore, larger thicknesses are affected by different hardening areas that are not considered in the models.
In this article, the bending theory of plates is used to predict the elastic recovery of cylindrical springs with circular cross-sections. First, the machine used to produce these springs will be described, and data will be collected for different sizes and two materials. Then, a model for estimating recovery will be proposed, and the equation proposed in [15] will be validated. Finally, as an alternative to analytical models, a numerical finite element model with a nonlinear solver will be proposed.
2. Experimental Details
Modern machines used to produce cylindrical helical springs are numerically controlled with 4 to 12 axes. These machines consist of a straightening and feeding area for the wire and a winding-cutting area for the spring. The wire, unwound from a coil, passes through a series of straightening rollers and then through two or four pairs of rollers that press the wire from above and below, rotating and pushing it to the next stage. Figure 1 shows a machine that produces springs from wire with diameters ranging from 2.5 to 8 mm.
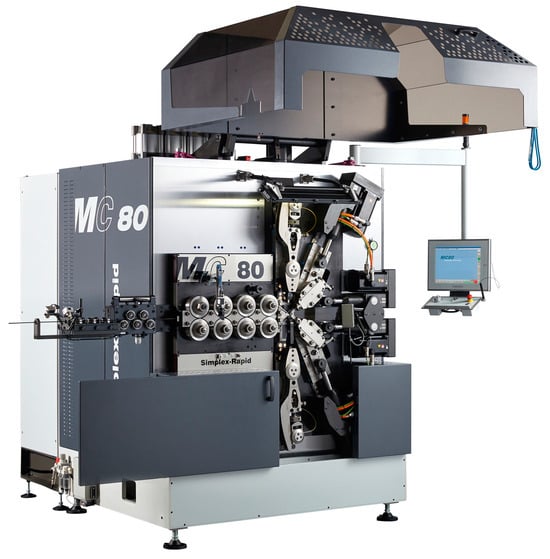
Figure 1.
Bench machine for 2.5–8 mm springs.
Figure 2 shows a detailed view of the feeding and winding section with the following components: (1) feed rollers, which pull the wire from the coil (fed from the left in this photo) and push it to the right; (2) vertical pitch, which moves up and down to deform the wire and create the spring’s pitch; (3) cutter, which cuts the wire against the central mandrel; (4) horizontal pitch, which has the same function as the vertical pitch but is used for springs with larger diameters; (5) coiling fingers, which guide and bend the wire to form the helix; and (6) central mandrel. Smaller machines have six axes, while larger ones have ten axes, with four motors controlling the diameter (radial and tangential movement for the two winding tips) and an additional one for the rotation of the lower tip.
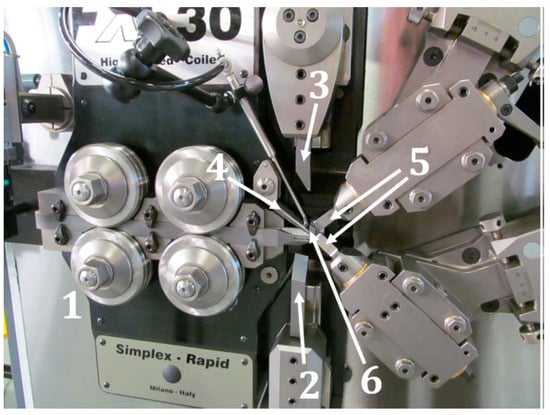
Figure 2.
Detail of machine coiling systems: (1) feed rollers, (2) vertical pitch, (3) cutter, (4) horizontal pitch, (5) coiling fingers, and (6) central mandrel.
To regulate the coiling diameter on a machine and control the diameter axes via the system interface, manual adjustments are required for the axial position and vertical plane rotation at the first and second winding points. These tasks are crucial during winding to center the spring relative to the axis of the central pin, ensuring that the wire is cut at the highest horizontal point of the coil and that the contact point of the wire with the tips is centered within the channel. A crucial aspect of spring production is the diameter variation due to spring-back phenomena.
Given the manual nature of these adjustments, achieving accurate and repeatable positioning of the winding tips to form an exact circle is challenging. Indeed, with identical diameter axis positions displayed on the control, incorrect adjustments can result in springs with diameters differing by up to several millimeters. To quantify this effect, for each wire size, the position of the diameter axis relative to the winding diameter was documented alongside the winding and
graphs (where
is the diameter variation due to spring-back phenomena).
The relationship between the electronically set diameter interval and the measured diameter difference exhibits a consistent and repeatable trend.
Accurate measurements of the cut spring can be obtained using a centesimal caliper. However, measuring the winding diameter is more challenging; only half a coil can be measured on the machine, and the space for the caliper is very limited for small spring diameters. Additionally, small wire diameters are very flexible, and even slightly excessive pressure from the caliper can result in inaccurate measurements. The maximum estimated error for these measurements was approximately 0.2 mm, an acceptable margin for this work.
Springs with wire diameters ranging from 0.05 to 12 mm for this study were selected. The investigated springs were made of carbon steel type SH (0.82% C) and stainless steel AISI 302, which are among the most common materials for producing small and medium-sized springs. The chemical compositions of these steels are reported in Table 1 and Table 2. Table 3 reports the ultimate tensile stress and the yield stress.

Table 1.
Chemical composition of the SH steel (EN 10270-1) [19].

Table 2.
Chemical composition of the AISI 302 steel (EN 10270/3 [20]; DIN EN ISO 6931-1 [21]).

Table 3.
Mechanical properties according to the wire diameters.
Various springs were manufactured for each wire size and material type, with a spring index ranging from 4 to 25. The spring index
is defined as the ratio between the final diameter of the spring
and the diameter of the wire DW.
For each spring size, we measured the diameter across the two winding points to calculate the diameter increase. Figure 3 illustrates the diameter variation
of the spring before (
) and after spring-back (
) for carbon steel springs (a) and stainless-steel springs (b) according to the spring index
. The higher elastic return in stainless steel can be ascribed to the lower Young modulus (185 GPa for the stainless steel and 206 GPa for the carbon steel) combined with the lower yield strength.
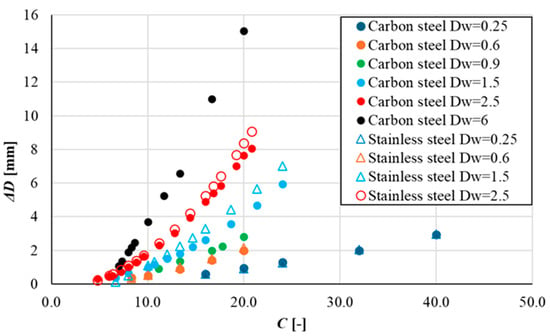
Figure 3.
Experimental correlation between index factor C and spring-back.
3. Analytical Approaches
This section reviews various approaches for predicting the spring-back.
The first method we investigate is derived from the mechanical bending process and based on the spring-back ratio
, defined as follows [22]:
where
and
are for the bending angles (see Figure 4). This approach has been widely adopted for several materials, but curves for the steels investigated in this paper are not available.
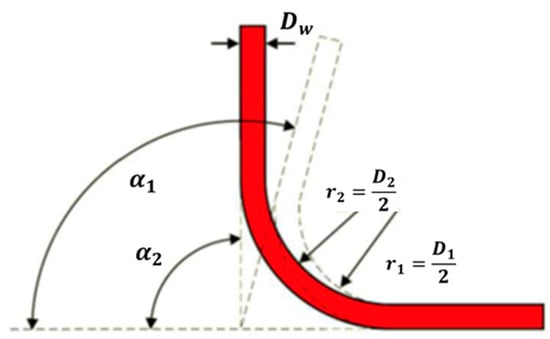
Figure 4.
Definition of angles and radii r1 and r2 before recovery (1) and after recovery (2).
Figure 5 shows the spring-back parameter k as a function of the spring index C for the two materials. An exponential function was chosen to fit the points:
where Table 4 reports the estimated variables for carbon steel and stainless steel, with each coefficient of determination R2.
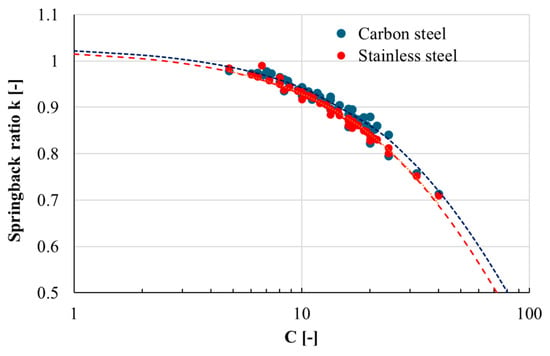
Figure 5.
Spring-back parameter k of carbon steel and stainless steel as a function of spring index C (dotted lines represent the interpolation curves).

Table 4.
Coefficient of interpolation for Equation (2).
Table 5 and Table 6 report the spring geometrical parameters, the k parameter derived by applying Equation (1) and using the diameters
and
estimated during the spring production process (
), and the
parameter calculated from Equation (2). The maximum error is about 3.62% and 4.80% for carbon and stainless steels, respectively.

Table 5.
Spring geometry details and results from spring-back recovery k for carbon steel (
is the parameter experimentally found;
is the one calculated from Equation (2)).

Table 6.
Spring geometry details and results from spring-back recovery k for stainless steel (
is the parameter experimentally found;
is the one calculated from Equation (2)).
Gonzalez-Coleo et al. [15] recovery model was based on the plasticity constitutive law of the steel:
where n is the nondimensional hardening exponent describing the plastic trend of the tensile test,
the Young’s modulus,
the yield stress,
the radius curvature before the spring-back,
the radius curvature after the spring-back. The yield stresses are reported in Table 4, while the strain hardening exponent is 0.1. Table 7 shows the relative error between the nominal diameter experimentally found and that calculated from Equation (3); the error increases with the spring index
. The error can be ascribed to the fact that Equation (3) focuses solely on the bending phenomenon. As the spring diameter increases, it is overly simplistic to consider only bending; torque should be included as well, for instance.

Table 7.
Spring recovery according to Equation (3) for carbon steel and relative error with respect to experimental results.
4. Numerical Simulations
We conducted finite element simulations to investigate the effect of elastic return in spring production using Ansys. This analysis requires a nonlinear solver. The model contains six components, as labeled in Figure 6: spring steel wire (1), coiling mandrel (2), and two rollers that bend the wire on the inner disc (3), which are joined to the support braces (4). Except for the wire, all components are designated as rigid, allowing the mesh to be generated solely on the surfaces in contact with the wire, preventing deformations of the rollers or arms that could result in inaccurate calculations and extended solving times.
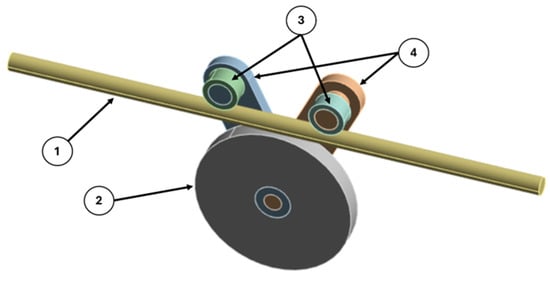
Figure 6.
Finite element model: (1) spring steel wire, (2) coiling mandrel, (3) rollers, and (4) support braces.
SH class steel was characterized using the tensile test chart of the same type and batch of material used in the coiling tests previously reported. Table 8 lists the mechanical properties of the steel. To account for the plastic behavior, we implemented an elastic–plastic constitutive model; in detail, a bilinear law approximated the stress–strain tensile curve.

Table 8.
Mechanical properties implemented in finite element simulations.
The two support braces are attached to the central disc using revolute joints, allowing them to rotate. Similarly, the two rollers are attached to the upper pivots of the arms using revolute joints, enabling their rotation. The central disc is fixed to the ground. The wire is constrained from moving vertically, keeping it centered on the disc and rollers throughout the process. The bending operation is performed by rotating the arms: the right arm rotates clockwise up to 90° and then back to 75°, while the left arm rotates counterclockwise up to 90° and then back to 75°. This motion retracts the rollers, releasing the wire.
The interaction between the wire and the rollers is set through a contact constraint with an Augmented Lagrange method. This was chosen because it provides more accurate results than those obtained through a Pure Penalty method and shorter calculation times, much less than what is required by Normal Lagrange. Additionally, the chosen method does not present any risk of contact vibration (which is possible with Normal Lagrange) and has low permissible contact penetration values. The pure penalty method allows high overlapping values, which result in inaccurate diameter measurements.
The contact behavior is set to asymmetric, and the friction coefficient is set at 0.4. The coiling tools of the actual machine are made of lapped tungsten carbide, while the wire is covered with a thin layer of stearate, which reduces friction during the forming process.
The components are discretized using tetrahedral elements. For the simulation with 6 mm diameter wire and 65 mm coiling diameter, the number of nodes is 26,894, and the number of elements is 5871, as shown in Figure 7. These belong mostly to the steel wire since all other elements are rigid, and the mesh is generated only on the surfaces of the components that come into contact with the wire. Figure 8 and Figure 9 illustrate the progression of the wire throughout the simulations.
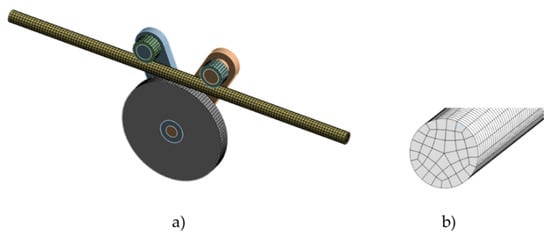
Figure 7.
Detail of model mesh: (a) overall model; (b) wire detail.
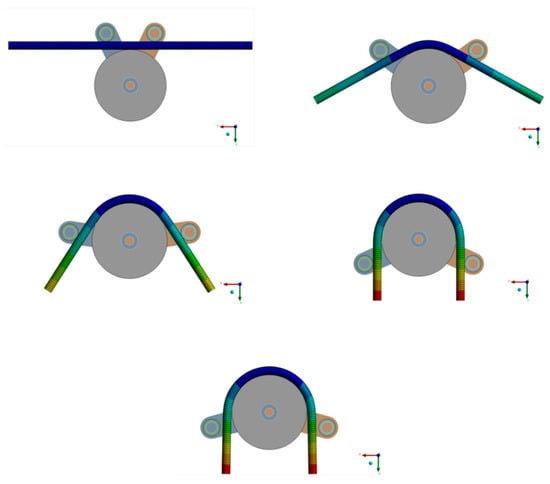
Figure 8.
Deformation steps during the simulation.
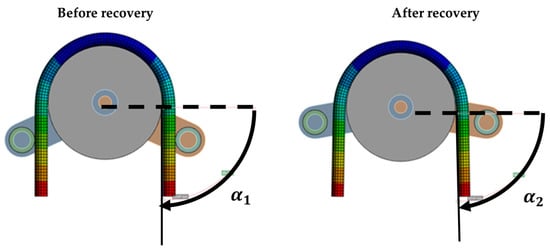
Figure 9.
Elastic return detail.
The simulations results were calculated based on the parameter
. Firstly, the angles
and
were estimated from the simulations as shown in Figure 9. Subsequently,
using Equation (1) and, finally, the final diameter
according to the following equations:
where
is the diameter after the spring-back estimated by the finite element mode,
is the diameter before the spring-back and
the wire diameter.
Table 9 shows the simulation results. The extent of spring-back increases nonlinearly as the spring index increases. Of note, the relative errors found in the numerical models are consistent with those calculated with Equation (3). The relative errors are not more than 8%. However, the computation time (in general more than 5 h) makes simulations a less practical method compared to an analytical prediction.

Table 9.
Detail of finite elements model results.
5. Conclusions
This research provided an in-depth analysis of the spring-back phenomenon in cylindrical helical springs made of carbon steel and stainless steel. By employing both experimental measurements and analytical models, the exponential relationship between the spring-back ratio
(Equation (1)) and the spring index
(the ratio between the final diameter of the spring
and the diameter of the wire 2s) is determined. The maximum errors for the predicted spring-back were 4.80% for stainless steel and 3.62% for carbon steel, demonstrating the model’s accuracy. Furthermore, a model requiring the initial diameter, thickness, and plastic properties of the material as input data were employed. The outcomes of this model were dependent on the spring index
, with the error increasing as
increased.
Additionally, finite element simulations corroborated the analytical predictions, though they required significant computation time. These findings offer valuable insights for optimizing spring manufacturing processes, enhancing precision, and minimizing material waste.
Future work could explore more geometries and materials to further refine predictive models and improve manufacturing efficiency.
Author Contributions
Conceptualization, L.S.; methodology, N.Z. and L.S.; validation, N.Z. and L.S.; investigation, N.Z. and L.S.; resources, L.S.; data curation, N.Z.; writing—original draft preparation, N.Z.; writing—review and editing, N.Z. and L.S.; visualization, N.Z.; supervision, L.S. All authors have read and agreed to the published version of the manuscript.
Funding
This research received no external funding.
Institutional Review Board Statement
Not applicable.
Informed Consent Statement
Not applicable.
Data Availability Statement
The original contributions presented in the study are included in the article, further inquiries can be directed to the corresponding author.
Acknowledgments
The authors would like to thank you very much to Marco Biggiogero for the experimental support for this research.
Conflicts of Interest
The authors declare no conflicts of interest.
References
- Salah, H.R.A.; Mostafa, A.; Eslam, E.; Youssef, T.; Ibrahim, S.; Mina, S. 3D Design of helical spring for automotive independent suspension system under fatigue test conditions. In Applied Mathematics, Modelling and Computer Simulation; IOS Press: Amsterdam, The Netherlands, 2023. [Google Scholar] [CrossRef]
- Solazzi, L. Design of a truck cab torsion bar. Int. J. Heavy Veh. Syst. 2019, 26, 692–706. [Google Scholar] [CrossRef]
- Yildirim, Y. Expressions for predicting fundamental natural frequencies of non-cylindrical helical springs. J. Sound Vib. 2002, 252, 479–491. [Google Scholar] [CrossRef]
- Yildirim, V. Free vibration of uniaxial composite cylindrical helical springs with circular section. J. Sound Vib. 2001, 239, 321–333. [Google Scholar] [CrossRef]
- Yu, A.M.; Hao, Y. Free vibration analysis of cylindrical helical springs with noncircular cross-sections. J. Sound Vib. 2011, 330, 2628–2639. [Google Scholar] [CrossRef]
- Kobelev, V. Effect of static axial compression on the natural frequencies of helical springs. Multidiscip. Model. Mater. Struct. 2014, 10, 379–398. [Google Scholar] [CrossRef]
- Zhuo, Y.; Qi, Z.; Zhang, J.; Wang, G. A geometrically nonlinear spring element for structural analysis of helical springs. Arch. Appl. Mech. 2022, 92, 1789–1821. [Google Scholar] [CrossRef]
- Yu, A.; Yang, C. Formulation and evaluation of an analytical study for cylindrical helical springs. Acta Mech. Solida Sin. 2010, 23, 85–94. [Google Scholar] [CrossRef]
- Čakmak, D.; Tomičević, Z.; Senjanović, I.; Wolf, H.; Božić, Ž.; Semenski, D. A Study on Cylindrical Coil Spring Deflection and Stress Done Using Analytical and Numerical Methods. Int. J. Eng. Model. 2022, 35, 57–81. [Google Scholar] [CrossRef]
- Kamil, F.; Abdulshaheed, A.G.; Kadhom, M.A. Development of a computational system to design a helical spring. Int. Rev. Appl. Sci. Eng. 2014. [Google Scholar] [CrossRef]
- Chen, L.; Wu, L.; Fu, H.; Tang, Y. Design and Performance Evaluation of Polymer Matrix Composite Helical Springs. Polymers 2022, 14, 3900. [Google Scholar] [CrossRef] [PubMed]
- Wu, L.; Chen, L.; Fu, H.; Jiang, Q.; Wu, X.; Tang, Y. Carbon fiber composite multistrand helical springs with adjustable spring constant: Design and mechanism studies. J. Mater. Res. Technol. 2020, 9, 5067–5076. [Google Scholar] [CrossRef]
- Nirala, A.; Kumar, N.; Bandhu Singh, D.; Kumar Singh, A.; Kumar Sharma, S.; Kumar Yadav, J.; Prasad, H.; Chandan, S.; Kumar Shrivastava, A. Simulation analysis of composite helical spring for compression, torsional and transverse mode. Mater. Today Proc. 2020, 28, 2263–2267. [Google Scholar] [CrossRef]
- Kobelev, V. Elastic–plastic deformation and residual stresses in helical springs. Multidiscip. Model. Mater. Struct. 2020, 16, 448–475. [Google Scholar] [CrossRef]
- González-Coneo, J.; Gonzalez-Olier, C.; Pedraza-Yepes, C.; Higuera-Cobos, O.; Troncoso-Palacio, A. Analytical method for elastic recovery prediction of air bending sheet. J. Appl. Eng. Sci. 2023, 21, 973–981. [Google Scholar] [CrossRef]
- Kobelev, V. Elastic-plastic work-hardening deformation under combined bending and torsion and residual stresses in helical springs. Int. J. Mater. Form. 2010, 3 (Suppl. S1), 869–888. [Google Scholar] [CrossRef]
- Marciniak, Z.; Duncan, J.L.; Hu, S.J. Mechanical of Sheet Metal Forming; Elsevier: Oxford, UK, 2002. [Google Scholar] [CrossRef]
- Gardiner, F.J. The springback of metals. Trans. ASME 1957, 79, 1–7. [Google Scholar] [CrossRef]
- EN 10270-1; Steel wire for mechanical springs. Part 1: Patented cold drawn unalloyed spring steel wire. iTeh Standards: Newark, DE, USA, 2017.
- EN 10270/3; Steel wire for mechanical springs. Part 3: Stainless spring steel wire. iTeh Standards: Newark, DE, USA, 2011.
- DIN EN ISO 6931-1; Stainless steels for springs—Part 1: Wire. ISO: Geneva, Switzerland, 2016.
- Kalpakjian, S.; Schmid, S. Manufacturing Engineering & Technology, 7th ed.; Pearson Publishing Company: Upper Saddle River, NJ, USA, 2014. [Google Scholar]
Disclaimer/Publisher’s Note: The statements, opinions and data contained in all publications are solely those of the individual author(s) and contributor(s) and not of MDPI and/or the editor(s). MDPI and/or the editor(s) disclaim responsibility for any injury to people or property resulting from any ideas, methods, instructions or products referred to in the content. |
© 2024 by the authors. Licensee MDPI, Basel, Switzerland. This article is an open access article distributed under the terms and conditions of the Creative Commons Attribution (CC BY) license (https://creativecommons.org/licenses/by/4.0/).