Article

Development of a Smart Material Resource Planning System in the Context of Warehouse 4.0

by
Oleksandr Sokolov
1,2,*,
Angelina Iakovets
1,
Vladyslav Andrusyshyn
1,2 and
Justyna Trojanowska
3
1
Faculty of Manufacturing Technologies with the Seat in Prešov, Technical University of Košice, Bayerova 1, 080 01 Prešov, Slovakia
2
Department of Manufacturing Engineering, Machines and Tools of the Sumy State University, Kharkivska 116, 40007 Sumy, Ukraine
3
Department of Production Engineering, Poznan University of Technology, M. Skłodowska-Curie Square 5, 60-965 Poznan, Poland
*
Author to whom correspondence should be addressed.
Eng 2024, 5(4), 2588-2609; https://doi.org/10.3390/eng5040136 (registering DOI)
Submission received: 31 August 2024 / Revised: 9 October 2024 / Accepted: 10 October 2024 / Published: 12 October 2024
(This article belongs to the Special Issue Feature Papers in Eng 2024)

Abstract

:
This study explores enhancing decision-making processes in inventory management and production operations by integrating a developed system. The proposed solution improves the decision-making process, managing the material supply of the product and inventory management in general. Based on the researched issues, the shortcomings of modern enterprise resource planning systems (ERPs) were considered in the context of Warehouse 4.0. Based on the problematic areas of material accounting in manufacturing enterprises, a typical workplace was taken as a basis, which creates a gray area for warehouse systems and does not provide the opportunity of quality-managing the company’s inventory. The main tool for collecting and processing data from the workplace was the neural network. A mobile application was proposed for processing and converting the collected data for the decision-maker on material management. The YOLOv8 convolutional neural network was used to identify materials and production parts. A laboratory experiment was conducted using 3D-printed models of commercially available products at the SmartTechLab laboratory of the Technical University of Košice to evaluate the system’s effectiveness. The data from the network evaluation was obtained with the help of the ONNX format of the network for further use in conjunction with the C++ OpenCV library. The results were normalized and illustrated by diagrams. The designed system works on the principle of client–server communication; it can be easily integrated into the enterprise resource planning system. The proposed system has potential for further development, such as the expansion of the product database, facilitating efficient interaction with production systems in accordance with the circular economy, Warehouse 4.0, and lean manufacturing principles.

1. Introduction

In the context of lean production [1], tracking material balances at workplaces is becoming increasingly challenging. Most enterprises make material reserves so customers can receive warranty or post-warranty service. The desire to produce a unique product affects the number of excess product components, which increase in enterprises and often do not go into the production cycle. It is essential not only to maintain flexibility in production and meet the needs of the customer but also to be able to put surplus or residual components into production to reduce the costs of servicing warehouse balances [2,3,4].
The constant development of production also affects the enterprise’s non-production activities, such as warehouses. Warehouse management has become subject to the basic principle of loading and unloading materials and an intelligent way of managing it, which should provide transparent information on the movement of materials and their accounting. Modern requirements for warehouse systems are mentioned in more detail in the concept of Warehouse 4.0, which implies the use of modern material labeling, IoT systems, and even digital twins. Full integration of all Warehouse 4.0 principles is a challenge for some companies, as it requires a readjustment of the company’s information system and even its reorganization. Processes of this type are very labor-intensive and costly. The problems of implementing Warehouse 4.0 principles are highlighted by the scientific articles of Agnieszka A. Tubis and Juni Rohman [5], K. Aravindaraaj and P. Rajan Chinna [6], Lihle N. Tikwayo and Tebello N. D. Mathaba [7], Walaa Hamdy and team [8], and Arso Vukicevic and team [9].
Agnieszka A. Tubis and Juni Rohman. [5], in their study, found that bottlenecks and the detailed research of Warehouse 4.0 were given the greatest share of attention in such research areas as Automation and Control Systems (23.3% of articles) and Business and Economics (22.1% of articles) [5]. These are 113 articles with practical and laboratory research, considering the fact that both research areas are inseparably connected with enterprise resource planning (ERP) systems and enterprise information systems (EIS). In the article by S.O. Ongbali et al. [10], various variables of manufacturing bottlenecks that limit production capacity are analyzed. The study identifies key factors such as equipment failure and material unavailability critical to prioritizing efforts to improve manufacturing processes. The study results indicate that eliminating these bottlenecks is essential to optimize warehouse operations in the context of Industry 4.0. S.O. Ongbali et al. propose using simulations to solve the warehouse bottleneck problem. Such a proposal has a place, but identifying new bottlenecks will be challenging without using a digital twin.
For example, Nicole Franco-Silvera and her team [11] propose the 5S concept for optimal warehouse management. Their concept makes sense but still puts complete information about the material in the “under-processing” stage. Material of this type is most often removed from the process of sending to the supplier because it is a component of a product that, for some reason, did not meet the requirements set in the order and was released in reserve quantities, and so remained on the records of the manufacturing company. Material flow control (MFC) is essential to production planning and management [4]. In the practical conditions of a manufacturing enterprise, such materials or components remain in the so-called “gray zone” of inventory systems.
The emergence of “gray zones” is directly related to the bottlenecks of ERP and other accounting systems. Summarizing some of the studies [12,13,14,15,16], we can highlight the main areas of ERP system bottlenecks in production:
-
Common problems that arise in inventory management when using ERP systems;
-
Inaccurate data tracking, poor integration with other software, and inefficient processes;
-
Bottlenecks in material accounting at certain workstations, which can lead to discrepancies in the stock of the entire warehouse;
-
Problems with updating the balance in inter-warehouses, which affects delays in order fulfilment and an increase in operating costs, which ultimately affects the overall efficiency of the business;
-
Problems that arise in inventory management associated with manual processes;
-
Lack of real-time visibility and, as a result, poor production planning.
In inventory management and ERP systems, materials are classified into six main statuses that determine their availability and usability for various operational activities. When inventory is labeled as available, it is ready for immediate use and can be allocated to production tasks or sales orders. In contrast, items marked as unavailable cannot be used in any transactions, often due to being damaged, defective, or otherwise unsuitable. Inventory given a blocked status is physically present but restricted from use, generally due to the need for inspection or further action. Meanwhile, materials placed on hold are temporarily inaccessible, often awaiting quality checks or administrative procedures. Additionally, items categorized as in transit are those currently being transported between locations and are not accessible for use until they arrive at their intended destination. Lastly, items with a reserved status have been allocated to specific orders but have not yet been picked up or shipped, thus remaining set aside until needed [11].
The “gray zone” is an inter-warehouse of a department of the enterprise, where the material has been stacked and is in unavailable, blocked, or on hold status. The problem with such workplaces is that the material on record in this part of the enterprise is often suitable for use and can be used to launch a new batch of products [17]. Reusing such material would align with the principles of the circular economy [18], which entails reducing waste disposal costs, warranty and post-warranty repair costs, and product costs, and a reduction in warehouse maintenance costs [19]. Removing quality material from the “gray zone” will make it possible to reduce production downtime and reduce the amount of production waste. Tools for achieving the concept of reuse can provide a system built according to the principle of Warehouse 4.0. The idea of Warehouse 4.0 is based on eliminating errors, real-time updates, scalability and flexibility, automation, convenience, and security [20]. Medium-sized and big enterprises in Slovakia already have enterprise resource planning programs and inventory mobile scanners for warehouse management. However, this system has bottlenecks that create barriers to effective real-time planning processes. Managers of the work shift need to have relevant information about the amount of material in the disassembly workplaces to provide enough material for the product and thus reduce downtime [21].
The proposed study was conducted in the SmartTechLab laboratory [22], where the main idea was to improve the inventory management processes at the enterprise based on the trends of lean manufacturing [23], Warehouse 4.0, DFMA (Design for Manufacturing, Assembly, and Disassembly) [24], and the circular economy using a client–server software platform based on REST API architecture with an integrated convolutional neural network [25]. The following parts of the proposed study are presented in the following order: Section 1 discusses the challenges in managing material balances in flexible production environments and introduces the concept of Warehouse 4.0 for improving material flow control and reducing costs. Section 2 describes DFMA principles and a smart integrated system combining ERP and machine vision technologies with convolutional neural networks to optimize inventory management and decision-making. Section 3 presents the performance and accuracy evaluation of the YOLOv8 convolutional neural network model in the detection task of production components, demonstrating high precision and recall in various scenarios. Section 4 summarizes the development and potential benefits of the smart material resource planning system, highlighting its impact on reducing waste, improving decision-making, and supporting circular economy principles.

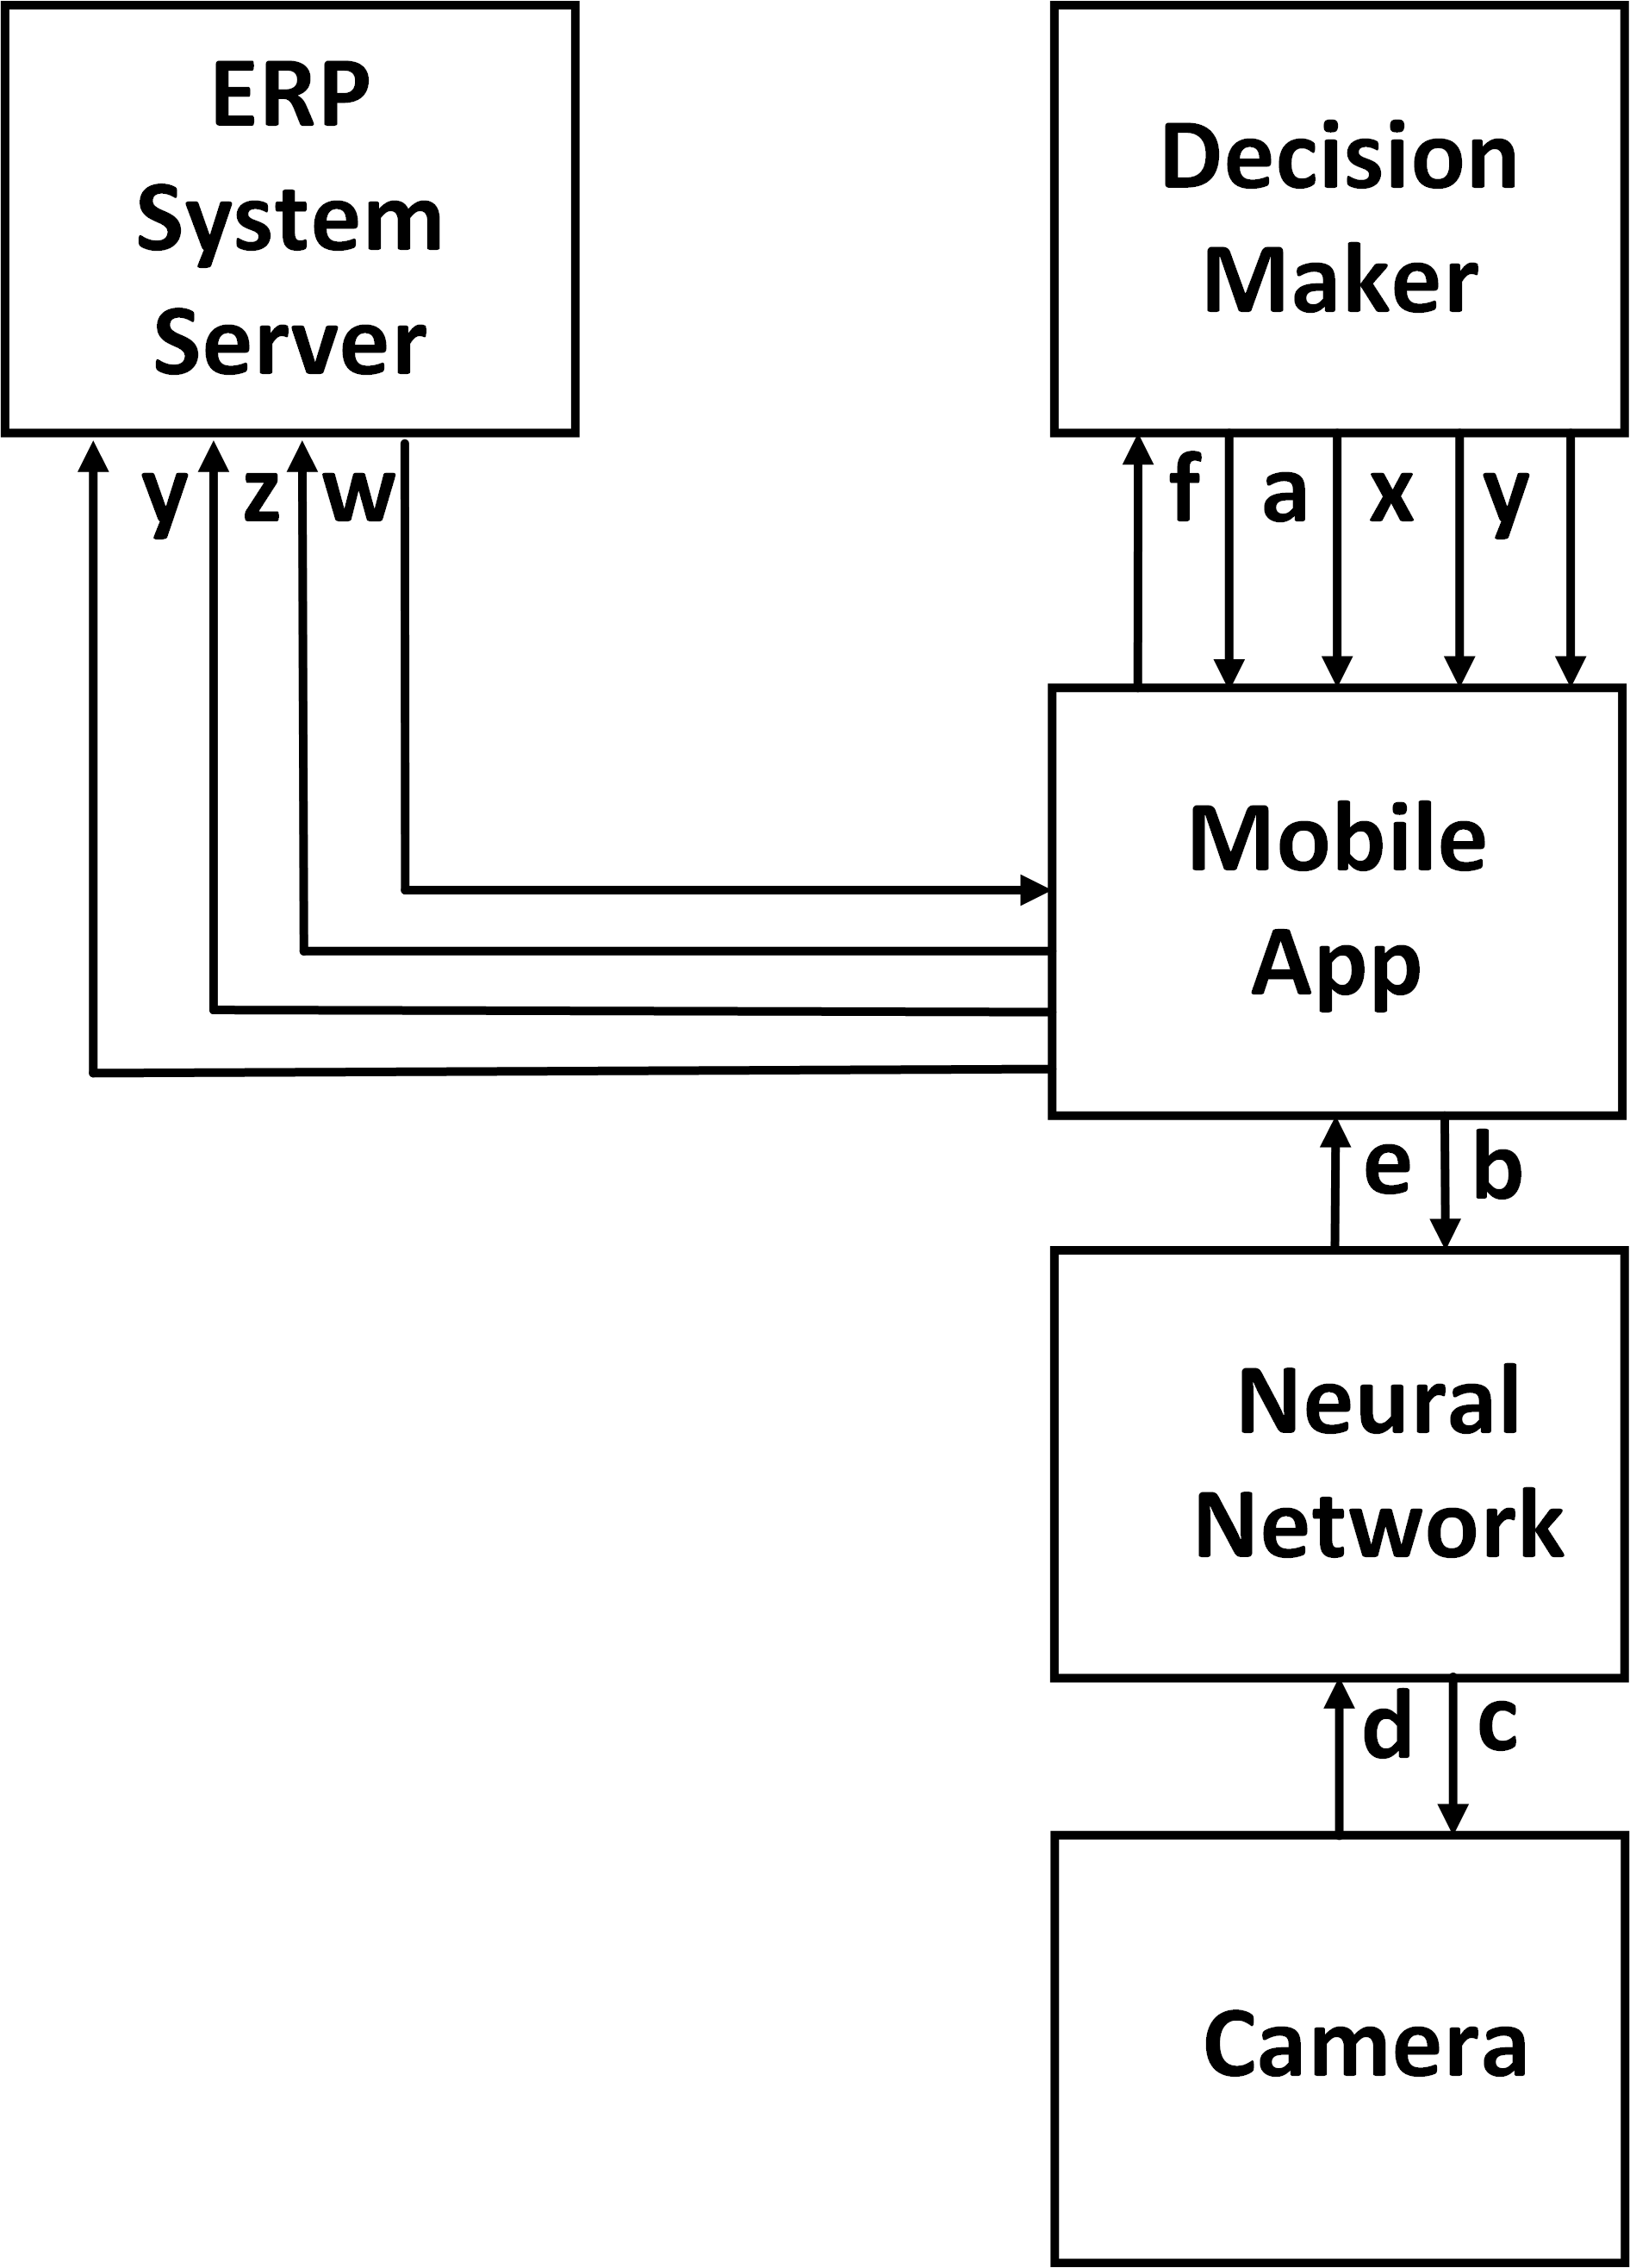
2. Materials and Methods

Since this research is about improving the decision-making process [26], the DFMA principle was chosen as the basic principle. DFMA (Design for Manufacturing, Assembly, and Disassembly) is a research methodology focused on optimizing design and processes in manufacturing and construction to reduce costs, improve efficiency, and increase sustainability. The approach integrates Design for Facilitated Manufacturing and Assembly (DFM and DFA) [27] with the ability to easily disassemble and reuse components to help minimize material waste and product lifecycle costs. The DFMA methodology identifies and eliminates unnecessary complexity during the design phase, ultimately improving productivity, reducing risks, and making processes more environmentally responsible. By integrating enterprise material planning automation solutions, DFMA can significantly improve inventory management and decision-making in manufacturing operations.
As part of this study, an integrated quality and logistics management system was developed and implemented. Our system block diagram is presented in Figure 1. This system integrates an ERP system, a decision-making module, a mobile application, a neural network, and a camera system to provide an integrated real-time management of production processes and inventories. The system’s backbone is the ERP server, responsible for collecting and managing data on the materials and spare parts required for production. The essential functions of the ERP system are requesting information on the availability and composition of spare parts for Turbine 1, estimating material requirements, and controlling stock levels, allowing timely replenishment decision-making. The Decision Module, which performs coordination and analysis functions, uses data from the ERP system and other sources to determine further actions, such as allocating or moving parts based on availability. The mobile application serves as the interface for users and provides access to information and critical operations, such as confirming the availability of parts at the correct location. An important aspect is that all the management processes should go through the mobile app, which provides centralized control and flexibility in management. A convolutional neural network integrated into the system uses machine learning algorithms to analyze data and automate decision-making, minimizing the reaction time to changes. The machine vision system module, which supports the convolutional neural networks, determines the availability and quantity of parts and materials at the workplace at the specified frequency. This module makes it possible to speed up decision-making through better awareness of the actual amount of parts and materials. The system’s flexible architecture, including various selection nodes and event scenarios, allows the control to be adapted to current operational conditions, ensuring the high accuracy and responsiveness of quality management.
The ERP system server is an enterprise management program server that contains information about all activities and the enterprise warehouse. The system operation begins with a camera installed at the operator’s workplace. The camera sends a video stream with data to the neural network, which sends processed data to the mobile application, but only at the request of the Design Maker through the mobile application, where the information from the neural network is already converted into something suitable for the manager. The manager, in turn, uses the received data for the work order form for the warehouse or production operators to determine if this material is sufficient and/or is in demand in the production process.
Figure 1 shows the communication diagram of the system components at the manager’s request:
-
Data flow (a) is the user’s request to receive data from his profile;
-
Data stream (b) is a request stream for the neural network to send a signal to the video camera for further processing;
-
Data stream (c)—request to neural network to receive a video stream;
-
(d) is a reverse unprocessed video stream;
-
(e) is a transformed video stream with data on detected objects. In the mobile application, (f) is the number of detected parts with data on them;
-
(x) is a request to check the completeness of the turbine;
-
(y) is a request to re-order missing components for a work order for production. This request is sent directly to the ERP system and the logistics department;
-
(z) is the formulation of the production work order; therefore, this signal is sent through the application directly to the ERP system.

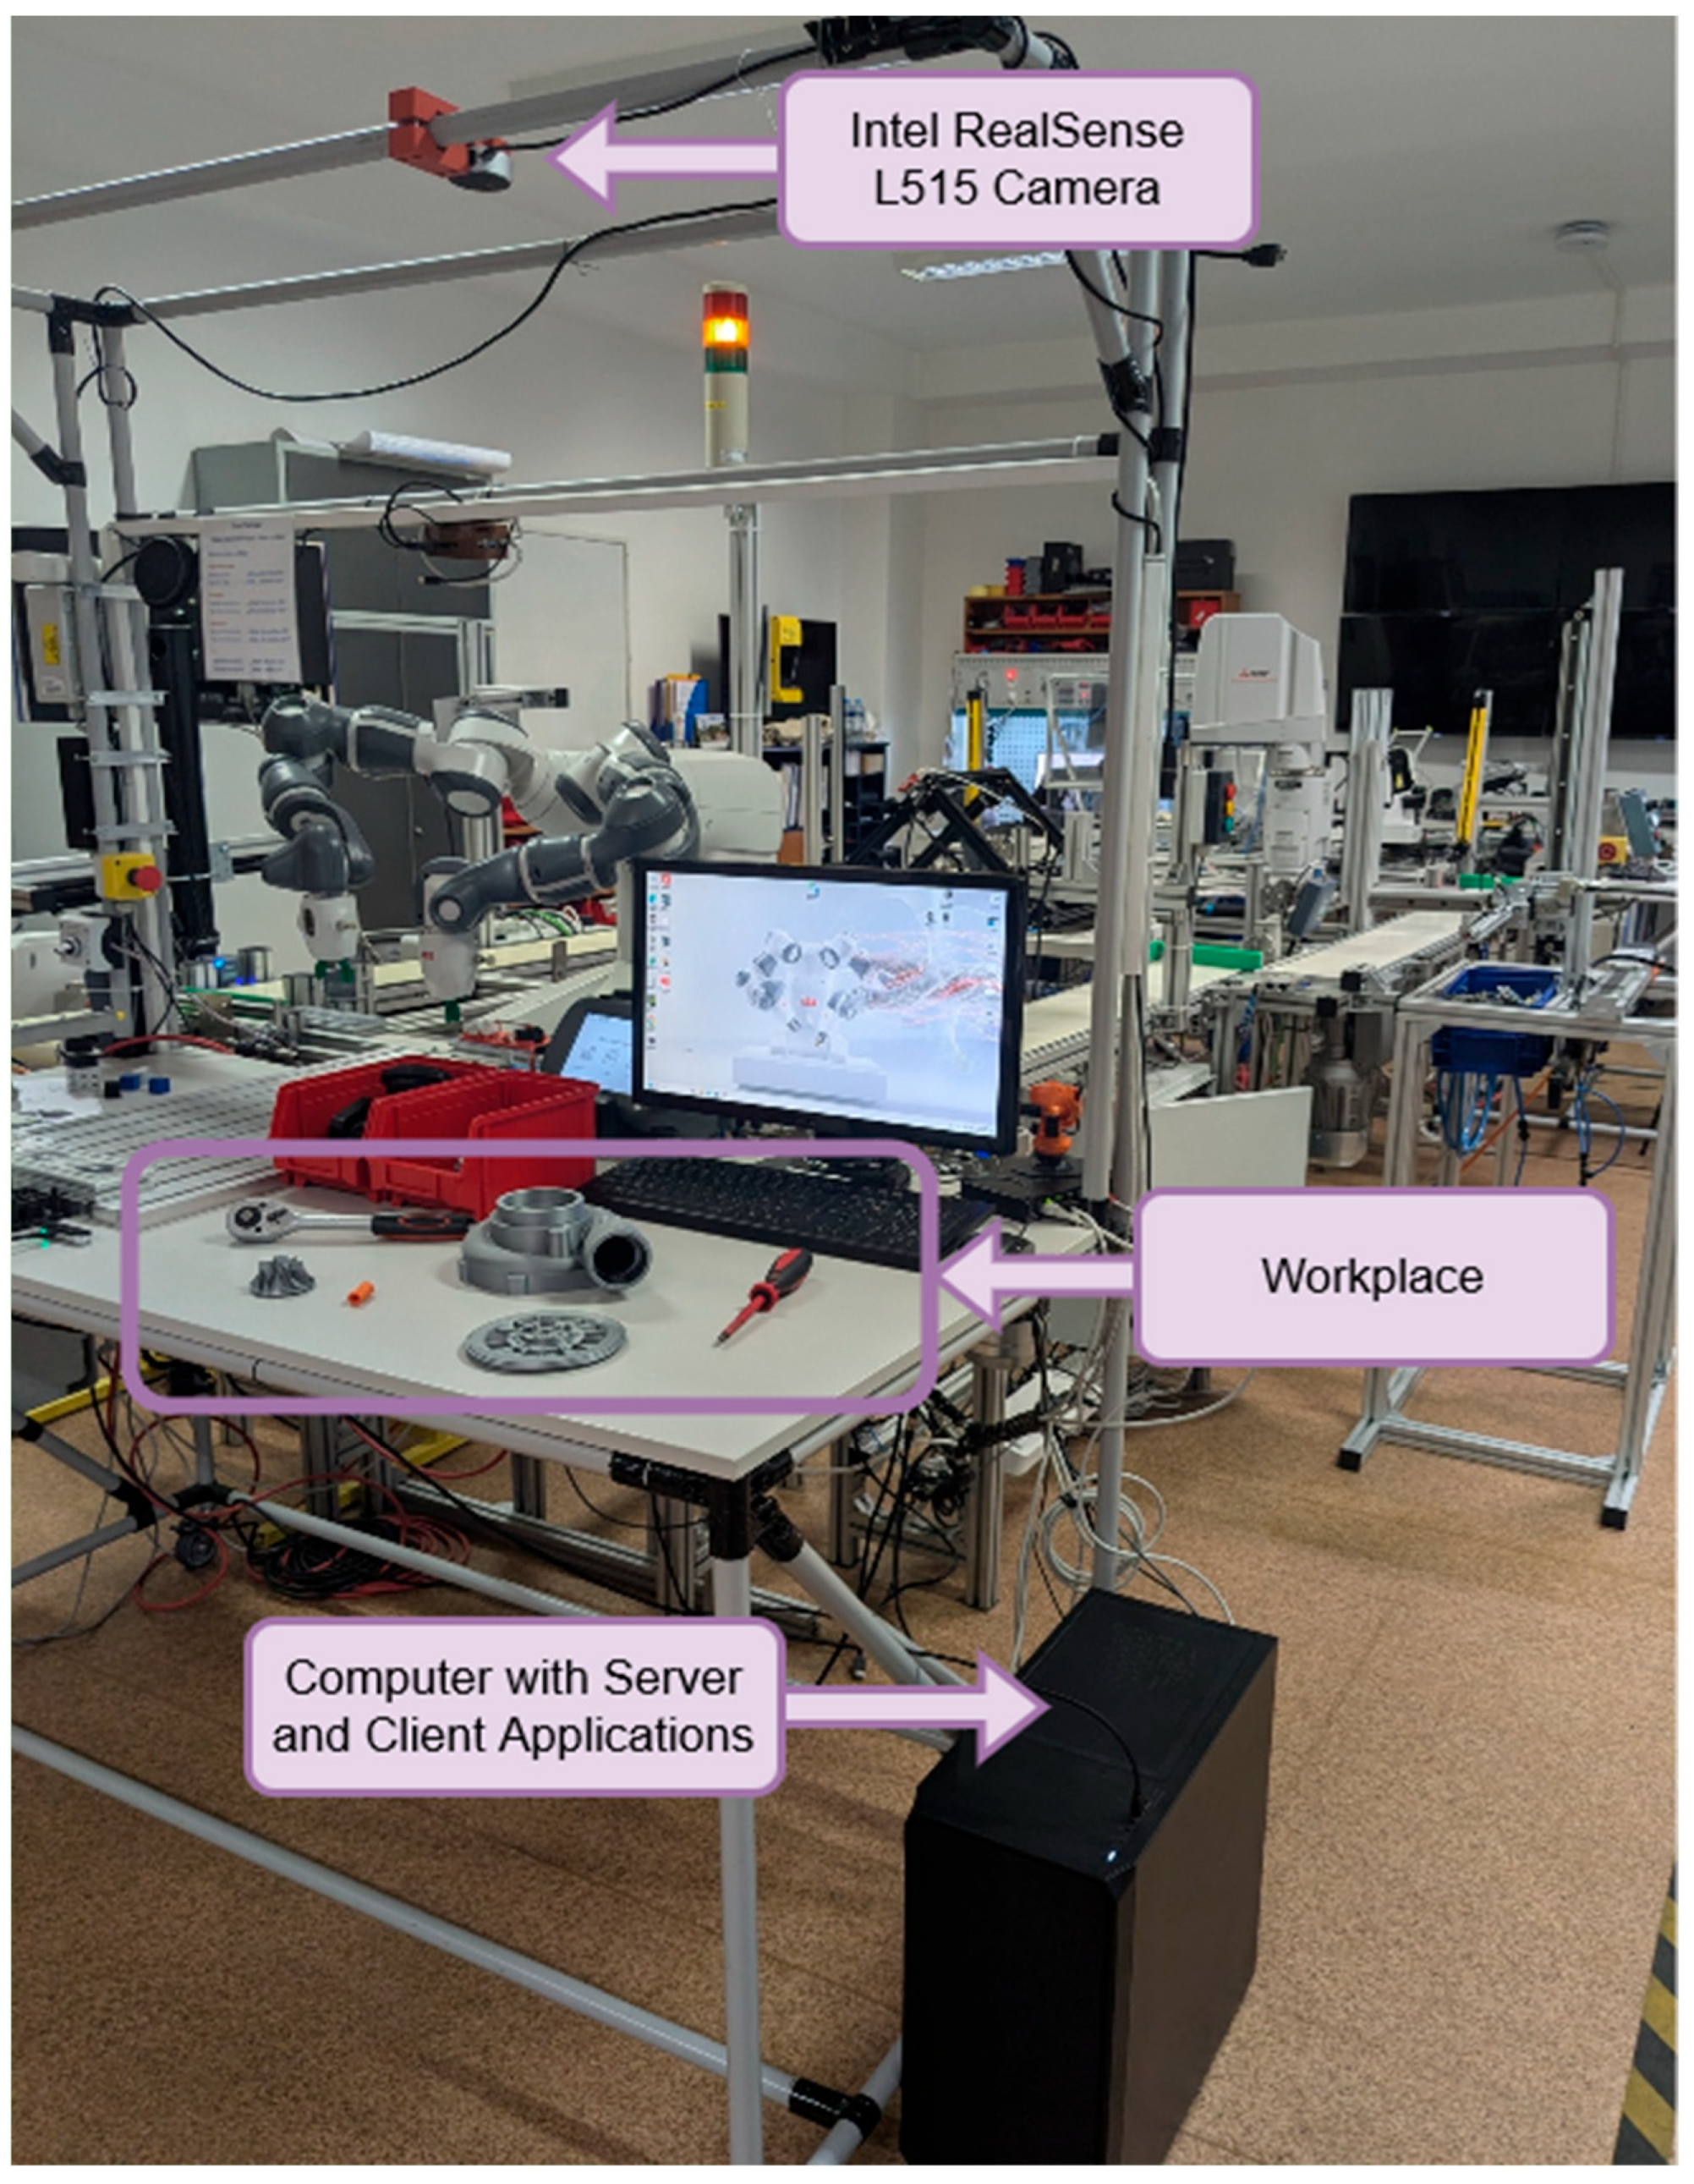
2.1. Workplace Configuration

This study utilized a workstation configuration, where an employee performs the disassembly of defective assemblies using a camera system to capture reusable parts, which is illustrated in Figure 2.
Intel RealSense L515, capable of RGB images in 1920 × 1080 pixels, was chosen as the camera. The camera is connected to a computer running a client that is authorized as a worker and has permissions to send images to the server.
Technically, the client part for the workstation and the server part can be installed on different devices, but in the case under consideration, the client part of the workstation and the server part are installed on the same computer. The computer contains a discrete video card to accelerate the computation of the neural network. Technical characteristics of the computer on which the server solution was tested: CPU Intel Core i5-13600KF, RAM 64 GB, GPU NVIDIA GeForce RTX 3080 Ti 12 GB.

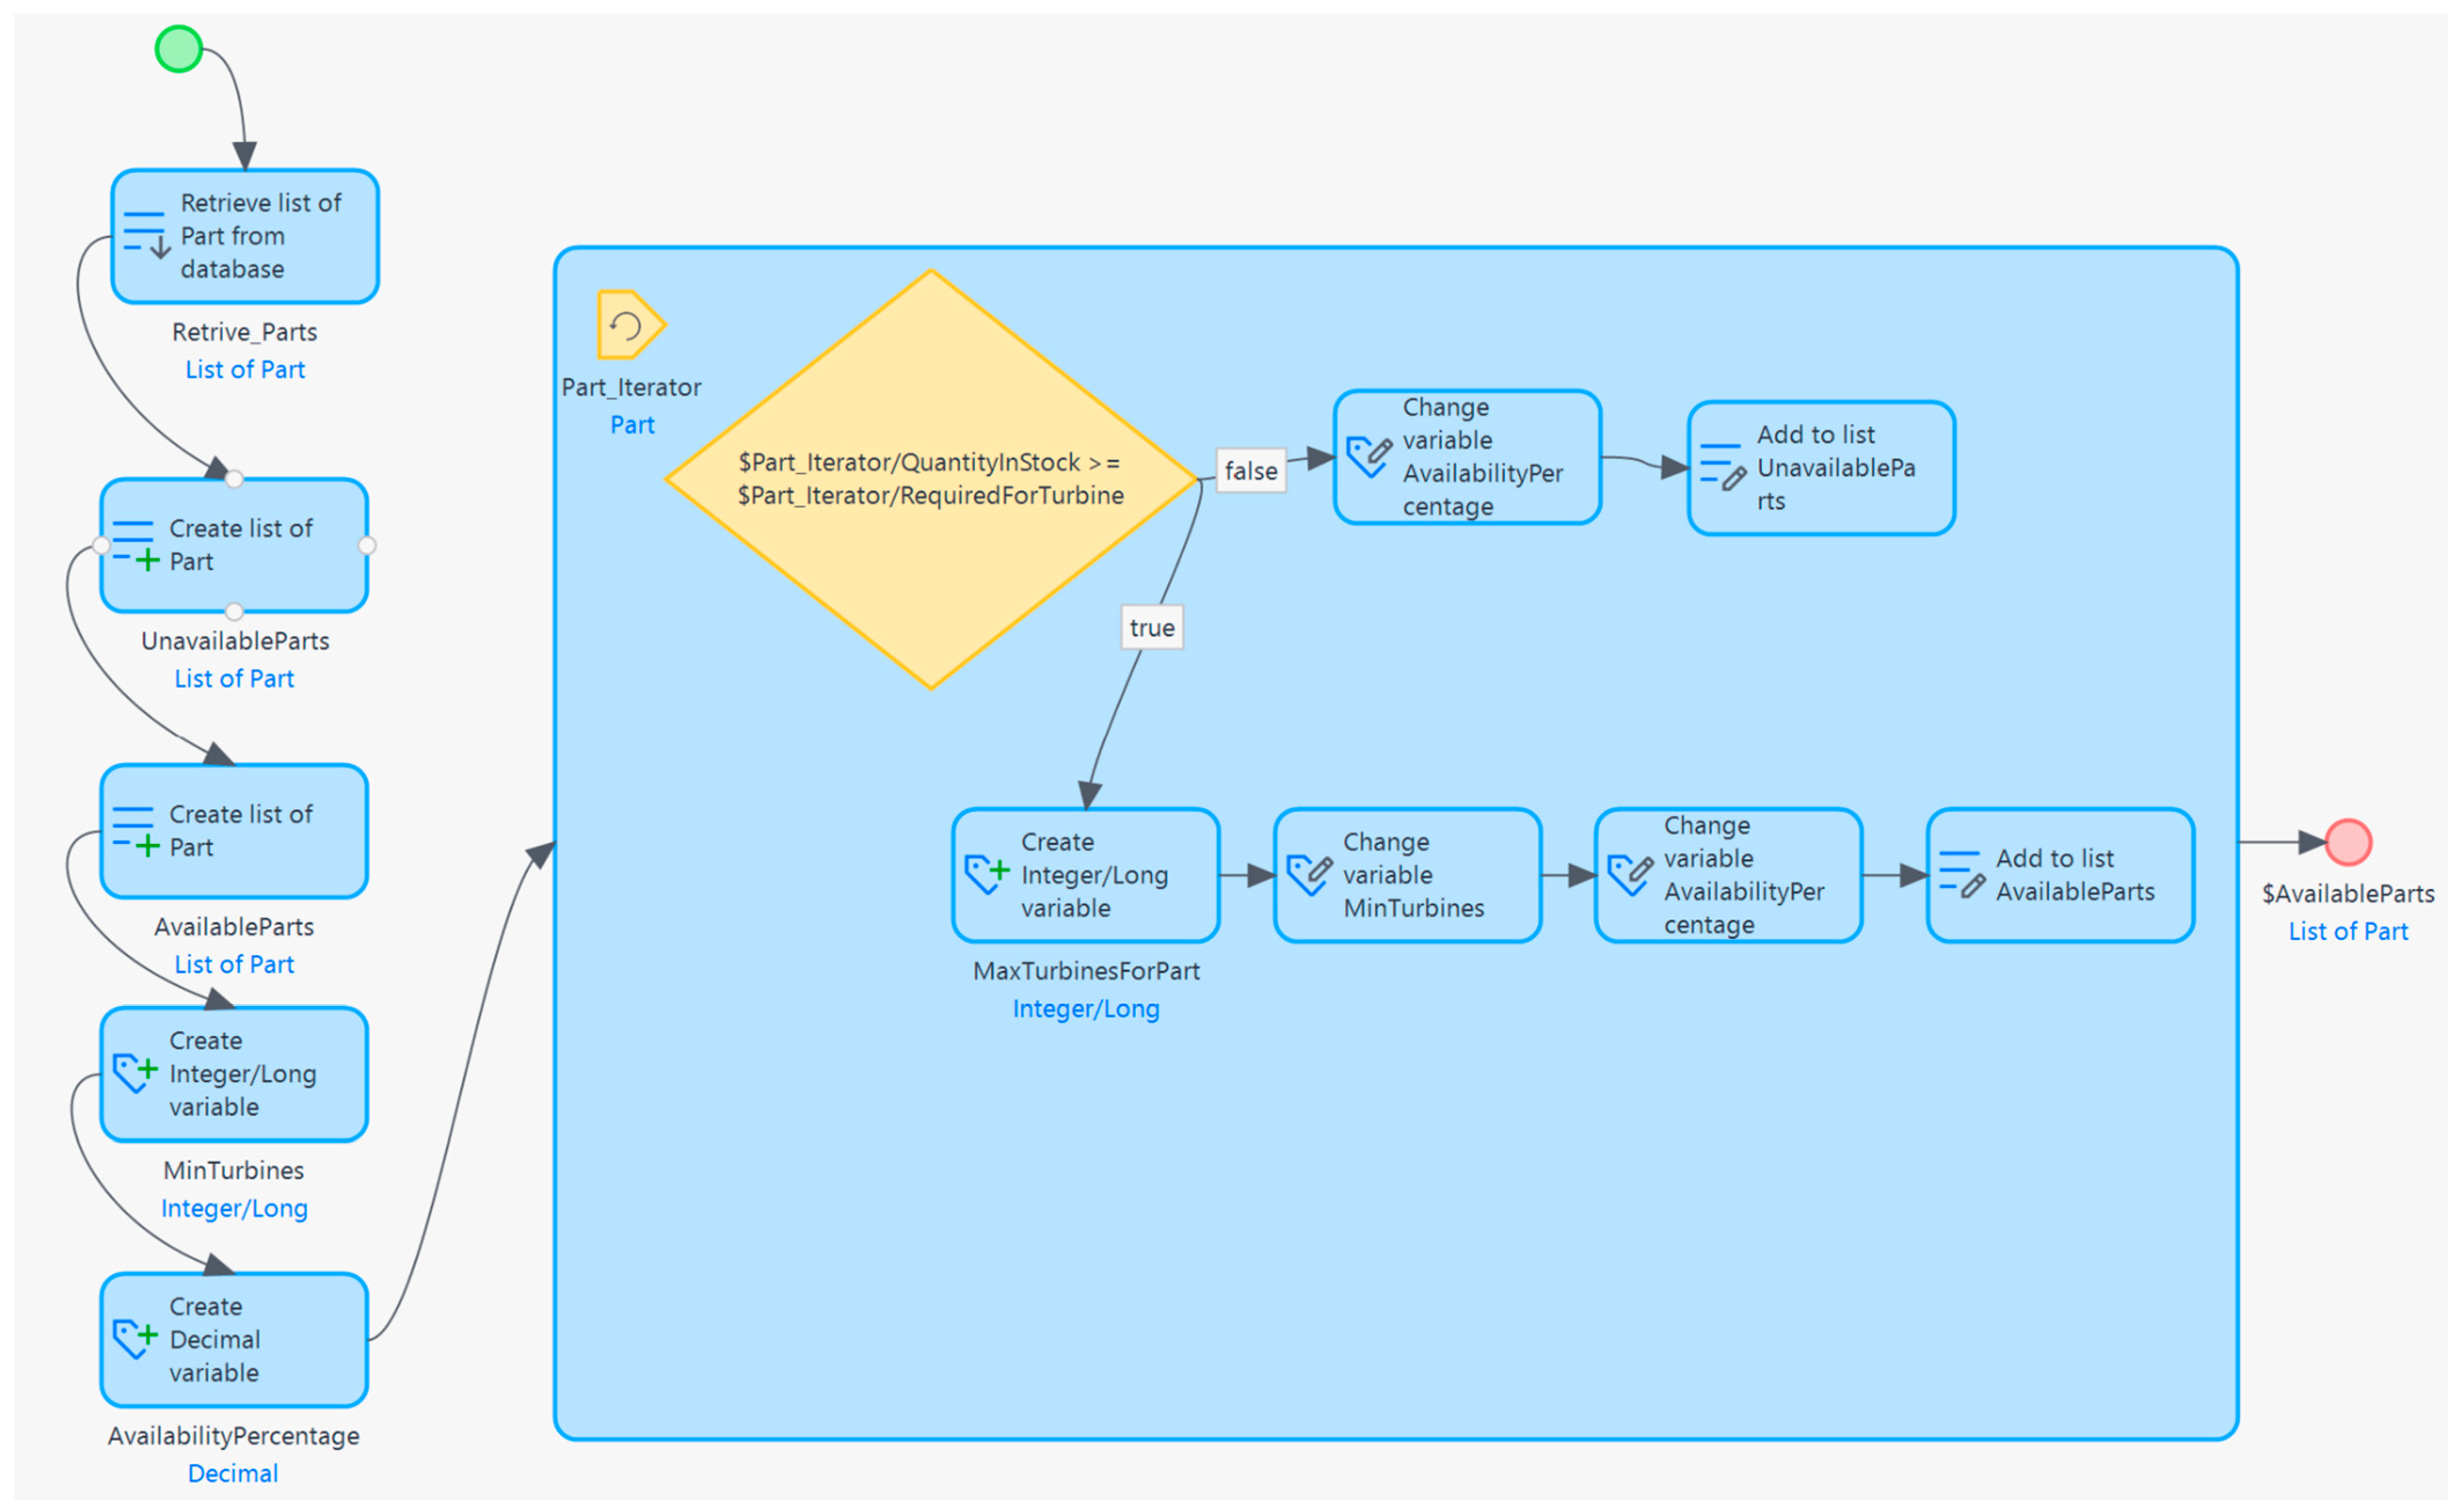
2.2. Server Configuration

The server application consists of the HTTP server, MySQL client, and machine vision module. The main element of the HTTP server is the listener, which creates HTTP sessions when clients connect.
When establishing a connection with a client, the server first reads the HTTP request header, which contains the user credentials (login and password) encoded in Base64 format. Then, the server decodes these data, extracts the login and password, checks for the presence of forbidden characters, and passes them to the MySQL server client for processing and executing an SQL query to the database to verify the authenticity of the user account. The server decides whether to allow or reject the request depending on the database response. The proposed authentication approach is compatible with modern web browsers, so it is possible to prepare a web version of the client for other devices in the future.
The considered variant uses an insecure primary authentication mechanism, but for industrial applications, it is recommended to use more secure authentication mechanisms such as OAuth 2.0.
After successful authentication, the following requests are available depending on the user rights:
-
POST request to the storekeeper to add parts to the warehouse (/add);
-
POST request for a storekeeper to remove parts from the warehouse (/remove);
-
POST request to the assembler’s workplace to send a photo of the current state of disassembly (/workplace);
-
GET manager request for current warehouse status (/warehouse_status);
-
GET manager request for the current state of disassembly (/workplace _status).
If the POST request is successful, the client receives an error code 200 OK; if errors occur during the request execution that are not related to authentication, the client receives an error 400 Bad Request (for example, removing more parts from the warehouse than there are in stock, or the presence of prohibited characters in the request).
Since the requests require access to a database, a MySQL client is integrated into the server application. The HTTP server is implemented using the C++ library Boost Beast, and the MySQL client uses the Boost MySQL library. For simplicity, the current version of the application uses an unsecured HTTP connection. However, in the future, for industrial applications, to improve security, we can use an encrypted HTTPS connection. The source code will require minor changes as the Boost Beast library [28] and MySQL [29] have built-in support for SSL-encrypted connections.
The server application uses a machine vision module written using the OpenCV library [30] to process the builder workstation requests. The OpenCV library allows image processing using convolutional neural networks for object detection tasks.

2.3. Client Part Configuration

The client part of the application is developed in the Mendix platform [26] and is a web interface through which users can interact with the system. The main components of the client application are a visual interface for working with warehouse data and those for managing assembly operations and monitoring the current state of operations (Figure 3).
When logging into the system, users go through an authentication process based on verified credentials. Authentication is accomplished through a secure mechanism integrated into Mendix, allowing the system to identify users and grant them access to different functions based on their roles.
After successful authentication, users have access to the following functions depending on their access rights: adding parts to the warehouse and removing them from the warehouse. Users responsible for inventory can use the form to enter data about new parts and their quantities. This operation is performed using the AddPart microflow, which sends the data to the server to update the database. A form is also provided to remove parts from the warehouse; the RemovePart microflow, illustrated in Figure 4, verifies that the parts are in stock and their quantities are correct before performing the operation. In addition, assemblers can send photos of the current disassembly status at their workstations using the UploadWorkplaceImage microflow, which leverages file-processing and server integration capabilities in Mendix. Managers can view the current warehouse status through an interface that is implemented using Data Grid or List View widgets to display data from the database. They can also retrieve the current status of the assembly process on the job site using Data View widgets that display updated data on a page.
For all requests, the client side uses a server side developed API server that supports REST API. The client side sends HTTP requests to the server and receives appropriate responses (e.g., 200 OK for successful requests or 400 Bad Requests when non-authentication errors occur).
The Mendix web interface allows extending and scaling the application, adding new features, and managing user access rights. The client side uses standard Mendix security elements, such as OAuth 2.0, in the current implementation for data protection and access control.

2.4. YOLLOv8 Convolutional Neural Network Architecture

Object detection models such as YOLO (You Only Look Once) have gained widespread popularity due to their exceptional image-processing speed, making them ideal for applications with critical real-time performance. Unlike two-stage detectors such as Faster R-CNN, which split the process into region suggestion generation and object classification, YOLO performs both tasks in a single pass through the network. This single-stage approach allows YOLO to process images much faster, often in real time, which is essential for systems requiring immediate object recognition, such as autonomous vehicles or surveillance cameras. Redmon and Farhadi [31] demonstrated in their work on YOLOv3 that this model can balance speed and accuracy, making it a powerful tool for high-speed applications.
While two-stage detectors such as the Faster R-CNN provide higher accuracy, especially in complex scenes with small or closed objects, they inherently suffer from slower processing times due to the need for region proposal networks (RPNs). Ren et al. [32] emphasized the significant accuracy improvements that Faster R-CNN provides, especially for more detailed tasks such as small object detection. However, this comes at the cost of speed. For example, Faster R-CNN is significantly slower than YOLO despite achieving an impressive accuracy, with a mean average precision (mAP) of 76.4% on the VOC2007 dataset [32]. In contrast, YOLOv4, as shown by Bochkovskiy et al. [33], achieves a mAP of 43.5% at 65 FPS, illustrating its optimal balance between speed and performance, which is crucial in time-sensitive environments.
Our application prioritizes fast image processing, so YOLO becomes the preferred solution. Although Faster R-CNN and similar two-stage detectors, such as Mask R-CNN [34], provide more detailed detection, their slower performance is unsuitable for our real-time needs. YOLOv3 and YOLOv4 have consistently demonstrated that they can handle object detection tasks with sufficient accuracy and at much higher speeds, making them more suitable for applications where latency cannot be compromised [31,33].
Since defining the parts to optimize the process is necessary, Ultralytics’ YOLOv8 [35] object detection models were suggested. Figure 5 illustrates the structure of this neural network, which consists of a Focus Layer, Backbone, SPP Block, Neck (PANet), and Detection Head [36,37,38]. The values of these parameters are given in Table 1.
The Focus Layer transforms the input image by splitting it into channels, reducing its size and highlighting essential features. The Backbone is responsible for extracting crucial features from the image by applying convolutional layers, creating a multi-level feature representation. The SPP Block (Spatial Pyramid Pooling) aggregates features at different scales, improving the network’s ability to detect objects of various sizes. The Neck (PANet) combines features from different levels of abstraction, enhancing the detection of both small and large objects. Finally, the Detection Head performs the final detection and classification of objects, outputting the coordinates of bounding boxes and the corresponding class labels.
The Focus Layer is used to pre-process the input image to reduce its size and increase the number of channels, and it functions according to the following algorithm.
The first step of the algorithm is to load the original image, whose dimensions can be described with Equation (1).
S = W × H
In this equation, S is square of picture, W is the width and H is the height of the image. In our study, we use camera images with a resolution of 1920 × 1080 pixels, which corresponds to a 16:9 aspect ratio. However, for the correct functioning of the YOLOv8 model, the input images should have a square shape of 640 × 640 pixels with three color RGB channels. This necessity is determined by the architectural peculiarities of the YOLOv8 model, which requires inputting a strictly defined data size.
Further, the second step involves resizing the image while preserving its proportions. Such a step is critical because non-compliance with the proportions can lead to the distortion of objects in the image and, as a result, will negatively affect the model’s accuracy in the detection task. Therefore, the resizing process is performed as follows: if the image width W is more significant than its height H, the width is reduced to 640 pixels, and the height is scaled proportionally by Equation (2).
H I = 640 × H W
In case the height of the image is greater than or equal to its width, similarly, the height is set to 640 pixels and the width is scaled proportionally, which can be expressed as Equation (3).
W I = 640 × W H
The third step is to augment the image to a square format with a resolution of 640 × 640 pixels. After resizing, the image may have a shape other than a square. To correct this, empty bars are added to the edges of the image—both top and bottom, as well as on the sides. If, for example, after resizing, the height of the image is less than 640 pixels, empty bars are added to the top and bottom of the image in equal proportions. The number of pixels added to the top and bottom is calculated by Equations (4) and (5).
top _ pad = 640 H I 2
bottom _ pad = 640 H I top _ pad
The remaining value of pixels is added to the bottom of the image. The same process is performed for the width complement if the image’s width is less than 640 pixels.
The fourth step involves normalizing the pixel values. YOLOv8 requires the input data to be normalized into the range [0, 1] for using this model. This is achieved by dividing each pixel value by 255, which converts the input data (from the [0, 255] range typical of images) into a standard range that is convenient for processing by the model. Normalized pixel values improve the performance of convolutional neural networks, helping to stabilize the learning process and accelerate convergence. Mathematically, normalization is expressed by Equation (6).
normalized _ pixel _ value = original _ pixel _ value 255
Finally, the final step is to check that the image has three channels corresponding to the RGB color model.
The Focus Layer performs the function of splitting the input image into four parts and combining them into one tensor. This reduces the spatial dimensions of the image by a factor of two in width and height, while increasing the number of channels (depth) by a factor of four. This tensor is then passed through a convolution layer (Conv2D), which allows a better extraction of the initial features from the image. This operation reduces the computational overhead in the following steps and allows for a more efficient capture of fine details to be used for further processing.
The Backbone, based on CSPDarknet53, is the main part of the neural network responsible for extracting features at different depth levels. It consists of a number of CSP (Cross Stage Partial) blocks, such as CSP1, CSP2, CSP3, CSP4, and CSP5. Each of these blocks uses convolution layers that reduce the spatial dimensions of the image and increase the number of channels to produce more abstract and higher-level features. CSP blocks divide the input tensor into two parts: one part is processed by standard convolutional operations, and the other part is passed directly to the next layer, after which they are combined. This helps to reduce the number of computations and improve the flow of gradients through the network, making training more stable and efficient. In addition, Batch Normalization (Batch Normalization) and the Leaky ReLU activation function are applied after each convolution operation, which adds nonlinearity to the model and helps to avoid the problem of vanishing gradients.
The SPP Block (Spatial Pyramid Pooling) is designed to improve the capture of contextual features at different scales. This block applies multiscale pooling (pooling) with fixed core sizes (e.g., 5 × 5, 9 × 9, 13 × 13) to the same input. This allows the model to better capture the features of objects of different sizes and improves its ability to handle objects that may vary in size in the image. The SPP Block retains the original spatial dimensions of the output, but significantly increases the perceptual domain, allowing the model to work with more context, which is critical for object detection tasks in different environments.
The Neck is the part of the neural network that is responsible for aggregating and combining features from different depth levels derived from the Backbone to provide a better ability to detect objects of different sizes. YOLOv8 utilizes a modified Path Aggregation Network (PANet) architecture that includes Feature Pyramid Network (FPN) blocks and additional processing paths (PANet Path Blocks). The FPN performs an upsampling (size increase) operation for features extracted from deep layers and combines them with features from shallower layers to provide a denser representation of features at different layers. PANet Path Blocks then perform a downsampling (size reduction) operation and combine features from different layers to further improve the model’s ability to localize and classify objects. This allows the network to capture multi-layer information and improves its accuracy in image processing.
The Detection Head is responsible for the final prediction of objects in the image, including their classes, the coordinates of the bounding boxes, and the degree of confidence the model has in these predictions. YOLOv8 uses a hybrid system that incorporates both anchor-free and anchor-based prediction heads. The anchor-free approach predicts the location of bounding boxes directly, without using predefined anchors, which simplifies the process and improves performance in detecting objects of different sizes and shapes. At the same time, the anchor-based approach uses predefined anchor points and dimensions to improve prediction accuracy when localizing objects. Combining these two approaches allows YOLOv8 to achieve a high level of accuracy and reliability in a wide range of object detection scenarios.

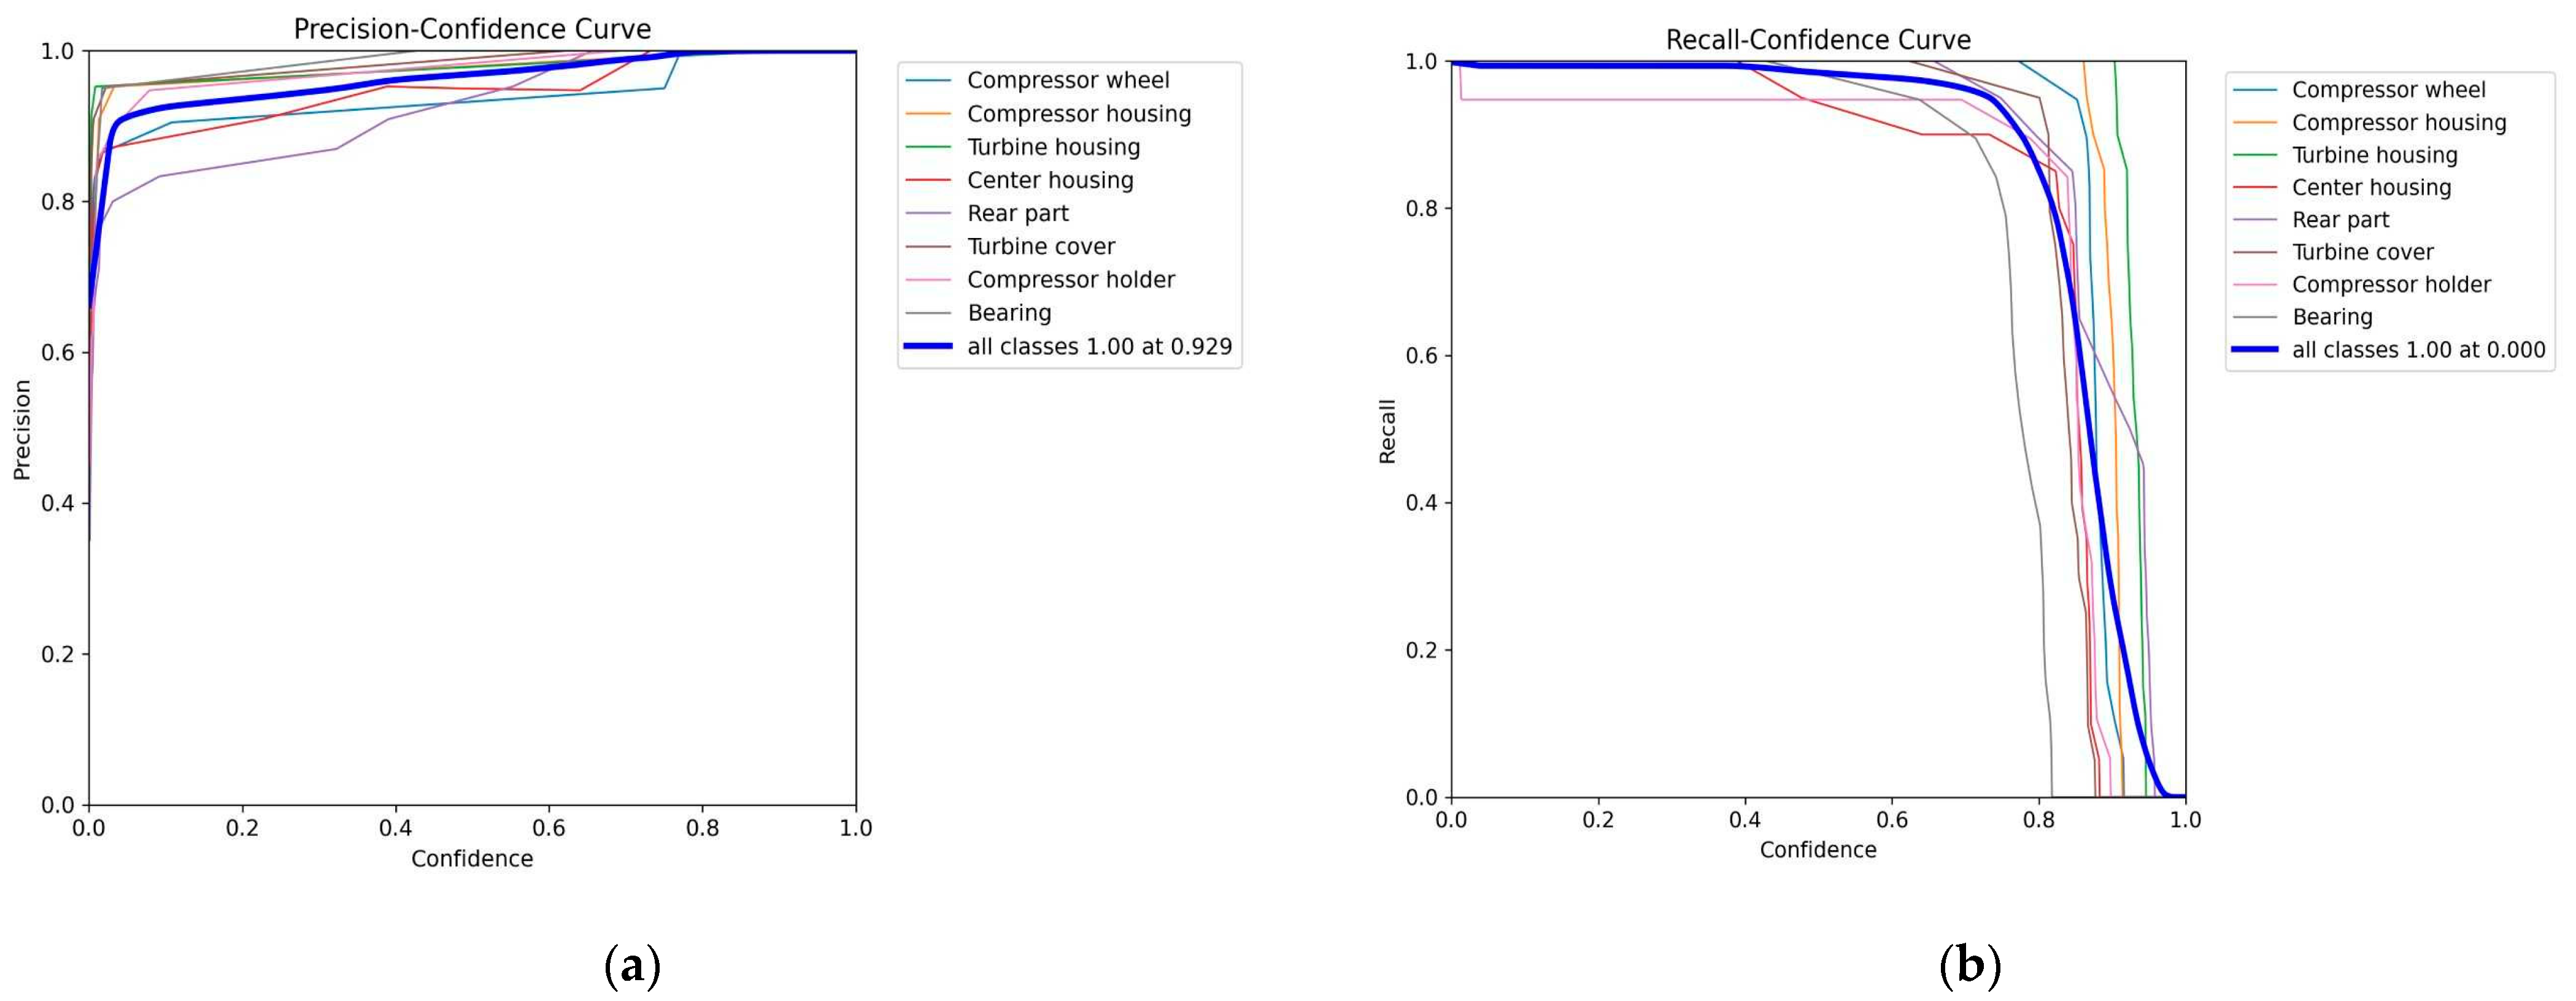
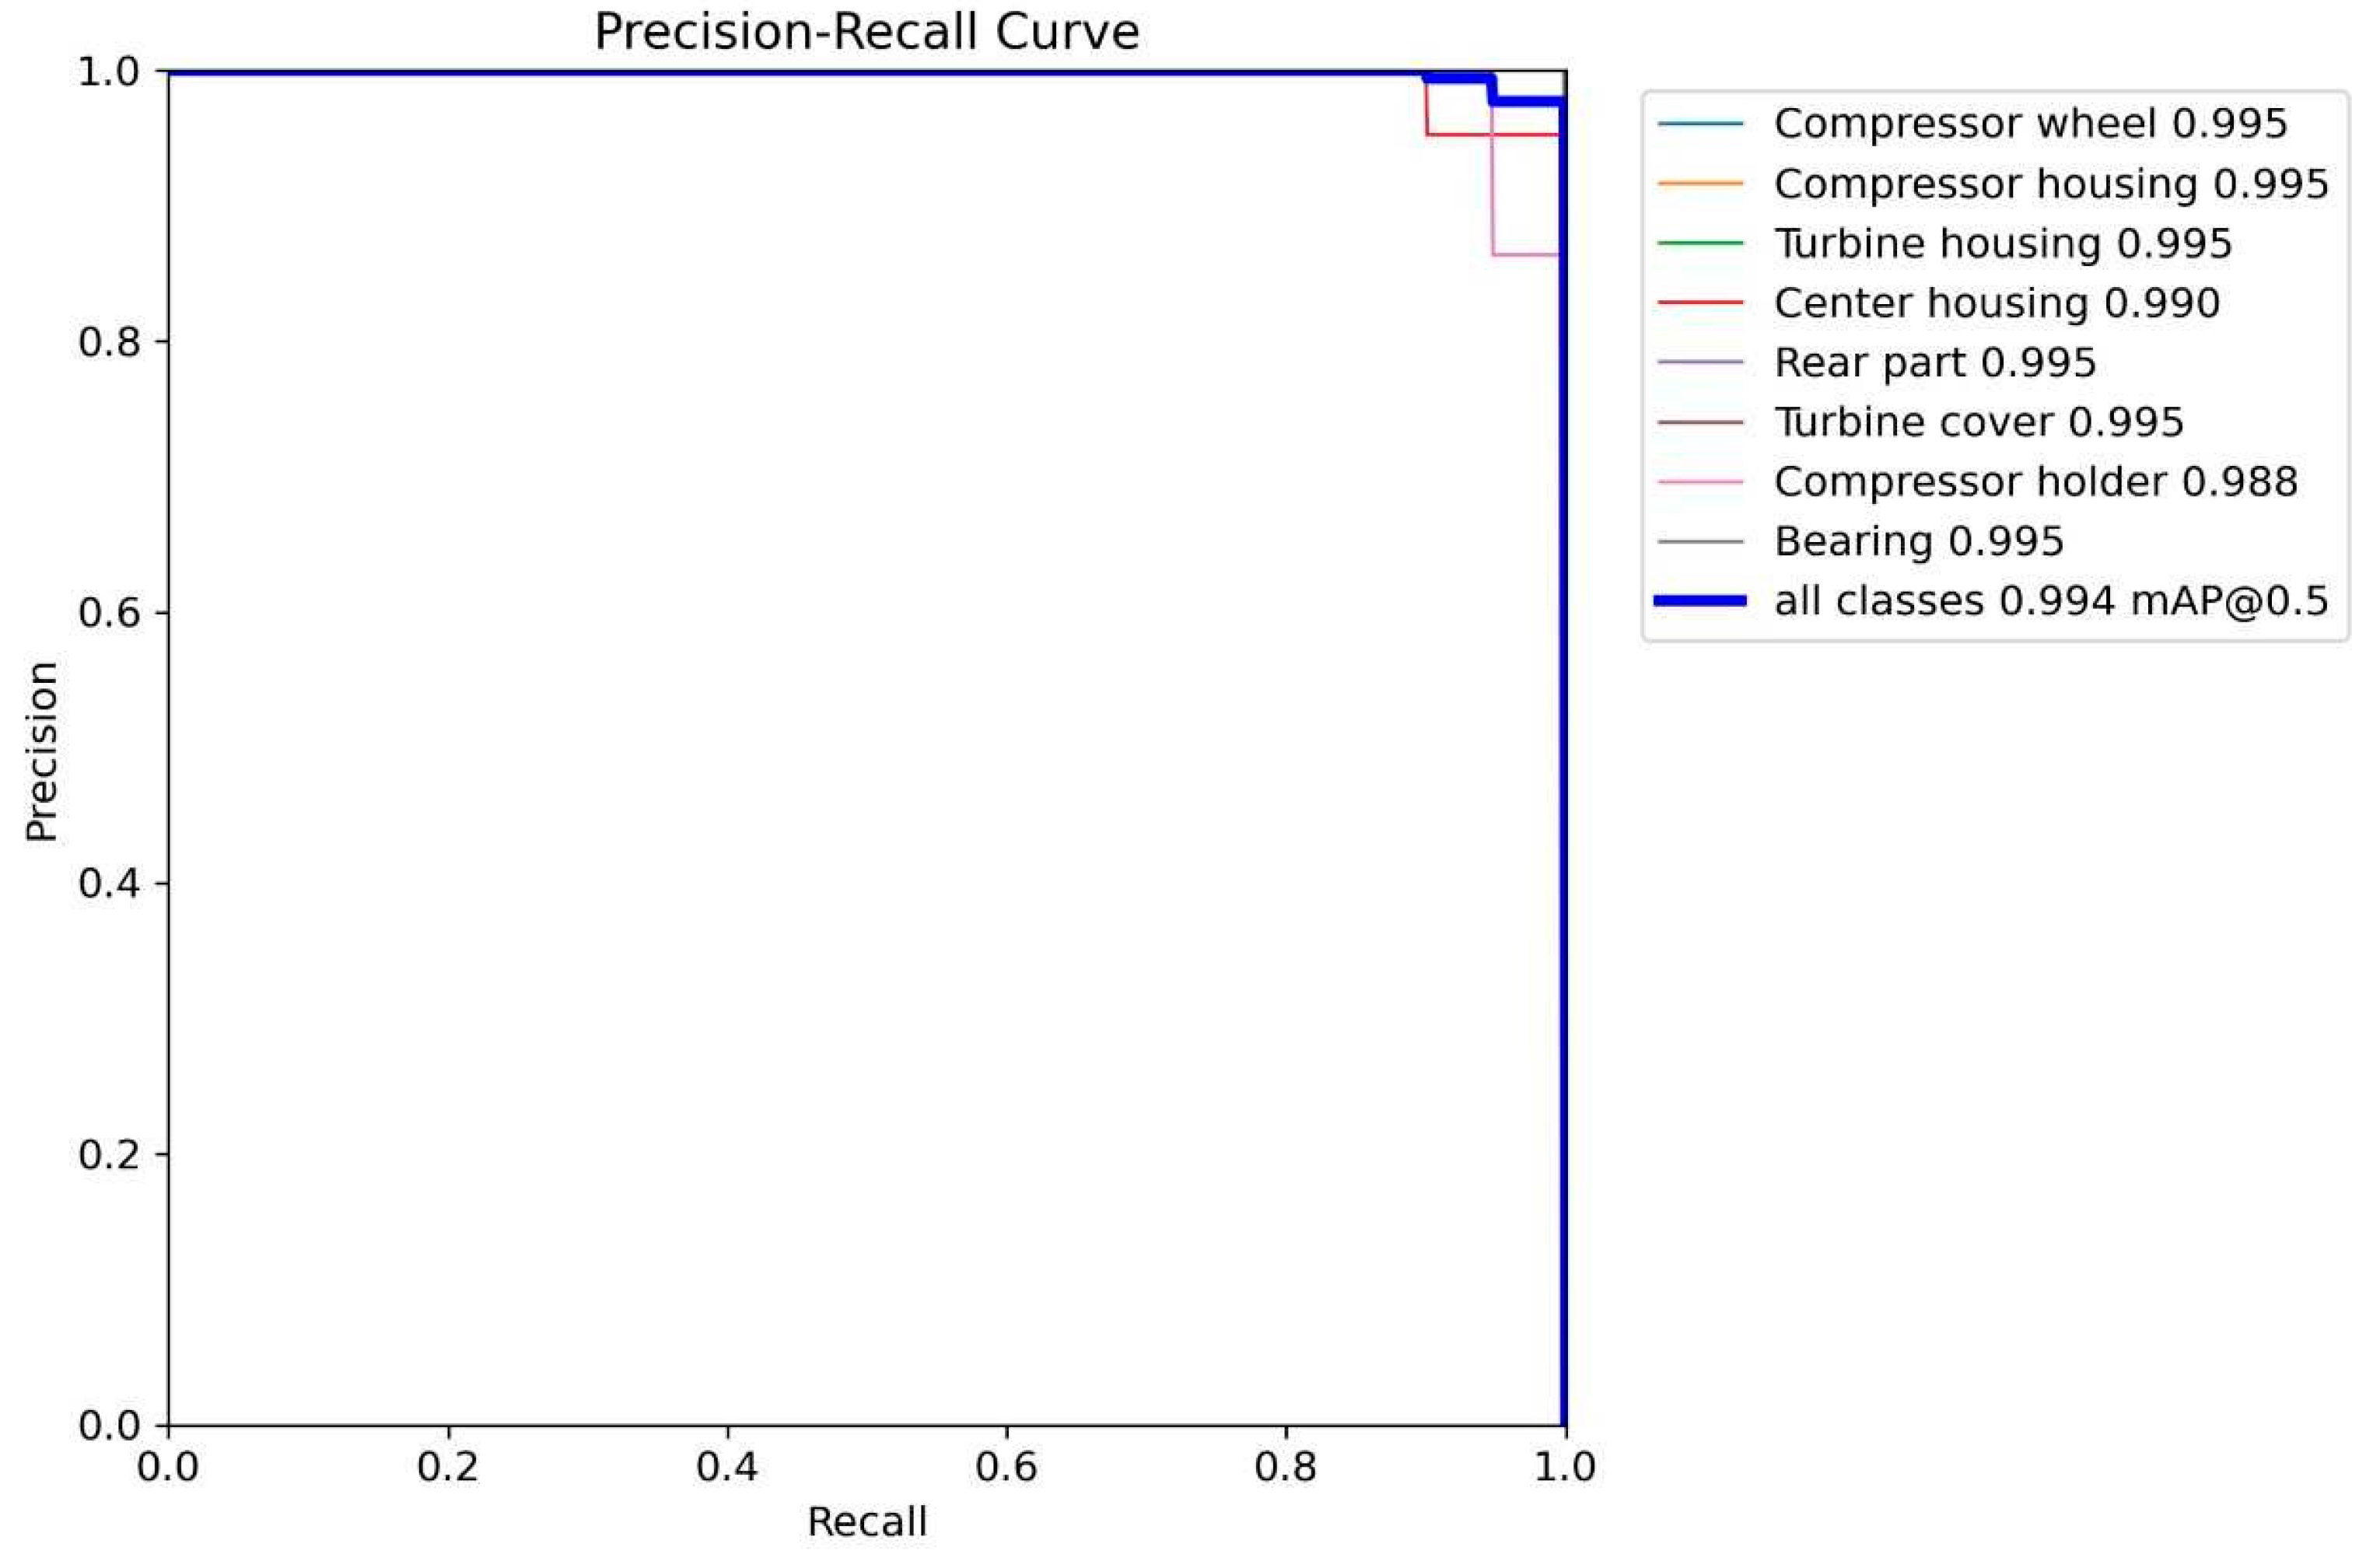
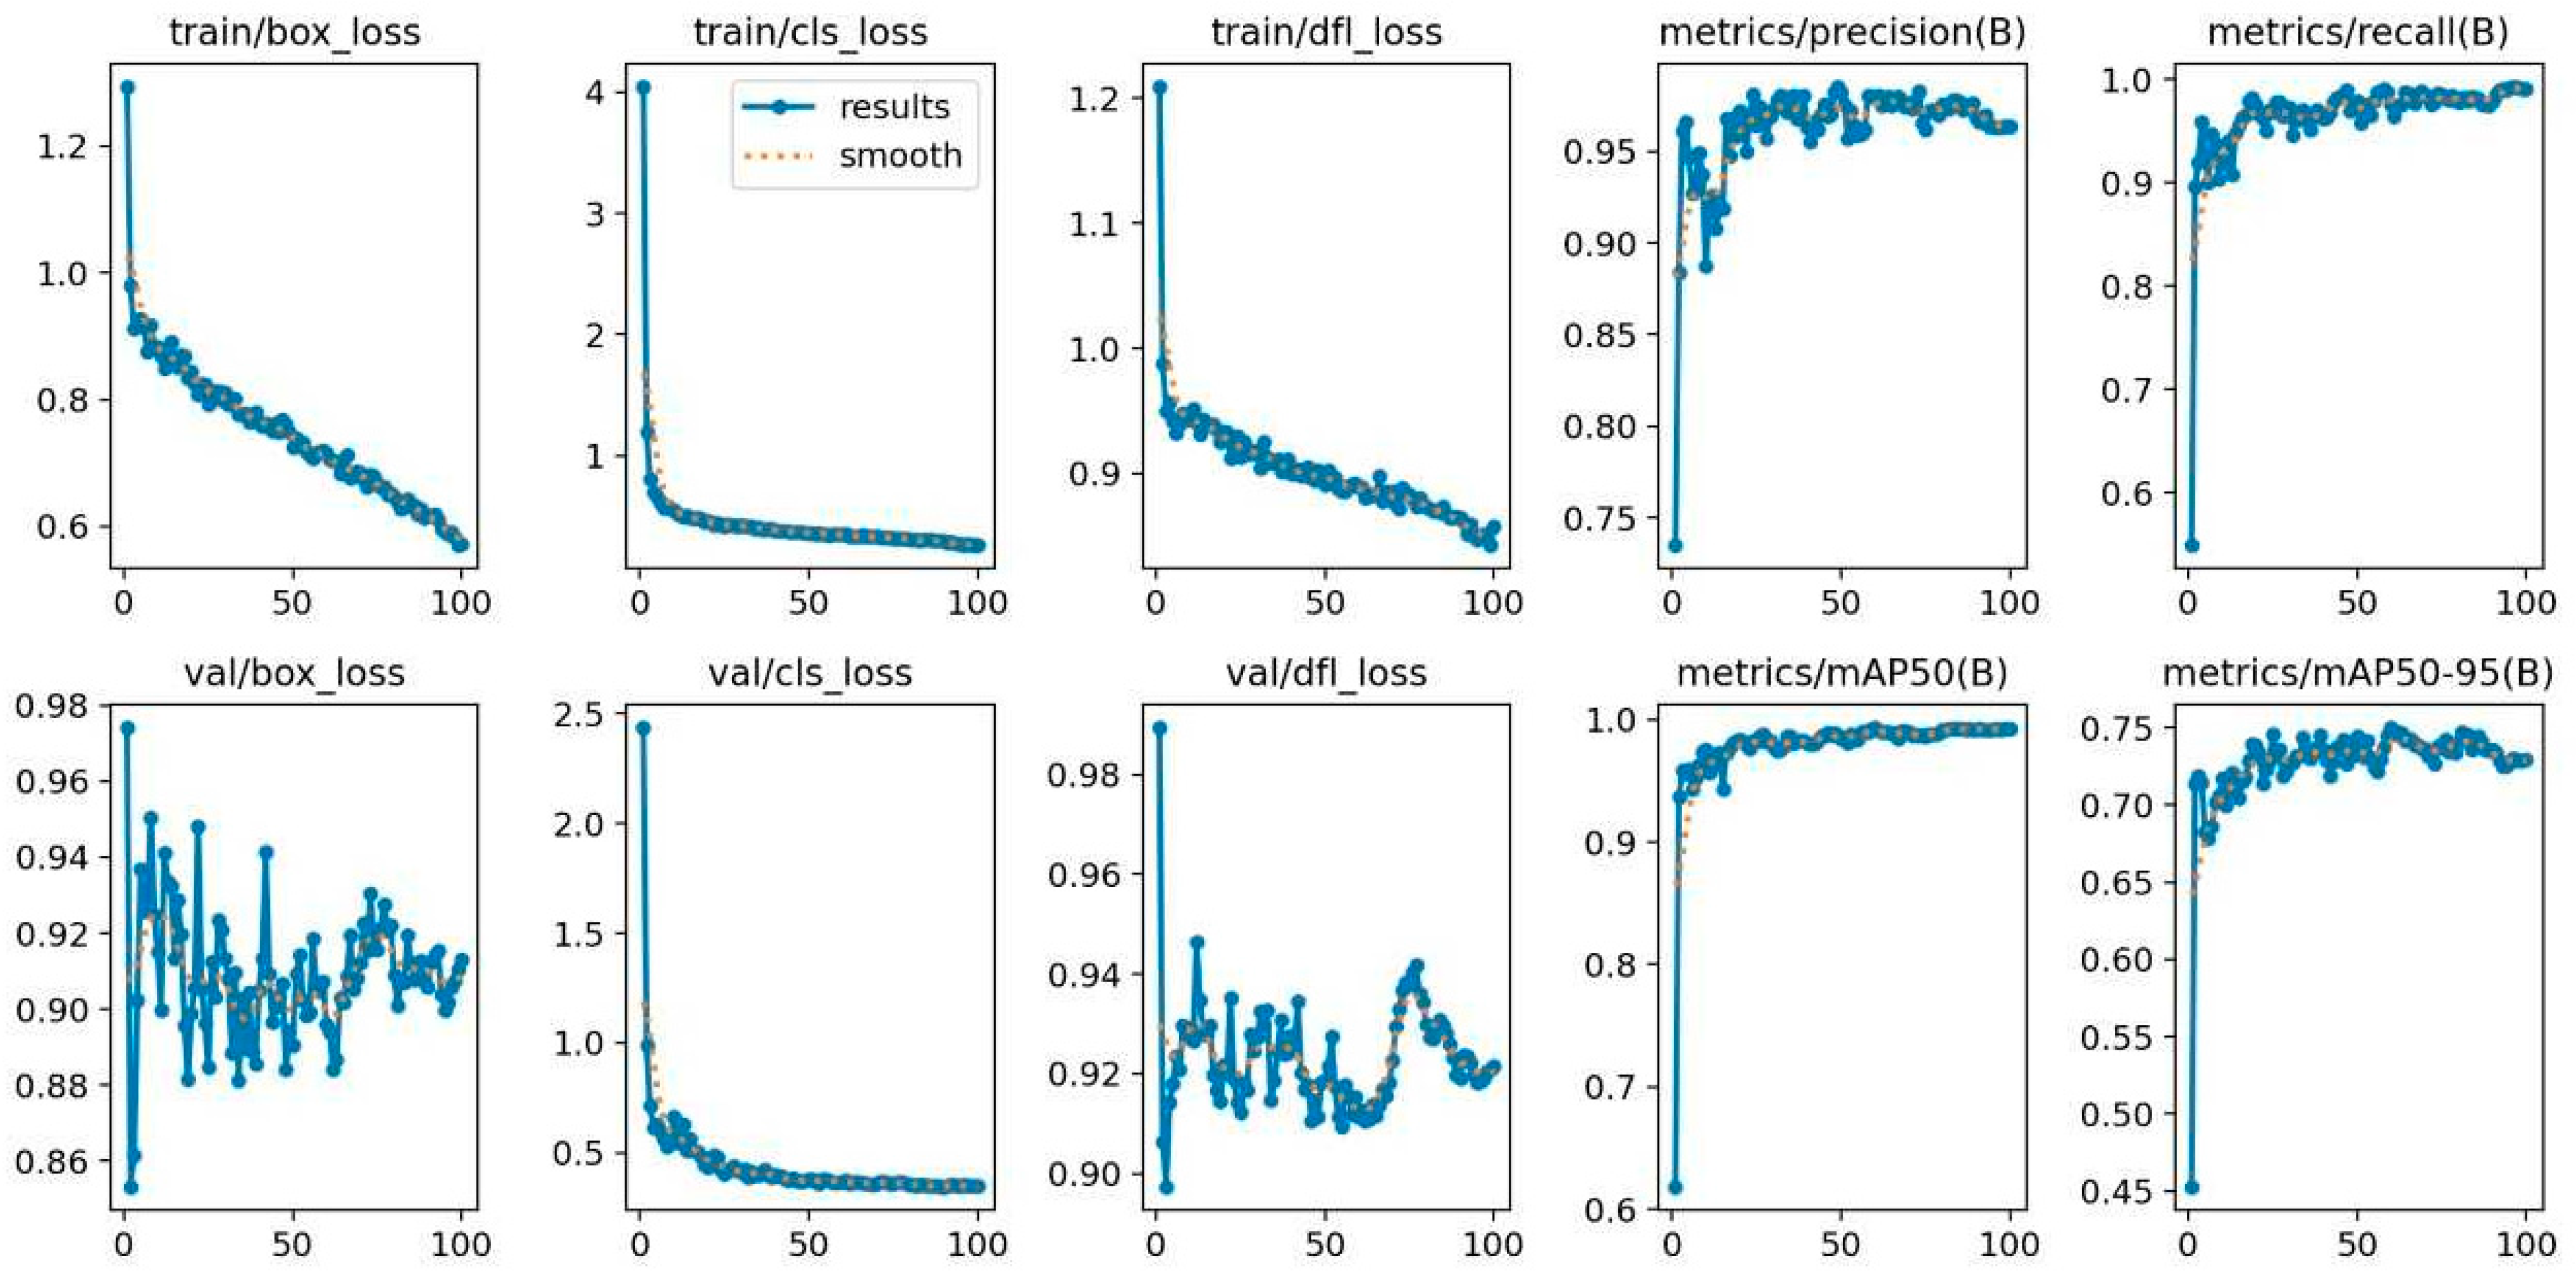
2.5. Training and Validation of YOLOv8

For our system, we used 174 photos for neural network training and 20 photos for validation. The number of object classes is 8. An example of a used training photo is shown in Figure 6.
The proposed concept was tested using mock-up turbine components, which are characterized by complex shapes, varying sizes, and being made from different materials. Due to the lack of access to the full range of turbine parts, it was decided to use 3D-printed replicas for validation. The mock-up parts were printed using the Fused Filament Fabrication (FFF) method with PLA plastic as the material, and they are shown in Figure 7. The dimensions of the printed components ranged from 15 × 15 × 30 mm to 210 × 180 × 80 mm, allowing for a diverse representation of the actual turbine parts.
In the experiment, we evaluated the frame-processing speed of a system utilizing the YOLOv8 convolutional neural network. Three image resolutions were selected for testing: 416 × 416, 640 × 640, and 768 × 768. The models used for the tests included three configurations of YOLOv8: YOLOv8s (11.2 M parameters), YOLOv8m (25.9 M parameters), and YOLOv8l (43.7 M parameters). Technical characteristics of the laptop on which the convolutional neural network was trained: CPU Intel Core i7-13700HX, RAM 16 GB, GPU Nvidia GeForce RTX 4060 8 GB.
The system’s performance was measured in terms of frames processed per minute. Specifically, we calculated how many frames the system could handle within one minute, translating that into frames per second (fps). For each resolution and model configuration, we recorded the training time and frame-processing time. Table 2 contains the microparameters that were used in the training.
To measure the system’s real-time performance, the test aimed to determine how quickly the model could process frames while maintaining the accurate detection of objects. The key parameters used during the inference are shown in Table 3.
The resulting Python Package YOLOv8 model can be imported into the ONNX format for further use in conjunction with the C++ OpenCV library [36].

3. Results and Discussion

This section presents the results of a performance analysis of the YOLOv8 neural network trained on the task of industrial component classification. Test results for frame-processing speed depending on the model configuration and image resolution are given in Table 4. Therefore, YOLOv8m with image resolution 640 × 640 was chosen for our research.
The results presented in the error matrix (Figure 8a) show that the YOLOv8 model demonstrates high accuracy in classifying most classes. The diagonal elements of the matrix indicate that classes such as “compressor wheel”, “compressor housing”, “turbine housing”, “turbine cover”, “compressor holder”, and “bearing” were correctly classified 100% of the time, indicating that there were no errors for these classes. However, for the “Center housing” class, the model made an error in one case by predicting it as a “rear part” and conversely, one case of a “rear part” was incorrectly classified as a “center housing”. This indicates that there may be confusion between the two classes, probably due to their visual similarity or overlapping features.
The normalized error matrix provides similar information in relative values, allowing a better understanding of the error rate for each class. The results in Figure 8b show that the classification accuracy for most classes is 1.0, confirming that there are no errors. However, for the center housing class, the classification accuracy is 95%, and for the rear part it is 100%, with a 5% error in classifying a center housing as rear part. This indicates the need for additional model optimization or improved data quality to distinguish complex classes more accurately.
Analysis of the F1 metrics versus the confidence threshold curve, illustrated in Figure 9, shows that at a confidence level of about 0.635, the model reaches a maximum F1 score of 0.98 for all classes. This means that the best balance between precision (Precision) and completeness (Recall) is achieved at this confidence level. This is especially important for practical applications where minimizing false positives and misses is critical. The optimal F1 score value also confirms that the YOLOv8 model performs effectively on the classification task for the given parameters.
The label distribution histogram, which is presented in Figure 10, demonstrates that the data are relatively balanced for most of the classes, such as “compressor housing”, “turbine housing”, “bearing”, and “compressor wheel”, which have about 150–175 instances. This contributes to the stability of the model training and reduces the likelihood of a prediction bias in favor of classes with more data. The scatter plots, which are illustrated in Figure 11, show various object sizes and positions, confirming the model’s ability to generalize and recognize objects of different shapes and scales.
Analyzing the precision–confidence (Figure 12a) and completeness curves (Figure 12b) shows that the Yolov8 model achieves a precision value of 1.0 at a confidence level of 0.929, confirming its ability to classify without false positives at high confidence levels accurately. Completeness reaches 1.0 at low confidence levels, allowing the model to find all possible objects, although some false positives may accompany this. These results allow the model to be customized for specific applications where finding the optimal balance between accuracy and completeness is essential.
The Precision–Recall curve (Figure 13) shows the high performance of the YOLOv8 model in object classification. The mean accuracy value (mAP) reaches 0.994 at a threshold of 0.5, demonstrating the model’s ability for high-accuracy prediction and efficient object detection. This makes the model suitable for application in tasks that require high accuracy and confidence in the results, such as industrial equipment and automated surveillance systems.
The loss plots, illustrated in Figure 14, show that the losses for the training and validation data steadily decrease as the number of epochs increases, indicating the good convergence of the Yolov8 model. The minimal differences between training and validation losses indicate no overtraining, allowing the model to generalize well to new data. The losses eventually stabilize, confirming that the training process is complete and the model is ready for practical application.
Future research directions include expanding the material and component database to improve the identification accuracy, integrating with advanced manufacturing systems and the IoT to improve collaboration and real-time control, developing predictive and prescriptive analytics to optimize decision-making, improving the user interface to speed up workflows, implementing support for flexible and adaptive manufacturing, and improving the scalability and resiliency of client–server architecture for large-scale applications.

4. Conclusions

The article is devoted to developing a material resource planning system in the context of the Warehouse 4.0 concept, which aims to automate and improve inventory and production operations management efficiency. The developed software solution utilizes the YOLOv8 neural network to accurately identify materials and production parts. Laboratory experiments have shown that the proposed system improves the decision-making process for material management, production planning, and launching new batches of products. The system is easily integrated into the enterprise’s existing ERP systems, providing centralized management and planning flexibility.
This article pays special attention to optimizing material management processes, which is especially important in flexible production conditions and the implementation of circular economy principles.
The proposed system covers the “gray areas” of material accounting systems, where it is quite difficult to ensure the accounting for each component and their dispatch to the main warehouse may be untimely. Time losses associated with transfers to the main warehouse would be automatically eliminated, since the manager making the decision remotely can ensure the transfer of this product directly to the production process and create a work order for the production employees. This approach reduces the workforce downtime associated with waiting for material for production.
The proposed system covers bottlenecks of warehouse systems through the efficient utilization of excess or unclaimed components, thereby reducing the cost of maintaining stock balances, shortening production downtime, and reducing production waste. Applying the DFMA (Design for Manufacturing and Assembly) approach helps optimize the design and processes at the manufacturing and assembly stages, reducing product lifecycle costs.

5. Discussion

The proposed study showed that the proposed concept is workable. Practical efficiency should be calculated in the conditions of a real enterprise, where the internal costs of the enterprise associated with untimely decision-making and the liquidation and provision of warehouse balances that were not transferred to the production process would be considered. At this stage, it can be stated that the system works and, in the future, can reduce the time and increase the efficiency of operational planning based on the data collected by the neural network.
The faculty where the experiment was conducted closely cooperates with the production sector and, based on the collected data, can state that at this stage, the problems of operational planning mentioned in the Introduction have not been eliminated, and neural systems are used mainly only for quality control or the detection of certain objects. Our concept is innovative, as it opens up prospects for using neural networks for remote decision-making.
Further research should cover such important aspects as:
-
Expanding the range of components;
-
Training the system to detect external defects, since at this stage, the system is not able to do this;
-
Identifying factors that can interfere with the quality of camera operation in real enterprise conditions;
-
Integrating the proposed neural network into warehouse facilities in order to reduce the costs of holding stale material and offering several decision-making options for this category of material in accordance with the principles of the circular economy and Warehouse 4.0;
-
Expanding the areas of use of the neural network by mobile applications, since the studied workplaces are important for operational planning and quality control. From this, it is possible to determine further areas of application for the proposed system: personnel management, quality control, logistics, material supply for productionm and the process of creating a cost chain.

Author Contributions

Conceptualization, O.S.; methodology, A.I.; formal analysis, O.S; software, V.A.; validation, V.A. and O.S.; writing—original draft preparation O.S.; writing—review and editing, all authors; supervision, J.T. All authors have read and agreed to the published version of the manuscript.

Funding

This research was funded by the EU NextGenerationEU through the Recovery and Resilience Plan for Slovakia under projects No. 09I03-03-V01-00095 and 09I03-03-V01-00102, and was also carried out within the project “Intensification of production processes and development of intelligent product quality control systems in smart manufacturing” (State reg. no. 0122U200875, Ministry of Education and Science of Ukraine).

Data Availability Statement

The original contributions presented in the study are included in the article, further inquiries can be directed to the corresponding author.

Acknowledgments

This work was also supported by the Slovak Research and Development Agency under contract No. APVV-23-0591, and by projects VEGA 1/0700/24 and KEGA 022TUKE-4/2023 supported by the Ministry of Education, Research, Development, and Youth of the Slovak Republic.

Conflicts of Interest

The authors declare no conflicts of interest.

References

  1. Husár, J.; Hrehova, S.; Trojanowski, P.; Wojciechowski, S.; Kolos, V. Perspectives of Lean Management Using the Poka Yoke Method. In Lecture Notes in Mechanical Engineering, Proceedings of the Advances in Design, Simulation and Manufacturing VI, High Tatras, Slovakia, 6–9 June 2023; Ivanov, V., Trojanowska, J., Pavlenko, I., Rauch, E., Piteľ, J., Eds.; DSMIE 2023; Springer: Cham, Switzerland, 2023. [Google Scholar] [CrossRef]
  2. Wang, H. Customer Needs Assessment and Screening for Transmission Solution Selection. In Lecture Notes in Mechanical Engineering, Proceedings of the 8th International Conference on Advances in Construction Machinery and Vehicle Engineering, Shanghai, China, 13–16 October 2023; Halgamuge, S.K., Zhang, H., Zhao, D., Bian, Y., Eds.; ICACMVE 2023; Springer: Singapore, 2024. [Google Scholar] [CrossRef]
  3. Kaya, B.; Karabağ, O.; Çekiç, F.R.; Torun, B.C.; Başay, A.Ö.; Işıklı, Z.E.; Çakır, Ç. Inventory Management Optimization for Intermittent Demand. In Lecture Notes in Mechanical Engineering, Proceedings of the Industrial Engineering in the Industry 4.0 Era, Antalya, Türkiye, 5–7 October 2023; Durakbasa, N.M., Gençyılmaz, M.G., Eds.; ISPR 2023; Springer: Cham, Switzerland, 2024. [Google Scholar] [CrossRef]
  4. Thürer, M.; Fernandes, N.O.; Lödding, H.; Stevenson, M. Material flow control in make-to-stock production systems: An assessment of order generation, order release and production authorization by simulation. Flex. Serv. Manuf. J. 2024. [Google Scholar] [CrossRef]
  5. Tubis, A.A.; Rohman, J. Intelligent Warehouse in Industry 4.0—Systematic Literature Review. Sensors 2023, 23, 4105. [Google Scholar] [CrossRef] [PubMed]
  6. Aravindaraj, K.; Chinna, P.R. A systematic literature review of integration of industry 4.0 and warehouse management to achieve Sustainable Development Goals (SDGs). Clean. Logist. Supply Chain. 2022, 5, 100072. [Google Scholar] [CrossRef]
  7. Tikwayo, L.N.; Mathaba, T.N.D. Applications of Industry 4.0 Technologies in Warehouse Management: A Systematic Literature Review. Logistics 2023, 7, 24. [Google Scholar] [CrossRef]
  8. Hamdy, W.; Al-Awamry, A.; Mostafa, N. Warehousing 4.0: A proposed system of using node-red for applying internet of things in warehousing. Sustain. Futures 2022, 4, 100069. [Google Scholar] [CrossRef]
  9. Vukicevic, A.; Mladineo, M.; Banduka, N.; Macuzic, I. A smart Warehouse 4.0 approach for the pallet management using machine vision and Internet of Things (IoT): A real industrial case study. Adv. Prod. Eng. Manag. 2021, 16, 297–306. [Google Scholar] [CrossRef]
  10. Ongbali, S.O.; Afolalu, S.A.; Oyedepo, S.A. Aworinde AK, Fajobi MA. A study on the factors causing bottleneck problems in the manufacturing industry using principal component analysis. Heliyon 2021, 7, e07020. [Google Scholar] [CrossRef] [PubMed] [PubMed Central]
  11. Franco-Silvera, N.; Valdez-Yrigoen, A.; Quiroz-Flores, J.C. Warehouse Management Model under the Lean Warehousing Approach to Increase the Order Fill Rate in Glass Marketing SMEs. In Proceedings of the 2023 9th International Conference on Industrial and Business Engineering (ICIBE ‘23), Beijing, China, 22–24 September 2023; Association for Computing Machinery: New York, NY, USA, 2023; pp. 379–387. [Google Scholar] [CrossRef]
  12. Manufacturing ERP Software Development: All You Need to Know. Available online: https://appinventiv.com/blog/manufacturing-erp-software-development/ (accessed on 26 September 2024).
  13. ERP Implementation Challenges Manufacturers Need to Be On Top Of. Available online: https://dwr.com.au/erp-implementation-challenges-manufacturers-need-to-be-on-top-of/ (accessed on 26 September 2024).
  14. TechTarget. Common Problems with Inventory Management. Available online: https://www.techtarget.com/searcherp/tip/Common-problems-with-inventory-management (accessed on 26 September 2024).
  15. NetSuite. Inventory Management Challenges: Overcoming Obstacles to Success. Available online: https://www.netsuite.com/portal/resource/articles/inventory-management/inventory-management-challenges.shtml (accessed on 26 September 2024).
  16. Aptean. Challenges of Inventory Management: How to Overcome Them. Available online: https://www.aptean.com/fr/insights/blog/challenges-of-inventory-management (accessed on 26 September 2024).
  17. Battaïa, O.; Dolgui, A.; Heragu, S.S.; Meerkov, S.M.; Tiwari, M.K. Design for manufacturing and assembly/disassembly: Joint design of products and production systems. Int. J. Prod. Res. 2018, 56, 7181–7189. [Google Scholar] [CrossRef]
  18. Arakawa, M.; Park, W.Y.; Abe, T.; Tasaki, K.; Tamaki, K. Development of Service and Product Design Processes Considering Product Life Cycle Management for a Circular Economy. In Lecture Notes in Mechanical Engineering, Proceedings of the Industrial Engineering and Management, Chengdu, China, 17–19 November 2023; Chien, C.F., Dou, R., Luo, L., Eds.; SMILE 2023; Springer: Singapore, 2024. [Google Scholar] [CrossRef]
  19. Cebi, S.; Baki, B.; Ozcelik, G. Overcoming Barriers in Circular Economy Implementation with Industry 4.0 Technologies: The Case of Defense Industry. In Lecture Notes in Mechanical Engineering, Proceedings of the Industrial Engineering in the Industry 4.0 Era, Antalya, Türkiye, 5–7 October 2023; Durakbasa, N.M., Gençyılmaz, M.G., Eds.; ISPR 2023; Springer: Cham, Switzerland, 2024. [Google Scholar] [CrossRef]
  20. Plakantara, S.P.; Karakitsiou, A.; Mantzou, T. Managing Risks in Smart Warehouses from the Perspective of Industry 4.0. In Disruptive Technologies and Optimization Towards Industry 4.0 Logistics; Karakitsiou, A., Migdalas, A., Pardalos, P.M., Eds.; Springer Optimization and Its Applications, vol 214; Springer: Cham, Switzerland, 2024. [Google Scholar] [CrossRef]
  21. Favi, C.; Mandolini, M.; Campi, F.; Cicconi, P.; Raffaeli, R.; Germani, M. Design for Manufacturing and Assembly: A Method for Rules Classification. In Lecture Notes in Mechanical Engineering, Proceedings of the Advances on Mechanics, Design Engineering and Manufacturing III, Aix-en-Provence, France, 2–4 June 2020; Roucoules, L., Paredes, M., Eynard, B., Morer Camo, P., Rizzi, C., Eds.; JCM 2020; Springer: Cham, Switzerland, 2021. [Google Scholar] [CrossRef]
  22. Demčák, J.; Lishchenko, N.; Pavlenko, I.; Pitel’, J.; Židek, K. The Experimental SMART Manufacturing System in SmartTechLab. In Lecture Notes in Mechanical Engineering, Proceedings of the Advances in Manufacturing II, Poznan, Poland, 19–22 May 2019; Springer International Publishing: Cham, Switzerland, 2022; pp. 228–238. [Google Scholar] [CrossRef]
  23. Sá, J.C.; Dinis-Carvalho, J.; Costa, B.; Silva, F.J.G.; Silva, O.; Lima, V. Implementation of Lean Tools in Internal Logistic Improvement. In Lean Thinking in Industry 4.0 and Services for Society; Antosz, K., Carlos Sa, J., Jasiulewicz-Kaczmarek, M., Machado, J., Eds.; IGI Global: Hershey, PA, USA, 2023; pp. 125–137. [Google Scholar] [CrossRef]
  24. Widanage, C.; Kim, K.P. Integrating Design for Manufacture and Assembly (DfMA) with BIM for infrastructure. Autom. Constr. 2024, 167, 105705. [Google Scholar] [CrossRef]
  25. Pathan, M.S.; Richardson, E.; Galvan, E.; Mooney, P. The Role of Artificial Intelligence within Circular Economy Activities—A View from Ireland. Sustainability 2023, 15, 9451. [Google Scholar] [CrossRef]
  26. Iakovets, A.; Andrusyshyn, V. Design of a Decision-Making Model for Engineering Education. In EAI/Springer Innovations in Communication and Computing, Proceedings of the 2nd EAI International Conference on Automation and Control in Theory and Practice, Orechová Potôň, Slovakia 7–9 February 2024; Balog, M., Iakovets, A., Hrehová, S., Berladir, K., Eds.; EAI ARTEP 2024; Springer: Cham, Switzerland, 2024. [Google Scholar] [CrossRef]
  27. Quality-One. (n.d.). Design for Manufacturing/Assembly (DFM/DFA). Available online: https://quality-one.com/dfm-dfa/#:~:text=What%20is%20Design%20for%20Manufacturing,assembled%20with%20minimum%20labor%20cost (accessed on 2 October 2024).
  28. GitHub—Boostorg/Beast: HTTP and WebSocket built on Boost.Asio in C++11. Available online: https://github.com/boostorg/beast (accessed on 11 August 2024).
  29. GitHub—Boostorg/Mysql: MySQL C++ Client Based on Boost.Asio. Available online: https://github.com/boostorg/mysql (accessed on 11 August 2024).
  30. OpenCV—Open Computer Vision Library. Available online: https://opencv.org/ (accessed on 11 August 2024).
  31. Redmon, J.; Farhadi, A. YOLOv3: An Incremental Improvement. arXiv 2018, arXiv:1804.02767. Available online: https://arxiv.org/abs/1804.02767 (accessed on 2 October 2024).
  32. Bochkovskiy, A.; Wang, C.-Y.; Liao, H.-Y.M. YOLOv4: Optimal Speed and Accuracy of Object Detection. Computer Science. Computer Vision and Pattern Recognition. arXiv 2020, arXiv:2004.10934. [Google Scholar] [CrossRef]
  33. He, K.; Gkioxari, G.; Dollar, P.; Girshick, R. Mask R-CNN. In Proceedings of the IEEE International Conference on Computer Vision (ICCV) 2017, Venice, Italy, 22–29 October 2017; pp. 2961–2969. [Google Scholar]
  34. Ultralytics|Revolutionizing the World of Vision AI. Available online: https://www.ultralytics.com/ (accessed on 11 August 2024).
  35. YOLOv8. (n.d.). YOLOv8 Architecture; Deep Dive into its Architecture. Available online: https://yolov8.org/yolov8-architecture/ (accessed on 11 August 2024).
  36. Terven, J.; Córdova-Esparza, D.-M.; Romero-González, J.-A. A Comprehensive Review of YOLO Architectures in Computer Vision: From YOLOv1 to YOLOv8 and YOLO-NAS. Mach. Learn. Knowl. Extr. 2023, 5, 1680–1716. [Google Scholar] [CrossRef]
  37. Lalinia, M.; Sahafi, A. Colorectal polyp detection in colonoscopy images using YOLO-V8 network. Signal Image Video Process. 2024, 18, 2047–2058. [Google Scholar] [CrossRef]
  38. Ultralytics. Ultralytics YOLO. Available online: https://github.com/ultralytics/ultralytics (accessed on 2 October 2024).
Figure 1. Block diagram of the proposed system.
Eng 05 00136 g001
Figure 2. Workstation configuration.
Eng 05 00136 g002
Figure 3. Mendix web interface for monitoring current state of operation in Warehouse 4.0.
Eng 05 00136 g003
Figure 4. Microflow for decision-making process in Mendix database.
Eng 05 00136 g004
Figure 5. Structure of YOLOv8 [36].
Eng 05 00136 g005
Figure 6. Used photo for training neural network.
Eng 05 00136 g006
Figure 7. Some 3D-printed turbine components.
Eng 05 00136 g007
Figure 8. (a) YOLOv8 confusion matrix; (b) YOLOv8 confusion matrix normalized.
Eng 05 00136 g008
Figure 9. F1–confidence curve.
Eng 05 00136 g009
Figure 10. Label distribution histogram.
Eng 05 00136 g010
Figure 11. Scatter plots.
Eng 05 00136 g011
Figure 12. (a) Precision–confidence curve; (b) completeness curve.
Eng 05 00136 g012
Figure 13. Precision–Recall curve.
Eng 05 00136 g013
Figure 14. Loss plots.
Eng 05 00136 g014
Table 1. YOLOv8 parameters.
ComponentParameterValues
Focus LayerInput image size(3, 640, 640)
Output size after convolution(32, 320, 320)
Convolution kernel size3 × 3
Stride2
Backbone (CSPDarknet53)Number of CSP Bottleneck Blocks5
Input size for CSP1(32, 320, 320)
Output size for CSP1(64, 160, 160)
Number of filters64, 128, 256, 512, 1024
Convolution kernel sizes3 × 3
Stride2
SPP Block (Spatial Pyramid Pooling)Input size(1024, 10, 10)
Pooling sizes5 × 5, 9 × 9, 13 × 13
Output size(1024, 10, 10)
Neck (PANet)FPN Path input size(1024, 10, 10)
Output size after FPN Path(256, 40, 40), (128, 80, 80)
PANet Path Blocks (C3 Blocks) input size(512, 20, 20), (256, 40, 40), (128, 80, 80)
Output size after PANet Path Blocks(256, 40, 40), (128, 80, 80), (64, 160, 160)
A more detailed description of the architecture of the YOLOv8 convolutional network is given in [37], and a detailed review of the evolution of the YOLO family of convolutional neural networks and a detailed description of their operation is given in [37,38].
Table 2. Training hyperparameters.
HyperparameterValueDescription
Epochs100The number of times the entire dataset is passed through the model during training
Batch16The number of images processed in one training iteration
Iou0.7The threshold for determining whether overlapping bounding boxes should be merged during non-maximum suppression
Max_det300The maximum number of objects the model can predict in one image
lr00.01The starting rate at which the model’s weights are updated during training
lrf0.01The learning rate maintained during the final phase of training
momentum0.937Controls the amount of influence past updates have on the current weight updates
weight_decay0.0005A regularization parameter that helps prevent the model from overfitting by penalizing large weights
warmup_epochs3.0The number of epochs during which the learning rate gradually increases from a very low value to the set initial learning rate
warmup_momentum0.8The starting momentum value during the warmup phase, which gradually increases as training progresses
warmup_bias_lr:0.1The initial learning rate for bias parameters during the warmup phase, helping them converge faster in the early epochs
Table 3. Parameters for running the neural network.
MicrometerValueDescription
Confidence Threshold0.25This is the minimum probability at which the model considers that the detected region contains an object
Score Threshold0.45The score threshold takes into account both the model’s confidence in the presence of the object and its classification
Non-Maximum Suppression (NMS) Threshold0.50This parameter defines the overlap threshold between predicted bounding boxes
Table 4. Test results based on model configuration and image resolution.
Image ResolutionYOLOv8s (11.2 M Parameters)YOLOv8m (25.9 M Parameters)YOLOv8l (43.7 M Parameters)
416 × 416Training Time: 4 m 2 s
Processing Speed: max: 0.185 s
min: 0.007 s
avg: 0.008 s
Note: Detected object (bearing) showed false positives near edges
Training Time: 9 m 30 s
Processing Speed: max: 0.225 s
min: 0.009 s
avg: 0.013 s
Note: Bearing detection had false positives near edges
Training Time: 16 m 1 s Processing Speed: max: 0.248 smin: 0.014 savg: 0.016 s
640 × 640Training Time: 5 m 23 s
Processing Speed: max: 0.200 s
min: 0.011 s
avg: 0.013 s
Note: Compressor housing not always detected, some false positives
Training Time: 13 m 37 s
Processing Speed: max: 0.235 s
min: 0.016 s
avg: 0.018 s
Out of Memory
768 × 768Training Time: 9 m 14 s
Processing Speed: max: 0.225 s
min: 0.017 s
avg: 0.019 s
Noti: Bearing false positives still present
Out of MemoryOut of Memory
To evaluate the quality of the model, we constructed confusion matrices, curves of F1 metrics, accuracy, and completeness versus confidence level, and examined graphs of loss during training.
Disclaimer/Publisher’s Note: The statements, opinions and data contained in all publications are solely those of the individual author(s) and contributor(s) and not of MDPI and/or the editor(s). MDPI and/or the editor(s) disclaim responsibility for any injury to people or property resulting from any ideas, methods, instructions or products referred to in the content.

