Article

Shifting Towards Greener and More Collaborative Microgrids by Applying Lean-Heijunka Strategy

by
Hanaa Feleafel
*,
Michel Leseure
and
Jovana Radulovic
School of Electrical and Mechanical Engineering, University of Portsmouth, Anglesea Building, Anglesea Road, Portsmouth PO1 3DJ, UK
*
Author to whom correspondence should be addressed.
Submission received: 5 March 2025 / Revised: 20 March 2025 / Accepted: 27 March 2025 / Published: 29 March 2025
(This article belongs to the Section Electrical and Electronic Engineering)

Abstract

:
The United Kingdom seeks to achieve net-zero emissions by 2050, mostly via the shift to an electrical system exclusively powered by zero-carbon sources. Microgrids (MGs) can be seen as an effective system for integrating renewables into the energy portfolio. Nonetheless, MGs face the acknowledged obstacle of backup power generation due to the intermittent nature of renewable energy sources, necessitating the establishment of backup power generation capacity. This paper contrasts selfish power generation, where the MG pursues complete energy autonomy, with an alternative influenced by lean principles (Heijunka production), which seeks to stabilise power transactions within the national electricity supply chain, reduce emissions, and tackle the backup generation challenge. This study proposes a pre-contractual order update (COU) strategy for the operation of hybrid collaborative MG where a forward order update to the utility grid is placed, in contrast to selfish MG, which uses a spot order update strategy. The COU strategy was defined, and two simulation models (for selfish and collaborative MG) were developed, each incorporating four backup generation scenarios to illustrate the method’s efficacy by assessing the system’s critical performance metrics. It has been found that the collaborative MG model reduced the carbon emissions by 62% and the volatility of unplanned orders to the grid by 61% compared to the selfish model in the first scenario (grid-dependent MG). Furthermore, the MG achieved zero volatility and a 33% reduction in carbon content in the collaborative MG when using the H2 burner as backup generation compared to the first scenario. Indicating that sustainability encompasses not only the use of renewable resources but also the stability of their outputs through the implementation of collaborative MGs.

1. Introduction

The incorporation of additional renewable energy capacity into the energy portfolio is essential for attaining zero-carbon generation [1]. However, integrating more renewables necessitates an effective solution for its fundamental challenge of intermittency [2]. Supply chain and operations management may offer insights to address this issue [3,4]. Operations management systems are often power-consumption nodes in electricity networks, and as such, operations systems are contributing to the net zero challenge. In the transition to a sustainable energy supply, these nodes can either rely on the national electricity sector for decarbonisation (thereby shifting the responsibility to the power supplier) or commence their own energy generation (thus creating a MG system and tackling the issue autonomously). In instances where the national energy sector’s capability for decarbonisation is uncertain, end nodes could adopt the MG model. Nonetheless, the microgeneration strategy is hindered by the recognised challenge of backup power generation due to the intermittent nature of renewable energy sources [5], which means that a backup power generation capacity must be in place in order to achieve stable electricity supply without blackouts.
The MG as per the IEEE standard 2030.7 definition is “loads, distributed energy resources (which include distributed generation, storage and load control), and the concept of operating with or without a grid” [6]. MGs could be considered as microgeneration units that might incorporate many renewable energy sources, capable of capturing wind and solar energy, which may then be stored in an energy storage system. A fundamental characteristic of MGs is their capacity to function as localised energy sources for commercial, industrial, or residential uses.
There are two types of MGs based on their operational mode with the main grid. “Stand-alone MG” or “isolated MG,” as seen in Figure 1, is mostly utilised in remote regions where the distance and cost of transporting and distributing electricity from a central energy source are excessive. They offer a method for supplying power to rural communities in remote areas and small islands. Such a system is solely designed for off-grid applications and is incompatible with any external electrical power network, complicating stable backup generation unless reliant on unsustainable sources such as diesel generators [7,8].
The other type is the grid-connected MG often operates in synchronisation with the main grid. However, it can function autonomously in “island mode” depending on technological or economic conditions, referred to as hybrid MG as shown in Figure 2. This improves supply security inside the MG, facilitates emergency power provision, and allowing for a transition to greener MGs [9,10].
Despite plenty of research about MGs, there is no evidence that, when strategizing about the energy systems of the future, MGs will go beyond a minority role, i.e., MGs are the exception rather than the rule. The current plan in large countries is to invest in large-scale renewable energy generation [11], rebuild or share energy infrastructure [12,13], and develop new forms of large-scale energy storage solutions like hydrogen storage [14,15,16]. Currently, no country is entirely reliant on MGs; however, numerous nations, particularly in developing areas (Nigeria, India, and Sub-Saharan Africa) [17] and islands (the Isles of Scilly and Orkney Islands in the UK) [18], are increasingly employing them for power generation, especially in remote or off-grid regions.
The problem is that, in contrast to the integration of MG inside utility grids (an inter-system coordination focus), the majority of MG research focusses on the MG itself (an intra-system focus). Even though so-called integrated MGs are the subject of the bulk of MG research in the academic literature, the primary objective of these studies is to improve the MG’s local performance by accomplishing objectives like increasing autonomy or lowering local costs [19,20]. This paper’s objective is to examine how MG may be integrated into utility grids (with an emphasis on inter-system coordination), which entails examining the ecological roles (e.g., as part of the ecosystem) that MG plays in larger electrical systems and highlighting both their advantages and disadvantages. Several scenarios were designed to consider the different options for backup generation in the MG, including the national grid, diesel generator, and H2 burner, to compensate for the intermittency nature of wind and solar power outputs. This is first accomplished in Section 2 (Literature Review), where the theoretical distinction between selfish and collaborative MG is established. Then the subsequent section focuses on the modelling of this concept, by modelling the collaborative and selfish MG systems. Followed by the analysis and discussion of the model’s results.

2. Literature Review

The coordination between a utility grid and an MG is usually managed by a broader balancing mechanism that encompasses all power generation and consumption nodes within the electricity network. All parties submit forecasts of their intended output or consumption, and an auction procedure is employed to align supply and demand, usually within a one-day-ahead framework that also allows for intra-day modifications. In the current UK system, the duty of managing the volatility of orders from the MGs rests with the national grid. In answer to the rising fluctuating demand for the grid caused by intermittent renewable sources at the utility-scale and MGs, there has been a drive to utilise dynamic management solutions such as Dynamic Containment (DC), where the Energy System Operator (ESO) for Great Britain has recently instituted the DC frequency response service within the national control room [21]. This service significantly improves its ability to promptly resolve electrical flow interruptions across the grid. Nonetheless, this approach is restricted to the grid level, whereas MGs continue to function in a selfish way. This paper examines the subject of where and how to manage volatility. Should we maintain management at the grid level, or would it be more beneficial to address unpredictability and volatility at smaller, localised scales, such as MGs?
There is limited research that emphasises the significance of MGs in managing order volatility at the MG level prior to transmission to the grid. Sato et al. [3] conducted research in Japan centred on energy supply operations within an MG connected to a utility grid. The research sought to evaluate the system’s effectiveness and provide ways to ensure a consistent supply to the MG. The findings indicate that the linkage to the utility grid mitigated power supply instability to the MG, hence facilitating the adoption of Heijunka (level) production, which reduced both the incidence and frequency of blackouts at the MG level. Although Sato utilised the level production principle in the electrical sector, his purpose was to obtain stability at the MG level rather than the utility grid, assuring a steady supply to the MG, and they judged performance from the MG perspective. From the standpoint of the utility grid, their findings indicated a significant surplus of power in the MG system, which, if sold to the utility grid, might lead to an increase in peak load sources inside the utility grid. Otherwise, this surplus electricity is seen as a waste inside the MG system. They emphasised the necessity for further refinement of the management model to efficiently reduce both power deficits and surpluses while preventing excessive storage capacity.
Feleafel et al. [4] distinguished between selfish MGs and collaborative MGs by applying supply chain management principles to the electrical industry. MGs that prioritise their own advantages over the utility grid’s interests may be referred to as “selfish,” as this self-serving attitude results in ignoring the consequence of MG planning decisions on the larger grid and only favours the MG. This selfish behaviour may negatively impact the electric grid by exacerbating fluctuations in demand during times of renewable energy shortages by suddenly relieving the larger system when operating autonomously or, furthermore, by supplying excess power to the main grid, thereby elevating peak load. They proposed that the integration of “collaborative” MGs in the UK power grid is necessary by integrating steady demand with planned order updates. The current order update algorithms of selfish MGs are causing fluctuating demand at the grid level. Their top priority is to utilize available renewable energy and switch to grid electricity only when necessary. The MGs could instead use a proposed strategy called pre-contracted grid order update (COU), where the MG prioritises the use of pre-contracted grid electricity based on a demand forecast done one week in advance before exploiting the available renewable energy. The effect of the intermittent nature of renewable energy outputs can be mitigated by the use of weather forecasts to plan the MG demand from the utility grid and submit orders with a one-week lead time. This suggestion may have implications for policies as well. Rather than implementing a single policy applicable to all types of MGs, distinct policies might be established for each MG type [22]. The MGs should be incentivized as a function of the role they play in the larger system (e.g., volatility reduction).
Since the previously mentioned study is conceptual in nature, there is a literature gap that requires more empirical research to assess potential barriers to implementing the proposed strategy in real-life scenarios. While taking into account various backup generation modes, such as depending on the national grid to compensate for the shortage of renewable energy output or, alternatively, on the diesel generator or the H2 burner, this study will concentrate on the sustainability perspective (To what degree is the MG environmentally friendly?) of the collaborative MG compared to the selfish MG. The remainder of this section will outline prior research that utilised the backup generation techniques featured in this article.
A backup generating capacity is essential due to the main obstacle posed by the intermittent nature of renewable energy sources in the microgeneration plan. Various researchers have utilised diverse backup-generating options in MG systems to address intermittence. However, when addressing one issue, another problem arises due to reliance on unsustainable sources such as diesel generators. The literature presents multiple cases where the MG system prioritises the use of the diesel generator to achieve autonomy from the grid [23,24]. This is seen as an obvious illustration of the “selfish” MG notion, as the MG in this instance not only unfavourably affects the grid by offloading the larger system but also adversely impacts the environment by elevating the CO2 emissions. Other researchers offered a better solution by transitioning the MG system operation between the utility grid and the diesel generator [25,26]. However, their findings indicate that under severe conditions, when both wind and solar energy are unavailable, and load demand persists, electricity is sourced from the utility grid to provide the fluctuating loads.
On the other hand, some researchers considered the utility grid as the only backup generator to the MG system [22]. This solution is better environmentally, but again it is selfish solution as it goes back to the demand volatility associated with renewable energy sources. Consequently, enhanced coordination is necessary to mitigate the adverse impact of this volatility on the utility grid.
An alternative method may involve utilising an H2 burner as a backup generator [27], which is seen as an environmentally sustainable option. It should be utilised in conjunction with the main grid to ensure reduced volatility of orders to the grid and prevent unloading of the bigger system.
Table 1 presents the latest research on backup generation solutions, illustrating the impact of the proposed solution on the utility grid.
As previously discussed, the excess power problem with Sato’s research [3], despite the notion of level demand/production between the MG and the utility grid, the excess power in the MG system remained unsolved. This research showcases how the coordination between different backup generation options could yield better performance, where fewer blackouts, low volatile demand, and less excess power could be achieved.

3. Method

A mathematical modelling approach is employed to investigate the performance difference between the two types of MG outlined previously: selfish and collaborative MG. The suggested COU strategy has been defined, followed by a review of the studied models and their scenarios, illustrating the power flows in each case. Subsequently, all power supply sources and the performance measures used were modelled.

3.1. COU Strategy Description

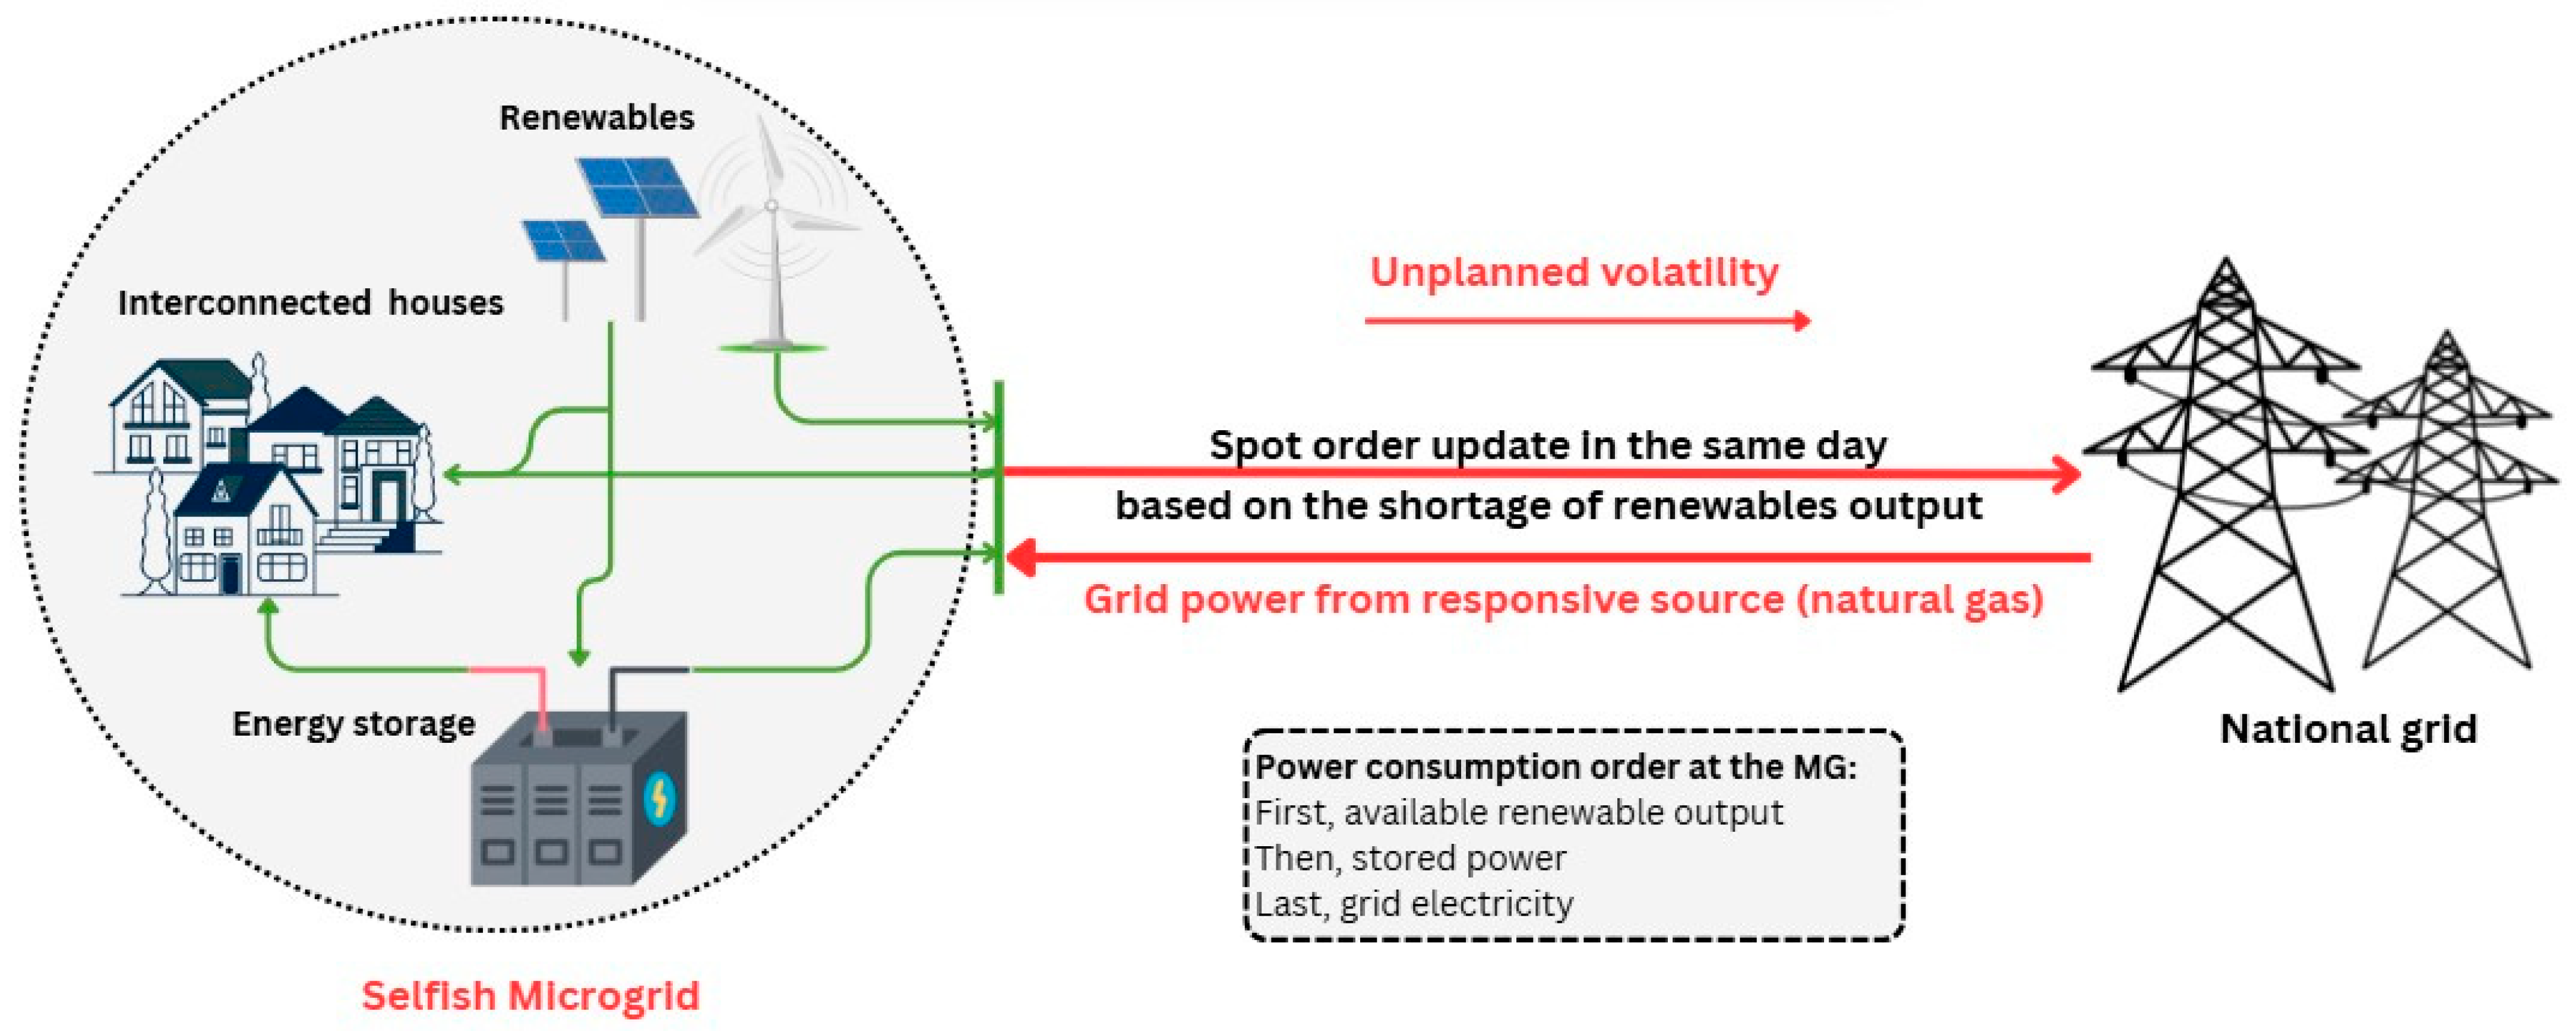
Figure 3 and Figure 4 illustrate the distinction between the collaborative MG utilising the COU strategy and the selfish MG relying on the traditional strategy, respectively. The existing order update algorithm of selfish MG causes volatility in demand at the grid level. Its main priority is to use available renewable energy, turn to grid electricity when necessary, and submit a spot grid order update (unplanned volatility) in a more sporadic fashion than traditional end-of-network nodes (we refer to these unplanned orders and their effects in red arrows in Figure 4). In this paper, the proposed collaborative MG employs the order update strategy, called pre-contracted order update (COU). COU is a written, forward (e.g., one week ahead) commitment to purchase electricity based on demand estimate and weather (intermittence) forecast. In this strategy, the MG prioritises grid electricity over the use of the available renewable energy. Storage acts as a commitment guarantee, i.e., the bulk of local forecast errors are absorbed through storage, working as a safety stock through the definition of the storage capacity. By efficiently planning grid orders with a one-week advance time, the volatility of these orders becomes anticipated (planned volatility) on the grid side (these planned orders are shown in Figure 3 with their implications in green colour arrows). This enables the grid to fulfil that request with less responsive sources like nuclear electricity rather than depending on unsustainable sources such as natural gas to offset the spot orders originating from selfish MGs. The following Table 2 shows the difference between collaborative MG and selfish MG:

3.2. Models and Scenarios

This article presents a comparison model of the two MG systems to analyse overall order volatility under four distinct backup generation scenarios as seen in Figure 5. Three performance metrics were evaluated: supply carbon content, unplanned orders, and their volatility, and exported power to the utility grid.

Power Flows in the Studied Scenarios

Each scenario explored different energy flows depending on the MG type (selfish or collaborative) and the backup generation solution. Therefore, it is worth illustrating the power flows of the different scenarios. In Figure 6, all four scenarios for Model 1 (selfish MG) were presented. Sc.1 in Figure 6a assumes that the selfish MG is using the utility grid only as a backup generation, where it consumes electricity when there is a shortage in renewable energy stored at the MG level. If there is excess energy more than the storage capacity, the MG exports this energy to the utility grid. In Figure 6b, the MG is considered an isolated MG and depends on a diesel generator as the backup generator when it has a shortage in stored energy, but it exports the excess power to the utility grid. Model 1-Sc.3 illustrated in Figure 6c also for isolated MG depends on an H2 burner as the backup generation, but in this case, an additional storage (H2 tank) is added to the MG system to absorb the excess power. So, instead of exporting this power to the grid, it will be converted to H2 using an electrolyzer and stored in an H2 tank. The H2 burner’s supply comes from this additional storage if available, and if there is a shortage in the additional storage, the MG will have to buy H2 from an external supplier. Sc.4 for the selfish MG illustrated in Figure 6d is the same as the previous scenario (Model 1-Sc.3); the only difference is that instead of buying H2 from an external supplier to compensate for the additional storage shortage, the MG will use the diesel generator.
Figure 7 depicts all four scenarios for Model 2 (collaborative MG). Sc.1, as shown in Figure 7a, proposes that the collaborative MG relies solely on the utility grid for backup generation, with the supply from the utility grid adhering to the COU strategy. This supply is prioritised for consumption before the renewable energy available in the system, and in the event of a shortage, the MG procures additional supply from the grid. The surplus COU supply is stored in the storage system, while any renewable energy exceeding the storage capacity is sent to the utility grid. Figure 7b depicts the MG depends on a diesel generator as a backup when there is a shortage in the COU supply from the grid, and it exports surplus electricity to the utility grid. For Model 2-Sc.3 in Figure 7c, the MG utilises an H2 burner for the COU supply’s backup generation; however, an additional storage component (H2 tank) is incorporated into the MG system to store surplus power. Rather than exporting this energy to the grid, it will be converted to hydrogen using an electrolyser and stored in a hydrogen tank. The H2 burner’s supply is sourced from this additional storage, and in the event of a deficiency in the additional storage (H2 tank), the MG will need to get H2 from an external supplier. Sc.4, the last scenario for the collaborative MG illustrated in Figure 7d, uses a diesel generator rather than procuring hydrogen from an external supply, as was the case in the preceding scenario, to address the additional storage deficiency.
Table 3 illustrates the how the real-world uncertainties, such as forecasting errors and demand fluctuations could be mitigated in the MG system. The mitigation strategy was described considering the selfish system that rely on the current energy management compared to the collaborative system that relies on the COU strategy.

3.3. Modelling of Power Demand

The daily electricity consumed by the households included in this paper is presented in this section, where the demand fluctuates on an hourly basis. The power demand (in kWh) of the interconnected households is represented by Equation (1):
D ( t ) = d t × N h ,
where, (t) is time (The UK standard time), D(t) is the aggregate demand for the interconnected households at time t, d(t) is the power demand for each household, and Nh is the total number of households.

3.4. Modelling of Basic Power Supply from Renewables

In this paper there is two types for energy supply; the basic supply from wind turbine and solar photovoltaics, and the backup generation from different sources depending on the scenario proposed. In this section all the parameters and governing equations for the basic supply will be presented.

3.4.1. Wind Power and Solar Power

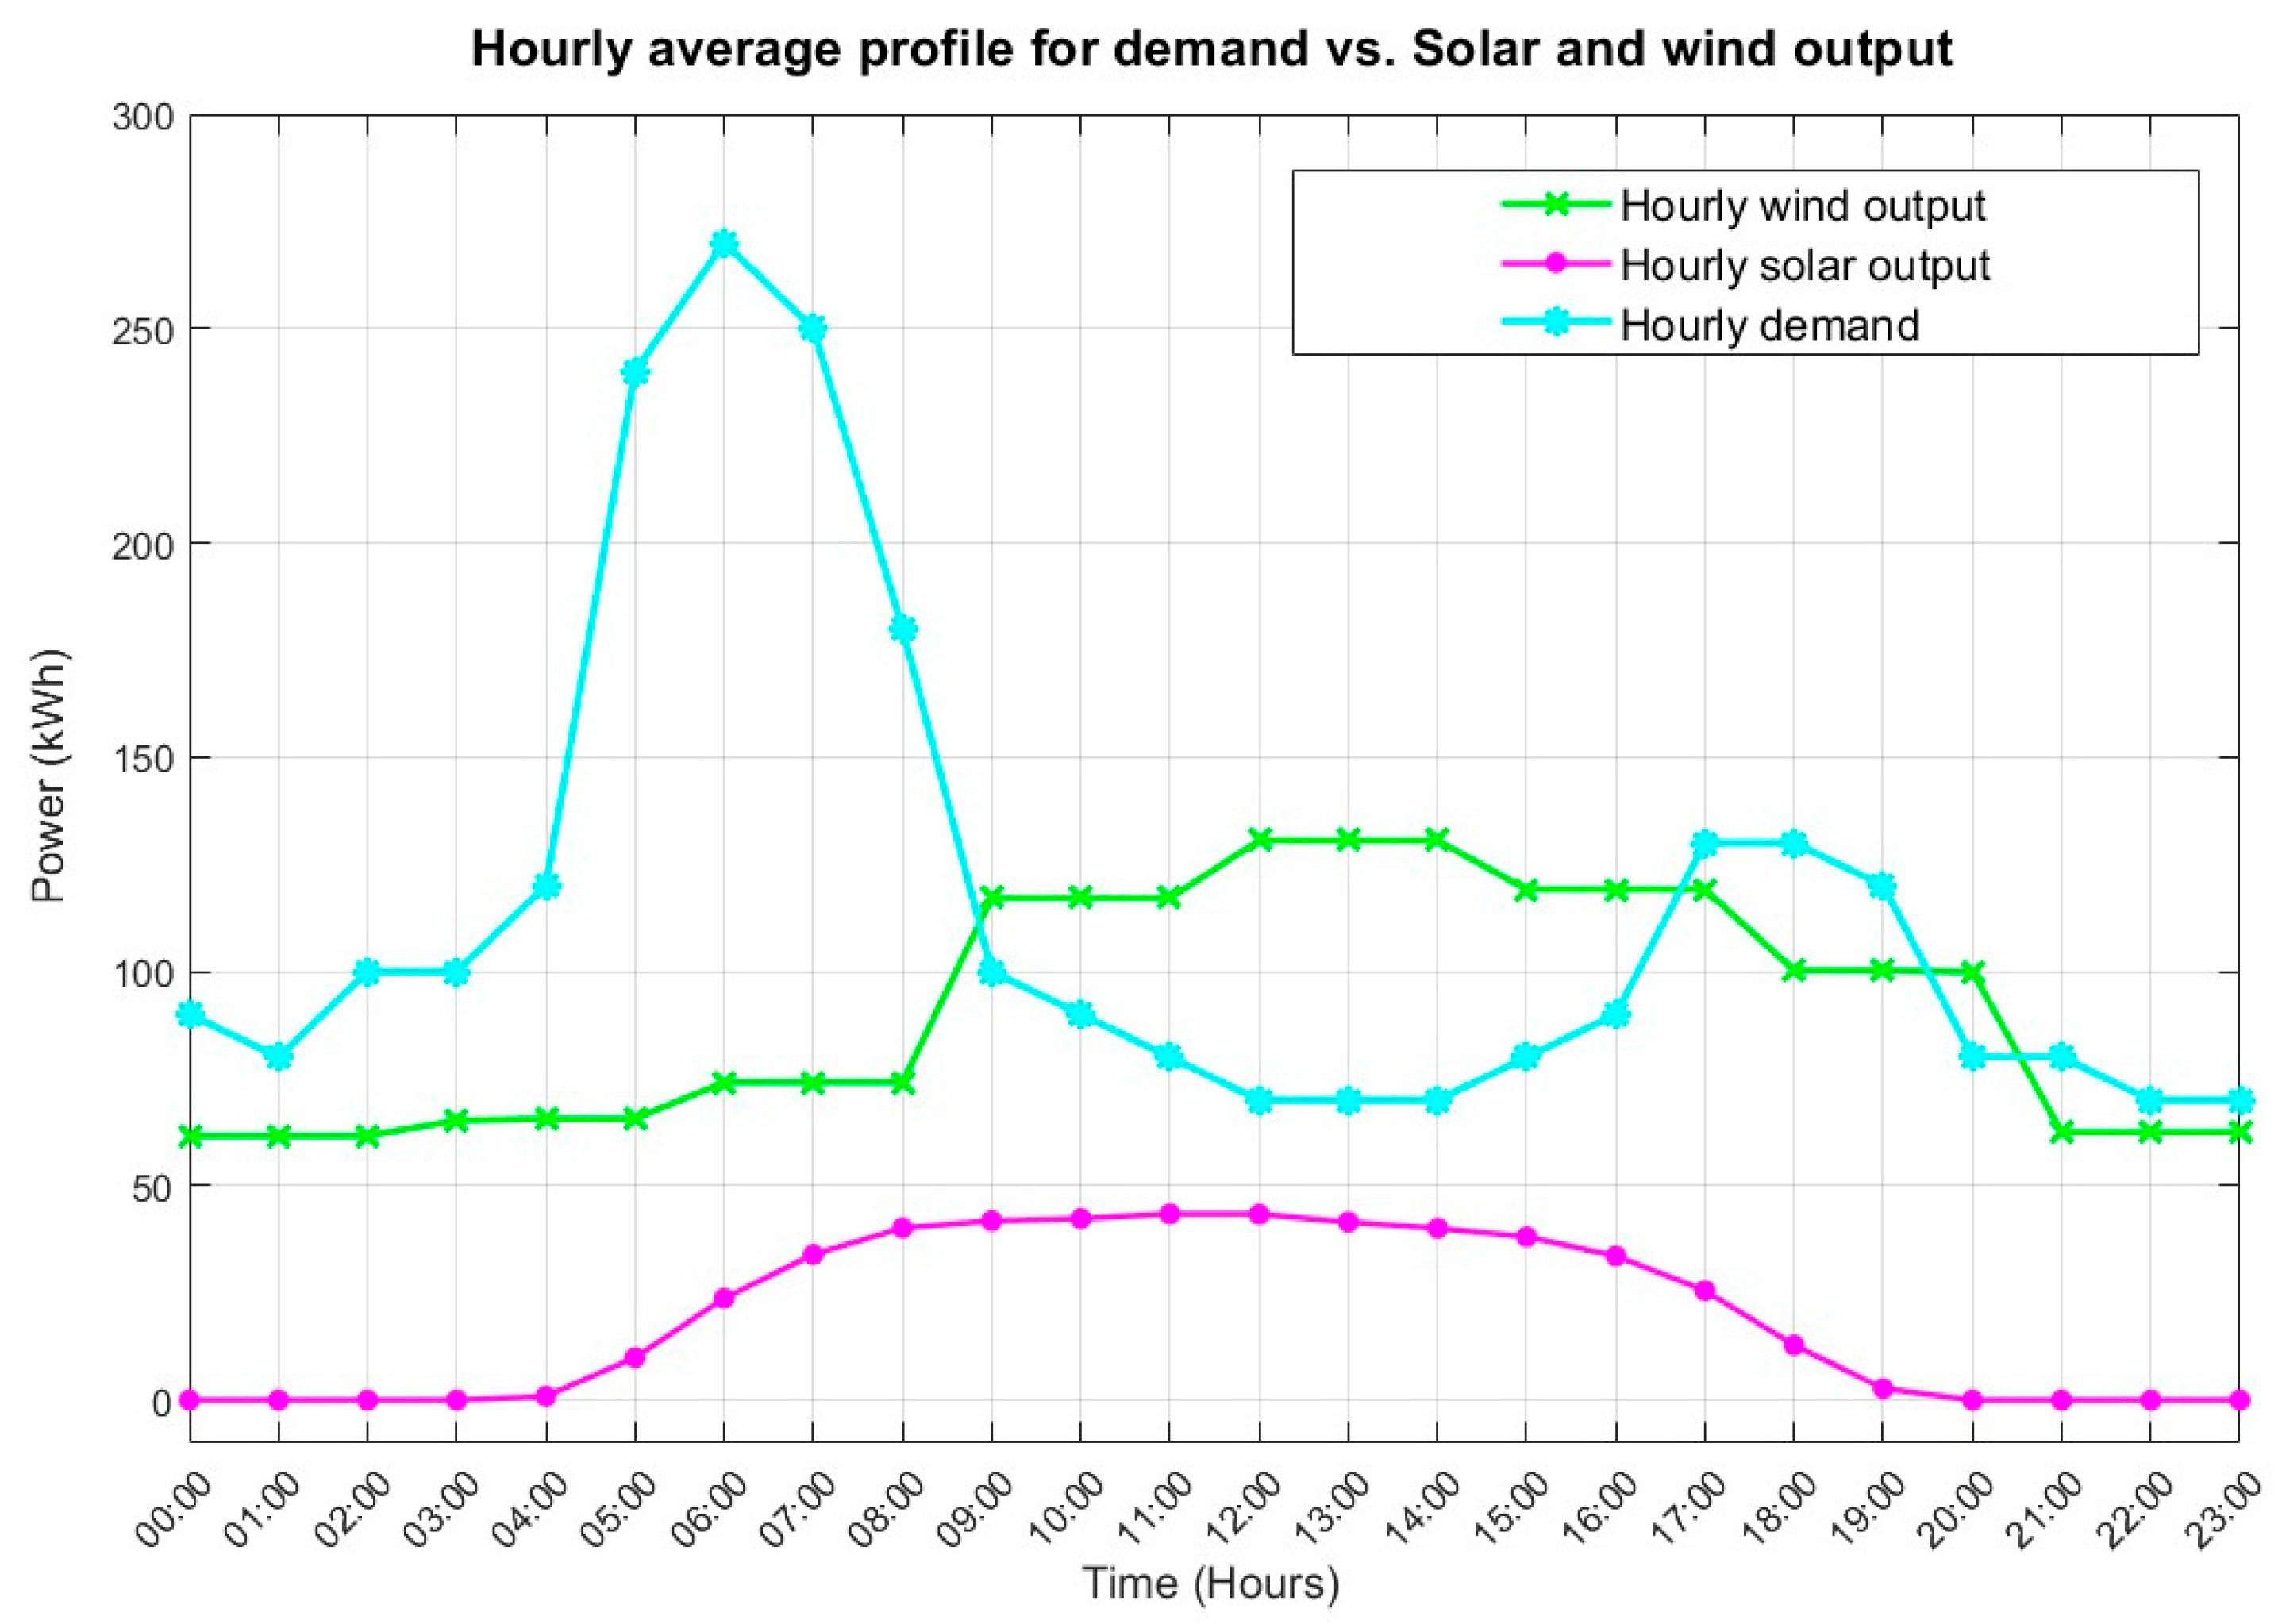
The design approach was to guarantee that the average power supply would satisfy the daily use of the interconnected houses, totalling 2800 kWh/day. This is achieved by evaluating the number of wind turbines and solar photovoltaic panels necessary to provide the required output. Therefore, the total count of used photovoltaic panels was 380, accompanied by a single wind turbine. Figure 8 illustrates the hourly average demand versus the renewables output across three months (simulation period in this paper). The network, including interconnected houses, wind turbines, photovoltaic panels, and the storage system, is predicated on the assumptions outlined in Table 4, with precise specifications for both supplied in this section.
  • Wind power:
The power output of a wind turbine could be modelled using Equation (2) according to Salih et al. [30], where the output power is measured in kilowatts [31]:
P w ( t ) = 0.5   k   P   C p   ρ   A   V ( t ) 3 ,
where, Pw(t) is the power output from a wind turbine at time t in kilowatts, Cp Maximum power coefficient, ranging from 0.25 to 0.45, (Betz’s maximum threshold = 0.59), p is the air density, 0.08 lb/ft3, A is rotor swept area, ft2 or π D2/4 (D is the rotor diameter in ft, π = 3.1416), V(t) is the wind speed at time t, mph, and K is equal to 0.000133, a constant to yield power in kilowatts.
The parameters of the used wind turbine are defined as Table 5, which are based on the specification of the commercial panel [32].
  • Solar power:
For modelling the solar PV power, according to [33], the output power (in Watts) of the PV system is given by Equation (3):
P p v ( t ) = I ( t ) × A × η ,
where Ppv(t) is the estimated power output from PV in kilowatts at time t, I(t) is the irradiance at time t, Wh/m2, A is the total panel area (area of one panel *Np, and η is nominal efficiency for the panel.
The parameters of PV panels are defined in Table 6, which are based on the specifications of the commercial panel [34].
Concerning data collection, actual wind data were gathered daily from secondary sources [35] throughout three months commencing 22 March, modelled as a series of 1-h intervals. The solar irradiance data for the UK was obtained from the Global solar Atlas [36]. Assuming demand fluctuates throughout the day due to varying family consumption patterns. The actual weather data also illustrates the complementarity between solar and wind energy sources, such as wind increasing while sunlight decreases, and vice versa.

3.4.2. Power in Basic Storage

The stored power in the storage system could be modelled using different rules depending on the grid type: collaborative or selfish. The storage efficiency in this paper was considered 100%, whereas the next formula dynamically incorporates efficiency. The power in storage (in kWh) is represented by Equation (4), where in Model 1 (selfish MG) the COU is zero:
P s t t = C O U t + P s t t 1 + S t D t × S t e                                                                                                                                                                                                                                   if           COU ( t ) + P s t ( t 1 ) + S ( t ) D ( t ) < S t c S t c × S t e                                                                             if           COU t + P s t t 1 + S t D t > S t c     0                                                                                                       if           COU t + P s t t 1 + S t D t < 0      
where Pst(t) is the power in storage system in kilowatts at time t, COU(t) is the precontracted grid order update at time t, Pst(t − 1) is the power in storage system at the previous hour in kilowatts, S(t) is the power supply from wind turbine and PV panels at time t, D(t) is the aggregate demand for the interconnected households at time t, Stc is storage capacity in kilowatts, and Ste is storage system efficiency.

3.5. Modelling of Backup Generation Options

In this section all the backup generation solutions that considered in this paper is modelled. Depending on the MG’s model, the variables used in the following equations are changing.

3.5.1. National Grid

The power needed from the national grid, which is referred to by spot grid order update, is considered a crucial objective of this paper. The volatility of the power that is ordered to the utility grid could be limited by changing the rules that the MG uses when consuming the power from either the renewable sources, storage, or the backup generation solution, including the utility grid, which in this paper is the national grid of the UK. The power supply from the national grid (in kWh) is represented by Equation (5). In the case of applying this equation in the selfish model of the MG, COU is considered zero.
S O U t = D t S t C O U t P s t t 1                                                                                                                                                                                                                                           i f         C O U t + P s t t 1 + S t D t < 0     0                                                                                           i f         C O U t + P s t t 1 + S t D t > 0    
where, SOU(t) is the power supply (spot grid order update) from the national grid at time t in kilowatts.

3.5.2. Diesel Generator

The power needed from the diesel generator in case the MG depends on it solely as a backup generation is presented in this subsection. According to the MG model, this supply differs as for selfish MG, there is no COU supply from the grid to be considered. The power supply from the diesel generator in kWh is represented by the Equation (6):
P D G t = D t S t C O U t P s t t 1                                                                                                                                                                                                                                           i f         C O U t + P s t t 1 + S t D t < 0     0                                                                                           i f         C O U t + P s t t 1 + S t D t > 0    
where, PDG(t) is the power supply from the diesel generator at time t in kilowatts

3.5.3. Hydrogen Burner

The power needed from the H2 burner in the case of the MG depends on it solely as a backup generation, which is presented in this subsection. According to the MG model, this supply differs; for selfish MG, there is no COU supply from the grid to be considered. The power supply from the H2 burner in kWh is represented by Equation (7):
P H B t = D t S t C O U t P s t t 1                                                                                                                                                                                                                                           i f         C O U t + P s t t 1 + S t D t < 0     0                                                                                           i f         C O U t + P s t t 1 + S t D t > 0    
where, PHB(t) is the power supply from the H2 burner at time t in kilowatts.
This H2 supply for the H2 burner comes from two sources: the excess power in the system that is more than the basic storage capacity, where this power is stored in the additional storage. And if the additional storage is empty, then the MG will have to buy H2 from an external supplier. The power from the additional storage is expressed in Equation (8), and the power from the external supplier is presented in Equation (9):
P H B - A S t = P A S t                                                                                                                         i f         P H B ( t ) > P A S t 1 P H B t                                                                                                                     i f         P H B t < P A S t 1 0                                                                                                                                 i f                     P A S t 1 < 0
where, PHB-AS(t) is the power supply from the H2 burner that comes from the additional storage at time t in kilowatts, and PAS is stored power in the additional storage at time t in kilowatts.
P H B - H S t = P H B ( t ) P H B - A S t
where, PHB-HS(t) is the power supply from the H2 burner that depends on burning H2 from H2 supplier at time t in kilowatts.

Power in Additional Storage

As previously mentioned, the power in additional storage is stored as H2 in tank. Equation (10) shows the power stored in this H2 tank, where the efficiency of converting the excess electricity into H2 using the electrolyzer is 60% [37].
P A S t = C O U t + P s t t 1 + S t D t S t c × S t e                                                                                                                                                                                                                                         i f           C O U t + P s t t 1 + S t D t > S t c 0                                                                                                         i f                 C O U t + P s t t 1 + S t D t < 0     0                                                                                                         i f         C O U t + P s t t 1 + S t D t < S t c      
where, PAS(t) is the power stored in the H2 at time t in kilowatts.

3.5.4. Hydrogen Burner and Diesel Generator

In the fourth scenario, if the power in the additional storage does not cover the demand, then a diesel generator will be used as backup generation in the MG system. Equation (11) shows the power needed from the diesel generator in kilowatts at time t.
P D G A H B t = P H B ( t ) P H B - A S t
where PDGAHB(t) is the power consumed from the diesel generator in case of shortage in the additional storage at time t in kilowatts.

3.6. Performance Measures

3.6.1. Supply Carbon Content

To evaluate the carbon emissions for the examined models, the total carbon content for supply was computed in kgCO2eq using Equation (12). The supply in the MG system originates from basic generation (solar and wind) and backup supply that alternate between the national grid, H2 burner, and diesel generator. All the values used for emission factors in kgCO2eq/kWh were indicated in Table 7 (references’ sources included). In Model 2 (collaborative MG), COU order updates include the nuclear emission factor since advanced grid contracting allows for reliance on nuclear energy instead of the conventional energy mix. Any supplementary electricity required from the grid is subject to the national grid emission factor due to its volatility. An electrolyzer used to produce hydrogen has an emission factor of essentially “zero” per kWh because the only emission produced is from the electricity source used to power it, meaning the emission factor is directly tied to the source of electricity used, not the electrolysis process itself. Therefore, the H2 burner factor emission in this paper was considered the same as the wind factor emission as it is the main source of H2 feed into the H2 tank.
S c c = i 5 t = 1 N e i × y i t
where, Scc is the Total carbon content of supply from different sources, kgCO2eq, Ty is the total power supply from all sources to the MG, kWh, N is the number of hours for the simulated period, ei is the emission factor for each source (i = 1 for solar, i = 2 for wind, i = 3 for COU, i = 4 for HB, i = 5 for DG) in kgCO2eq/kWh, and yi(t) is the supply from each source at time t, kWh.

3.6.2. Unplanned Orders and Its Volatility

The volatility of grid order updates is regarded as the primary performance metric for the analysed scenarios, as the principal objective of this study is to stabilise demand on the national grid. An essential distinction exists between unplanned volatility, which pertains to spot order updates to the grid, and planned volatility, which relates to COU order updates. This research identifies unplanned volatility as the most significant type of volatility, as it presents a management challenge at the grid level. Consequently, in the evaluation of performance for each scenario, unplanned volatility is computed to gauge the enhancement of the model in accordance with the model and the backup generation used for each model.
The volatility of the spot order updates for each scenario was measured by calculating the standard deviation for the spot order updates within the modelled time horizon as shown in Equation (13):
V S O U = t = 1 N ( S O U t S O U ¯ ) 2 N 1
where, VSOU is the volatility of the spot order updates in the MG system depending on the backup generation source, S O U ¯ is the mean of the spot order updates.

3.6.3. Exported Power to the Grid

The exported power from the MG to the national grid at each hour was calculated based on the power in storage at the previous hour, the power supply from the renewables source, the contracted power supply from the national grid, the demand at that hour and the storage capacity. The exported power to national grid at each hour is shown by the Equation (14):
P e x p t = C O U t + P s t t 1 + S t D t S t c                                                                                                                                                                                       i f         C O U t + P s t t 1 + S t D t > S t c 0                                                                               i f         C O U t + P s t t 1 + S ( t ) D ( t ) < S t c    
The total exported power to the national grid in each studied time horizon is equal the sum of the exported power at each hour within this time horizon as presented in Equation (15):
T P e x p = t = 1 t = N P e x p t
where Pexp is the exported power to the grid at each hour, TPexp is the total exported power to the grid within a time horizon.

4. Results

This section presents the previously described performance measures for the proposed models and their scenarios, considering the parameter used in this paper.

4.1. Models’ Parameters

For both MGs’ models, the following parameters shown in Table 8 are considered. The basic storage capacity of 1500 kWh is established based on the maximum quantity of excess power produced hourly during the 90-day period (starting from 22 March to 21 June).

4.2. Supply Carbon Content

The main purpose for considering four distinct backup generation scenarios, was to investigate the difference between the performance of the collaborative and selfish MG models for different scenarios. Demonstrating the effect of applying COU strategy on supply carbon content in the collaborative MG while using different solutions for backup generation.
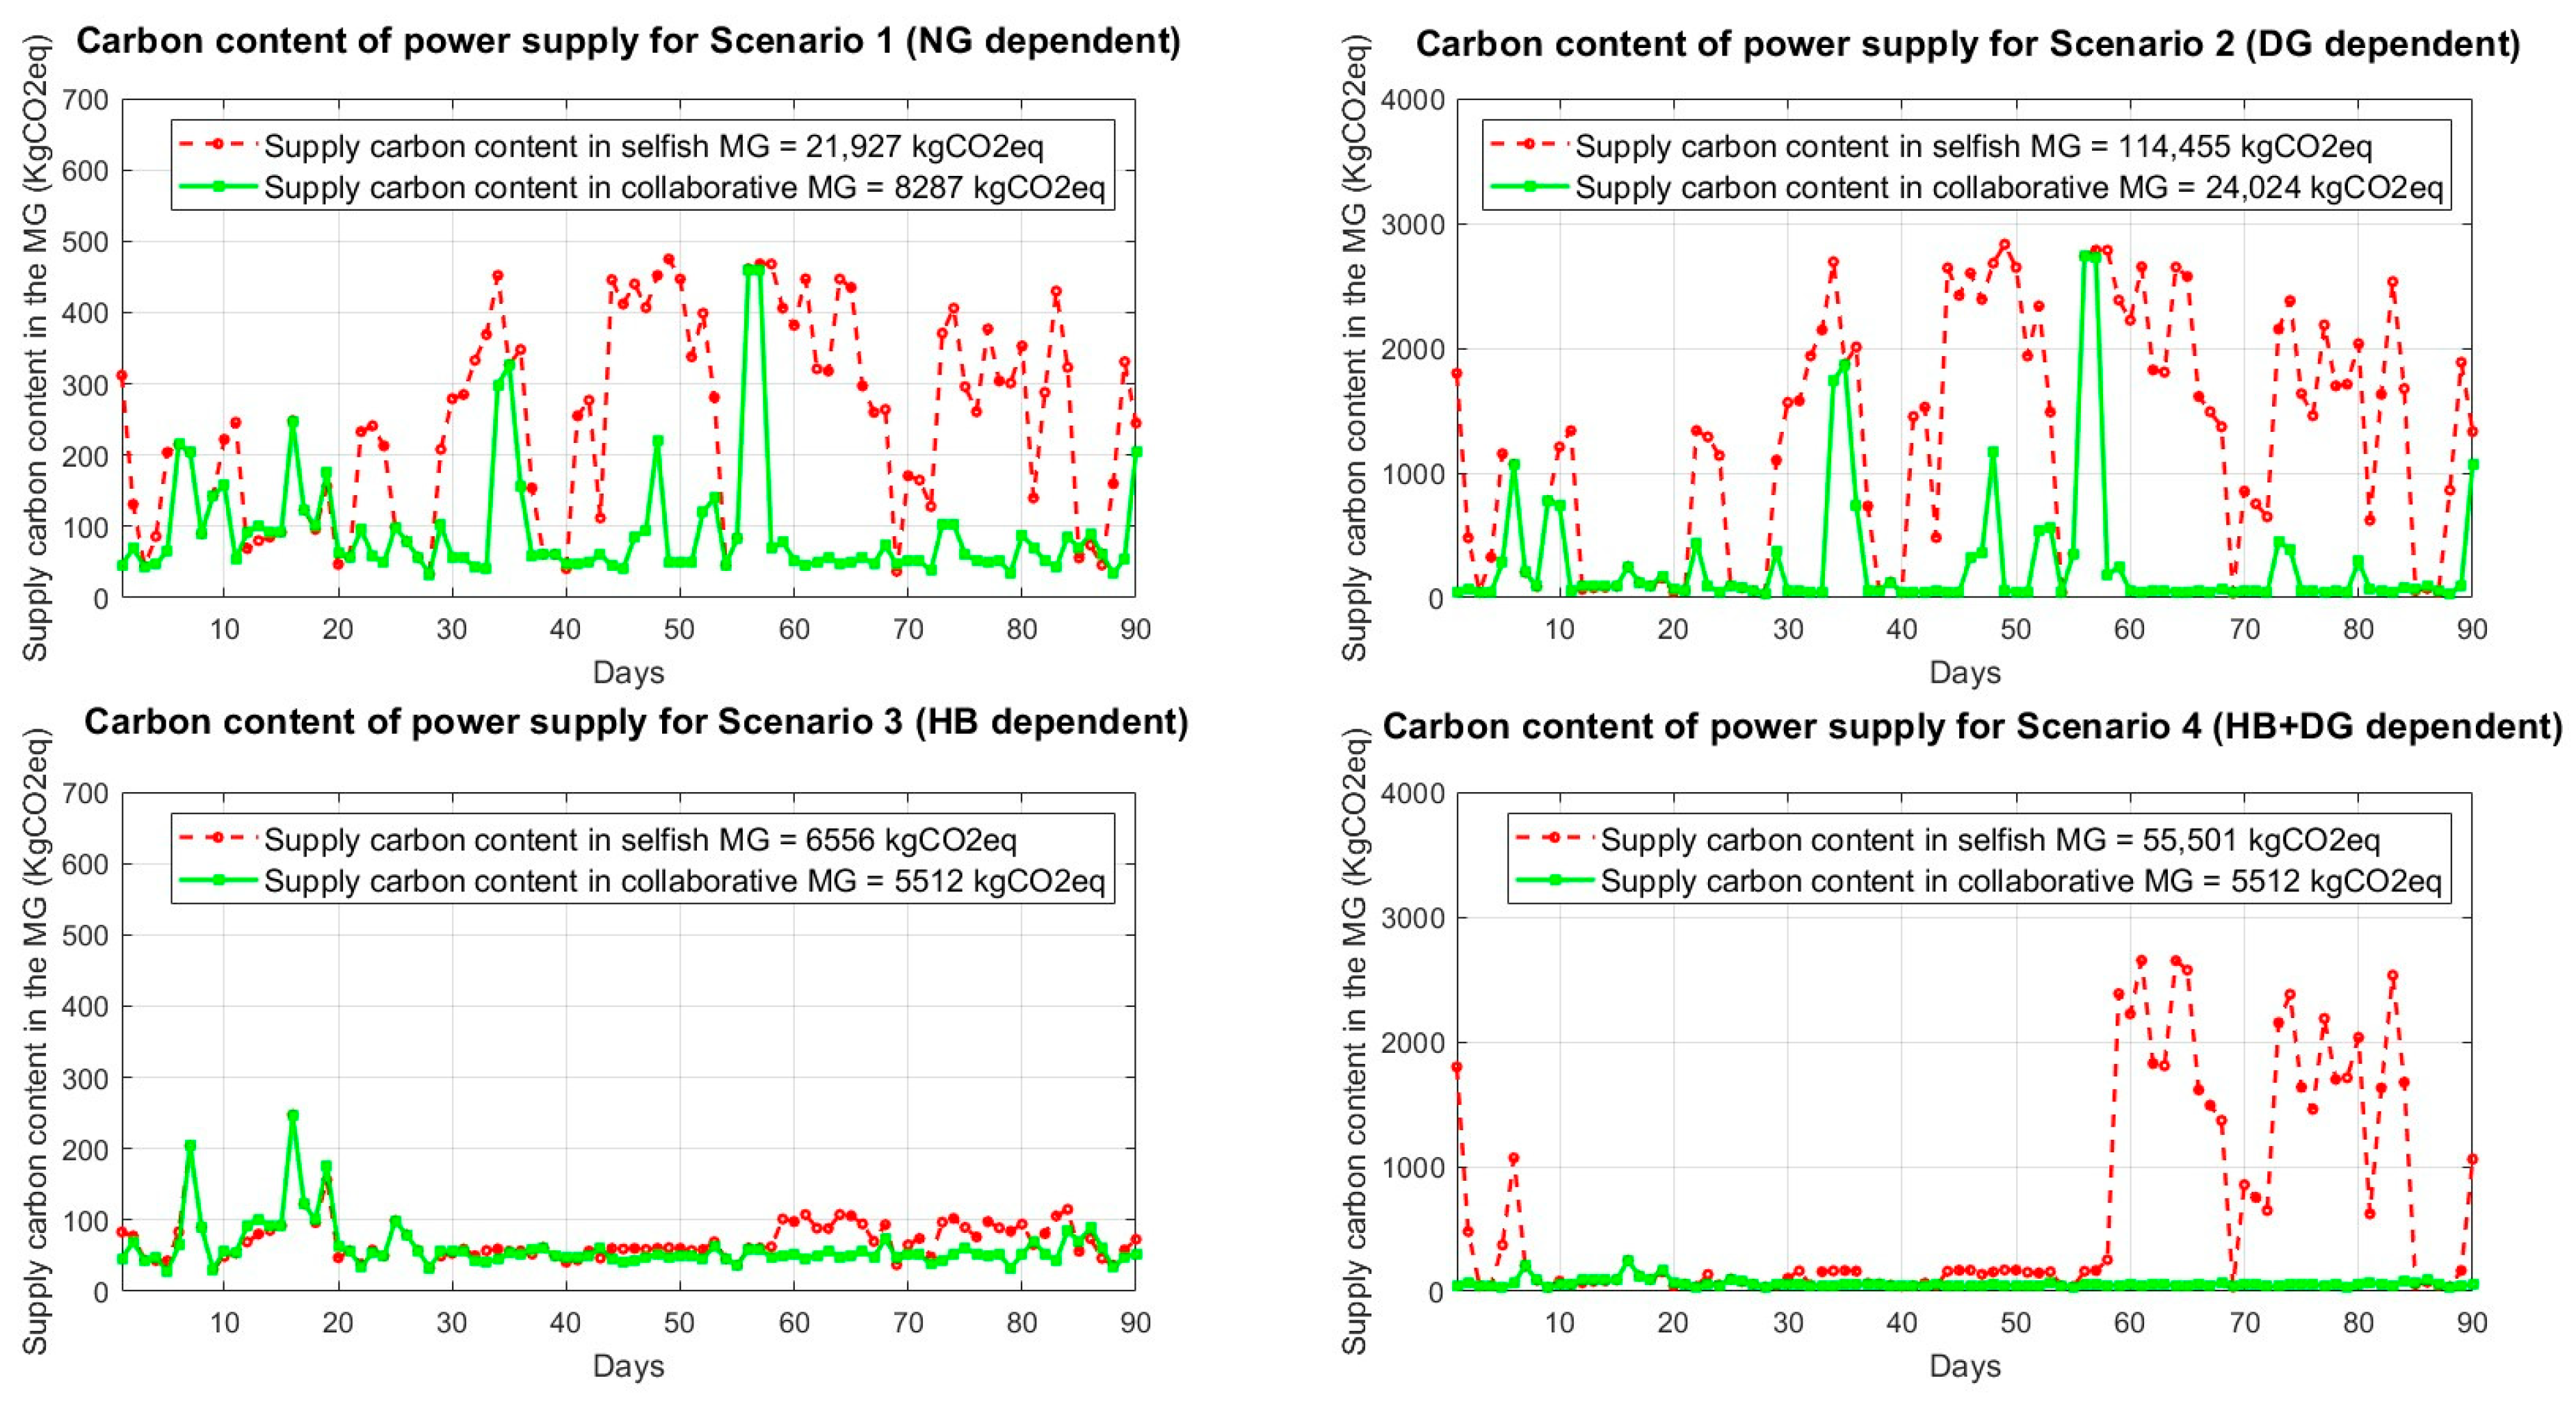
Figure 9 illustrates the carbon content of the power supply across the simulated time frame for both the selfish and collaborative MG models. Comparing the performance of the two models reveals that the carbon content across all examined scenarios is significantly lower for the collaborative MG than for the selfish MG model. Thus, the impact of the COU approach on carbon emissions inside the collaborative MG system is demonstrated. Sc.3, in which hydrogen is utilised for backup generation, exhibits a significant reduction in CO2 emissions across both MG models; however, the collaborative MG still has lower emissions. In Sc.4, where the diesel generator serves as a backup for additional storage shortages, the selfish MG exhibits significantly higher carbon emissions by 55,501 kgCO2eq compared to the collaborative MG, which has only 5512 kgCO2eq. In the collaborative MG, the system relies on the COU supply and does not need to draw power from the diesel generator, depending only on the energy from the H2 burner, unlike the selfish MG, which requires consumption from both the H2 burner and the diesel generator. Sc.2, which relies only on the diesel generator for backup production to offset an absence in renewable outputs, exhibits the highest carbon emissions among the four analysed scenarios.

4.3. Unplanned Orders and Its Volatility

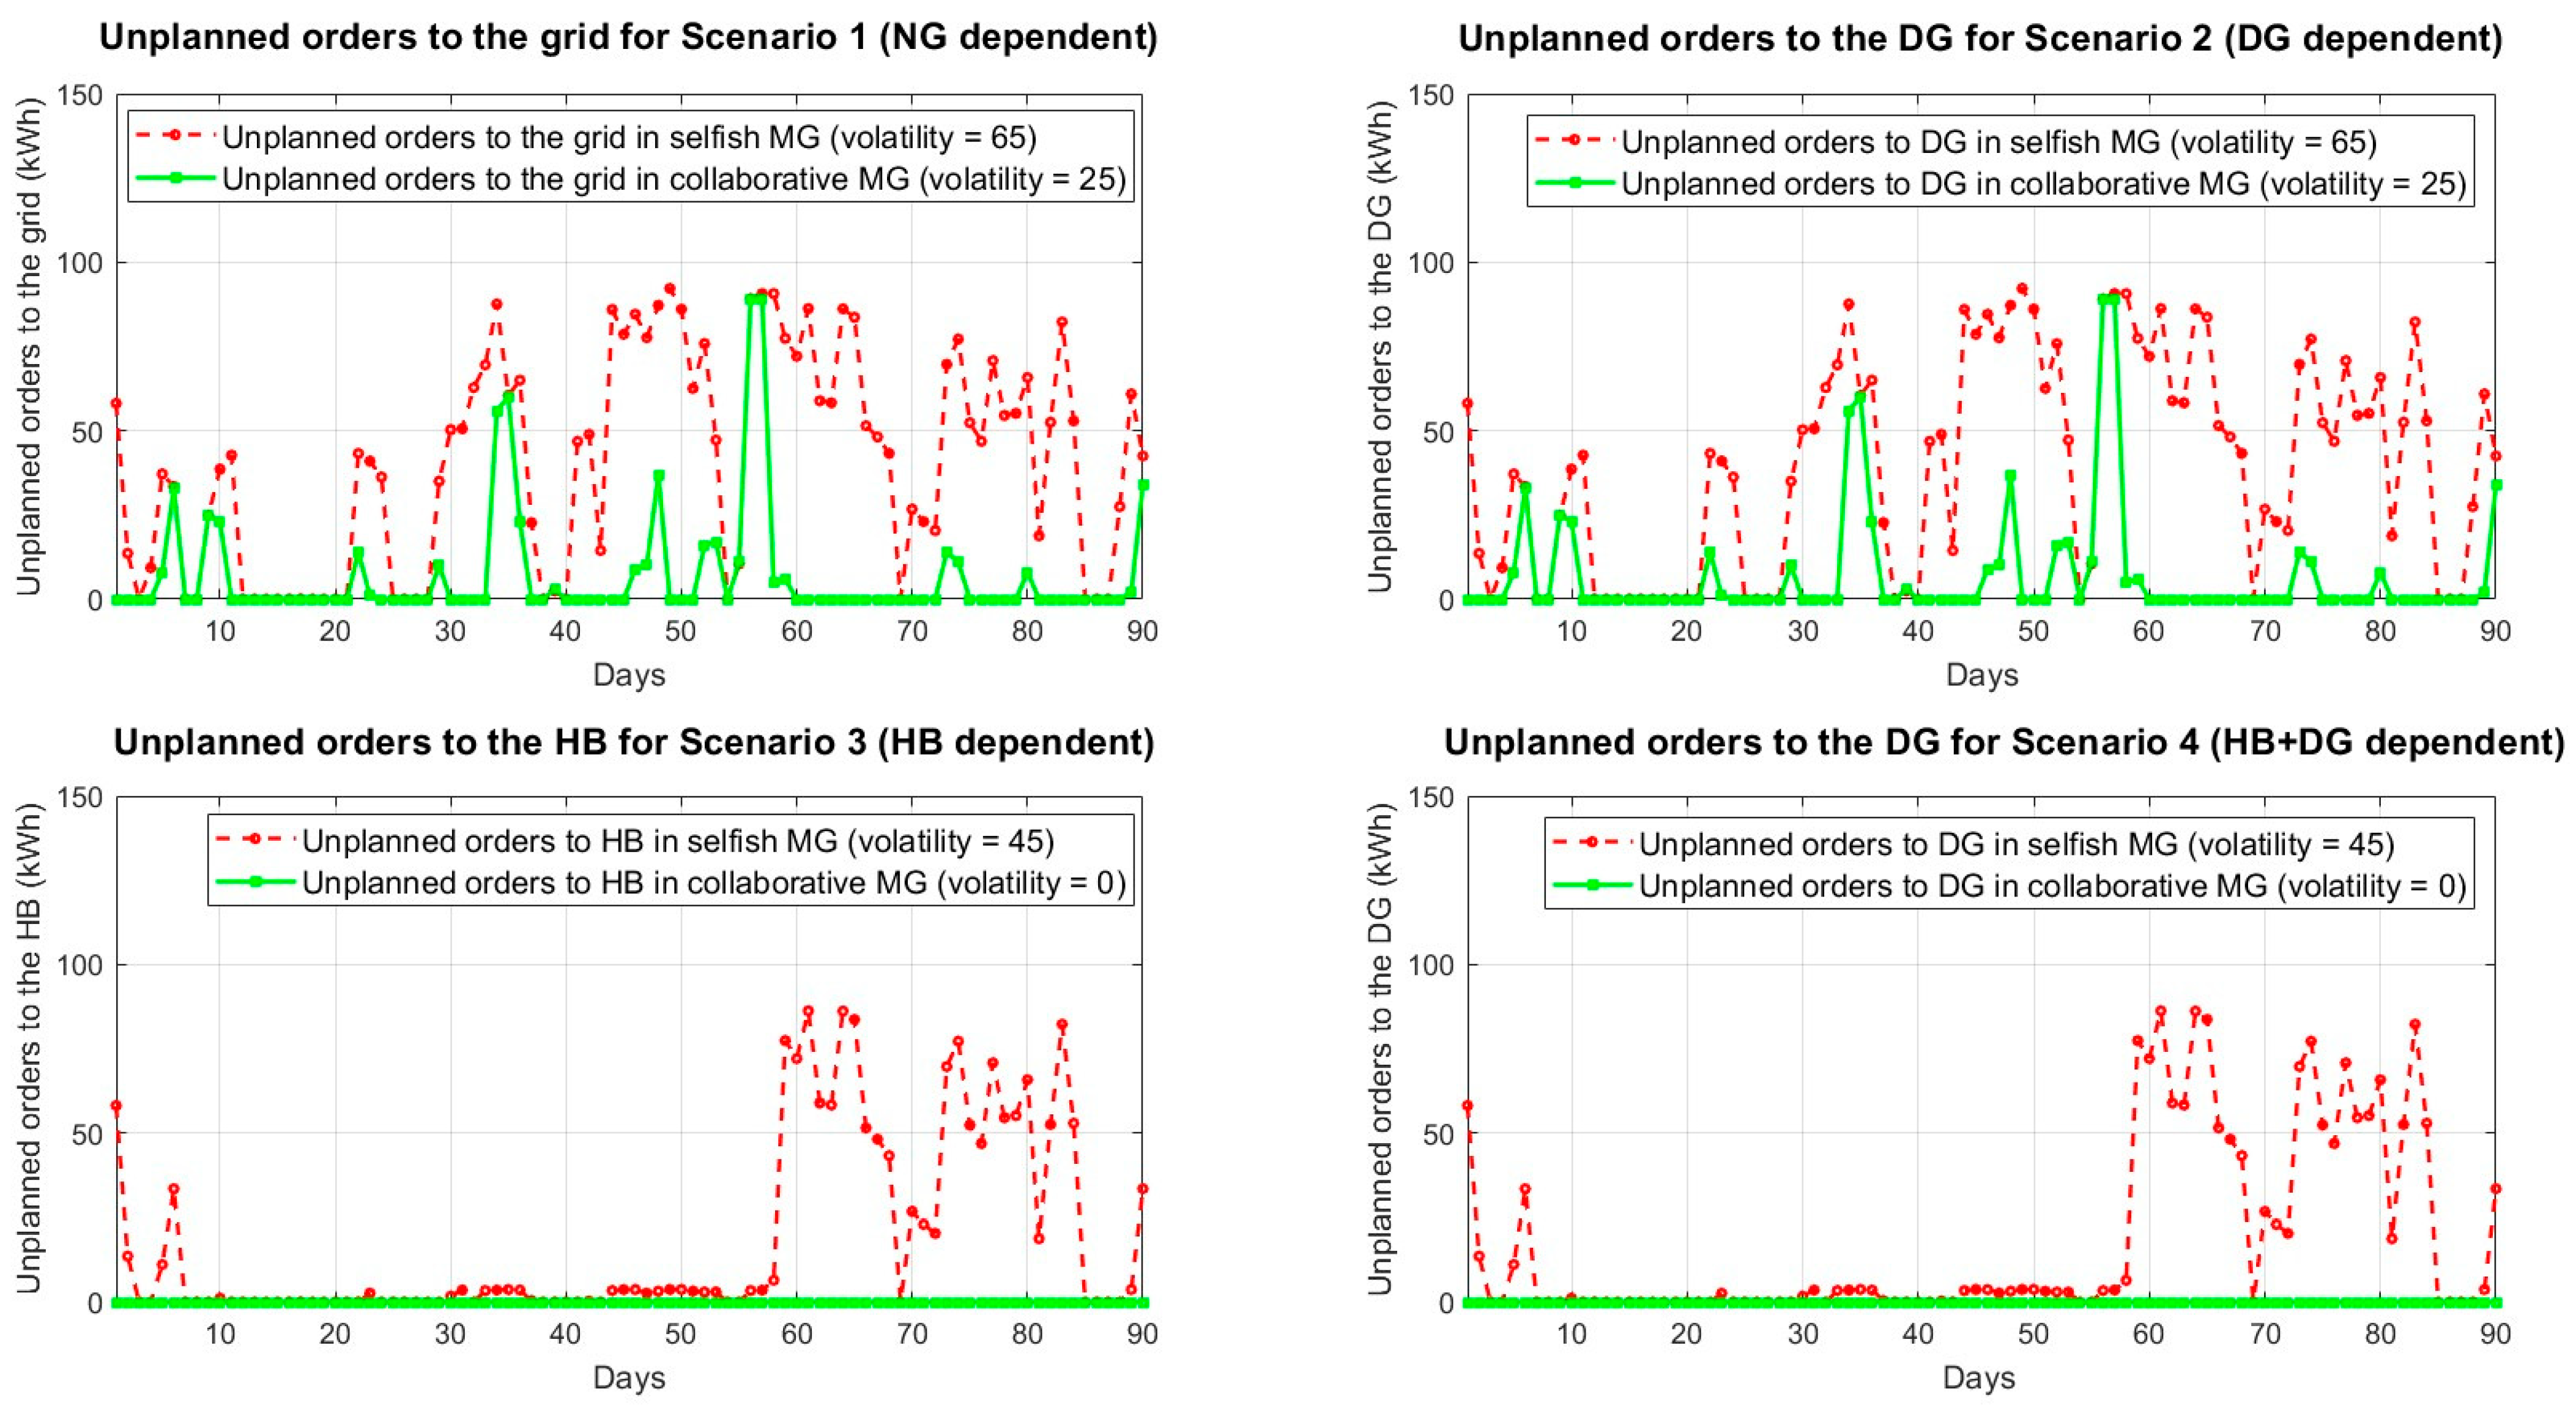
This subsection exhibits the effect of the collaborative grid order update strategy on the power demand from the national grid. A significant difference exists between the forward order updates transmitted to the grid, referred to in this paper as planned volatility, and the last-minute (spot) order updates that are unplanned and executed as required, termed as unplanned volatility. This article focusses on unplanned volatility due to its challenging regulation and potential damage to the grid. In presenting the daily average order updates, we highlighted the spot orders, which indicate unplanned volatility. Figure 10 shows the daily average of unplanned order updates across the simulated time frame for both the selfish and collaborative MG models, accounting for four backup options for each model. Depending on the scenario studied, the spot orders are assigned to different backup-generating sources. In Sc.1, spot orders are submitted to the national grid; in Sc.2, to the diesel generator; in Sc.3, to the hydrogen burner; and in Sc.4, again to the diesel generator. The consistency of orders is crucial for all power sources utilised in backup generation; hence, analysing the spot orders in each circumstance for both models is vital.
Comparing the two models reveals that the unplanned volatility of the spot order update markedly diminishes in the collaborative model across all examined scenarios. In Sc.1 for the selfish MG model, the system exhibits considerable volatility in spot orders to the grid; however, the collaborative model reduces this volatility by 61%, lowering from 65 to 25 for the collaborative MG. Demonstrating the impact of the COU approach on the stability of spot power demand from the national grid in Sc.1. Sc.2 illustrates significantly less volatility in the spot orders for the diesel generator inside the collaborative model, positively influencing the effective utilisation of the diesel generator by increasing fuel efficiency and reduce the operation cost [24]. Furthermore, scenarios 3 and 4 successfully attained zero spot orders for the H2 burner and the diesel generator inside the collaborative model, owing to the COU supply from the grid that satisfied the whole demand, along with the H2 burner.

4.4. Exported Power to the Grid

The COU strategy relies on purchasing electricity in advance from the national grid, hence enhancing the possibility for surplus power to be exported back to the national grid. This may be seen as a drawback of the COU strategy until a solution is devised, considering the different backup generation alternatives. This subsection illustrates the impact of including the H2 burner as a backup generator on the exported power inside the collaborative model.
The exported power to the national grid for both the selfish and collaborative MGs over the simulated duration is shown in Figure 11. In scenarios 1 and 2, both MG types export the same electricity to the national grid. Likewise, both MG types’ exported power is the same in scenarios 3 and 4. By absorbing the power exported in scenarios 1 and 2, the installation of an H2 burner and the additional storage, as demonstrated in scenarios 3 and 4, reduced the excess power within the MG system. Because of the additional storage in Sc.3, the exported power in the selfish system is zero. The additional storage also resulted in a 52% decrease in exported power within the collaborative system in scenarios 3 and 4. Additionally, this power is not in the form of electricity; rather, it is held in the H2 tank (additional storage) as hydrogen, indicating that it is not obligatory to export it to the grid as in scenarios 1 and 2, but it may be kept and utilised subsequently.

5. Discussion

In the introduction, we suggested utilising a supply chain approach to tackle the challenge of intermittent renewable energy by enhancing the balancing mechanism between MGs and the national grid, promoting collaboration beyond just MG self-interest. This section evaluates the extent to which the outcomes derived from the COU strategy are beneficial at both the MG and national grid levels. Multiple backup generation possibilities have been examined for both selfish and collaborative MG models. The major objective was to mitigate unplanned order volatility to the main grid in order to diminish carbon emissions within the system and the exported power to the grid. The paper makes significant contributions to the literature by overcoming the surplus power constraints delineated by Sato et al. [3]. This indicates a genuine necessity for further investigation into collaborative MGs, hence returning to debate on the significance of MGs in future energy systems. Rather than depending on MGs in distant regions and limited applications, it possesses the potential to play a significant role in future energy systems (e.g., may considered as a transitional step towards decentralised energy systems).
The preceding section illustrated the performance across all examined scenarios. The effectiveness of a collaborative strategy in mitigating unplanned volatility from ordering a COU (planned orders) is demonstrated, in contrast to the selfish model absent of planned orders. The Heijunka concept was implemented in model 2 (the collaborative MG), which showed steady unplanned orders with reduced volatility in comparison to the selfish model. This indicates that it attained Heijunka for the unplanned orders, hence alleviating the unplanned volatility that complicates grid management. For instance, if the system experienced this fluctuating demand and sent it to the grid week in advance, the utility grid would fulfil this demand by utilising clean, sustainable energy sources such as nuclear power. Conversely, when the grid encounters fluctuating demand within the next minute, it addresses that volatility by the use of responsive, unsustainable energy sources such as natural gas. The same concept may be applied to conventional supply chains; retailers, transportation services, and all supply chain nodes prepare for the anticipated fluctuating demand on Black Friday to ensure that client demands are met despite fluctuations. The primary challenge in managing volatility lies in its unpredictable and unforeseen characteristics. However, alleviating its surprising characteristics allows for the maintenance of the erratic demand with planned volatility to achieve stable unplanned demand with low volatility.
It is essential to distinguish our contribution from the current integrated MG energy management literature. This literature aims to address challenges associated with microgrid and solar power generation by presenting an ex-post solution to concerns stemming from intermittency. We contend that our collaborative MG method, based on Heijunka, alleviates the intensity of these problems at the outset, advocating for a proactive approach. Our assertion is that our methodology diminishes the prevalence of inadequate power quality while it cannot entirely eradicate it. As our collaborative MG stabilises and regulates power demand, there are fewer problems in the network, resulting in a less necessity for self-healing management. In current research on flexible integrated MGs, MGs serve as both a contributing factor to the problem and a potential solution. In our research, its contribution to the problem is reduced while preserving the potential of MG to serve as a vital element, offering self-healing and intelligent functionalities.
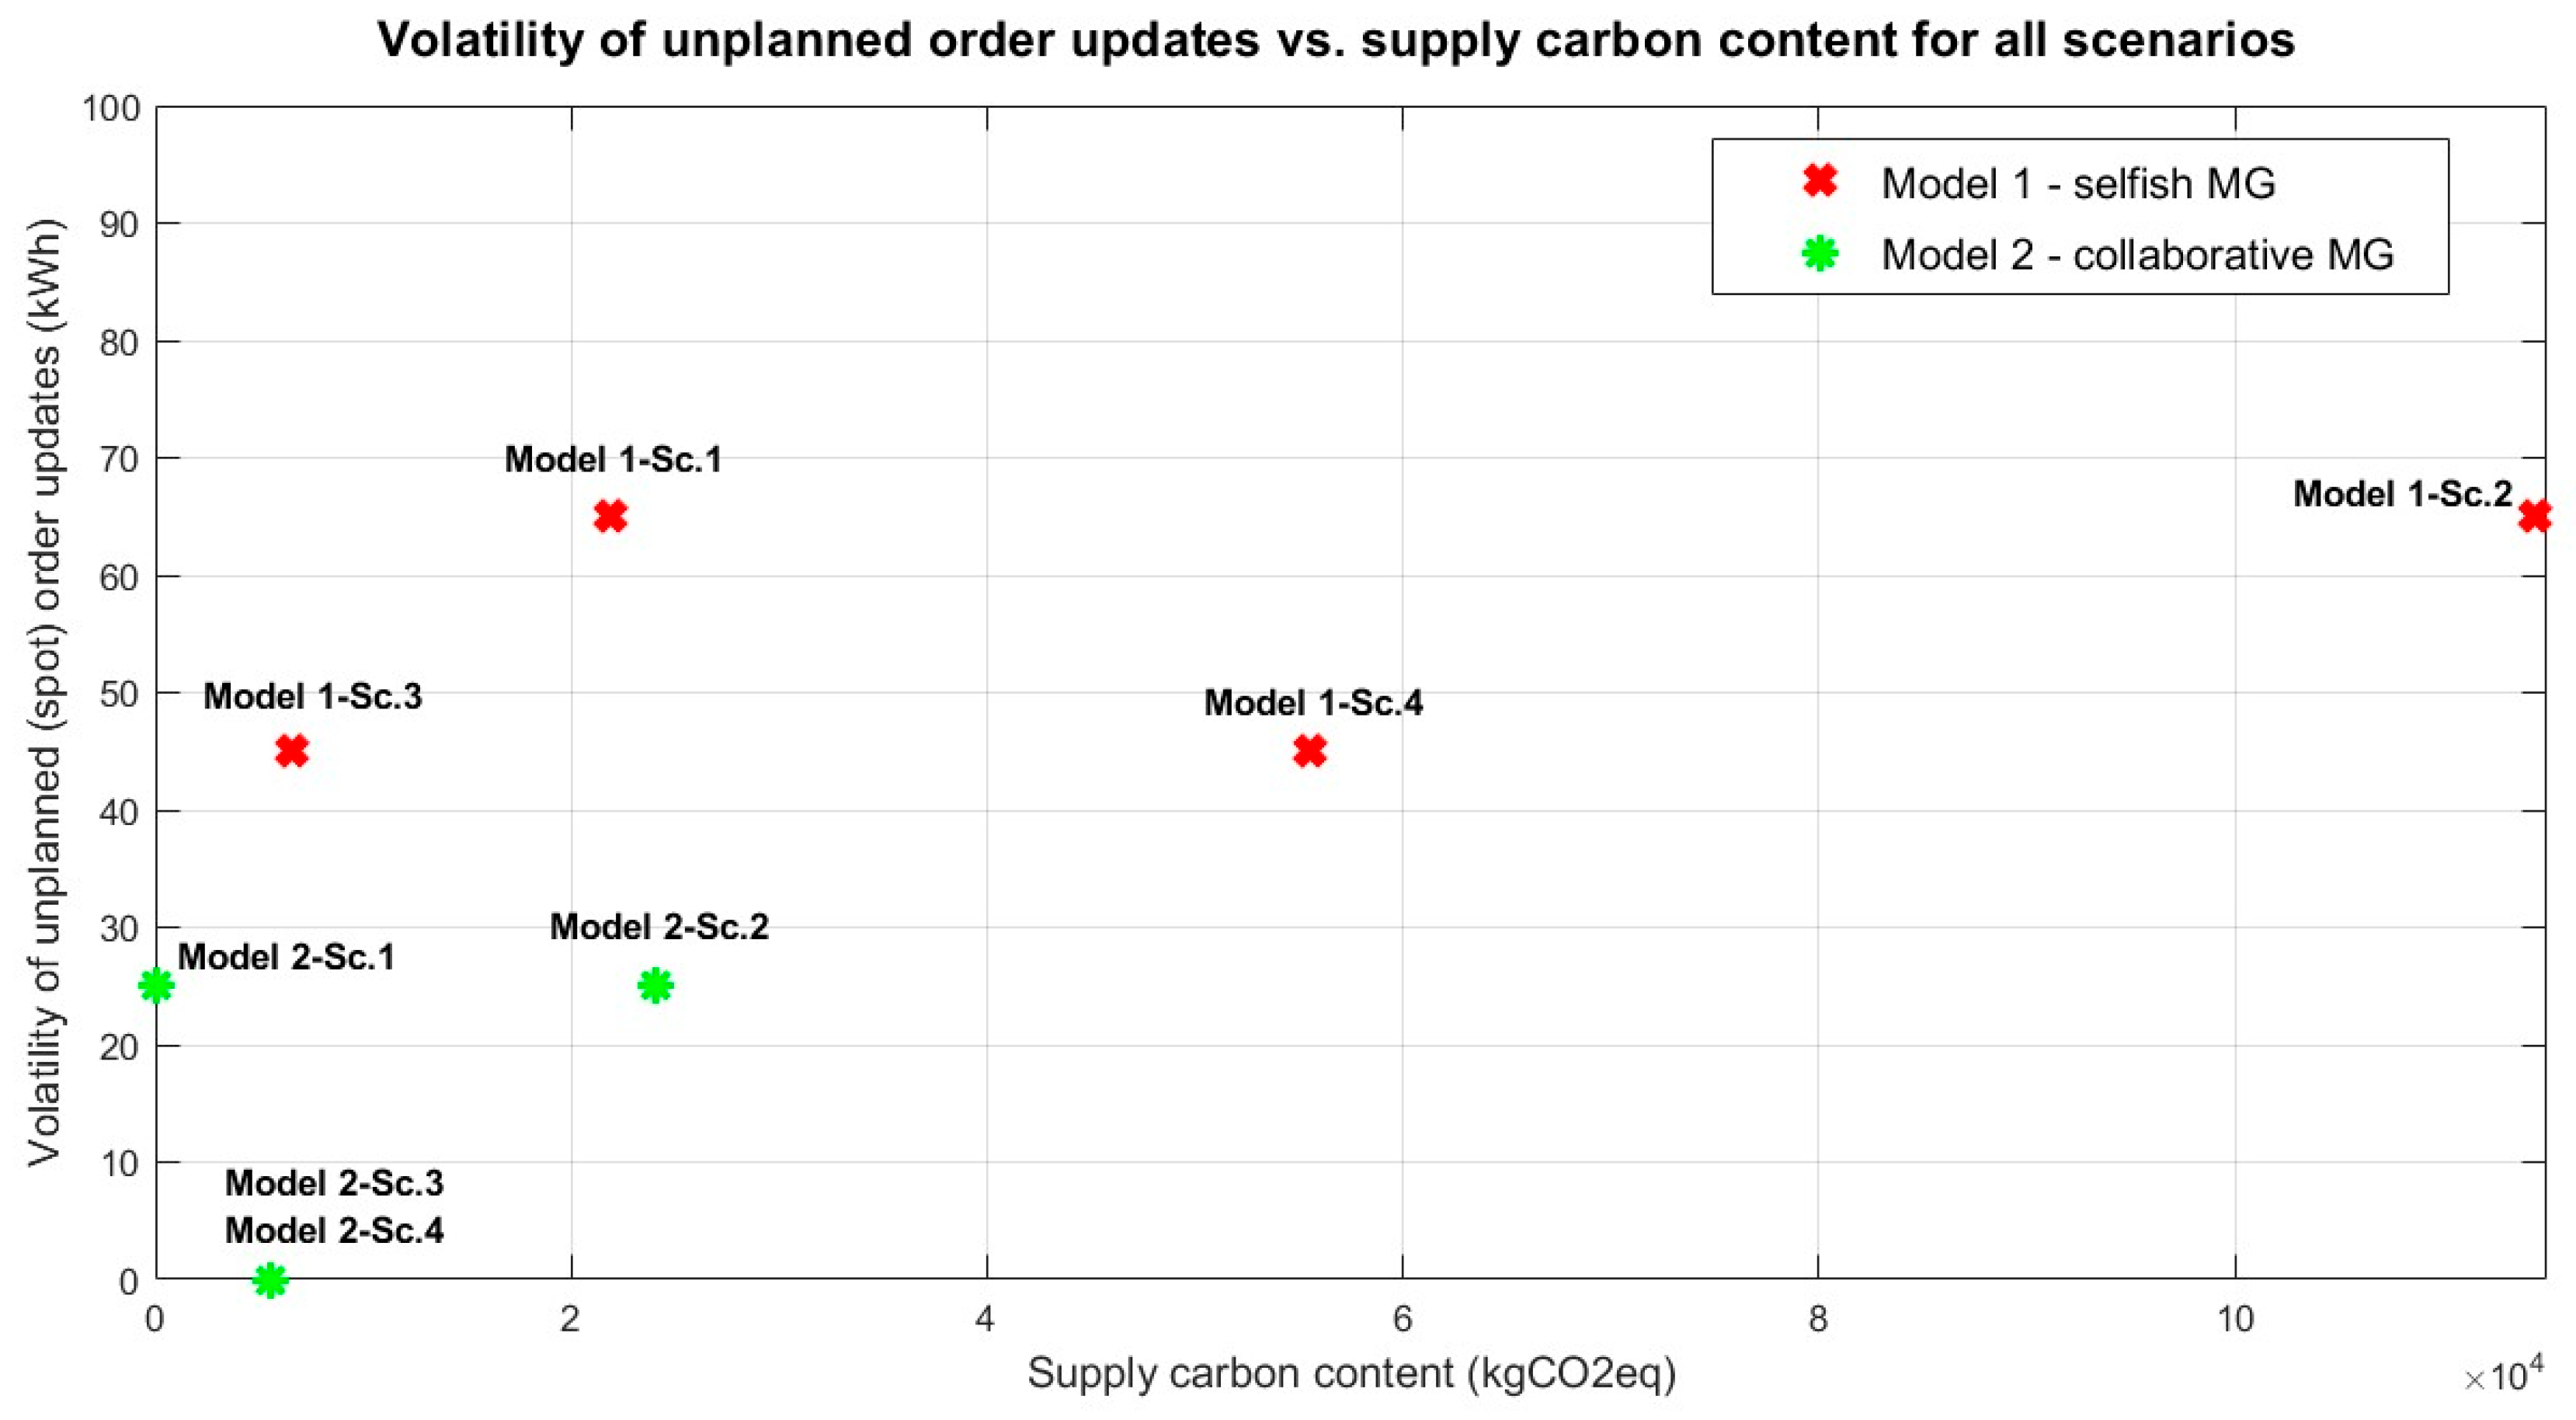
Figure 12 depicts the performance of the two models (selfish and collaborative MG systems) regarding the volatility of unplanned (spot) orders and the carbon intensity of supply across the four backup generation scenarios. The graphic illustrates that the suggested COU strategy has shifted the collaborative MGs towards less unplanned order volatility and diminished carbon emissions in the power supply. The selfish MG, especially in Sc.2, exhibits the greatest degree of unplanned volatility of orders and supply carbon content. Although Sc.3 exhibits superior performance for carbon emissions, it also achieves significantly enhanced performance in order volatility within the collaborative MG compared to the selfish model. Furthermore, it has been shown that the models in scenarios 3 and 4 consistently transition into more advantageous situations because of utilising the H2 burner and the additional storage. This shows that the additional storage is the key to improving the performance of the MG system, as the MG now belongs to two distinct supply chains: a power supply chain and a stored hydrogen supply chain. The MG, as a member of a stored hydrogen supply chain, is not only capable of sourcing hydrogen when the storage is empty, but it can also export excess power as hydrogen.
The application of the COU strategy to electric grid management has practical implications, particularly when multiple collaborative MGs are installed. The implementation of multiple MGs would mitigate the volatility experienced by the utility grid and necessitate a comprehensive re-evaluation of the fuel source portfolio, as the required ratio of responsive (e.g., natural gas) compared to slow (e.g., nuclear) response energy sources would be changed. Extrapolating this concept to the entire node implies that even non-producing end nodes, such as residences, have to include local storage to ensure a steadier and more balanced load at the national level. In other terms, MGs enhance base load generation while reducing peak loads.
This, however, raises a challenge for large wind and solar farms. Their output is neither steady nor consistent. Geographical diversification may facilitate the exploration of complementarity between wind and solar energy, as well as among wind resources in various places. This indicates that renewable assets can contribute to baseload power to some extent. The excess energy, frequently curtailed, may be stored as hydrogen, which may be exported via a conventional secondary supply chain, serving as a backup for the primary electrical supply chain.
The findings may also have implications for policies. Rather than implementing a singular policy applicable to all types of MGs, distinct policies might be established for each MG type [22]. For instance, providing Feed-in Tariffs at competitive rates for collaborative MGs as an incentive [43] might alleviate the issue of excessive power export in situations characterised by high power export to the grid, attributable to the absence of additional hydrogen storage. Current energy policies do not view MGs as key players in future energy systems, and large investments are being made to address the problem of increasing volatility at the utility grid level. The sufficiency and feasibility of these expenditures remain uncertain, as the issue of long periods with no wind and no sun remains an intractable problem at a national scale. Through this paper, we want to engage scholars and policymakers on a potential opportunity. Our key recommendation to policymakers would be to test the strategy delineated in this paper in real life.
The collaborative MG employing the COU strategy is anticipated to incur higher costs because of its greater dependence on storage. Nonetheless, the issue of cost is not clear, as volatility affects the upper echelons of the utility grids. The expense of incorporating renewable energy sources and resolving power quality concerns can amount to billions of pounds. Further research work is needed to analyse the volatility of grid orders and exported electricity as power quality concerns with associated costs.
The findings demonstrate that the principal objective has been achieved. The collaborative MG model has exhibited effective performance in mitigating the unplanned volatility of orders directed to the national grid. The constraint identified in previous literature [3,28] regarding the increase of energy exports to the grid has been addressed by repurposing the surplus power inside the system as backup generation via the H2 burner. The entire carbon footprint of the system is significantly reduced than that of the selfish MG system. These findings showcased that the collaborative MGs are the future for a cleaner and more resilient energy future.

Author Contributions

Conceptualization, H.F. and M.L.; methodology, H.F., M.L. and J.R., software, H.F.; writing—original draft preparation, H.F.; writing—review and editing, M.L.; reviewing and further modifications, J.R. All authors have read and agreed to the published version of the manuscript.

Funding

This research received no external funding.

Data Availability Statement

The original contributions presented in this study are included in the article. Further inquiries can be directed to the corresponding author.

Conflicts of Interest

The authors declare no conflicts of interest.

Abbreviations

The following abbreviations are used in this manuscript:
MGMicrogrid
TTime (The UK standard time)
D(t)The aggregate demand for the interconnected households at time t
d(t)The power demand for each household
NhThe total number of households
S(t)The power supply from wind turbine and PV panels at time t
Ppv(t)The theoretical power output from PV at time t
Pw(t)The power output from wind turbine at time t, kilowatts
CpMaximum power coefficient (theoretical maximum = 0.59)
ΡAir density, 0.08 lb/ft3
ARotor swept area, ft2
V(t)Wind speed at time t, mph
K0.000133, a constant to yield power in kilowatts.
I(t)The irradiance at time t, Wh/m2
AThe total panel area (area of one panel *Np)
ηNominal efficiency for the panel
Pst(t)The power in storage system at time t, kilowatts
COU(t)Precontracted grid order update at time t
Pst (t − 1)The power in storage system at the previous hour, kilowatts
S(t)The power supply from wind turbine and PV panels at time t
StcStorage capacity, kilowatts
SteStorage system efficiency
PDGAHB(t)Power from diesel generator after power from H2 burner at time t, kilowatts
PHB(t)Power from H2 burner at time t, kilowatts
PDG(t)Power from diesel generator at time t, kilowatts
PHB-AS(t)Power from H2 burner based on additional storage at time t, kilowatts
PHB-HS(t)Power from H2 burner based on H2 supply at time t, kilowatts
PAS(t)Power in the additional storage at time t, kilowatts
NNumber of hours within the modelled time horizon (T)
Pexp(t)The exported power to the grid at each hour.
TPexpThe total exported power to the grid within a time horizon.
VSOUThe volatility of spot order updates
S O U ¯ The mean of spot order updates
SccTotal carbon content of supply from different sources, kgCO2eq
TyTotal power supply from all sources to the MG, kWh
eiEmission factor for each source, kgCO2eq/kWh
yi(t)Supply from each source at time t, kWh

References

  1. Gudde, P.; Oakes, J.; Cochrane, P.; Caldwell, N.; Bury, N. The Role of UK Local Government in Delivering on Net Zero Carbon Commitments: You’ve Declared a Climate Emergency, so What’s the Plan? Energy Policy 2021, 154, 112245. [Google Scholar] [CrossRef]
  2. Che, E.E.; Abeng, K.R.; Iweh, C.D.; Tsekouras, G.J.; Fopah-Lele, A. The Impact of Integrating Variable Renewable Energy Sources into Grid-Connected Power Systems: Challenges, Mitigation Strategies, and Prospects. Energies 2025, 18, 689. [Google Scholar] [CrossRef]
  3. Sato, T.; Murata, K.; Katayama, H. On Stability of Supply Performance by Work-in-Progress Management: A Case Analysis of Photovoltaics-Based Electricity Supply System with Storage Batteries. Procedia Manuf. 2017, 11, 1077–1084. [Google Scholar] [CrossRef]
  4. Feleafel, H.; Radulovic, J.; Leseure, M. Should We Have Selfish Microgrids? Energies 2024, 17, 3969. [Google Scholar] [CrossRef]
  5. Shahzad, S.; Jasińska, E. Renewable Revolution: A Review of Strategic Flexibility in Future Power Systems. Sustainability 2024, 16, 5454. [Google Scholar] [CrossRef]
  6. Danley, D.R. Defining a Microgrid Using IEEE 2030.7. In Business & Technology; National Rural Electric Cooperative Association: Arlington, VA, USA, 2019. [Google Scholar]
  7. Yakimenko, O.A. Efficiency, Reliability, and Resilience of Diesel Generator Based Isolated Microgrids. In Proceedings of the 2024 IEEE 18th International Conference on Control & Automation (ICCA) 2024, Reykjavík, Iceland, 18–21 June 2024; pp. 288–293. [Google Scholar] [CrossRef]
  8. Belboul, Z.; Toual, B.; Bensalem, A.; Ghenai, C.; Khan, B.; Kamel, S. Techno-Economic Optimization for Isolated Hybrid PV/Wind/Battery/Diesel Generator Microgrid Using Improved Salp Swarm Algorithm. Sci. Rep. 2024, 14, 2920. [Google Scholar] [CrossRef]
  9. Tariq, A.H.; Kazmi, S.A.A.; Hassan, M.; Ali, M.S.; Anwar, M. Analysis of Fuel Cell Integration with Hybrid Microgrid Systems for Clean Energy: A Comparative Review. Int. J. Hydrogen Energy 2023, 52, 1005–1034. [Google Scholar] [CrossRef]
  10. Mewafy, A.; Ismael, I.; Kaddah, S.S.; Hu, W.; Chen, Z.; Abulanwar, S. Optimal Design of Multiuse Hybrid Microgrids Power by Green Hydrogen–Ammonia. Renew. Sustain. Energy Rev. 2023, 192, 114174. [Google Scholar] [CrossRef]
  11. Jafarizadeh, H.; Yamini, E.; Zolfaghari, S.M.; Esmaeilion, F.; Assad, M.E.H.; Soltani, M. Navigating Challenges in Large-Scale Renewable Energy Storage: Barriers, Solutions, and Innovations. Energy Rep. 2024, 12, 2179–2192. [Google Scholar] [CrossRef]
  12. Levina, A.; Davydova, O.; Kalyazina, S. No “One-Size-Fits-All” Solution for Energy Transition: Five Countries Scenario Analysis. World-Syst. Evol. Glob. Futures 2024, 2 Pt F3951, 65–88. [Google Scholar] [CrossRef]
  13. Venizelou, V.; Poullikkas, A. Trend Analysis of Cross-Border Electricity Trading in Pan-European Network. Energies 2024, 17, 5318. [Google Scholar] [CrossRef]
  14. Ma, N.; Zhao, W.; Wang, W.; Li, X.; Zhou, H. Large Scale of Green Hydrogen Storage: Opportunities and Challenges. Int. J. Hydrogen Energy 2023, 50, 379–396. [Google Scholar] [CrossRef]
  15. Constantin, A. Nuclear Hydrogen Projects to Support Clean Energy Transition: Updates on International Initiatives and IAEA Activities. Int. J. Hydrogen Energy 2024, 54, 768–779. [Google Scholar] [CrossRef]
  16. Europe’s Largest Battery Creates a Buzz in Bedfordshire-Power Technology. Available online: https://www.power-technology.com/features/featureeuropes-largest-battery-creates-a-buzz-in-bedfordshire-4563310/ (accessed on 25 February 2025).
  17. Babayomi, O.O.; Olubayo, B.; Denwigwe, I.H.; Somefun, T.E.; Adedoja, O.S.; Somefun, C.T.; Olukayode, K.; Attah, A. A Review of Renewable Off-Grid Mini-Grids in Sub-Saharan Africa. Front. Energy Res. 2023, 10, 1089025. [Google Scholar] [CrossRef]
  18. Pappas, D.; Braunholtz-Speight, T.; Hannon, M.; Webb, J.; González, F.F.; Sharmina, M. Business Models for Smart Local Energy Systems—A Triple Layered Perspective. Front. Sustain. Energy Policy 2023, 1, 1058534. [Google Scholar] [CrossRef]
  19. Nikmehr, N.; Najafi-Ravadanegh, S. Optimal Operation of Distributed Generations in Micro-Grids under Uncertainties in Load and Renewable Power Generation Using Heuristic Algorithm. IET Renew. Power Gener. 2015, 9, 982–990. [Google Scholar] [CrossRef]
  20. Ma, G.; Li, J.; Zhang, X.P. Energy Storage Capacity Optimization for Improving the Autonomy of Grid-Connected Microgrid. IEEE Trans. Smart Grid 2023, 14, 2921–2933. [Google Scholar] [CrossRef]
  21. Abdulkarim, A.; Gladwin, D.T. A Sensitivity Analysis on Power to Energy Ratios for Energy Storage Systems Providing Both Dynamic Firm and Dynamic Containment Frequency Response Services in the UK. In Proceedings of the IECON 2021–47th Annual Conference of the IEEE Industrial Electronics Society, Toronto, ON, Canada, 13–16 October 2021. [Google Scholar] [CrossRef]
  22. Feleafel, H.; Leseure, M. Feed-in Tariff Policy for Microgrids: Past and Future a Case Study of the Option Value of Complementary Energy Assets in Turbulent Conditions. Int. J. Energy Sect. Manag. 2025. ahead-of-print. [Google Scholar] [CrossRef]
  23. Manandhar, U.; Zhang, X.; Beng, G.H.; Subramanian, L.; Lu, H.H.C.; Fernando, T. Enhanced Energy Management System for Isolated Microgrid with Diesel Generators, Renewable Generation, and Energy Storages. Appl. Energy 2023, 350, 121624. [Google Scholar] [CrossRef]
  24. Martinez-Bolanos, J.R.; Manito, A.R.A.; Almeida, M.P.; Almeida, J.C.; Torres, P.F.; Pinho, J.T.; Zilles, R. Improved Dynamic Model of Small Stand-Alone Diesel Generators to Assess the Stability of Autonomous Microgrids. AIP Adv. 2025, 15, 25118. [Google Scholar] [CrossRef]
  25. Singh, B.; Pathak, G.; Panigrahi, B.K. Seamless Transfer of Renewable-Based Microgrid Between Utility Grid and Diesel Generator. IEEE Trans. Power Electron. 2017, 33, 8427–8437. [Google Scholar] [CrossRef]
  26. Sanni, S.O.; Oricha, J.Y.; Oyewole, T.O.; Bawonda, F.I. Analysis of Backup Power Supply for Unreliable Grid Using Hybrid Solar PV/Diesel/Biogas System. Energy 2021, 227, 120506. [Google Scholar] [CrossRef]
  27. Cavalcanti, M.H.C.; Pappalardo, J.R.; Barbosa, L.T.; Brasileiro, P.P.F.; Roque, B.A.C.; Silva, N.M.P. da R. Hydrogen in Burners: Economic and Environmental Implications. Processes 2024, 12, 2434. [Google Scholar]
  28. Faraji, J.; Babaei, M.; Bayati, N.; Hejazi, M.A. A Comparative Study between Traditional Backup Generator Systems and Renewable Energy Based Microgrids for Power Resilience Enhancement of a Local Clinic. Electronics 2019, 8, 1485. [Google Scholar] [CrossRef]
  29. Mutluri, R.B.; Saxena, D.; Sumitkumar, R. Knowledge-Based Coordinated Management of Hydrogen-Based Networked Microgrids with Hydrogen Vehicle Fueling Station. In Proceedings of the 2024 IEEE 4th International Conference on Sustainable Energy and Future Electric Transportation, SEFET, Hyderabad, India, 31 July–3 August 2024. [Google Scholar] [CrossRef]
  30. Salih, S.M.; Taha, M.Q.; Alawsaj, M.K. Performance Analysis of Wind Turbine Systems under Different Parameters Effect INTERNATIONAL JOURNAL OF ENERGY AND ENVIRONMENT Performance Analysis of Wind Turbine Systems under Different Parameters Effect. Int. J. Energy Environ. 2012, 3, 895–904. [Google Scholar]
  31. How To Calculate Power Output Of Wind | Windpower Engineering. Available online: https://www.windpowerengineering.com/calculate-wind-power-output/ (accessed on 6 August 2024).
  32. BONUS 450-B600/37-Wind Turbines Sale • MWPS Wind Turbines. Available online: https://www.mwps.co.uk/product/used-wind-turbines-offered/175kw-500kw-wind-turbines/bonus-450-wind-turbines-sale/ (accessed on 30 July 2024).
  33. Yano, A.; Furue, A.; Kadowaki, M.; Tanaka, T.; Hiraki, E.; Miyamoto, M.; Ishizu, F.; Noda, S. Electrical Energy Generated by Photovoltaic Modules Mounted inside the Roof of a North–South Oriented Greenhouse. Biosyst. Eng. 2009, 103, 228–238. [Google Scholar] [CrossRef]
  34. 320 Watt Monocrystalline Solar Panel | Renogy Solar. Available online: https://www.renogy.com/320-watt-monocrystalline-solar-panel/ (accessed on 22 July 2024).
  35. Wind, Waves & Weather Forecast Southampton Port-Windfinder. Available online: https://www.windfinder.com/forecast/southampton_port (accessed on 17 April 2022).
  36. Global Solar Atlas. Available online: https://globalsolaratlas.info/map?c=11.523088,8.173828,3 (accessed on 3 October 2024).
  37. Akyüz, E.S.; Telli, E.; Farsak, M. Hydrogen Generation Electrolyzers: Paving the Way for Sustainable Energy. Int. J. Hydrogen Energy 2024, 81, 1338–1362. [Google Scholar] [CrossRef]
  38. What Is the Carbon Footprint of Solar Panels? | Solar.Com. Available online: https://www.solar.com/learn/what-is-the-carbon-footprint-of-solar-panels/ (accessed on 6 October 2024).
  39. Thomson, C.; Harrison, G.P. Life Cycle Costs and Carbon Emissions of Wind Power Executive Summary; ClimateXChange: Edinburgh, Scotland, 2023. [Google Scholar]
  40. Carbon Dioxide Emissions From Electricity-World Nuclear Association. Available online: https://world-nuclear.org/information-library/energy-and-the-environment/carbon-dioxide-emissions-from-electricity (accessed on 6 October 2024).
  41. National Grid Carbon Intensity Archive-Electricity Info. Available online: https://electricityinfo.org/carbon-intensity-archive/#data (accessed on 6 October 2024).
  42. New 2024 UK Grid Emissions Factors-ITPEnergised. Available online: https://www.itpenergised.com/new-2024-uk-grid-emissions-factors/ (accessed on 6 October 2024).
  43. Akbari, E.; Naghibi, A.F.; Veisi, M.; Shahparnia, A.; Pirouzi, S. Multi-Objective Economic Operation of Smart Distribution Network with Renewable-Flexible Virtual Power Plants Considering Voltage Security Index. Sci. Rep. 2024, 14, 19136. [Google Scholar] [CrossRef]
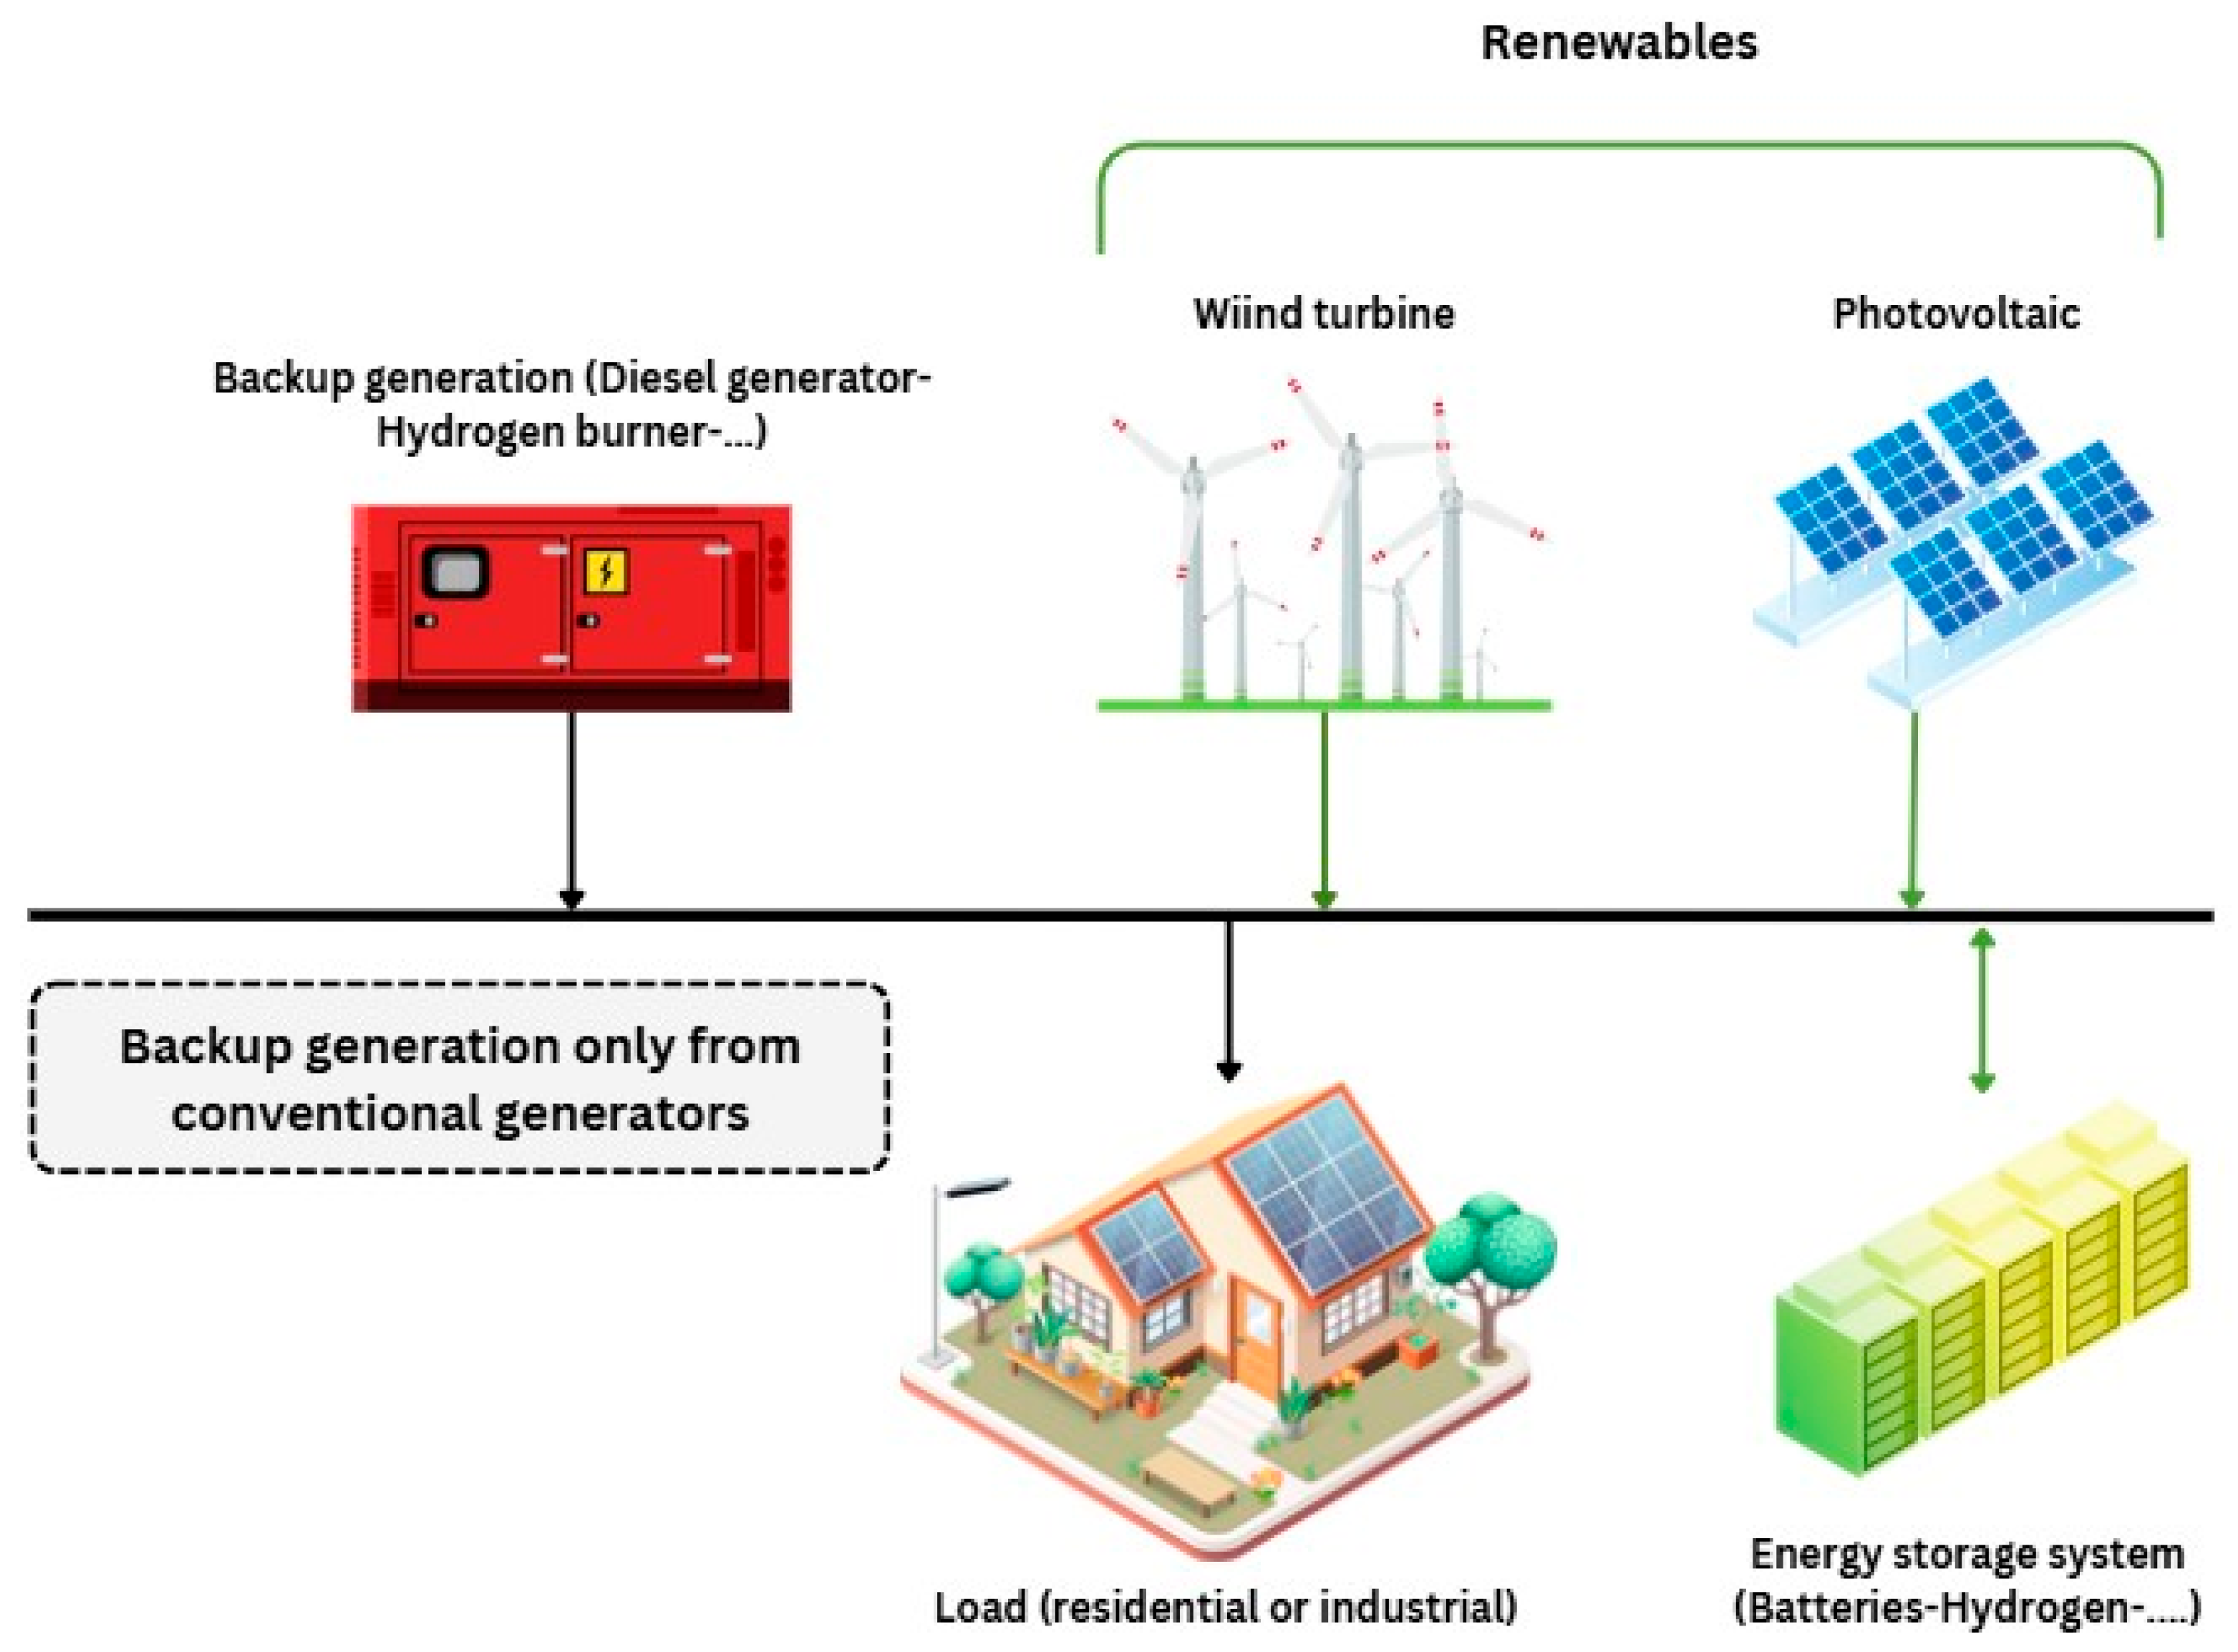
Figure 1. Isolated MG (renewable-based with backup generation from conventional generators).
Eng 06 00069 g001
Figure 2. Hybrid MG (renewable-based, where the backup generation alternates between the utility grid and the conventional generators).
Eng 06 00069 g002
Figure 3. Collaborative MG that uses COU strategy for order updates to the utility grid.
Eng 06 00069 g003
Figure 4. Selfish MG that uses traditional strategy for order updates to the utility grid.
Eng 06 00069 g004
Figure 5. Models of collaborative and selfish MGs and their scenarios, including the studied performance measures.
Eng 06 00069 g005
Figure 6. Power flows in the selfish MG model for different scenarios of backup generation: (a) Sc.1 for MG uses the national grid as backup generation; (b) Sc.2 for MG uses diesel generator as backup generation; (c) Sc.3 for MG uses H2 burner as backup generation; (d) Sc.4 for MG uses H2 burner and diesel generator as backup generation.
Eng 06 00069 g006aEng 06 00069 g006b
Figure 7. Power flows in the collaborative MG model for different scenarios of backup generation: (a) Sc.1 for MG uses the national grid as backup generation after the COU supply; (b) Sc.2 for MG uses a diesel generator as backup generation after COU supply; (c) Sc.3 for MG uses H2 burner as backup generation after COU; (d) Sc.4 for MG uses H2 burner as backup after COU and diesel generator as backup generation if there is shortage at the additional storage.
Eng 06 00069 g007aEng 06 00069 g007b
Figure 8. Demand profile vs. wind and solar outputs (hourly average across three months).
Eng 06 00069 g008
Figure 9. Carbon content of power supply in the collaborative and the selfish MG models, considering four scenarios for backup generation.
Eng 06 00069 g009
Figure 10. Unplanned orders and their volatility in the collaborative and the selfish MG models, considering four scenarios for backup generation.
Eng 06 00069 g010
Figure 11. Exported power to the national grid in the collaborative and the selfish MG models, considering four scenarios for backup generation.
Eng 06 00069 g011
Figure 12. Volatility of unplanned orders vs. supply carbon content in the collaborative and the selfish MG models, considering four scenarios for backup generation.
Eng 06 00069 g012
Table 1. Backup generation solutions in MGs.
Study Ref.YearMicrogrid TypeBackup Generation SolutionImpact on the Utility Grid
[3]2017HybridUtility gridLevel demand, significant excess power
[25]2017HybridDiesel and utility gridVolatile demand
[28]2019Hybrid/IsolatedUtility grid/traditional generatorStable demand, high sales to grid
[26]2021HybridDiesel, biogas generator and utility gridVolatile demand
[23]2023IsolatedDiesel generatorUnload the utility grid
[29]2024Interconnected MGsDiesel, fuel cell, H2 and utility gridVolatile demand
[22]2025HybridFuel cell, H2 and national gridVolatile demand
[24]2025IsolatedDiesel generatorUnload the utility grid
Table 2. Collaborative vs. selfish MG.
Comparison MetricSelfish MGCollaborative MG
Order update to the gridTraditional order update to the gridThe order update, called pre-contracted order update (COU) in this paper
Characteristics of the orders to gridSpot orders in a sporadic fashion and no actual written orderWritten and forward orders (one week ahead)
Reliance on utility gridAvoid relying on utility grid as much as possibleCommitment to purchase electricity from the utility grid
Effect of orders on power demandIncrease in power demanded (the update is instantaneous)Increase in power demanded (planned demand)
Who responsible for handling
the demand and
doing the forecast?
Electricity retailers, distributors, and suppliersThe MG itself responsible for the forecast
How the demand is handled?Through the use of forecasts that are the backbone of the balancing system at the utility grid levelLocal forecast takes into account planned demand but also a weather (intermittence) forecast at the MG level.
Forecast feasibilityMore difficult to forecast than normal electricity demandEasier forecast because it is at small scall (MG level)
Effect on the utility gridMore likely to be associated with fault currents or other exceptions that endanger the safe operation of the grid.There may be instances when forecast errors necessitate an emergency spot order; but, the frequency of such orders will be significantly reduced
Table 3. Mitigation approaches of potential uncertainties in collaborative vs. selfish MG systems.
Potential Uncertainties
(Forecast Errors and Demand Fluctuations)
Selfish MG
(Current Energy Management)
Collaborative MG
(COU Strategy)
The expected demand is lower than the realityAffected by the uncertainty related to the forecast and demand but the mitigation strategy is at the utility grid levelAffected by the uncertainty related to the forecast and demand but the mitigation strategy is at the MG grid level. The COU level in that case will be lower than required; the MG can rely on its stored energy, buy additional hydrogen if the storage is empty, or it can use grid electricity (as other MG or end node would do) as a last resort action.
The expected demand is higher than the realityAffected by the uncertainty related to the forecast and demand but the mitigation strategy is at the utility grid levelAffected by the uncertainty related to the forecast and demand but the mitigation strategy is at the MG grid level. The COU level in that case will be higher than required; excess energy can be stored in the 2-level storage described in the paper
Table 4. System assumptions.
Number of Wind TurbinesNumber of PV PanelsNumber of Households
1 turbine380 panels70
Table 5. Specification of the wind turbine.
Max OutputRotor DiameterHub Height
450 kW37 m35 m
Table 6. Specification of the PV panel.
Max OutputNominal EfficiencyWidthHeight
320 W21%1.666 m1.000 m
Table 7. Emission factors of different energy sources.
Power SourceEmission Factor (kgCO2eq/kWh)
Solar0.041 [38]
Wind0.012 [39]
Nuclear (COU)0.012 [40]
National grid (SOU)0.205 [41]
Diesel generator1.27 [42]
Table 8. Models’ parameters.
Time HorizonBasic Storage CapacityBasic Storage EfficiencyAdditional Storage Efficiency
90 days in Spring1500 kWh100%60%
Disclaimer/Publisher’s Note: The statements, opinions and data contained in all publications are solely those of the individual author(s) and contributor(s) and not of MDPI and/or the editor(s). MDPI and/or the editor(s) disclaim responsibility for any injury to people or property resulting from any ideas, methods, instructions or products referred to in the content.