Article

Glycosidic vs. Aglycol Form of Natural Products as Putative Tyrosinase Inhibitors

by
Maria Evgenia Politi
1,
Kostas Bethanis
1,
Trias Thireou
2 and
Elias Christoforides
1,*
1
Laboratory of Physics, Department of Biotechnology, Agricultural University of Athens, 11855 Athens, Greece
2
Laboratory of Genetics, Department of Biotechnology, Agricultural University of Athens, 11855 Athens, Greece
*
Author to whom correspondence should be addressed.
Biophysica 2021, 1(4), 458-473; https://doi.org/10.3390/biophysica1040033
Submission received: 1 November 2021 / Revised: 27 November 2021 / Accepted: 30 November 2021 / Published: 3 December 2021

Abstract

:
Numerous natural products and designed molecules have been evaluated as tyrosinase inhibitors that impede enzymes’ oxidation activity. In the present study, new potent natural inhibitors were retrieved from the ZINC database by the similarity-screening of 37 previously reported tyrosinase inhibitors. The screening resulted in 42 candidate inhibitory molecules that were categorized into five groups. Molecular-docking analysis for these compounds, as well as for three others known for their inhibition activity (caffeic acid, naringenin, and gallic acid), was carried out against the tyrosinase structure from Agaricus bisporus (AbTYR). The top-scoring compounds were used for further comparative analysis with their corresponding naturally occurring glycosides. The results suggested that the glycosylated inhibitors could interact better with the enzyme than their aglycon forms. In order to further examine the role of the sugar side group of potent tyrosinase inhibitors, the dynamic behavior of two such pairs of glycosidic/aglycol forms (naringin–naringenin and icariin–icaritin) in their complexes with the enzyme were studied by means of 20-ns MD simulations. The increased number of intermolecular hydrogen bonds and their augmented lifetime between AbTYR and the glycosidic analogues showed that the naringin and icariin molecules form more stable complexes than naringenin and icaritin with tyrosinase, and thus are more potent inhibitors.

Graphical Abstract

1. Introduction

Tyrosinase is a bicopper enzyme that catalyzes the oxidation of phenolic substrates to their corresponding o-quinones [1]. The latter are the precursor compounds of several biological pigments. These include the pigments responsible for plant browning and skin melanin, but also for neuromelanin, which may be associated with Parkinson’s disease [2,3,4]. Thus, tyrosinase inhibitors are of great interest for food industries as well as cosmetic and pharmaceutical industries [5,6].
The crystallographically determined structure of tyrosinase from Agaricus bisporus (AbTYR, PDB: 2Y9W) [7] is widely used as a model for screening and analyzing putative tyrosinase inhibitors by in silico studies [8]. The structure of AbTYR is a heterotetramer which consists of two heavy and two light subunits. The heavy subunit is the catalytic tyrosinase, while the light subunit has recently been found to be a mannose-binding protein [7,9].
Natural resources contain a vast number of bioactive compounds, whose development can have an impact on the economy, especially in plant-rich regions. Furthermore, natural products are a sustainable source for novel drugs, cosmetic active ingredients, and food supplements [10,11]. Moreover, natural product scaffolds have inspired chemists to develop semisynthetic or synthetic inhibitors with high efficacy and fewer adverse side effects [12,13].
Even though there are many tyrosinase inhibitors known today, the binding modes and mechanisms of inhibition are still unclear for the vast majority of them. Furthermore, most of the commonly known and widely used inhibitors are accompanied by undesirable side effects, such as kojic acid being a possible weak carcinogen and hydroquinone being responsible for ROS formation [14,15]. Therefore, finding new potent tyrosinase inhibitors and exploring the structural aspects of their inhibitory action is still of great importance.
Recently, interest has been drawn to the assessment of glucosylated forms of compounds as tyrosinase inhibitors. Such compounds include the synthetic glucosides of isotachioside, daidzein, chrysin, and naringenin, among others. Most glucosides have appeared to be more potent inhibitors than the related aglycon forms [16,17].
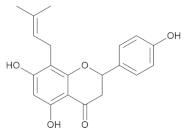
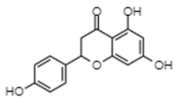
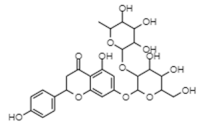
The primary objective of this study was to screen a virtual database of natural compounds for new putative tyrosinase inhibitors. The resulting hits from the screening were assessed for their antityrosinase activity through molecular-docking simulations. Moreover, the naturally occurring glucosylated analogues from the compounds with the top 11 scores were also docked against the AbTYR enzyme in order to obtain insights about their protein-bound ability. Subsequently, two pairs of these ligands, namely, icariin–icaritin and naringin–naringenin (Figure 1), were chosen for further structural analyses with MD simulations. The MD studies, based on the docked models, provided additional insights into the evaluation of the complex stabilities and inspection of the ligand dynamic behaviors in aqueous media.

2. Materials and Methods

2.1. Ligand Screening

Thirty-seven tyrosinase inhibitors (Table S1) were selected from recent literature, including a variety of chemical compound types in an effort to avoid biased results, and were used as reference (parental) molecules for similarity screening. Candidate compounds were retrieved from the ZINC database’s subset of biogenic compounds, which included both primary and secondary metabolites from natural sources [18]. The 3D structures of parental and candidate molecules were downloaded from Pubchem [19], and OMEGA (OpenEye Scientific Software, Santa Fe, NM, USA. http://www.eyesopen.com (accessed on 1 July 2020)) was used to generate multiconformer datasets [20]. ROCS (OpenEye Scientific Software, Santa Fe, NM, USA. http://www.eyesopen.com) was used to align the database molecules to the parental inhibitors, based on shape similarity and the distribution of chemical (color) features. Similarity was quantified by calculating the TanimotoCombo score, which includes both shape fit and color and ranges between 0 and 2 [21]. TanimotoCombo outperforms other scores implemented in ROCS for target ranking [22] and is currently used in combined virtual-screening approaches [23,24]. Sequentially, candidate molecules ranking high in the similarity-screening results of more than 3 parentals were selected for further investigation.

2.2. Molecular Docking

2.2.1. Preparation of the Macromolecule

The AbTYR model that was employed for molecular docking was based on the high resolution (2.3 Å) X-ray crystal structure of the enzyme from a mushroom (PDB ID: 2Y9W). Prior to the docking analysis, small modifications to the AbTYR structure were applied. The asymmetric unit of this structure contained two heavy and two light subunits (A, B, C, and D chains, heterotetramer), six holmium atoms (Ho), four copper (Cu+2) ions, PEG molecules, and several water molecules. All secondary chains (B, C, and D), water and PEG molecules, as well as Ho atoms were discarded using PyMOL v 2.4.0 [25], except for the conserved water molecule that bridged the two copper ions. In the remaining chain A of the macromolecule, the atomic charge of the copper atoms was edited and set to (+2).

2.2.2. Docking Parameters

Parental compounds and candidate molecules identified by virtual screening were docked on AbTYR using AutoDock Version 4.2.6, with the following parameters: Lamarckian genetic algorithm search method, 10,000,000 maximum energy evaluations, and 100 runs [26]. The dimensions of the gridbox were set to 54 × 60 × 76 Å (x, y, z), with a spacing of 0.375 Å, which created a box containing residues that have been previously mentioned as significant for the active site’s pocket structure [8]. The estimated free energy of binding (FEB), fit quality (FQ), and Ki values (Ki = exp(ΔG/(R × T))) were used to evaluate docking results. AutoDock predicts FEB using a semiempirical free-energy force field, which incorporates both intramolecular energies and a charge-based desolvation method, and has been calibrated on diverse protein–ligand complexes [27]. FQ is a ligand-efficiency score normalized with respect to the number of heavy atoms of a molecule [28]. Optimal binders have an FQ near 1.0, while molecules with poor ligand efficiency score lower on the scale. Therefore, FQ facilitates the comparison of ligand binding across a wide range of molecular sizes. Compounds ranking better in structure-based screening were selected for subsequent study.

2.3. Moleculad Dynamics

System Setup and Simulation Protocol

Four docked models, corresponding to AbTYR complexes with icariin, icaritin, naringin, and naringenin molecules, and illustrating high docking scores in the previous analysis, were validated using Molprobity [29] and used as the starting systems for 4 separate MD simulations. MD runs were performed at 300 K using the AMBER 12 software package [30]. The enzyme was treated with the FF99SB force field [31], while GAFF parameters and AM1BCC charges were applied to the ligands using ANTECHAMBER. Suitable libraries were built with the aid of xLeap. The copper model for the enzyme was created on the basis that the CuA ion was coordinated by three protonated histidine residues, namely, HID61, HID85, and HID94, whereas the CuB ion was coordinated with HID259, HID263, and HID296, and pertinent parameters were imposed. All hydrogen atoms were added to the systems and then each complex was solvated in a periodic, 10-Å-truncated octahedron simulation box consisting of TIP3P water molecules with a minimum distance of 10.0 Å from the system surface using the xLEaP module. All computations were performed on a 24-core workstation with Intel(R) Core (TM) 3.4GHz processors and 7 MB internal memory.
Both minimization and MD calculations were performed with SANDER. The simulation protocol is summarized below: All systems were equilibrated by energy minimization with 500 steps of the steepest-descent method, followed by 1000 steps of the conjugated-gradient method to release the bad contacts. The particle-mesh Ewald method with the non-bonded cutoff distance set to 10 Å was utilized to create the periodic boundaries. Then, heating of the water molecules with constant volume and temperature (NVT) from 0 K to 300 K, keeping the protein fixed with weak position restraints (10 Kcal mol−1 Å−2), was carried out. The Berendsen thermostat algorithm with coupling constants of 0.5 ps was used to control temperature and pressure. Finally, a 20 ns MD production run with constant pressure of 1 atm and temperature of 300 K (NPT ensemble) was performed for all models using a time step of 1 fs.
All the trajectory files were analyzed using the trajectory-analysis module embedded in the AMBER simulation package and Visual Molecular Dynamics (VMD) software [32]. CPPTRAJ [33] utilities were used to extract the graph of root-mean-square deviation (RMSD), root-mean-square fluctuations (RMSFs), radius of gyration (Rg), hydrogen bond, etc. All the graphs were plotted using both VMD and PyMOL.

3. Results

3.1. Ligand Screening

The virtual ligand screening resulted in many compounds that were further filtered, taking into account their availability in the PubChem database, their commercial availability, and the number of parentals they held similarity to. Only compounds resulting from three or more parentals were maintained (Table S2). These criteria assisted in the selection of 42 compounds to be further analyzed. These compounds were then divided, according to their structural features, into five categories: chalcones, coumarins, dihydrochalcones, monocyclic phenols, and prenylated flavonoids (Table 1). The compounds were then used as ligands for molecular-docking analysis.

3.2. Molecular Docking

Parentals and Screening Resulting Compounds

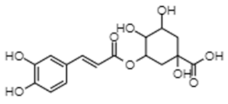
All compounds from the ligand screening were docked on AbTYR and evaluated based on the resulting FEB and calculated FQ values. Among the top-scoring compounds were icaritin, phloretin, butein, helichrysetin, isoliquiritigenin, biochanin A, genistein, and protocatechuic acid. These compounds were used for further comparative analysis with their corresponding naturally occurring glycosides: icariin, phlorizin, coreopsin, helichrysetin 4,4′-di-O-α-glucoside, isoliquiritigenin 4′-O-glucoside 4-O-apiofuranosyl-1′-glucoside, astroside, genistein glucoside, and protocatechuic acid 3-glucoside. In addition, three more known pairs of glucosides and their respective aglycons were compared: caffeic acid with chlorogenic acid, naringenin with naringin, and gallic acid with 4-glucogallic acid.
Every aglycon appeared to interact hydrophobically with Val283 and interact with Asn260 either by forming a hydrogen bond or by hydrophobicity. Furthermore, all except for naringenin formed hydrophobic interactions with Phe264 and His263, barring isoliquiritigenin and helichrysetin, which formed a hydrogen bond with His263. Additionally, helichrysetin, icaritin, isoliquiritigenin, caffeic acid, phloretin, protocatechuic acid, and gallic acid also interacted with Met280, Gly281, Ser282, and Ala286.
The glucosylated compounds showed more frequent interactions, as all of them interacted hydrophobically or by forming hydrogen bonds with Asn260, Phe264, Met280, Gly281, Ser282, and Val283. Furthermore, all the compounds except for isoliquiritigenin 4′-O-glucoside 4-O-apiofuranosyl-1′glucoside interacted with His263. Additional interactions were formed by a number of glucosides and His 85, His244, Val248, Ala286, and Glu322, while the majority, barring genistein glucoside, protocatechuic acid 3-glucoside, astroside, and chlorogenic acid, also formed a hydrogen bond with the conserved water molecule between the two copper ions.
The results from every pair showed that in all cases the glycosylated compounds had lower FEB values than the related aglycons. Furthermore, the FQs, the size-independent variable of the analysis, of the glycosylated compounds were also higher than those of the corresponding aglycons, with the only exception being the gallic acid pair (Table 2 and Table 3). This was due to the fact that the sugar side groups of the glycosylated compounds introduced to each molecule extra atoms capable of forming hydrogen bonds, thus stabilizing the interaction and increasing the affinity with AbTYR.
The docking results for icariin suggested that the molecule could be held in position by forming six hydrogen bonds, six alkyl or pi-alkyl interactions, a pi-sigma, and one pi-pi T-shaped interaction (Figure 2a), while in the case of icaritin, only four hydrogen bonds, five alkyl or pi-alkyl interactions, one pi-sigma, and one pi-pi T-shaped interaction could be formed (Figure 2b). In addition, it was suggested that naringin was able to create eight hydrogen bonds, three alkyl or pi-alkyl interactions, and one pi-pi T-shaped interaction (Figure 2c), while its aglycon, naringenin, could only form two hydrogen bonds, one pi-alkyl, and a pi-pi T-shaped interaction (Figure 2d).
The two ligand pairs mentioned above were chosen to be further analyzed with MD simulations in an effort to shed light on the dynamic behavior of the compounds in their complex form and monitor their interactions with AbTYR. The first duet, icaritin and icariin, was chosen due to the fact that both compounds were the top-scoring ones in their categories (Table 2 and Table 3). The second pair, naringenin and naringin, was selected as docking analysis predicted the highest difference in affinity between these two forms among the 11 duets under investigation.

3.3. Molecular Dynamics

3.3.1. The Icariin–Icaritin Pair

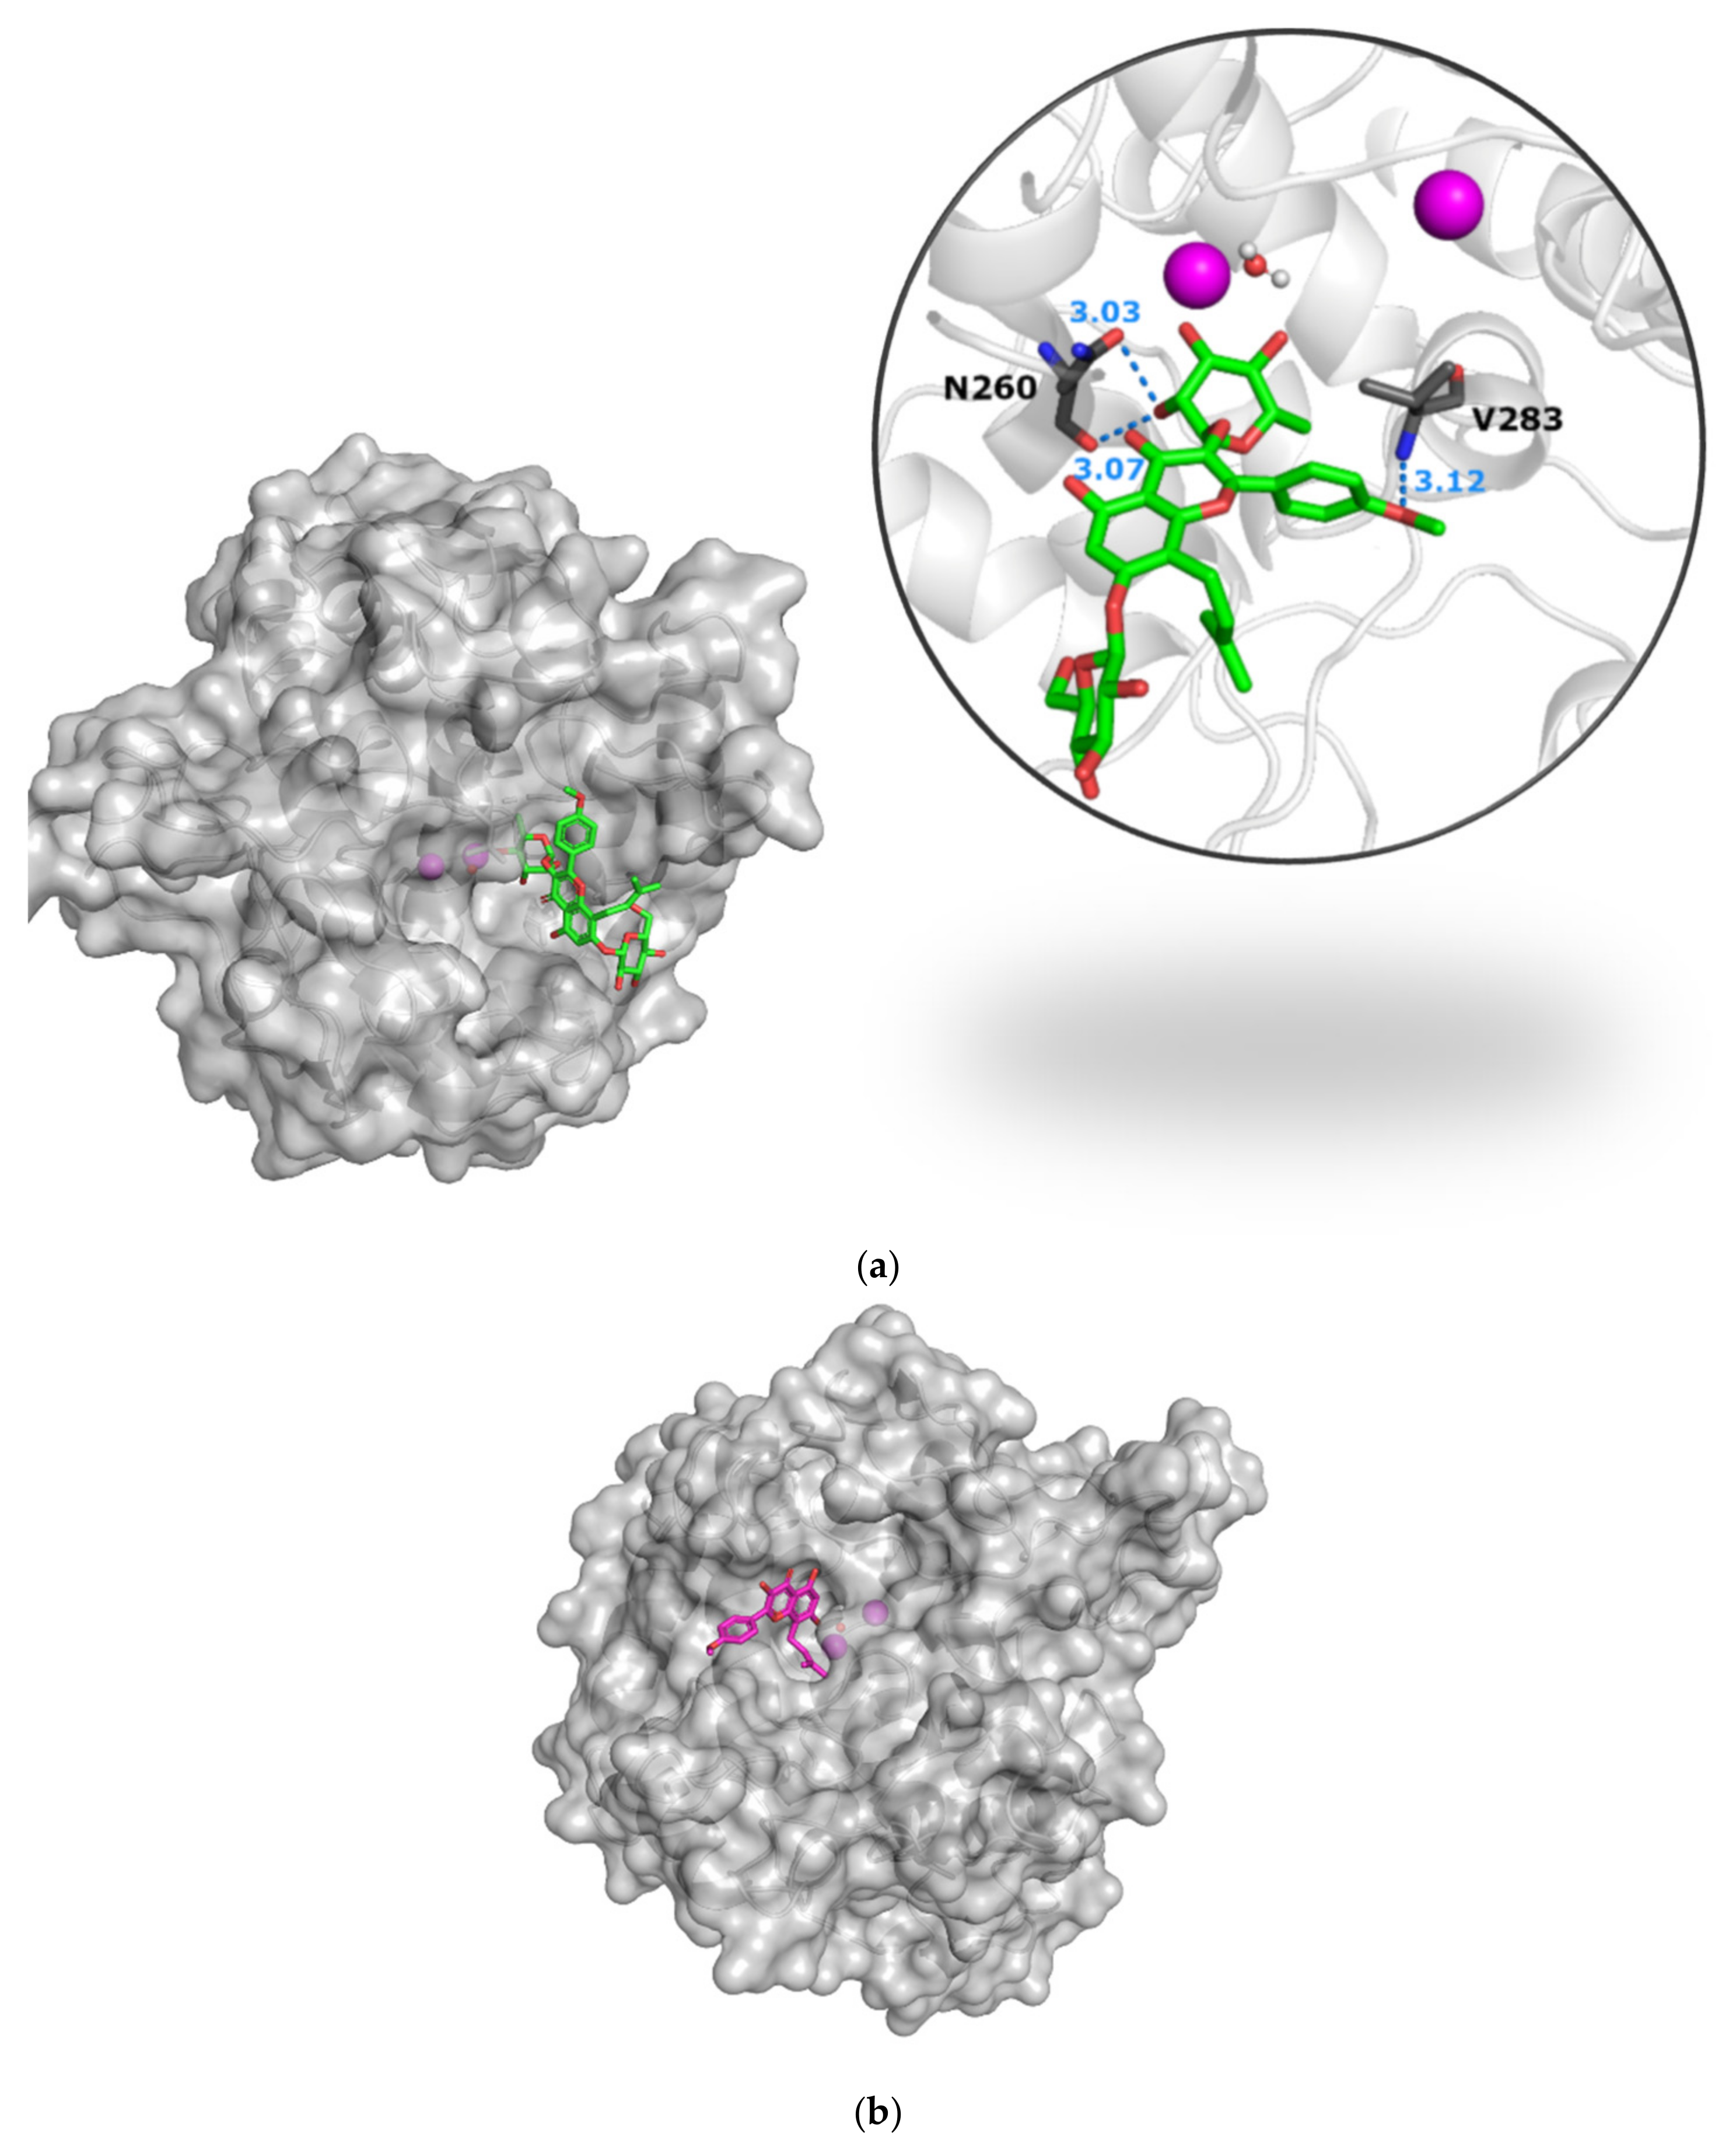
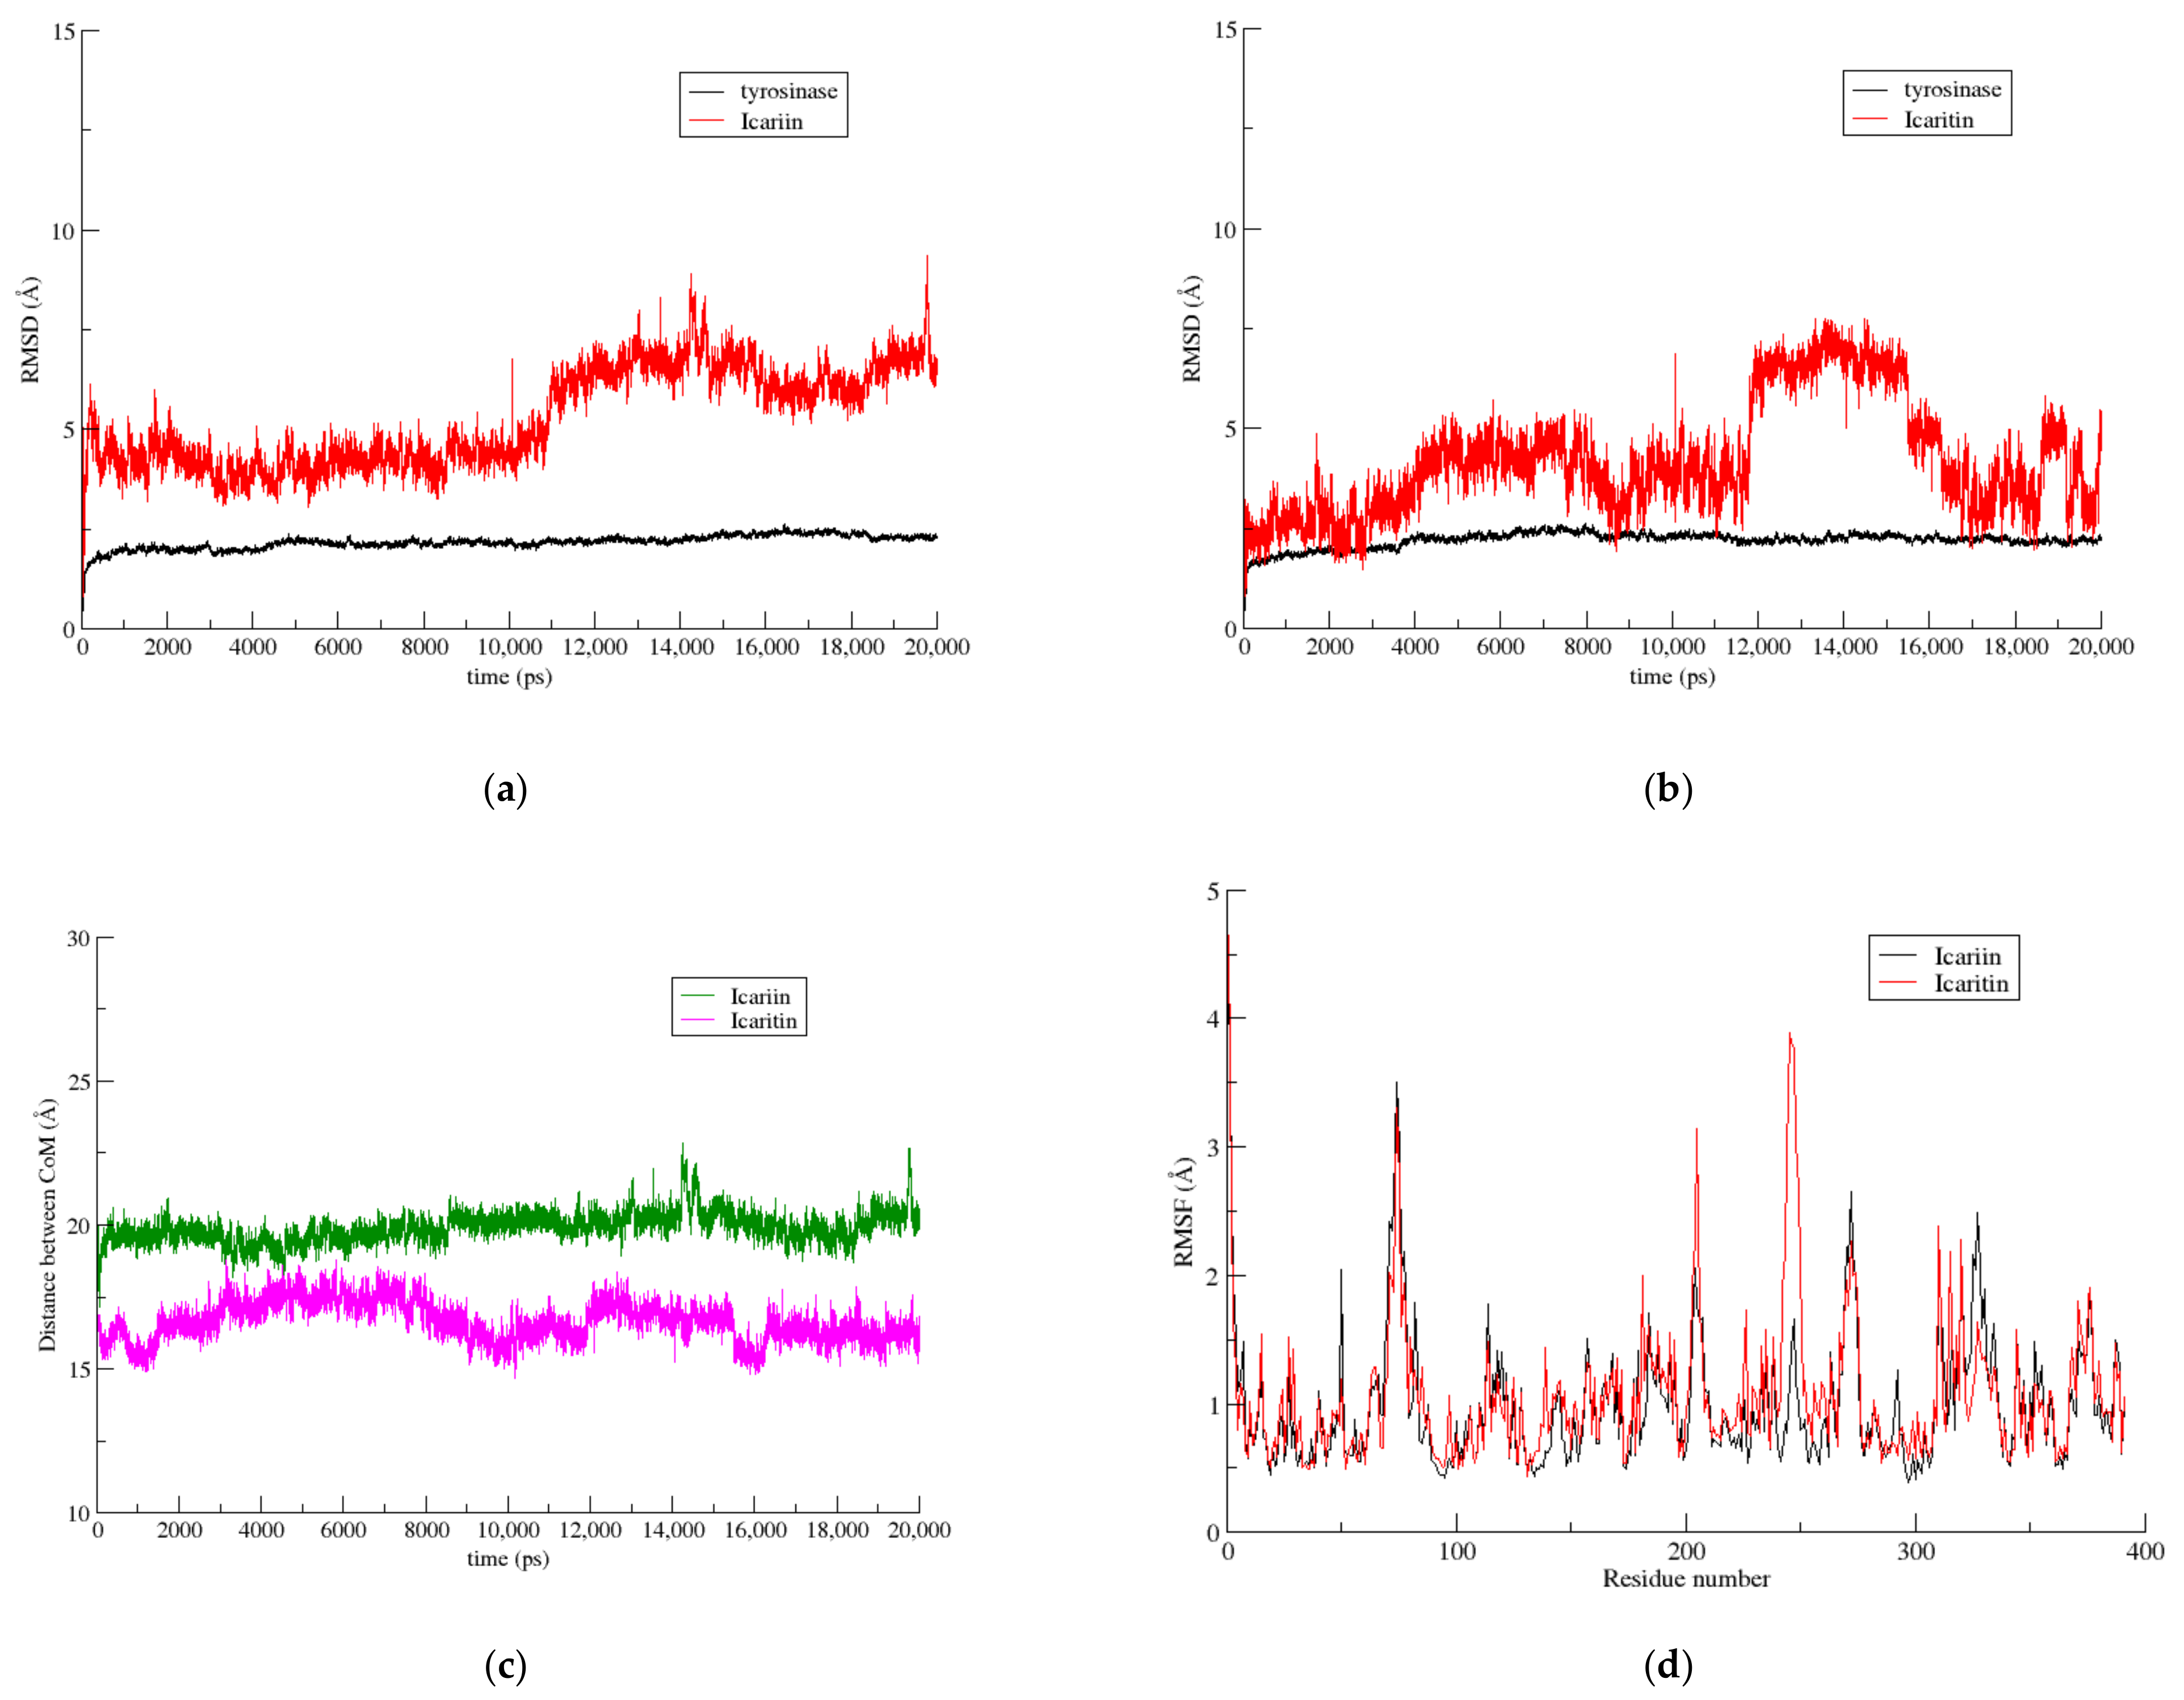
An inspection of the MD trajectories in the AbTYR/icariin case revealed that the ligand bounded firmly onto the tyrosinase and retained the starting conformation for about 10 ns (Figure 2a). At this point in time, the icariin’s glucopyranoside group seemed to change its conformation slightly, resulting in a shifting of the whole molecule. Due to the rearrangement, the conserved water molecule was also relocated to a new position far from the two copper ions and, 6 ns later, it was completely dislocated from the active site. The icaritin, on the other hand, showed a much less stable interaction with the active site of the tyrosinase. Its increased mobility during the whole simulation time was characterized by alternate approaches and shifts away from the active site every 4 ns, approximately (Figure 3a). The RMSD plots (Figure 4a,b) help to visualize the change in the positions of the two molecules during the MDs.
Distance monitoring between the enzyme and ligand CoMs (center of masses) gave an indication of the ligand’s proximity to the enzyme during the simulation. Upon examination of the icariin–icaritin pair, the latter illustrated greater value fluctuations in comparison to its glycosylated analogue, which was constantly found in close proximity to the enzyme (Figure 4c). Moreover, RoG (radius of gyration) calculations, which are a measure of structural compactness, provided additional information about the complex stability. In the given two cases, the RoG values did not change significantly over time, and thus both complexes were characterized as stable during the 20-ns MD time, even if the RoG of the two ligands differed (Figure S1a,b).
A plethora of intermolecular interactions were present in the AbTYR/icariin complex. The icariin molecule was stabilized in the active site of the tyrosinase via a hydrogen bond between the O10 atom of its glucose ring and the ND atom of the Asn260 (Figure 3a). The bond was conserved for 84% of the simulation time and additional hydrogen bonds were formed between: (i) the O14 atom of the icariin and the Asn260, (ii) the O15 atom of the ligand and the Val283, and (iii) the O11 atom of the ligand and the Val248 for 20%, 12%, and 9% of the run-time, respectively. The time evolution of the main hydrogen bonds in the simulation trajectory of the AbTYR/icariin complex is given in Figure S2. The icaritin was also held in position by a hydrogen bond between its O2 atom and the Asn260 for 55% of the time (Figure 3b). An additional hydrogen bond was also formed between the O2 atom of the icaritin and the ND atom of the Glu256 for 9% of the time. The RMSF values of the protein residues (Figure 4d) revealed the increased mobility of the three flexible loops and two a-helices (residue ranges 75–100 and 242–287) that surrounded the catalytic center and were also observed by Bagherzadeh [8].

3.3.2. The Naringin–Naringenin Pair

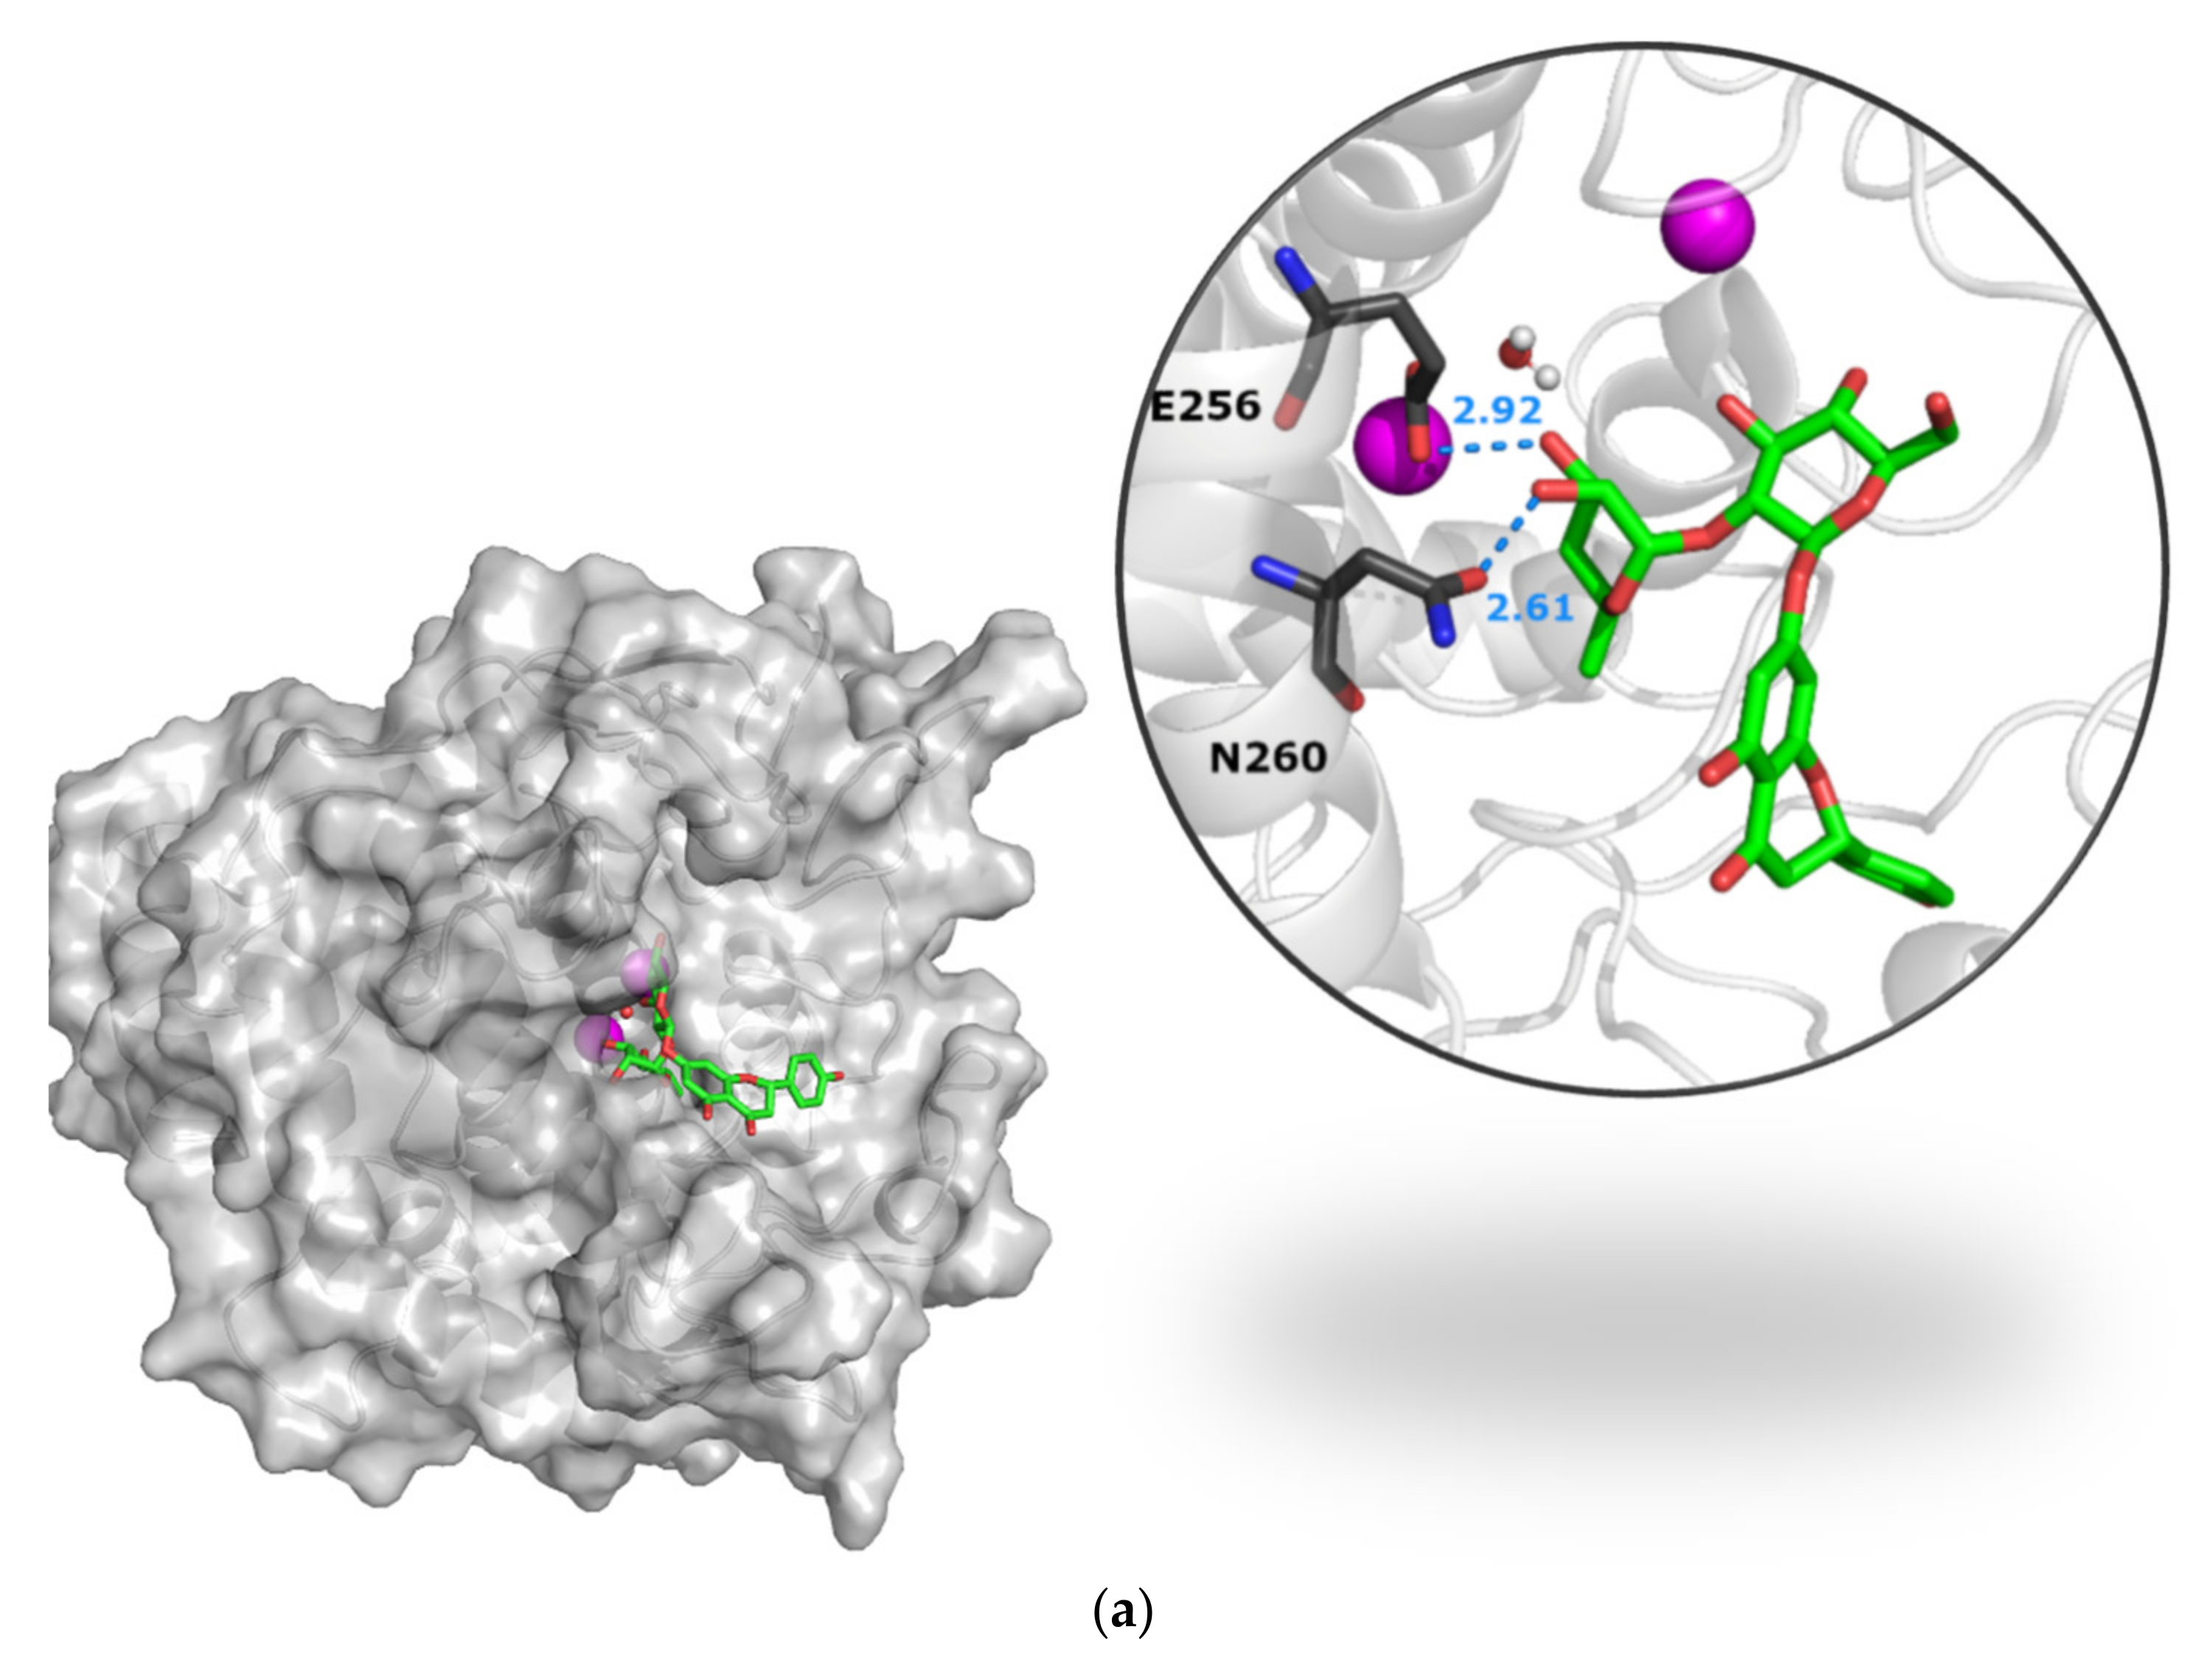
The results from the molecular-dynamics simulations running for 20 ns showed that the naringenin almost immediately moved from its starting position to another position, and then shifted again at approximately 4.5 ns, in order to settle in a different cavity further from the active site. At 15 ns, the naringenin changed its position again and reapproached the active site, which seemed to expel the conserved water molecule away from the copper site (Figure 5a). On the other hand, the naringin contributed to the formation of a more stable tyrosinase complex, as the only noticeable change during the whole simulation time was the displacement of the water molecule by another at the 15th ns (Figure 5b).
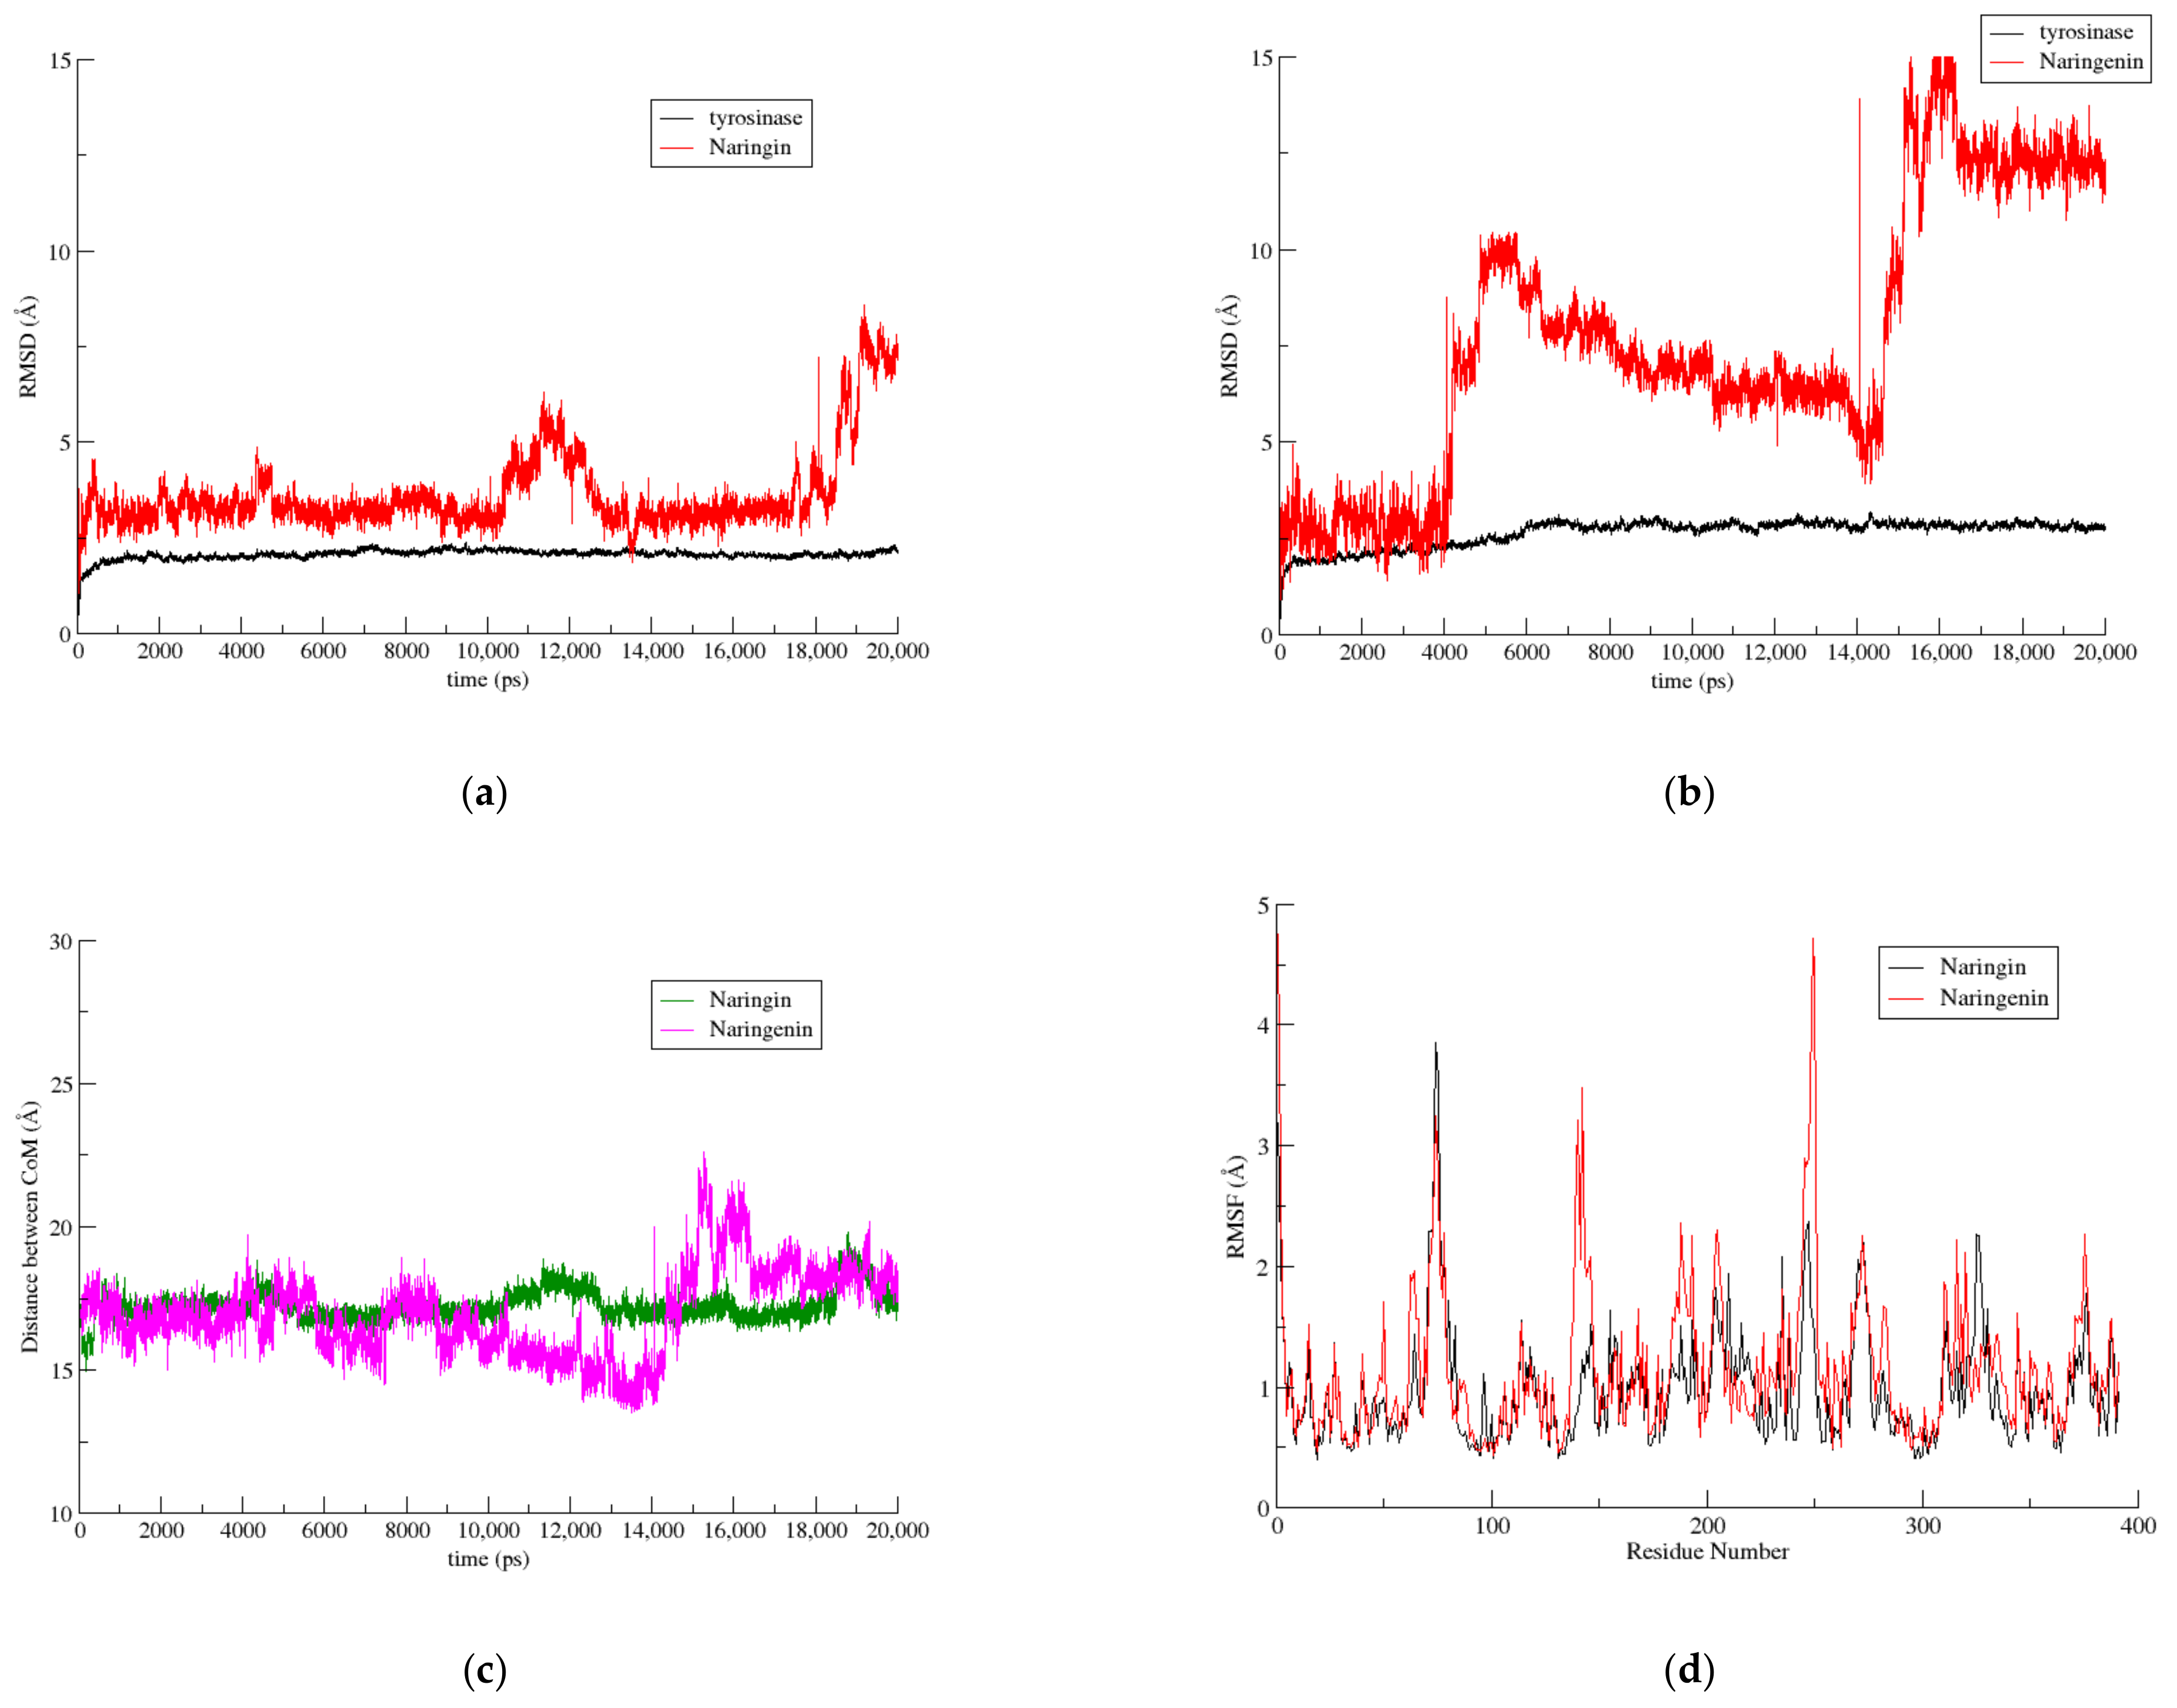
These results are more evident upon observation of the RMSD graphs of the compounds shown in Figure 6a,b. The increased mobility of the naringenin becomes evident by comparing the protein–ligand CoM graphs (Figure 6c), which show that the distance between the naringin and the AbTYR had visibly fewer deviations than the distance between the naringenin and the tyrosinase. Again, the RoG plots (Figure S1c,d) reveal that both complexes were characterized as stable.
The naringin was held in its position by hydrogen bonds with the Asn260. Firstly, a hydrogen bond was formed between the O8 of the naringin and the Asn260 for 4.5 ns, and afterwards, that bond was replaced by another one between the Asn260 and the O7 of the naringin for the remainder of simulation time (Figure 5a). A hydrogen bond was also formed between the O8 of the naringin and the Glu256 for 21% of the time. On the other hand, the binding mode of the naringenin was much less stable, as no hydrogen bond was maintained for more than 2% of the total time (Figure 5b). Again, the RMSF values of the tyrosinase residues illustrated higher values for the naringenin (aglycon ligand) (Figure 6d) than for the naringin.

4. Discussion

We screened the ZINC database, seeking potent inhibitors of tyrosinase, and selected 37 compounds for further investigation.
All the compounds from the ligand screening were docked on AbTYR and evaluated based on the resulting FEB and calculated FQ values. Among the top-scoring compounds, icaritin, phloretin, butein, helichrysetin, isoliquiritigenin, biochanin A, genistein, and protocatechuic acid were used for further comparative analysis with their corresponding naturally occurring glycosides. In addition, three more known pairs of glucosides and their respective aglycons were compared: caffeic acid with chlorogenic acid, naringenin with naringin, and gallic acid with 4-glucogallic acid. The results from every pair showed that the sugar side groups of the glycosylated compounds introduced to each molecule extra atoms capable of forming hydrogen bonds, thus stabilizing the interaction and increasing the affinity with AbTYR.
The role of the sugar side group of potent tyrosinase inhibitors was further investigated by MD analysis for the naringin–naringenin and icariin–icaritin pairs. While there was a consistent pattern of interactions for both glycosides and aglycons, the MDs suggested that these interactions were more likely to be maintained in the glycosylated compounds, possibly because of the secondary interactions taking place between the extra side-group atoms and the enzyme. In particular, the interactions observed between the ligands and the Asn260 of AbTYR, a residue previously characterized as important for substrate binding in the active site by Ismaya et al. [7], were stable for a great fraction of the simulation time in the cases of naringin and icariin, whereas they were much more unstable in the case of icaritin, and almost immediately lost in the case of naringenin.

5. Conclusions

Modern drug discovery is benefited by nature, which is an inexhaustible source of natural products with many uses in the cosmetic and pharmaceutical industries as antioxidant, antiaging, and therapeutic agents. Virtual screening of the available databases, such as ZINC, for potential tyrosinase inhibitors can instigate the exploration of new compounds with high antityrosinase activity. In this work, the screening of the ZINC database resulted in compounds that were grouped into five categories. Docking analysis revealed that the groups with the highest affinity were prenylated flavonoids and dihydrochalcones. Moreover, the comparative analysis of the top-scoring ligands with their corresponding naturally occurring glycosides revealed that the latter group seemed to form more stable complexes with the enzyme. Finally, MD studies for two pairs suggested that the glycosylation of the compounds might enhance their affinity with AbTYR and draw interest into the assessment of more glycosylated compounds as potential tyrosinase inhibitors.

Supplementary Materials

The following are available online at https://www.mdpi.com/article/10.3390/biophysica1040033/s1. Figure S1: RoG plots of AbTYR enzyme in its complexes with (a) icariin, (b) icaritin, (c) naringin and (d) naringenin, Figure S2. Time evolution of hydrogen bonds in simulation trajectory of Ab-TYR/icariin complex. Table S1: List of parental compounds for ligand screening, Table S2: Screen-ing resulting compounds and their Tanimoto Combo values.

Author Contributions

Conceptualization, M.E.P., E.C. and K.B.; methodology, T.T., K.B. and E.C.; software, T.T., K.B. and E.C.; validation, M.E.P., T.T., K.B. and E.C.; formal analysis, M.E.P., T.T., K.B. and E.C.; investigation, M.E.P., T.T., K.B. and E.C.; data curation, M.E.P., T.T., K.B. and E.C.; writing—original draft preparation, M.E.P., K.B. and E.C.; writing—review and editing, K.B. and E.C.; visualization, M.E.P., T.T., K.B. and E.C.; supervision, K.B.; project administration, K.B. All authors have read and agreed to the published version of the manuscript.

Funding

This research received no external funding.

Data Availability Statement

Data is available from the authors upon reasonable request.

Acknowledgments

We acknowledge the support of this work by the project “INSPIRED—The National Research Infrastructures on Integrated Structural Biology, Drug Screening Efforts and Drug target functional characterization” (MIS 5002550), which was implemented under the action “Reinforcement of the Research and Innovation Infrastructure”, funded by the Operational Programme “Competitiveness, Entrepreneurship and Innovation” (NSRF 2014–2020), and cofinanced by Greece and the European Union (European Regional Development Fund).

Conflicts of Interest

The authors declare no conflict of interest.

References

  1. Ramsden, C.A.; Riley, P.A. Tyrosinase: The four oxidation states of the active site and their relevance to enzymatic activation, oxidation and inactivation. Bioorganic Med. Chem. 2014, 22, 2388–2395. [Google Scholar] [CrossRef]
  2. Martinez, M.; Whitaker, J.R. The biochemistry and control of enzymatic browning. Trends Food Sci. Technol. 1995, 6, 195–200. [Google Scholar] [CrossRef]
  3. Sánchez-Ferrer, A.; Rodríguez-López, J.N.; Garcia-Canovas, F.; García-Carmona, F. Tyrosinase: A comprehensive review of its mechanism. Biochim. Biophys. Acta Protein Struct. Mol. Enzym. 1995, 1247, 1–11. [Google Scholar] [CrossRef]
  4. Cavalieri, E.L.; Li, K.-M.; Balu, N.; Saeed, M.; Devanesan, P.; Higginbotham, S.; Zhao, J.; Gross, M.L.; Rogan, E.G. Catechol ortho-quinones: The electrophilic compounds that form depurinating DNA adducts and could initiate cancer and other diseases. Carcinogenesis 2002, 23, 1071–1077. [Google Scholar] [CrossRef] [Green Version]
  5. Loizzo, M.R.; Tundis, R.; Menichini, F. Natural and Synthetic Tyrosinase Inhibitors as Antibrowning Agents: An Update. Compr. Rev. Food Sci. Food Saf. 2012, 11, 378–398. [Google Scholar] [CrossRef]
  6. Panzella, L.; Napolitano, A. Natural and Bioinspired Phenolic Compounds as Tyrosinase Inhibitors for the Treatment of Skin Hyperpigmentation: Recent Advances. Cosmetics 2019, 6, 57. [Google Scholar] [CrossRef] [Green Version]
  7. Ismaya, W.T.; Rozeboom, H.J.; Weijn, A.; Mes, J.J.; Fusetti, F.; Wichers, H.J.; Dijkstra, B.W. Crystal Structure of Agaricus bisporus Mushroom Tyrosinase: Identity of the Tetramer Subunits and Interaction with Tropolone. Biochemistry 2011, 50, 5477–5486. [Google Scholar] [CrossRef] [Green Version]
  8. Bagherzadeh, K.; Talari, F.S.; Sharifi, A.; Ganjali, M.R.; Saboury, A.A.; Amanlou, M. A new insight into mushroom tyrosinase inhibitors: Docking, pharmacophore-based virtual screening, and molecular modeling studies. J. Biomol. Struct. Dyn. 2014, 33, 487–501. [Google Scholar] [CrossRef] [PubMed]
  9. Rachmawati, H.; Sundari, S.; Nabila, N.; Tandrasasmita, O.M.; Amalia, R.; Siahaan, T.J.; Tjandrawinata, R.R.; Ismaya, W.T. Orf239342 from the mushroom Agaricus bisporus is a mannose binding protein. Biochem. Biophys. Res. Commun. 2019, 515, 99–103. [Google Scholar] [CrossRef]
  10. Dini, I.; Laneri, S. The New Challenge of Green Cosmetics: Natural Food Ingredients for Cosmetic Formulations. Molecules 2021, 26, 3921. [Google Scholar] [CrossRef]
  11. Khan, R.A. Natural products chemistry: The emerging trends and prospective goals. Saudi Pharm. J. 2018, 26, 739–753. [Google Scholar] [CrossRef]
  12. Lee, S.Y.; Baek, N.; Nam, T.-G. Natural, semisynthetic and synthetic tyrosinase inhibitors. J. Enzym. Inhib. Med. Chem. 2016, 31, 1–13. [Google Scholar] [CrossRef]
  13. Masum, M.N.; Yamauchi, K.; Mitsunaga, T. Tyrosinase Inhibitors from Natural and Synthetic Sources as Skin-lightening Agents. Rev. Agric. Sci. 2019, 7, 41–58. [Google Scholar] [CrossRef] [Green Version]
  14. Burnett, C.L.; Bergfeld, W.F.; Belsito, D.V.; Hill, R.A.; Klaassen, C.D.; Liebler, D.; Marks, J.G.; Shank, R.C.; Slaga, T.J.; Snyder, P.W.; et al. Final Report of the Safety Assessment of Kojic Acid as Used in Cosmetics. Int. J. Toxicol. 2010, 29, 244S–273S. [Google Scholar] [CrossRef] [PubMed]
  15. Solano, F.; Briganti, S.; Picardo, M.; Ghanem, G. Hypopigmenting agents: An updated review on biological, chemical and clinical aspects. Pigment. Cell Res. 2006, 19, 550–571. [Google Scholar] [CrossRef] [PubMed]
  16. Matsumoto, T.; Nakajima, T.; Iwadate, T.; Nihei, K.-I. Chemical synthesis and tyrosinase-inhibitory activity of isotachioside and its related glycosides. Carbohydr. Res. 2018, 465, 22–28. [Google Scholar] [CrossRef] [PubMed]
  17. Fujitaka, Y.; Hamada, H.; Hamada, H.; Iwaki, T.; Shimoda, K.; Kiriake, Y.; Saikawa, T. Synthesis of Glycosides of α-Tocopherol, Daidzein, Resveratrol, Hesperetin, Naringenin, and Chrysin as Antiallergic Functional Foods and Cosmetics. Nat. Prod. Commun. 2020, 15, 1934578–2094466. [Google Scholar] [CrossRef]
  18. Sterling, T.; Irwin, J.J. ZINC 15—Ligand Discovery for Everyone. J. Chem. Inf. Model. 2015, 55, 2324–2337. [Google Scholar] [CrossRef] [PubMed]
  19. Hähnke, V.D.; Kim, S.; Bolton, E.E. PubChem chemical structure standardization. J. Chemin. 2018, 10, 36. [Google Scholar] [CrossRef] [PubMed]
  20. Hawkins, P.C.D.; Skillman, A.G.; Warren, G.L.; Ellingson, B.A.; Stahl, M.T. Conformer Generation with OMEGA: Algorithm and Validation Using High Quality Structures from the Protein Databank and Cambridge Structural Database. J. Chem. Inf. Model. 2010, 50, 572–584. [Google Scholar] [CrossRef] [PubMed]
  21. Hawkins, P.C.D.; Skillman, A.A.G.; Nicholls, A. Comparison of Shape-Matching and Docking as Virtual Screening Tools. J. Med. Chem. 2007, 50, 74–82. [Google Scholar] [CrossRef] [PubMed]
  22. Chen, Y.; Mathai, N.; Kirchmair, J. Scope of 3D Shape-Based Approaches in Predicting the Macromolecular Targets of Structurally Complex Small Molecules Including Natural Products and Macrocyclic Ligands. J. Chem. Inf. Model. 2020, 60, 2858–2875. [Google Scholar] [CrossRef] [PubMed]
  23. Laiolo, J.; Tomašič, T.; Vera, D.M.A.; González, M.L.; Lanza, P.A.; Gancedo, S.N.; Hodnik, Z.; Mašič, L.P.; Kikelj, D.; Carpinella, M.C. Analogues of the Lignan Pinoresinol as Novel Lead Compounds for P-glycoprotein (P-gp) Inhibitors. ACS Med. Chem. Lett. 2018, 9, 1186–1192. [Google Scholar] [CrossRef] [Green Version]
  24. Ibrahim, M.A.; Abdelrahman, A.H.; Hassan, A.M. Identification of novel Plasmodium falciparum PI4KB inhibitors as potential anti-malarial drugs: Homology modeling, molecular docking and molecular dynamics simulations. Comput. Biol. Chem. 2019, 80, 79–89. [Google Scholar] [CrossRef] [PubMed]
  25. The PyMOL Molecular Graphics System Version 2.4.0; Schrödinger LLC.: New York, NY, USA, 2020; Available online: http://www.pymol.org/pymol (accessed on 30 October 2021).
  26. Morris, G.M.; Huey, R.; Lindstrom, W.; Sanner, M.F.; Belew, R.K.; Goodsell, D.S.; Olson, A.J. AutoDock4 and AutoDockTools4: Automated docking with selective receptor flexibility. J. Comput. Chem. 2009, 30, 2785–2791. [Google Scholar] [CrossRef] [PubMed] [Green Version]
  27. Huey, R.; Morris, G.; Olson, A.J.; Goodsell, D.S. A semiempirical free energy force field with charge-based desolvation. J. Comput. Chem. 2007, 28, 1145–1152. [Google Scholar] [CrossRef]
  28. Bembenek, S.D.; Tounge, B.A.; Reynolds, C.H. Ligand efficiency and fragment-based drug discovery. Drug Discov. Today 2009, 14, 278–283. [Google Scholar] [CrossRef]
  29. Chen, V.B.; Arendall, W.B.I.; Headd, J.J.; Keedy, D.A.; Immormino, R.M.; Kapral, G.J.; Murray, L.W.; Richardson, J.S.; Richardson, D.C. MolProbity: All-atom structure validation for macromolecular crystallography. Acta Cryst. D Biol. Crystallogr. 2010, 66, 12–21. [Google Scholar] [CrossRef] [Green Version]
  30. Salomon-Ferrer, R.; Case, D.A.; Walker, R.C. An overview of the Amber biomolecular simulation package. Wiley Interdiscip. Rev. Comput. Mol. Sci. 2013, 3, 198–210. [Google Scholar] [CrossRef]
  31. Maier, J.A.; Martinez, C.; Kasavajhala, K.; Wickstrom, L.; Hauser, K.E.; Simmerling, C. ff14SB: Improving the accuracy of protein side chain and backbone parameters from ff99SB. J. Chem. Theory Comput. 2015, 11, 3696–3713. [Google Scholar] [CrossRef] [PubMed] [Green Version]
  32. Humphrey, W.; Dalke, A.; Schulten, K. VMD: Visual molecular dynamics. J. Mol. Graph. 1996, 14, 33–38. [Google Scholar] [CrossRef]
  33. Roe, D.R.; Cheatham, I.T.E. PTRAJ and CPPTRAJ: Software for Processing and Analysis of Molecular Dynamics Trajectory Data. J. Chem. Theory Comput. 2013, 9, 3084–3095. [Google Scholar] [CrossRef] [PubMed]
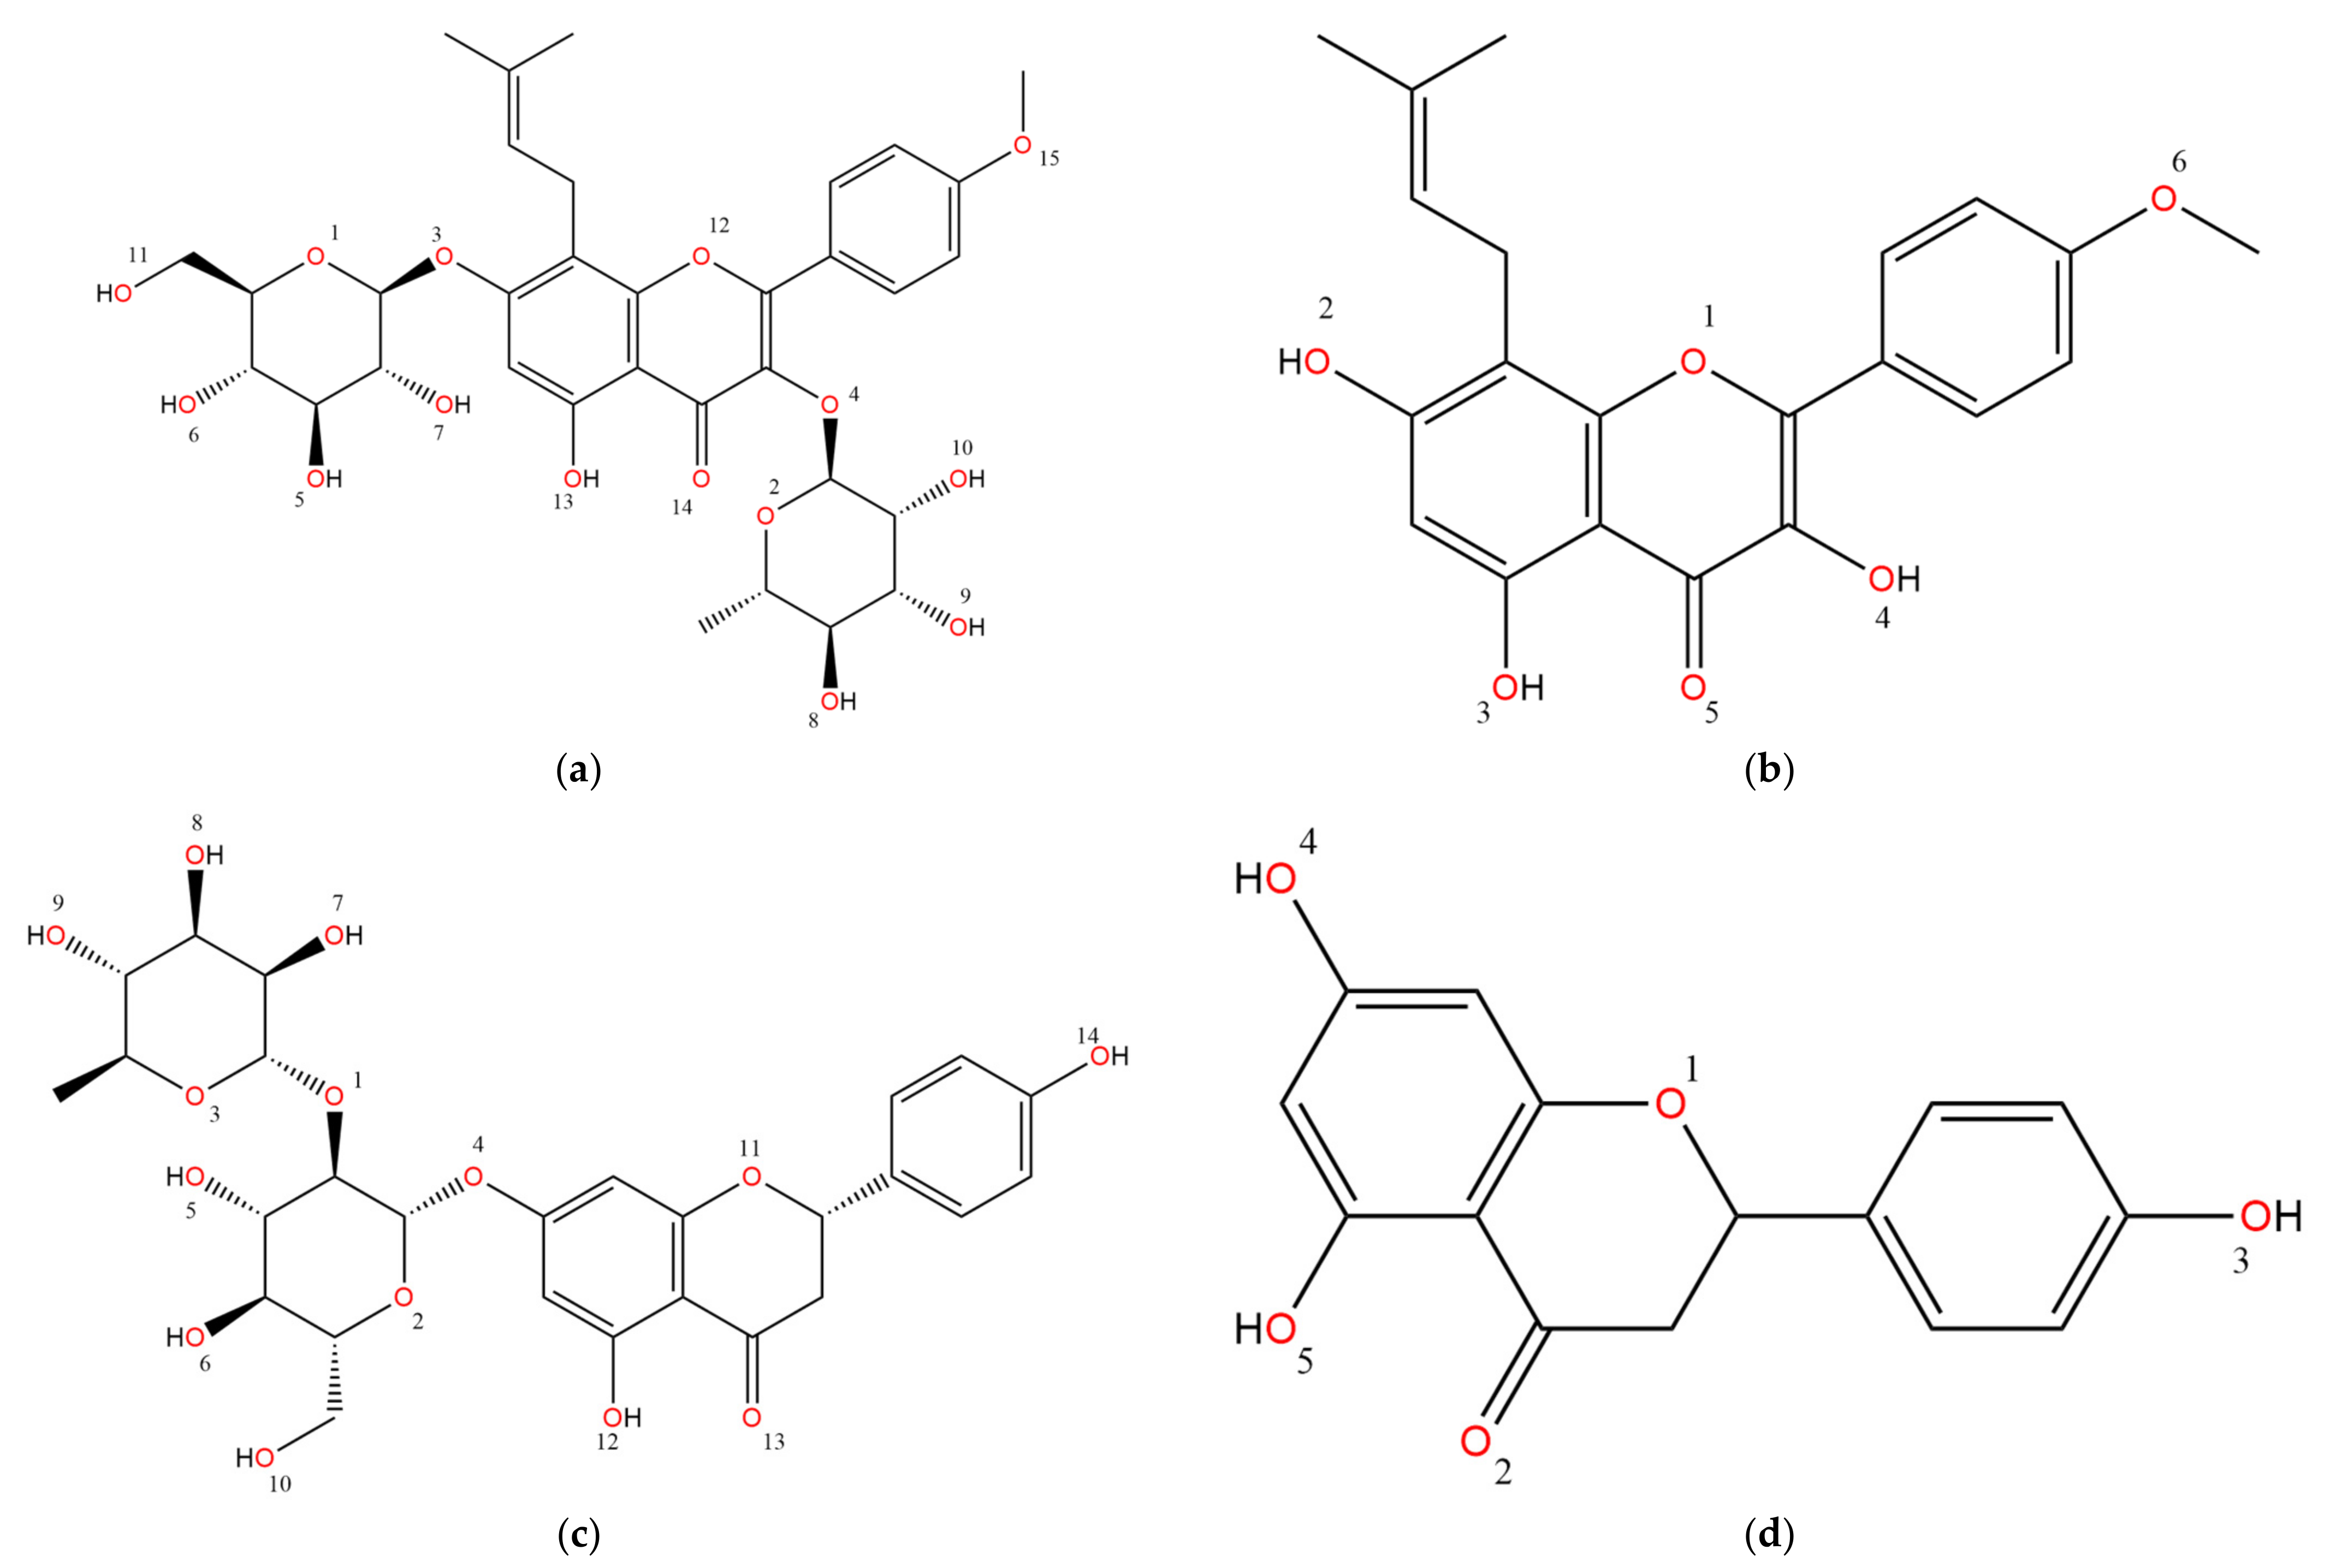
Figure 1. Chemical representation of (a) icariin, (b) icaritin, (c) naringin, and (d) naringenin molecules.
Biophysica 01 00033 g001
Figure 2. Interactions between (a) icariin, (b) icaritin, (c) naringin, and (d) naringenin molecules with AbTYR residues. Ligands are shown as lines and tyrosinase residues as spheres. Interactions were rendered with Discovery Studio visualizer v21.1.0.20298 (BIOVIA, San Diego, CA, USA [2020]).
Biophysica 01 00033 g002
Figure 3. The ligands (a) icariin (green) and (b) icaritin (magenta) bound to AbTYR are shown as sticks, while Cu ions (magenta) and the conserved water (red) are shown as spheres. Protein surfaces were rendered with PyMOL.
Biophysica 01 00033 g003
Figure 4. RMSD vs. time for all atoms in (a) icariin and (b) icaritin (aglycone) complexes with tyrosinase as a function of simulation time, (c) COM plot of tyrosinase in complex with icariin and icaritin, and (d) RMSF plot of tyrosinase residues in their complexes with icariin and icaritin.
Biophysica 01 00033 g004
Figure 5. The ligands (a) naringin (green) and (b) naringenin (magenta) bound to AbTYR are shown as sticks, while Cu ions (magenta) and the conserved water (red) are shown as spheres. Protein surfaces were rendered with PyMOL.
Biophysica 01 00033 g005aBiophysica 01 00033 g005b
Figure 6. RMSD vs. time for all atoms in (a) naringin and (b) naringenin (aglycone) complexes with tyrosinase as a function of simulation time, (c) COM plot of tyrosinase in complex with naringin and narinengin, and (d) RMSF plot of tyrosinase residues in their complexes with naringin and narinengin.
Biophysica 01 00033 g006
Table 1. Screening results categories.
CategoryCompound
Chalcones
Biophysica 01 00033 i001
Flavokawain A
Butein
Licochalcone B
Flavokawain C
Cardamonin
2′-O-methylhelichrysetin
Helichrysetin
2,2′,4′-trihydroxychalcone
Isoliquiritigenin
3-Phenylumbelliferone
Coumarins
Biophysica 01 00033 i002
5,7-dihydroxy-4-methylcoumarin
Biochanin A
3-carbethoxyumbeliferone
Genistein
7-Hydroxy-3-(4-methoxyphenyl) chromen-2-one
3-(3-Chlorophenyl)-7-hydroxychromen-2-one
3-(3-Chlorophenyl)-7-hydroxy-4-methylchromen-2-one
7-Hydroxy-3-(4-methoxyphenyl)-4-methylcoumarin
3-(4-Chlorophenyl)-7-hydroxychromen-2-one
3-(2-Chlorophenyl)-7-hydroxy-4-methylchromen-2-one
3-(4-Chlorophenyl)-7-hydroxy-4-methylchromen-2-one
Dihydrochalcone
Biophysica 01 00033 i003
Phloretin
2-(4-Methoxyphenyl)-1-(2,4,6-trihydroxyphenyl) ethanone
2-(2,4-Dichlorophenyl)-1-(2,4-dihydroxyphenyl) ethanone
2-Phenyl-1-(2,4,6-trihydroxyphenyl) ethanone
O-desmethlyangolesin
Ononetin
1-(2,4-Dihydroxyphenyl)-2-(4-hydroxyphenyl) ethanone
1-(2,4-Dihydroxyphenyl)-2-phenylethanone
1-(2,6-Dihydroxy-4-methoxyphenyl)-3-phenylpropan-1-one
Monocyclic phenol
Biophysica 01 00033 i004
Methylgallate
3-Amino-4-hydroxybenzoic acid
3-O-Methylgallic acid
Ethyl protocatechuate
3,4-Dihydroxybenzaldehyde
Protocatehuic acid
Syringaldehyde
Prenylated flavonoid
Biophysica 01 00033 i005
Isoxanthohumol
Icaritin *
8-Prenylnaringenin
* Screening resulted in isoanhydroicaritin, which was not commercially available.
Table 2. Docking results—aglycons (ascending FEB).
CompoundFEB (kcal/mol)Ki (nM)FQ
Biophysica 01 00033 i006Icaritin−8.95273.090.662
Biophysica 01 00033 i007Phloretin−8.33787.060.653
Biophysica 01 00033 i008Butein−8.0512600.631
Biophysica 01 00033 i009Helichrysetin−7.819100.606
Biophysica 01 00033 i010Caffeic acid−7.5529000.667
Biophysica 01 00033 i011Isoliquiritigenin−7.4634300.591
Biophysica 01 00033 i012Biochanin A−7.437400.575
Biophysica 01 00033 i013Naringenin−7.3342200.575
Biophysica 01 00033 i014Genistein−7.0369800.552
Biophysica 01 00033 i015Gallic acid−773500.640
Biophysica 01 00033 i016Protocatechuic acid−6.5116,9100.622
Table 3. Docking results—glucosides (ascending FEB).
CompoundFEB (kcal/mol)Ki (nM)FQ
Biophysica 01 00033 i017Icariin−12.480.70.806
Biophysica 01 00033 i018Coreopsin−11.882.00.853
Biophysica 01 00033 i019Astroside−10.959.40.781
Biophysica 01 00033 i020Genistein glucoside−10.7114.20.769
Biophysica 01 00033 i021Isoliquiritigenin 4′-O-glucoside 4-O-apiofuranosyl-1′-glucoside−10.7114.10.684
Biophysica 01 00033 i022Naringin−10.6810.80.732
Biophysica 01 00033 i023Chlorogenic acid−10.6116.70.796
Biophysica 01 00033 i024Phlorizin−10.4222.90.749
Biophysica 01 00033 i025Helichrysetin 4,4′-di-O-α-glucoside−9.22174.70.614
Biophysica 01 00033 i026Protocatechuic acid 3-glucoside−8.78366.90.675
Biophysica 01 00033 i0274-Glucogallic acid−8.31805.90.634
Publisher’s Note: MDPI stays neutral with regard to jurisdictional claims in published maps and institutional affiliations.