
Glycosidic vs. Aglycol Form of Natural Products as Putative Tyrosinase Inhibitors


Abstract
:
1. Introduction
2. Materials and Methods
2.1. Ligand Screening
2.2. Molecular Docking
2.2.1. Preparation of the Macromolecule
2.2.2. Docking Parameters
2.3. Moleculad Dynamics
System Setup and Simulation Protocol
3. Results
3.1. Ligand Screening
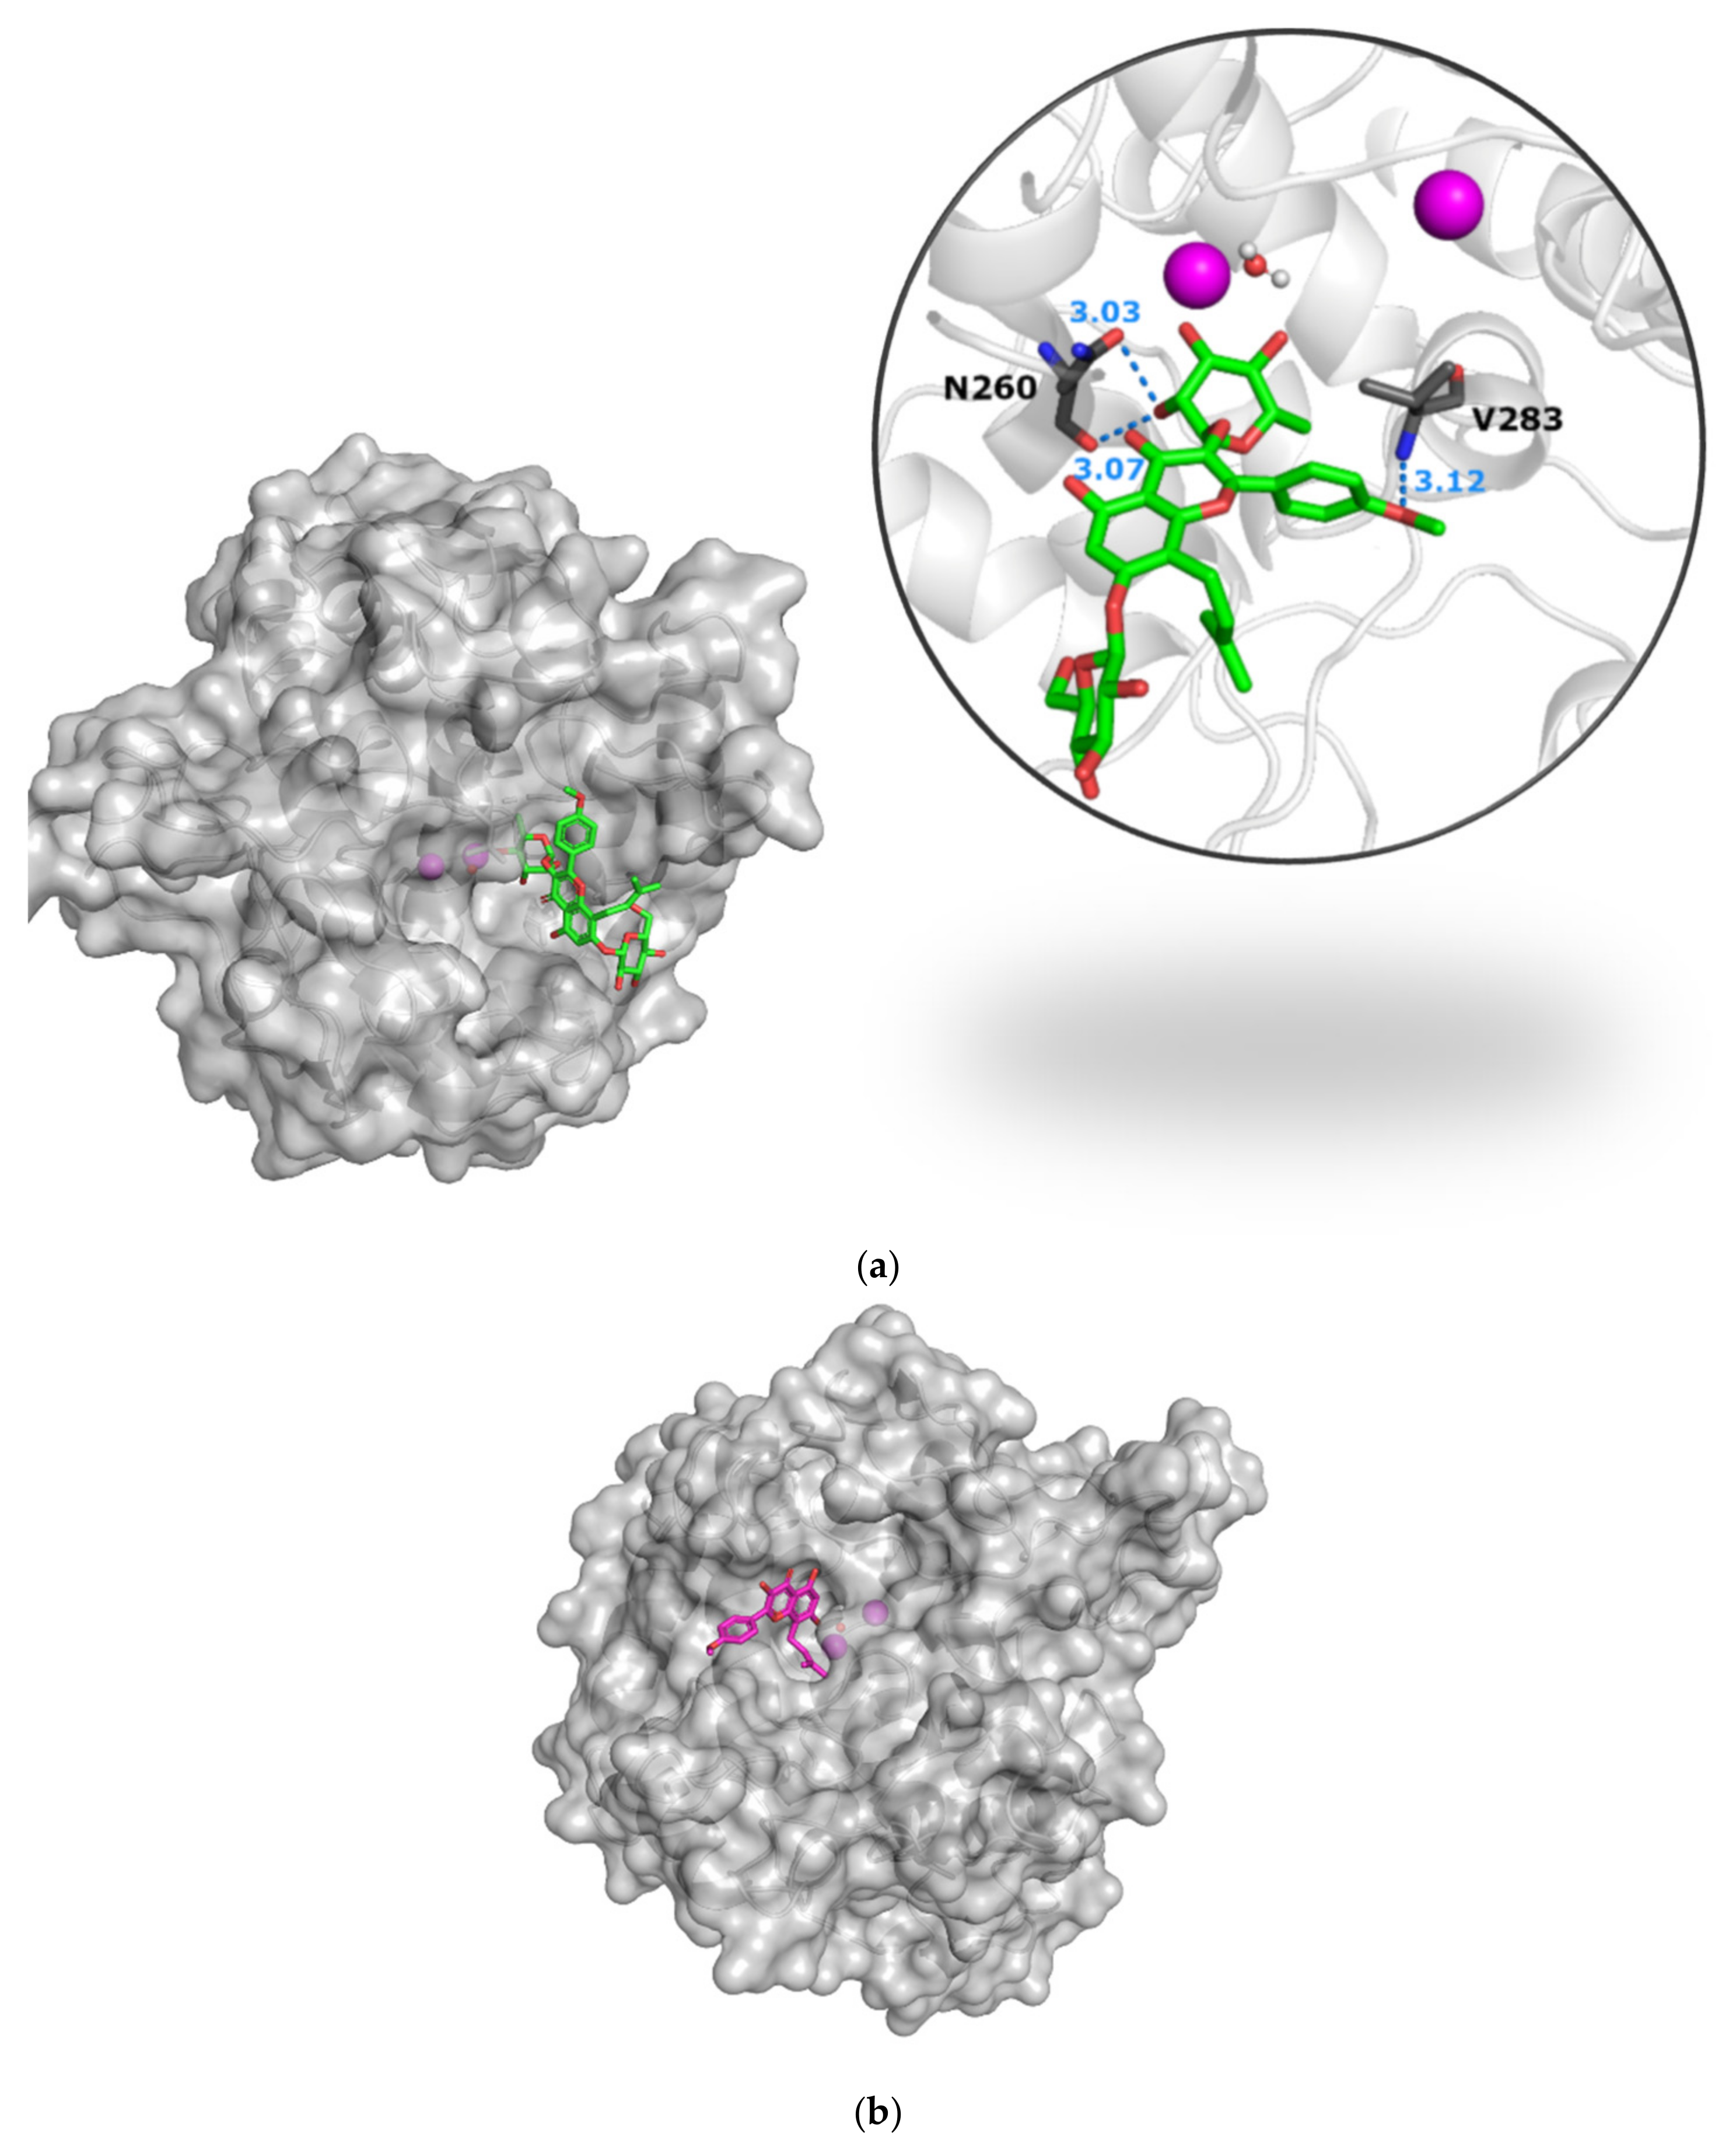
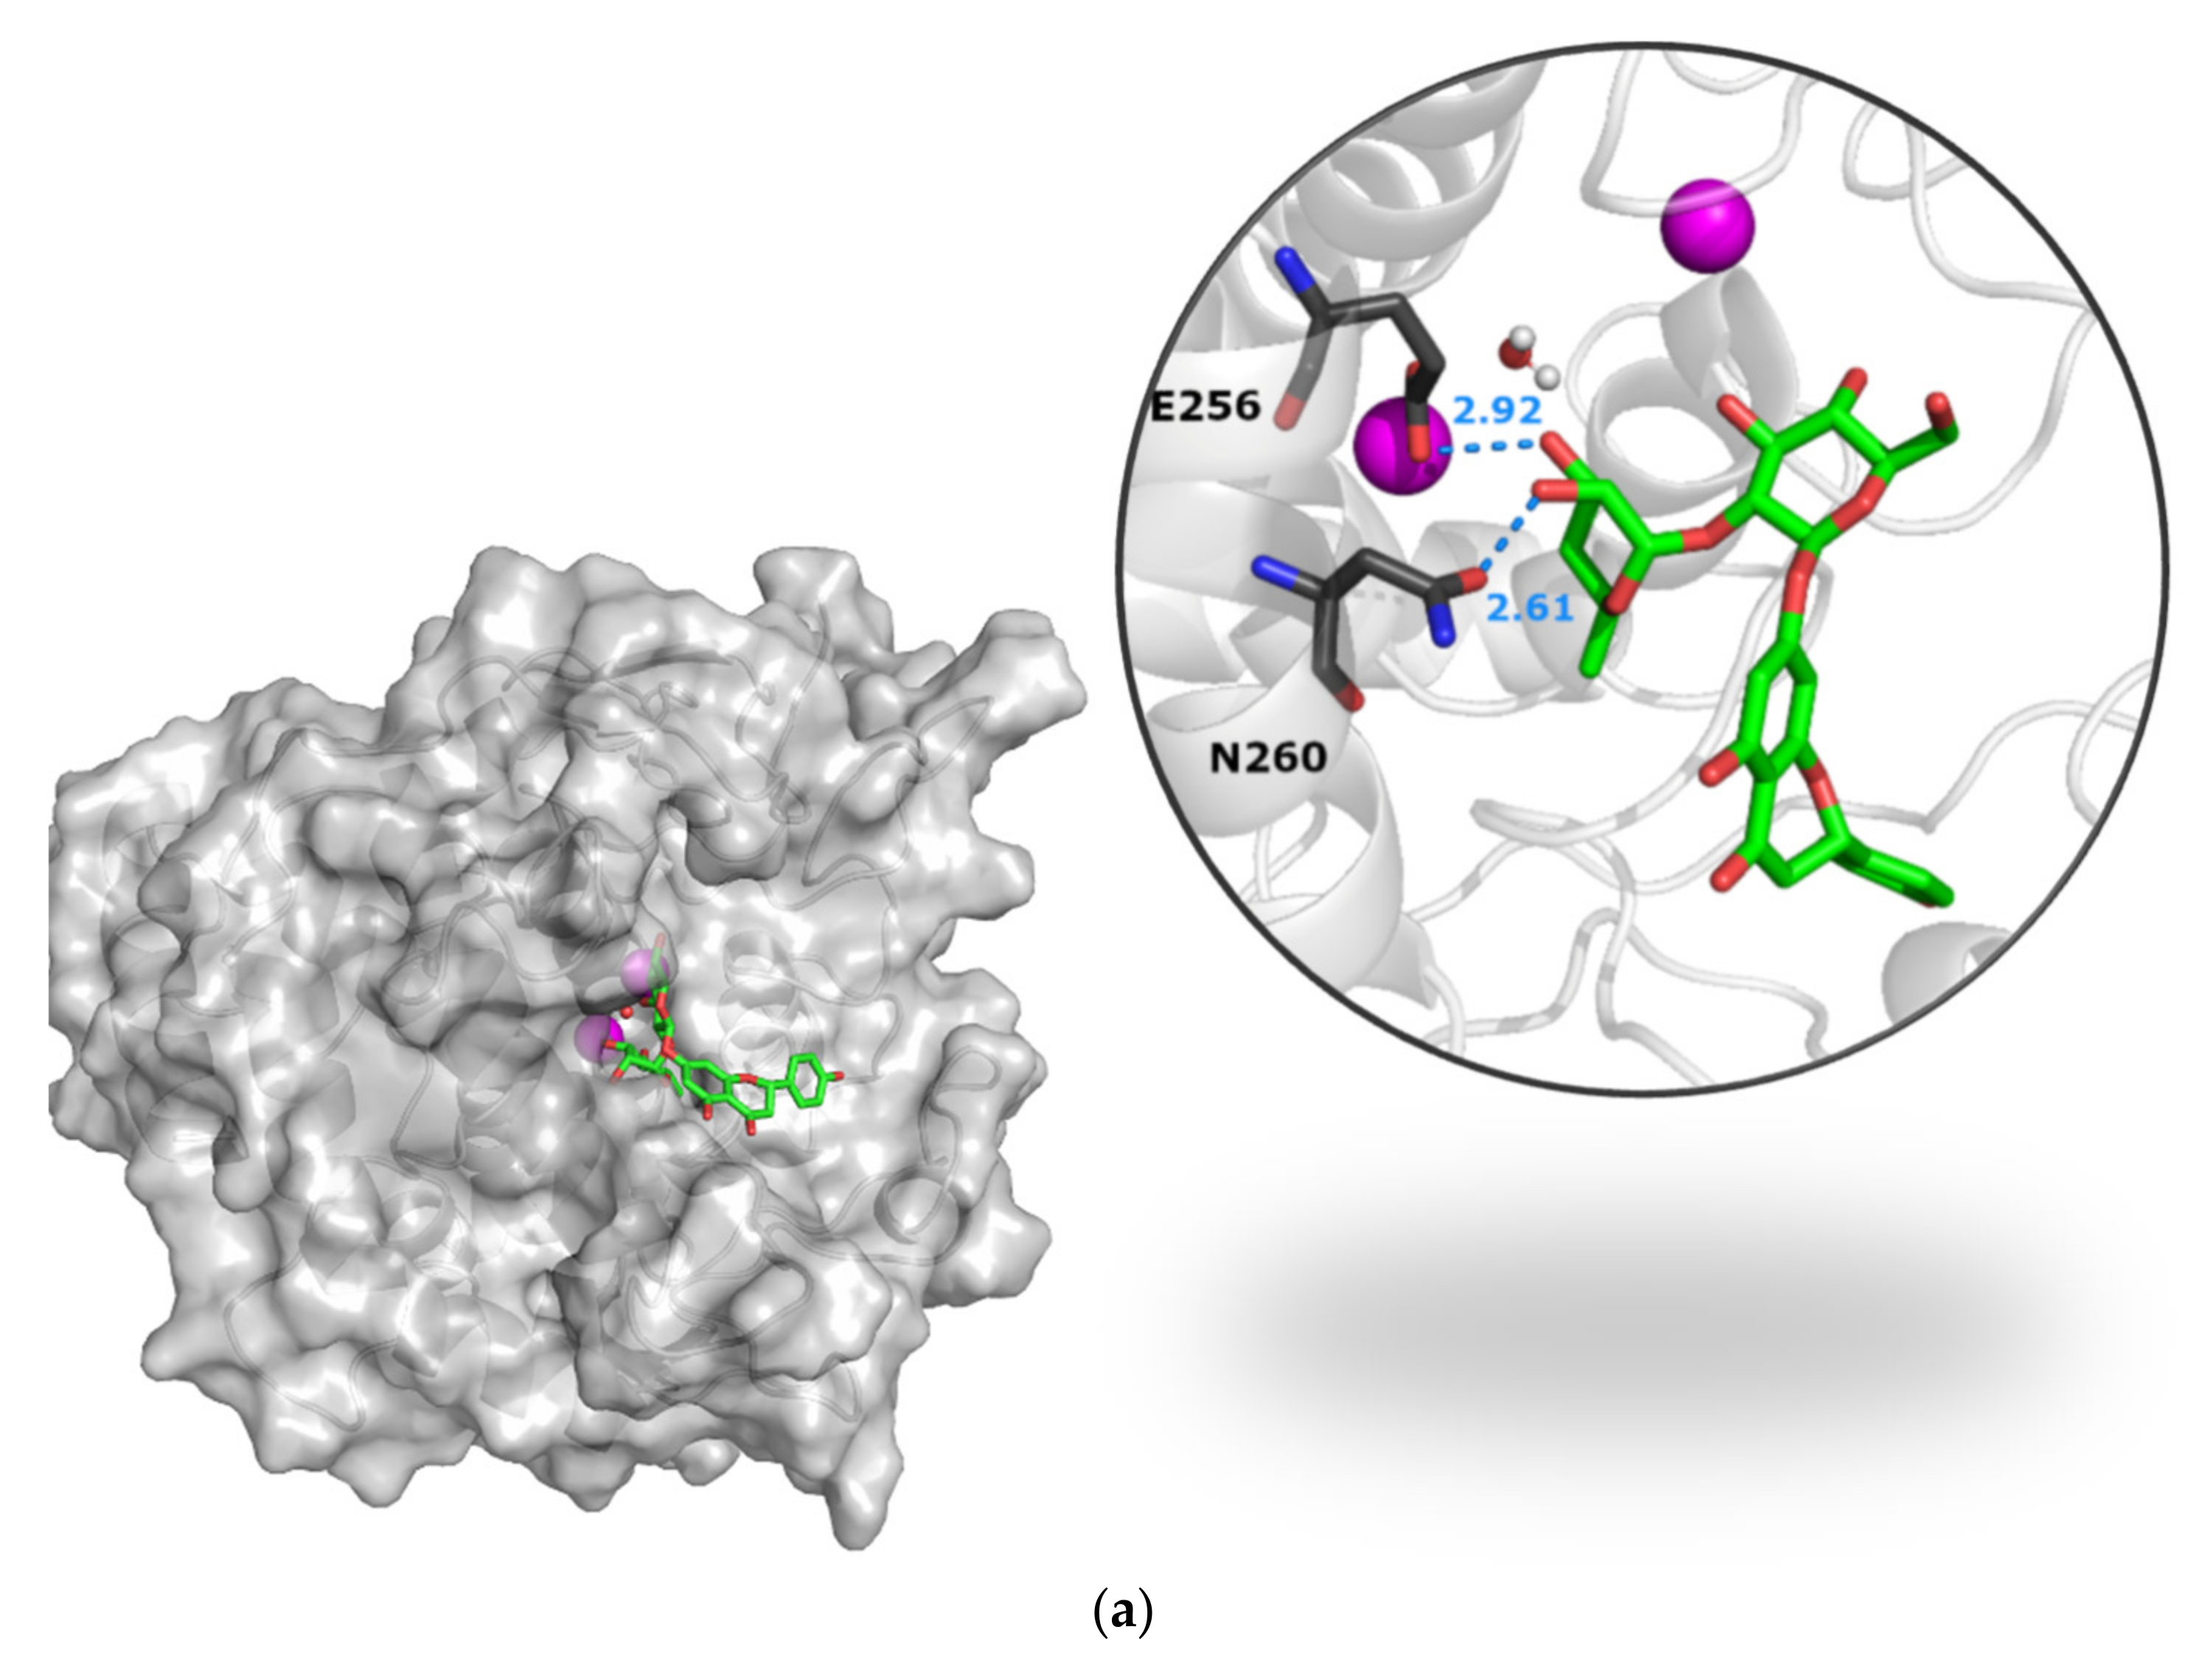
3.2. Molecular Docking
Parentals and Screening Resulting Compounds
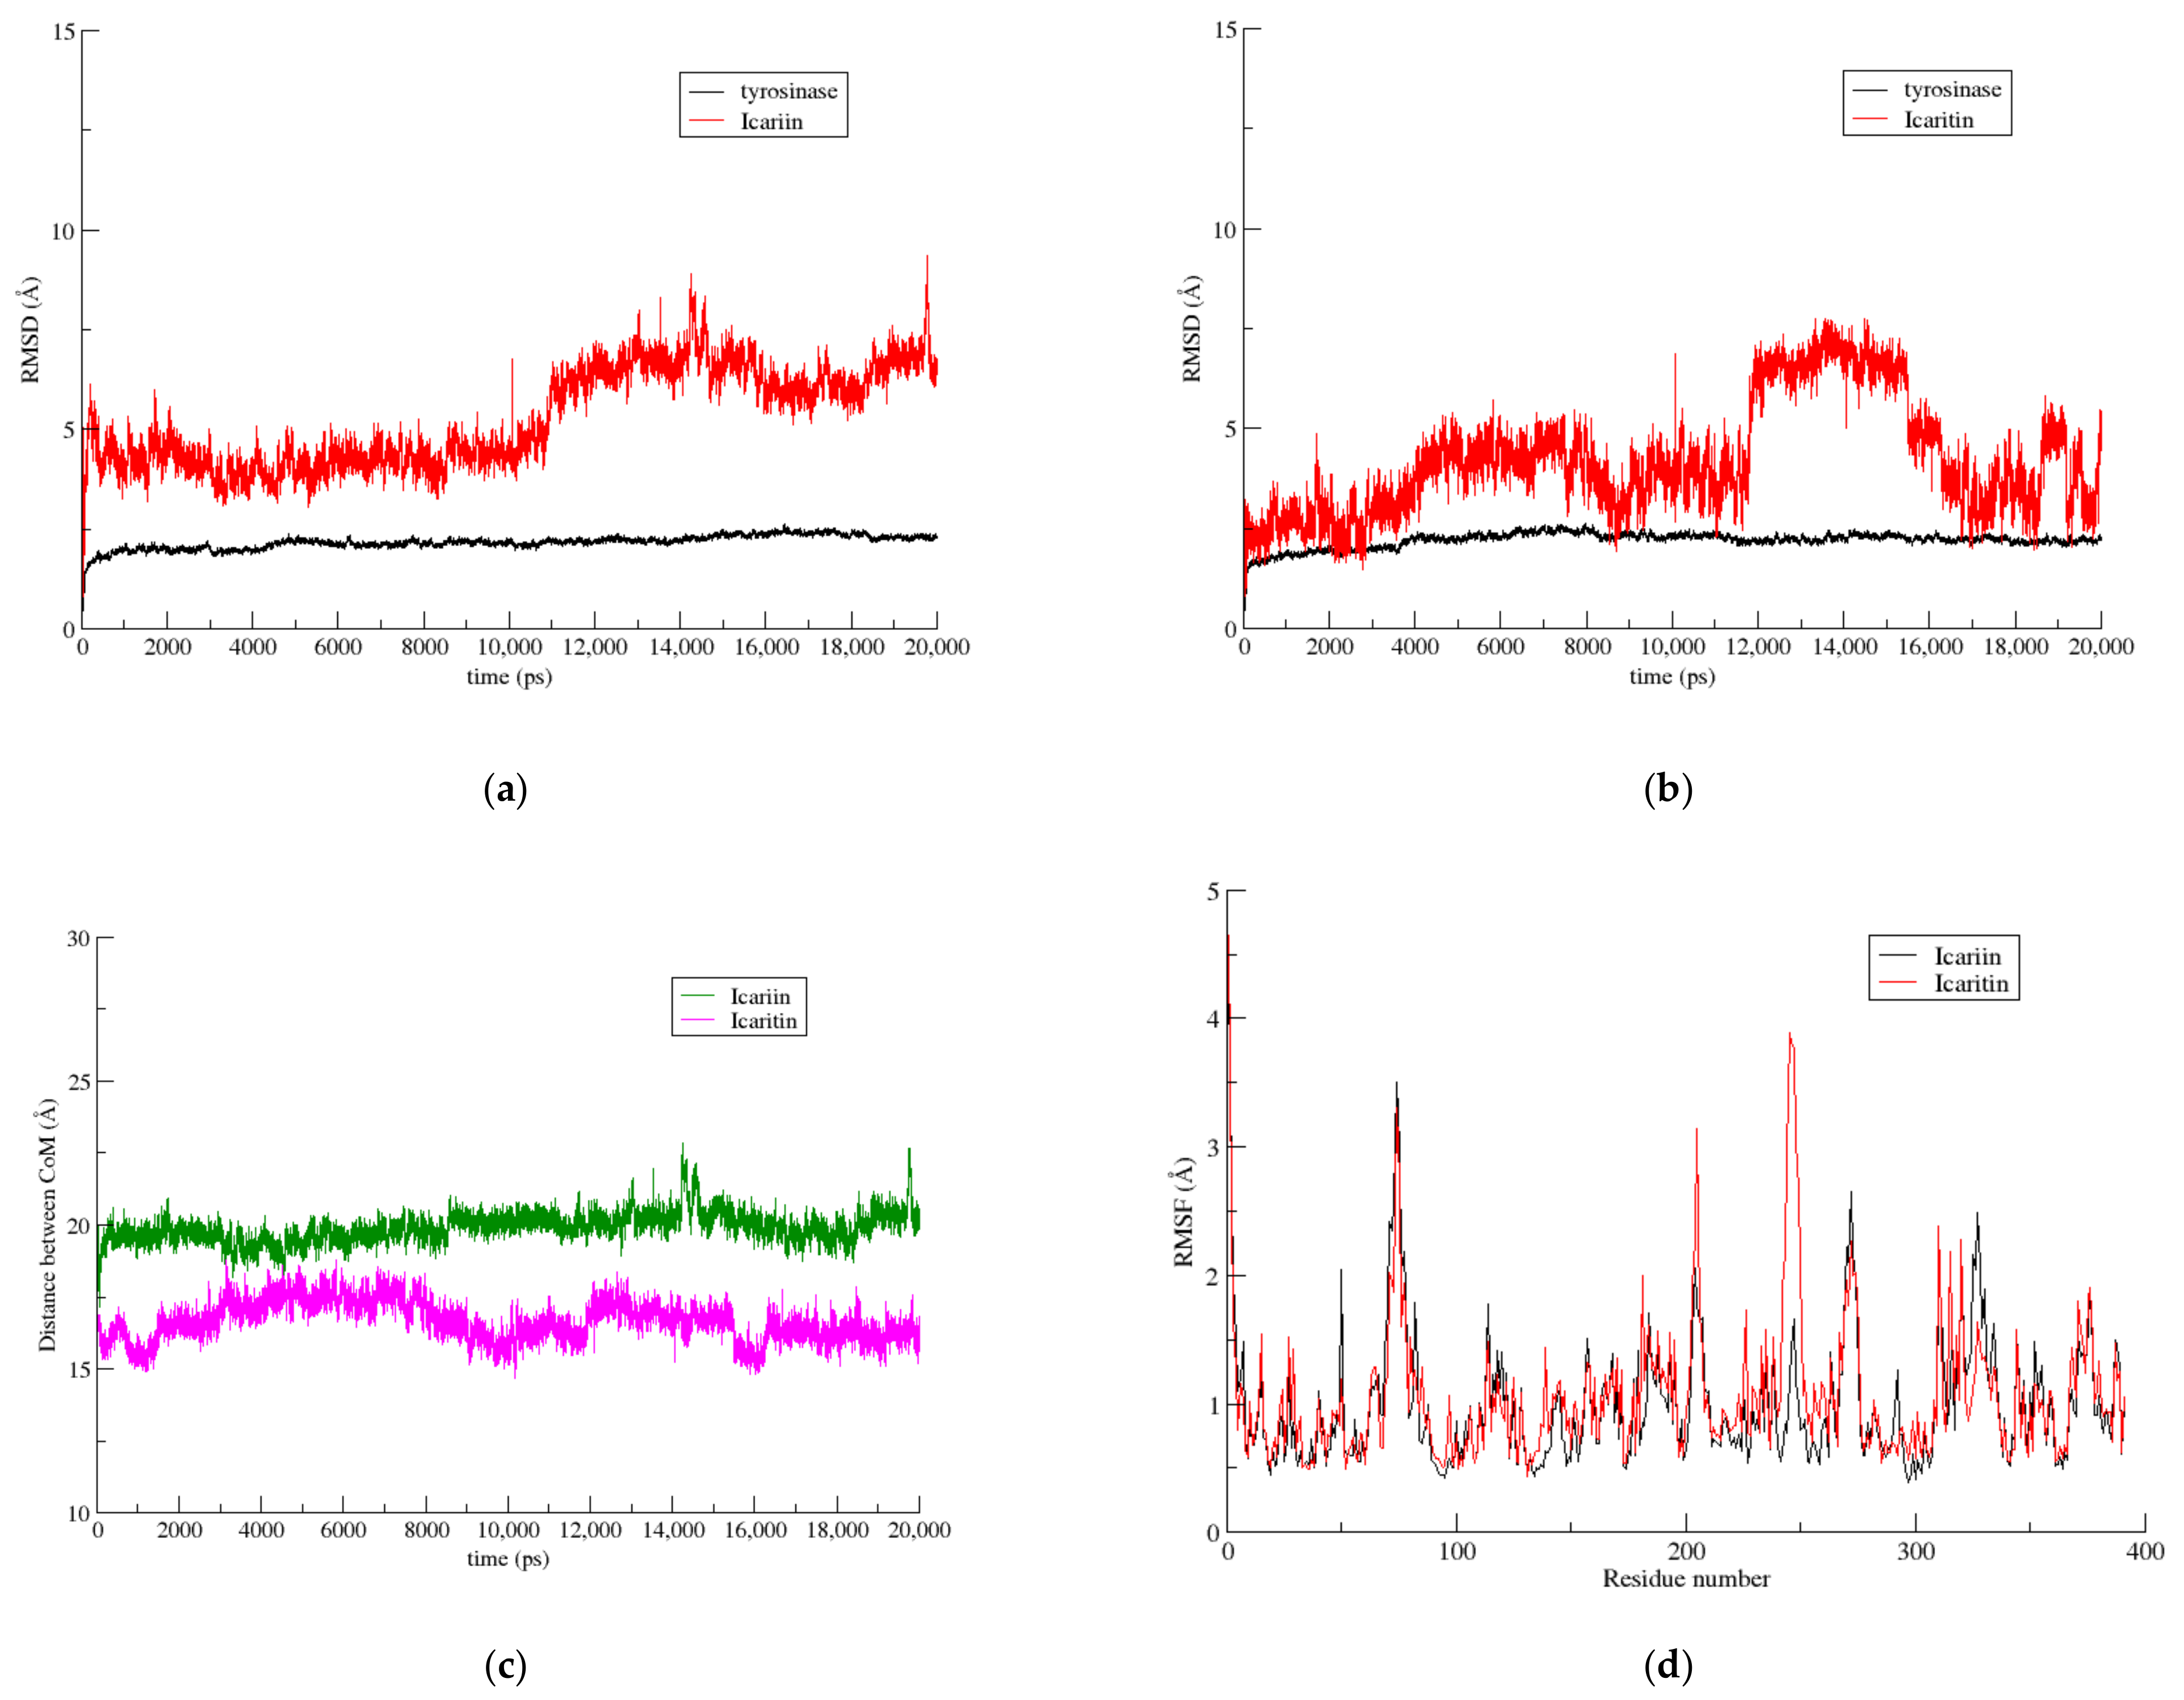
3.3. Molecular Dynamics
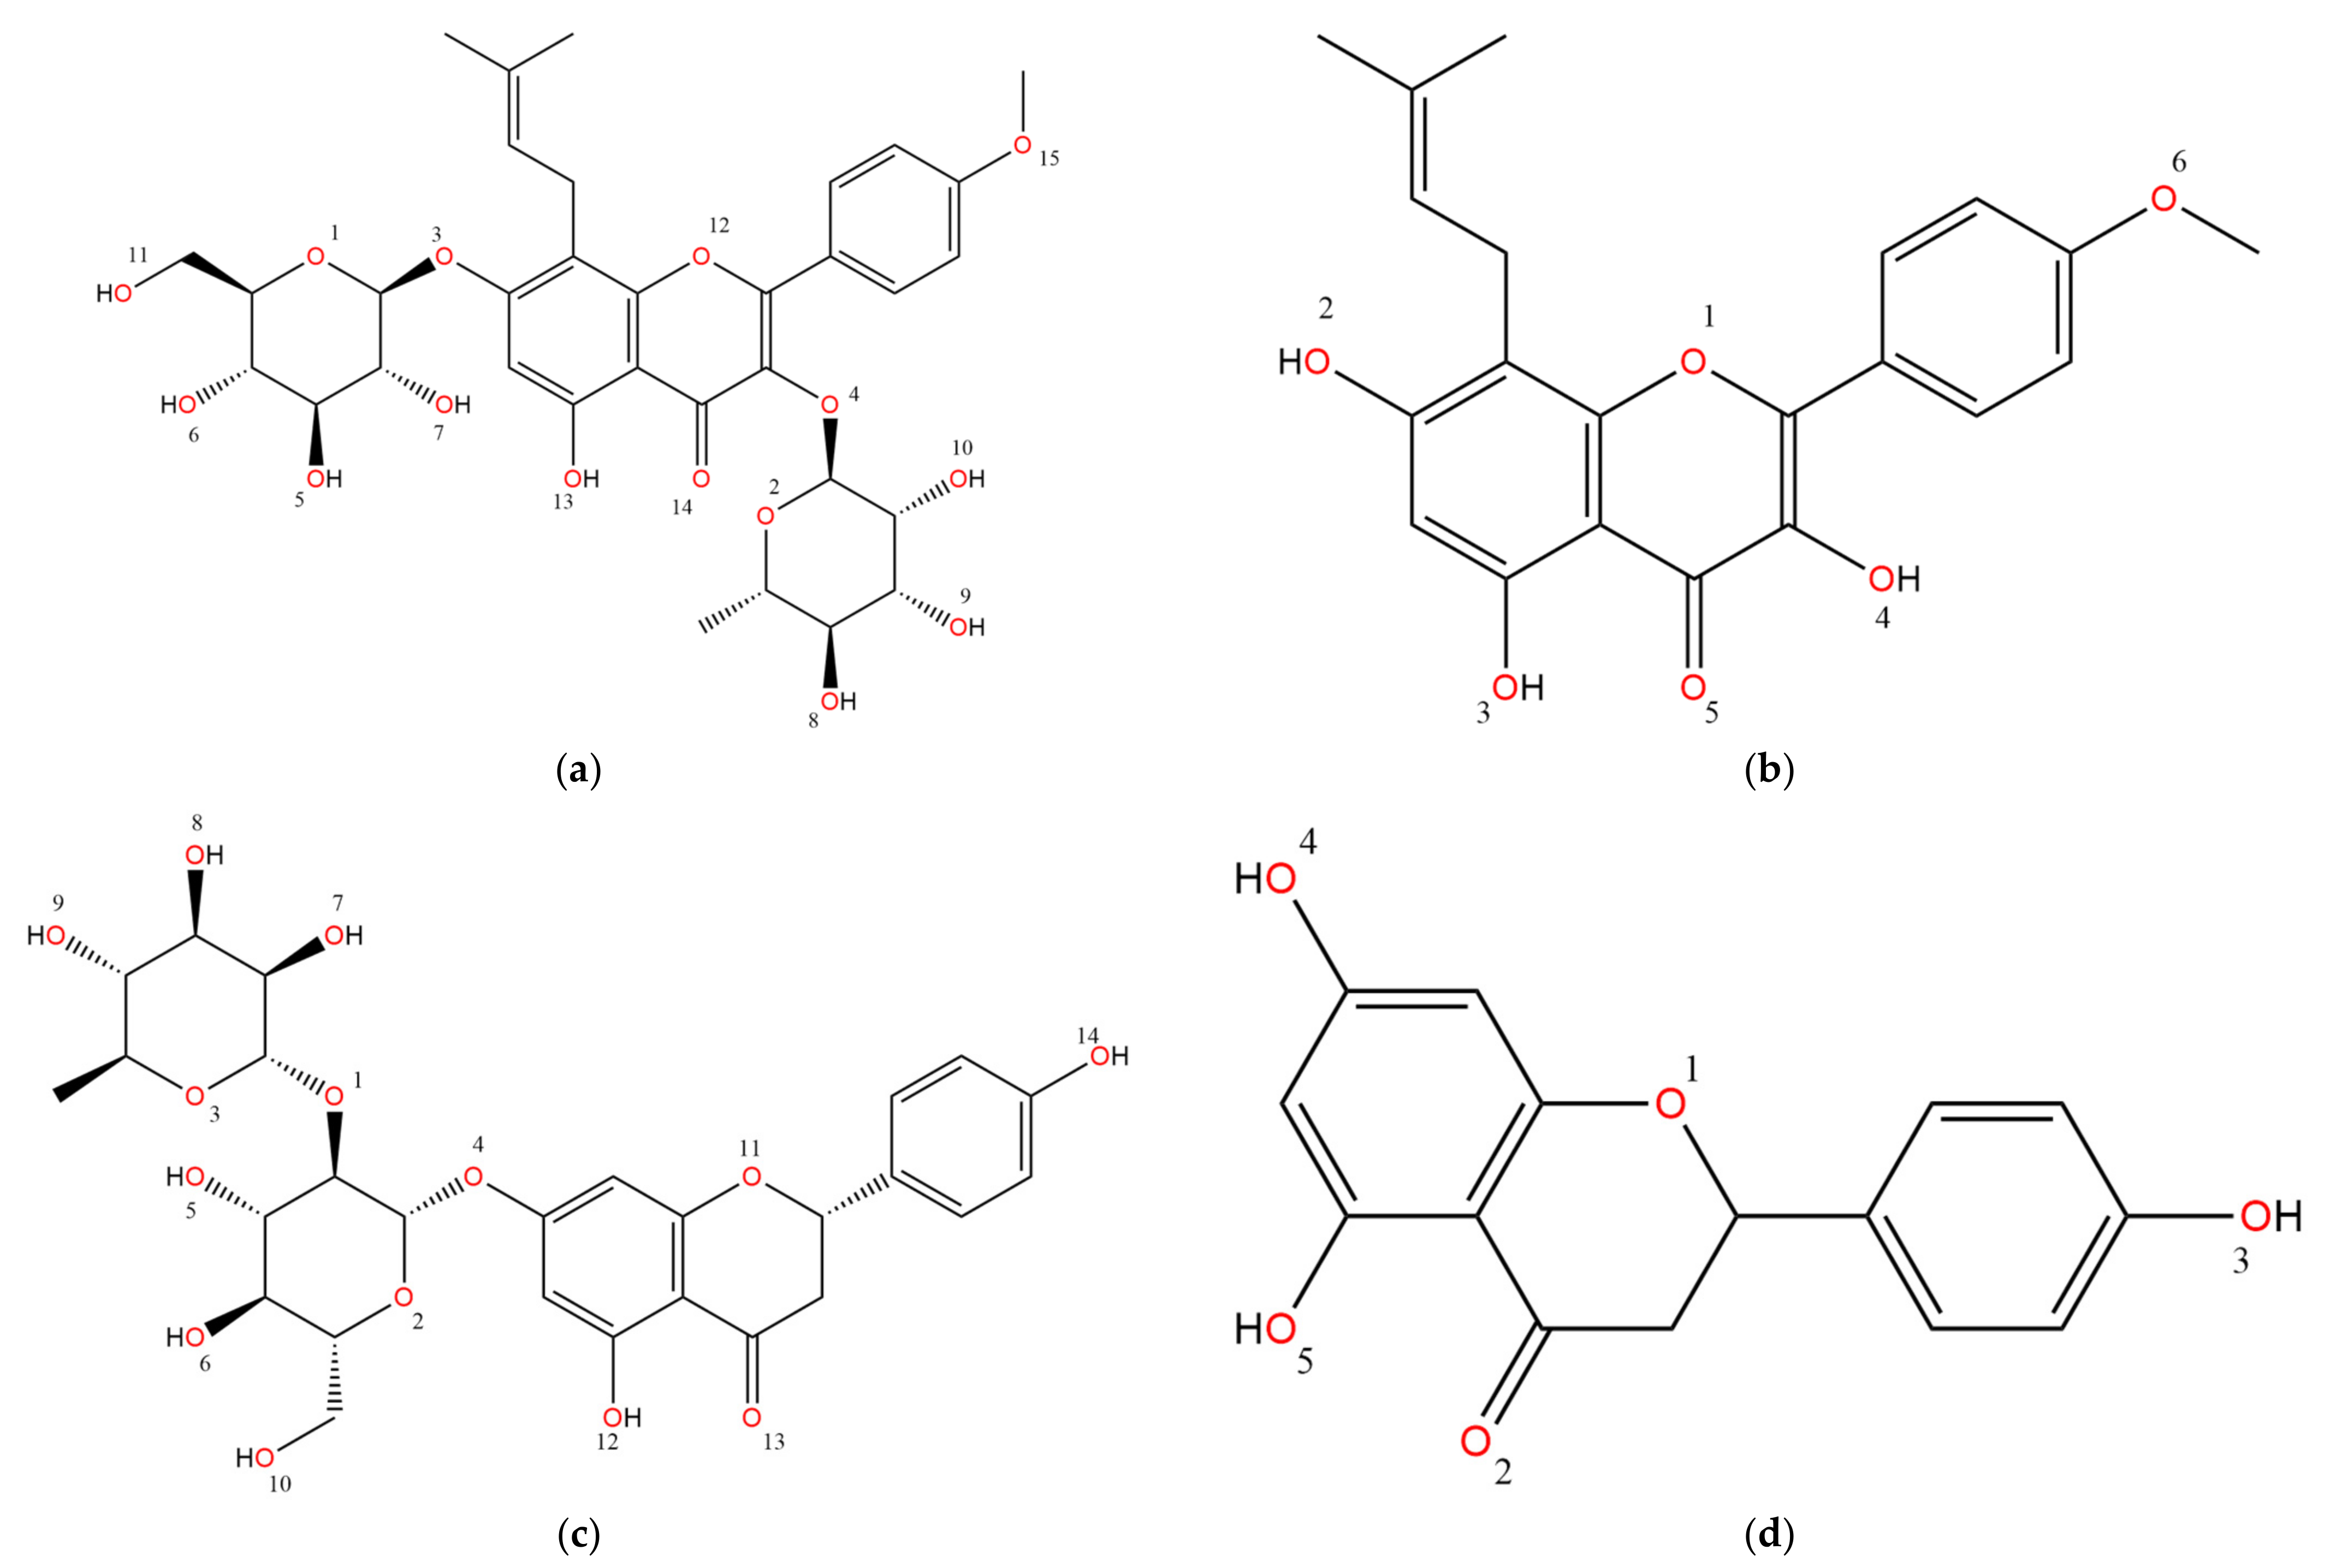
3.3.1. The Icariin–Icaritin Pair
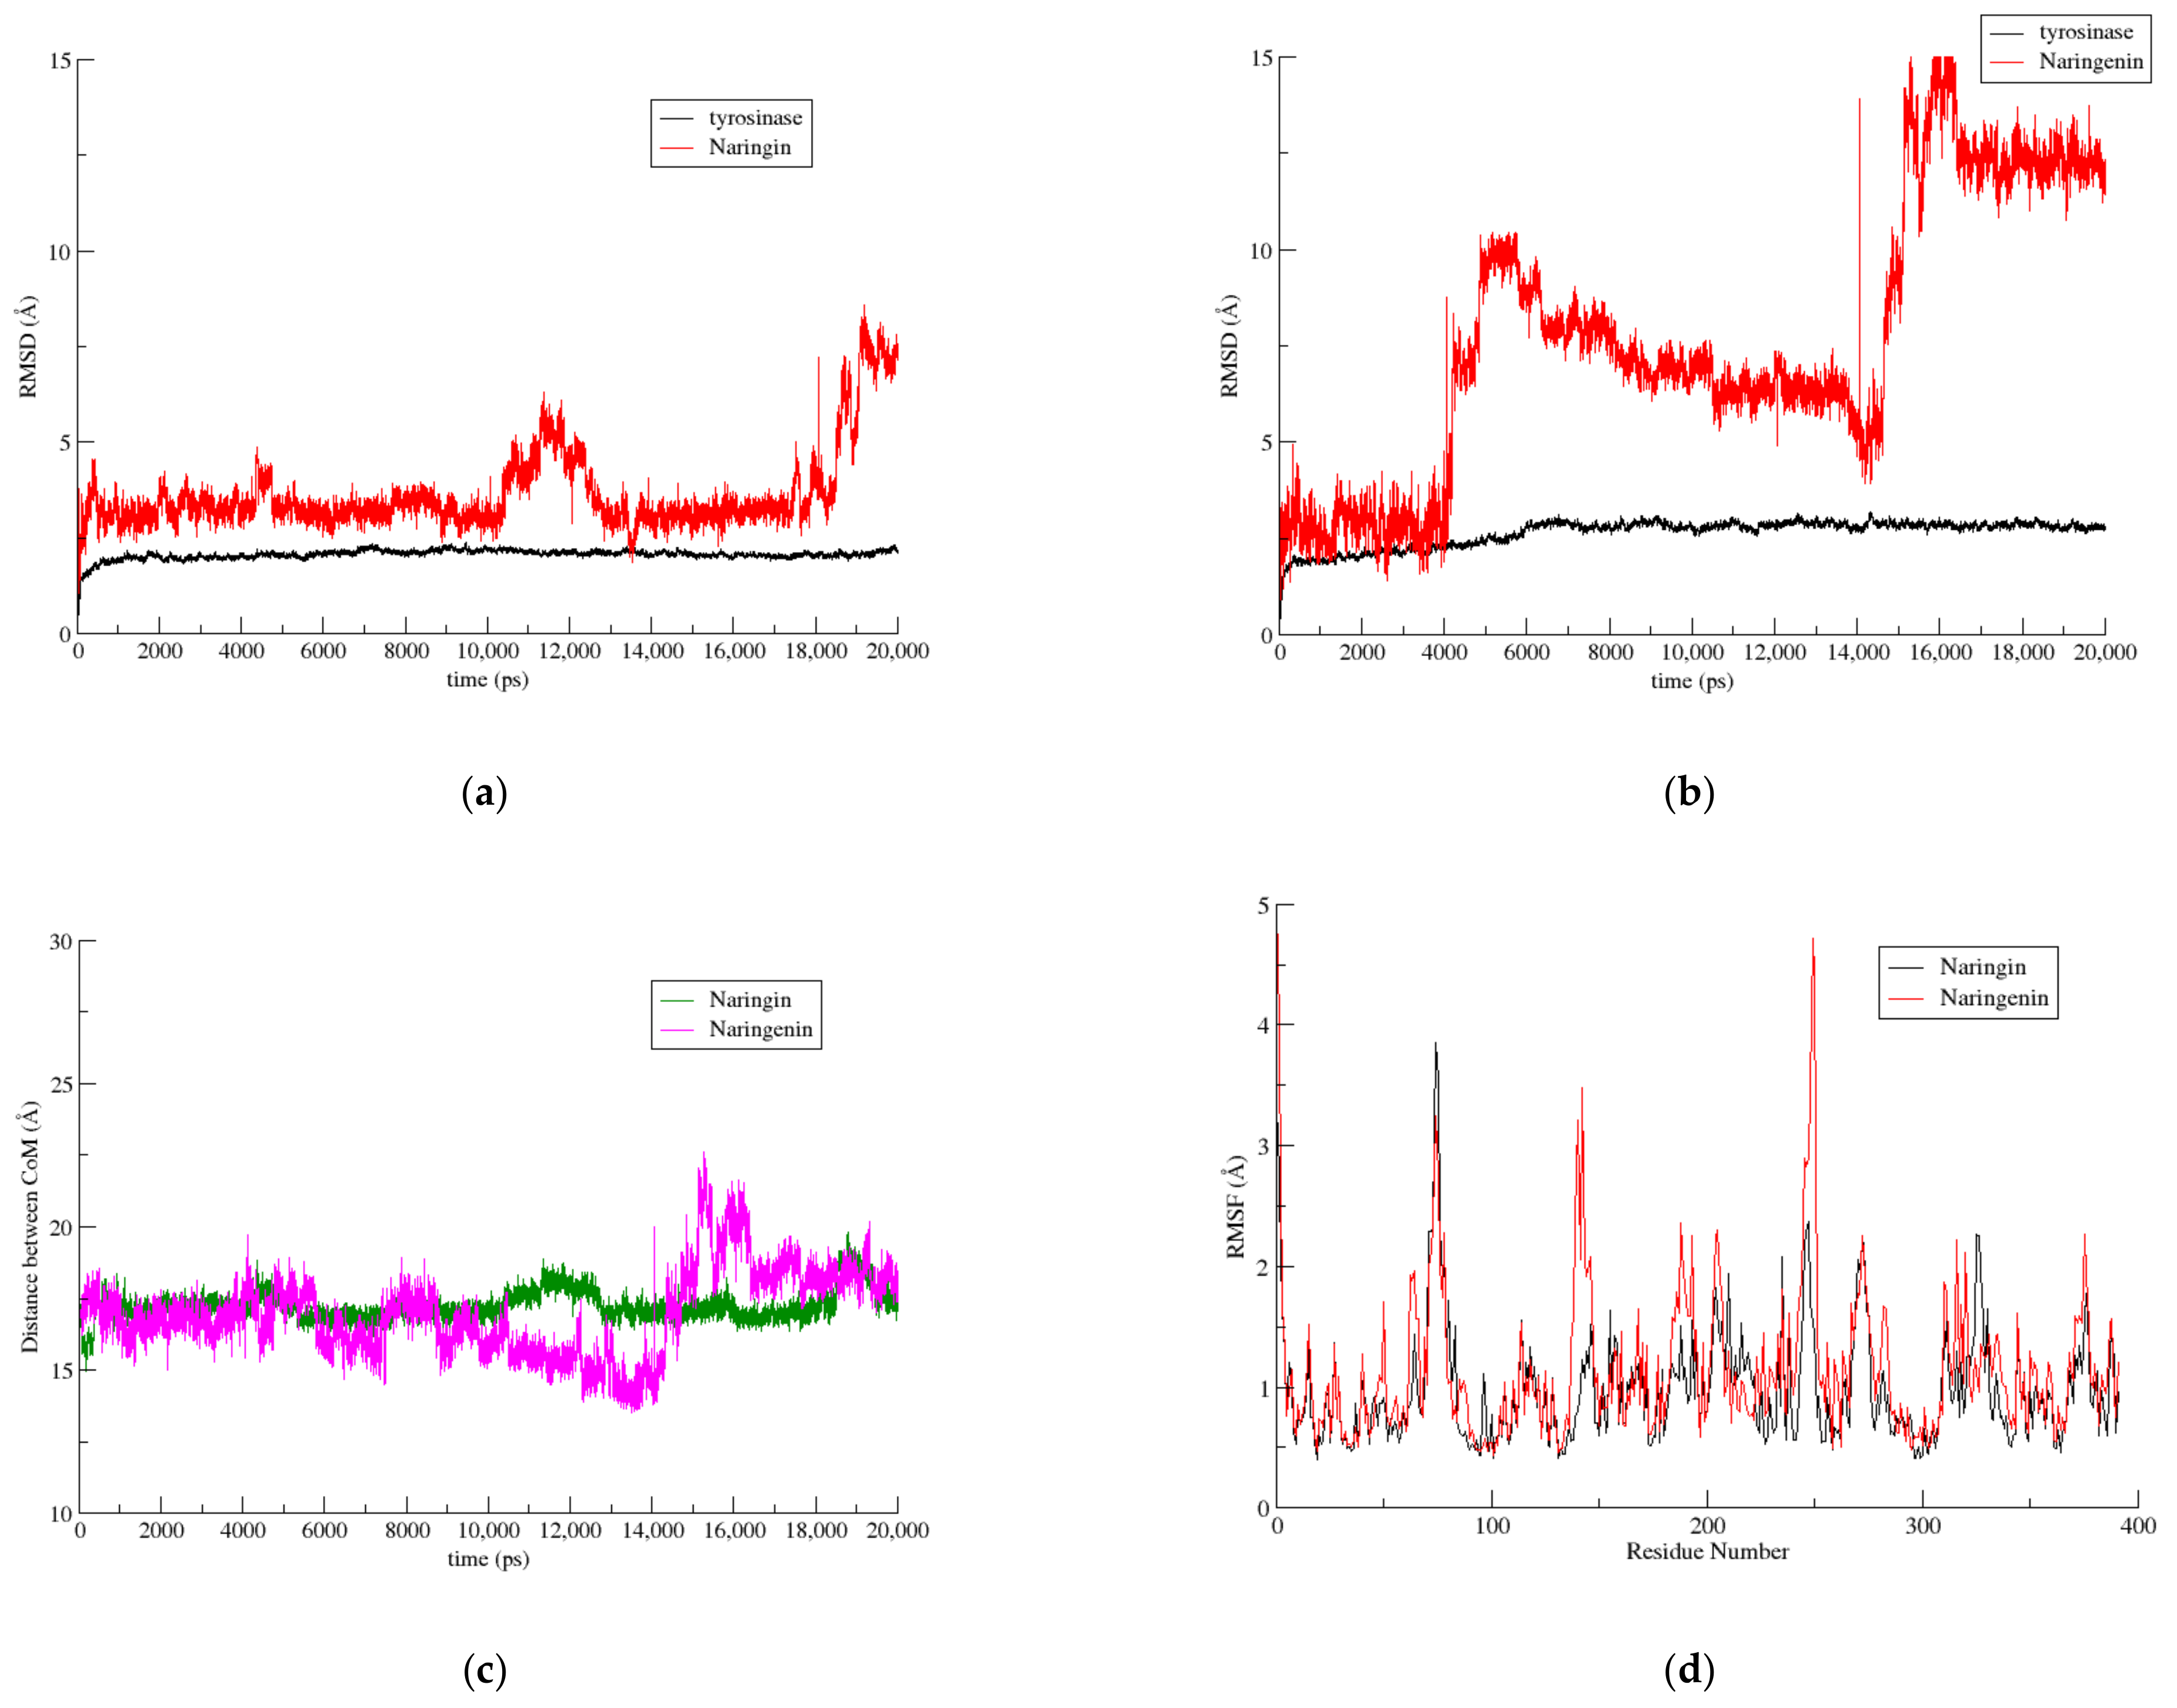
3.3.2. The Naringin–Naringenin Pair
4. Discussion
5. Conclusions
Supplementary Materials
Author Contributions
Funding
Data Availability Statement
Acknowledgments
Conflicts of Interest
References
- Ramsden, C.A.; Riley, P.A. Tyrosinase: The four oxidation states of the active site and their relevance to enzymatic activation, oxidation and inactivation. Bioorganic Med. Chem. 2014, 22, 2388–2395. [Google Scholar] [CrossRef]
- Martinez, M.; Whitaker, J.R. The biochemistry and control of enzymatic browning. Trends Food Sci. Technol. 1995, 6, 195–200. [Google Scholar] [CrossRef]
- Sánchez-Ferrer, A.; Rodríguez-López, J.N.; Garcia-Canovas, F.; García-Carmona, F. Tyrosinase: A comprehensive review of its mechanism. Biochim. Biophys. Acta Protein Struct. Mol. Enzym. 1995, 1247, 1–11. [Google Scholar] [CrossRef]
- Cavalieri, E.L.; Li, K.-M.; Balu, N.; Saeed, M.; Devanesan, P.; Higginbotham, S.; Zhao, J.; Gross, M.L.; Rogan, E.G. Catechol ortho-quinones: The electrophilic compounds that form depurinating DNA adducts and could initiate cancer and other diseases. Carcinogenesis 2002, 23, 1071–1077. [Google Scholar] [CrossRef] [Green Version]
- Loizzo, M.R.; Tundis, R.; Menichini, F. Natural and Synthetic Tyrosinase Inhibitors as Antibrowning Agents: An Update. Compr. Rev. Food Sci. Food Saf. 2012, 11, 378–398. [Google Scholar] [CrossRef]
- Panzella, L.; Napolitano, A. Natural and Bioinspired Phenolic Compounds as Tyrosinase Inhibitors for the Treatment of Skin Hyperpigmentation: Recent Advances. Cosmetics 2019, 6, 57. [Google Scholar] [CrossRef] [Green Version]
- Ismaya, W.T.; Rozeboom, H.J.; Weijn, A.; Mes, J.J.; Fusetti, F.; Wichers, H.J.; Dijkstra, B.W. Crystal Structure of Agaricus bisporus Mushroom Tyrosinase: Identity of the Tetramer Subunits and Interaction with Tropolone. Biochemistry 2011, 50, 5477–5486. [Google Scholar] [CrossRef] [Green Version]
- Bagherzadeh, K.; Talari, F.S.; Sharifi, A.; Ganjali, M.R.; Saboury, A.A.; Amanlou, M. A new insight into mushroom tyrosinase inhibitors: Docking, pharmacophore-based virtual screening, and molecular modeling studies. J. Biomol. Struct. Dyn. 2014, 33, 487–501. [Google Scholar] [CrossRef] [PubMed]
- Rachmawati, H.; Sundari, S.; Nabila, N.; Tandrasasmita, O.M.; Amalia, R.; Siahaan, T.J.; Tjandrawinata, R.R.; Ismaya, W.T. Orf239342 from the mushroom Agaricus bisporus is a mannose binding protein. Biochem. Biophys. Res. Commun. 2019, 515, 99–103. [Google Scholar] [CrossRef]
- Dini, I.; Laneri, S. The New Challenge of Green Cosmetics: Natural Food Ingredients for Cosmetic Formulations. Molecules 2021, 26, 3921. [Google Scholar] [CrossRef]
- Khan, R.A. Natural products chemistry: The emerging trends and prospective goals. Saudi Pharm. J. 2018, 26, 739–753. [Google Scholar] [CrossRef]
- Lee, S.Y.; Baek, N.; Nam, T.-G. Natural, semisynthetic and synthetic tyrosinase inhibitors. J. Enzym. Inhib. Med. Chem. 2016, 31, 1–13. [Google Scholar] [CrossRef]
- Masum, M.N.; Yamauchi, K.; Mitsunaga, T. Tyrosinase Inhibitors from Natural and Synthetic Sources as Skin-lightening Agents. Rev. Agric. Sci. 2019, 7, 41–58. [Google Scholar] [CrossRef] [Green Version]
- Burnett, C.L.; Bergfeld, W.F.; Belsito, D.V.; Hill, R.A.; Klaassen, C.D.; Liebler, D.; Marks, J.G.; Shank, R.C.; Slaga, T.J.; Snyder, P.W.; et al. Final Report of the Safety Assessment of Kojic Acid as Used in Cosmetics. Int. J. Toxicol. 2010, 29, 244S–273S. [Google Scholar] [CrossRef] [PubMed]
- Solano, F.; Briganti, S.; Picardo, M.; Ghanem, G. Hypopigmenting agents: An updated review on biological, chemical and clinical aspects. Pigment. Cell Res. 2006, 19, 550–571. [Google Scholar] [CrossRef] [PubMed]
- Matsumoto, T.; Nakajima, T.; Iwadate, T.; Nihei, K.-I. Chemical synthesis and tyrosinase-inhibitory activity of isotachioside and its related glycosides. Carbohydr. Res. 2018, 465, 22–28. [Google Scholar] [CrossRef] [PubMed]
- Fujitaka, Y.; Hamada, H.; Hamada, H.; Iwaki, T.; Shimoda, K.; Kiriake, Y.; Saikawa, T. Synthesis of Glycosides of α-Tocopherol, Daidzein, Resveratrol, Hesperetin, Naringenin, and Chrysin as Antiallergic Functional Foods and Cosmetics. Nat. Prod. Commun. 2020, 15, 1934578–2094466. [Google Scholar] [CrossRef]
- Sterling, T.; Irwin, J.J. ZINC 15—Ligand Discovery for Everyone. J. Chem. Inf. Model. 2015, 55, 2324–2337. [Google Scholar] [CrossRef] [PubMed]
- Hähnke, V.D.; Kim, S.; Bolton, E.E. PubChem chemical structure standardization. J. Chemin. 2018, 10, 36. [Google Scholar] [CrossRef] [PubMed]
- Hawkins, P.C.D.; Skillman, A.G.; Warren, G.L.; Ellingson, B.A.; Stahl, M.T. Conformer Generation with OMEGA: Algorithm and Validation Using High Quality Structures from the Protein Databank and Cambridge Structural Database. J. Chem. Inf. Model. 2010, 50, 572–584. [Google Scholar] [CrossRef] [PubMed]
- Hawkins, P.C.D.; Skillman, A.A.G.; Nicholls, A. Comparison of Shape-Matching and Docking as Virtual Screening Tools. J. Med. Chem. 2007, 50, 74–82. [Google Scholar] [CrossRef] [PubMed]
- Chen, Y.; Mathai, N.; Kirchmair, J. Scope of 3D Shape-Based Approaches in Predicting the Macromolecular Targets of Structurally Complex Small Molecules Including Natural Products and Macrocyclic Ligands. J. Chem. Inf. Model. 2020, 60, 2858–2875. [Google Scholar] [CrossRef] [PubMed]
- Laiolo, J.; Tomašič, T.; Vera, D.M.A.; González, M.L.; Lanza, P.A.; Gancedo, S.N.; Hodnik, Z.; Mašič, L.P.; Kikelj, D.; Carpinella, M.C. Analogues of the Lignan Pinoresinol as Novel Lead Compounds for P-glycoprotein (P-gp) Inhibitors. ACS Med. Chem. Lett. 2018, 9, 1186–1192. [Google Scholar] [CrossRef] [Green Version]
- Ibrahim, M.A.; Abdelrahman, A.H.; Hassan, A.M. Identification of novel Plasmodium falciparum PI4KB inhibitors as potential anti-malarial drugs: Homology modeling, molecular docking and molecular dynamics simulations. Comput. Biol. Chem. 2019, 80, 79–89. [Google Scholar] [CrossRef] [PubMed]
- The PyMOL Molecular Graphics System Version 2.4.0; Schrödinger LLC.: New York, NY, USA, 2020; Available online: http://www.pymol.org/pymol (accessed on 30 October 2021).
- Morris, G.M.; Huey, R.; Lindstrom, W.; Sanner, M.F.; Belew, R.K.; Goodsell, D.S.; Olson, A.J. AutoDock4 and AutoDockTools4: Automated docking with selective receptor flexibility. J. Comput. Chem. 2009, 30, 2785–2791. [Google Scholar] [CrossRef] [PubMed] [Green Version]
- Huey, R.; Morris, G.; Olson, A.J.; Goodsell, D.S. A semiempirical free energy force field with charge-based desolvation. J. Comput. Chem. 2007, 28, 1145–1152. [Google Scholar] [CrossRef]
- Bembenek, S.D.; Tounge, B.A.; Reynolds, C.H. Ligand efficiency and fragment-based drug discovery. Drug Discov. Today 2009, 14, 278–283. [Google Scholar] [CrossRef]
- Chen, V.B.; Arendall, W.B.I.; Headd, J.J.; Keedy, D.A.; Immormino, R.M.; Kapral, G.J.; Murray, L.W.; Richardson, J.S.; Richardson, D.C. MolProbity: All-atom structure validation for macromolecular crystallography. Acta Cryst. D Biol. Crystallogr. 2010, 66, 12–21. [Google Scholar] [CrossRef] [Green Version]
- Salomon-Ferrer, R.; Case, D.A.; Walker, R.C. An overview of the Amber biomolecular simulation package. Wiley Interdiscip. Rev. Comput. Mol. Sci. 2013, 3, 198–210. [Google Scholar] [CrossRef]
- Maier, J.A.; Martinez, C.; Kasavajhala, K.; Wickstrom, L.; Hauser, K.E.; Simmerling, C. ff14SB: Improving the accuracy of protein side chain and backbone parameters from ff99SB. J. Chem. Theory Comput. 2015, 11, 3696–3713. [Google Scholar] [CrossRef] [PubMed] [Green Version]
- Humphrey, W.; Dalke, A.; Schulten, K. VMD: Visual molecular dynamics. J. Mol. Graph. 1996, 14, 33–38. [Google Scholar] [CrossRef]
- Roe, D.R.; Cheatham, I.T.E. PTRAJ and CPPTRAJ: Software for Processing and Analysis of Molecular Dynamics Trajectory Data. J. Chem. Theory Comput. 2013, 9, 3084–3095. [Google Scholar] [CrossRef] [PubMed]


| Category | Compound |
|---|---|
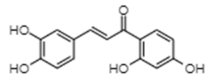
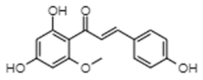
Chalcones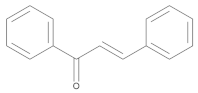 | Flavokawain A |
| Butein | |
| Licochalcone B | |
| Flavokawain C | |
| Cardamonin | |
| 2′-O-methylhelichrysetin | |
| Helichrysetin | |
| 2,2′,4′-trihydroxychalcone | |
| Isoliquiritigenin | |
| 3-Phenylumbelliferone | |
Coumarins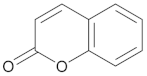 | 5,7-dihydroxy-4-methylcoumarin |
| Biochanin A | |
| 3-carbethoxyumbeliferone | |
| Genistein | |
| 7-Hydroxy-3-(4-methoxyphenyl) chromen-2-one | |
| 3-(3-Chlorophenyl)-7-hydroxychromen-2-one | |
| 3-(3-Chlorophenyl)-7-hydroxy-4-methylchromen-2-one | |
| 7-Hydroxy-3-(4-methoxyphenyl)-4-methylcoumarin | |
| 3-(4-Chlorophenyl)-7-hydroxychromen-2-one | |
| 3-(2-Chlorophenyl)-7-hydroxy-4-methylchromen-2-one | |
| 3-(4-Chlorophenyl)-7-hydroxy-4-methylchromen-2-one | |
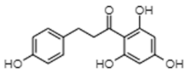
Dihydrochalcone | Phloretin |
| 2-(4-Methoxyphenyl)-1-(2,4,6-trihydroxyphenyl) ethanone | |
| 2-(2,4-Dichlorophenyl)-1-(2,4-dihydroxyphenyl) ethanone | |
| 2-Phenyl-1-(2,4,6-trihydroxyphenyl) ethanone | |
| O-desmethlyangolesin | |
| Ononetin | |
| 1-(2,4-Dihydroxyphenyl)-2-(4-hydroxyphenyl) ethanone | |
| 1-(2,4-Dihydroxyphenyl)-2-phenylethanone | |
| 1-(2,6-Dihydroxy-4-methoxyphenyl)-3-phenylpropan-1-one | |
Monocyclic phenol | Methylgallate |
| 3-Amino-4-hydroxybenzoic acid | |
| 3-O-Methylgallic acid | |
| Ethyl protocatechuate | |
| 3,4-Dihydroxybenzaldehyde | |
| Protocatehuic acid | |
| Syringaldehyde | |
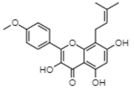
Prenylated flavonoid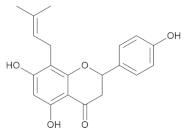 | Isoxanthohumol |
| Icaritin * | |
| 8-Prenylnaringenin |
| Compound | FEB (kcal/mol) | Ki (nM) | FQ | |
|---|---|---|---|---|
 | Icaritin | −8.95 | 273.09 | 0.662 |
 | Phloretin | −8.33 | 787.06 | 0.653 |
 | Butein | −8.05 | 1260 | 0.631 |
 | Helichrysetin | −7.8 | 1910 | 0.606 |
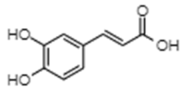 | Caffeic acid | −7.55 | 2900 | 0.667 |
 | Isoliquiritigenin | −7.46 | 3430 | 0.591 |
 | Biochanin A | −7.4 | 3740 | 0.575 |
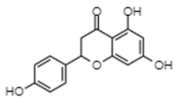 | Naringenin | −7.33 | 4220 | 0.575 |
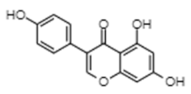 | Genistein | −7.03 | 6980 | 0.552 |
 | Gallic acid | −7 | 7350 | 0.640 |
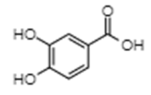 | Protocatechuic acid | −6.51 | 16,910 | 0.622 |
| Compound | FEB (kcal/mol) | Ki (nM) | FQ | |
|---|---|---|---|---|
 | Icariin | −12.48 | 0.7 | 0.806 |
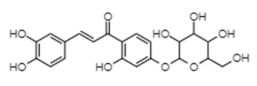 | Coreopsin | −11.88 | 2.0 | 0.853 |
 | Astroside | −10.95 | 9.4 | 0.781 |
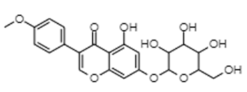
 | Genistein glucoside | −10.71 | 14.2 | 0.769 |
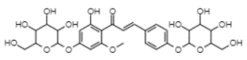
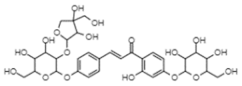 | Isoliquiritigenin 4′-O-glucoside 4-O-apiofuranosyl-1′-glucoside | −10.71 | 14.1 | 0.684 |
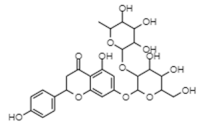 | Naringin | −10.68 | 10.8 | 0.732 |
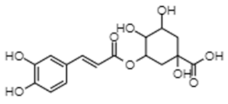 | Chlorogenic acid | −10.61 | 16.7 | 0.796 |
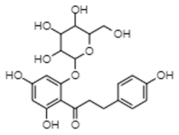 | Phlorizin | −10.42 | 22.9 | 0.749 |
 | Helichrysetin 4,4′-di-O-α-glucoside | −9.22 | 174.7 | 0.614 |
 | Protocatechuic acid 3-glucoside | −8.78 | 366.9 | 0.675 |
 | 4-Glucogallic acid | −8.31 | 805.9 | 0.634 |
Publisher’s Note: MDPI stays neutral with regard to jurisdictional claims in published maps and institutional affiliations. |
© 2021 by the authors. Licensee MDPI, Basel, Switzerland. This article is an open access article distributed under the terms and conditions of the Creative Commons Attribution (CC BY) license (https://creativecommons.org/licenses/by/4.0/).
Share and Cite
Politi, M.E.; Bethanis, K.; Thireou, T.; Christoforides, E. Glycosidic vs. Aglycol Form of Natural Products as Putative Tyrosinase Inhibitors. Biophysica 2021, 1, 458-473. https://doi.org/10.3390/biophysica1040033
Politi ME, Bethanis K, Thireou T, Christoforides E. Glycosidic vs. Aglycol Form of Natural Products as Putative Tyrosinase Inhibitors. Biophysica. 2021; 1(4):458-473. https://doi.org/10.3390/biophysica1040033
Chicago/Turabian StylePoliti, Maria Evgenia, Kostas Bethanis, Trias Thireou, and Elias Christoforides. 2021. "Glycosidic vs. Aglycol Form of Natural Products as Putative Tyrosinase Inhibitors" Biophysica 1, no. 4: 458-473. https://doi.org/10.3390/biophysica1040033