Article

Richness and Elevation Patterns of a Stonefly (Insecta, Plecoptera) Community of a Southern Appalachian Mountains Watershed, USA

by
Madeline L. Metzger
1 and
Scott A. Grubbs
2,*
1
DEP Bureau of Labs, 2575 Interstate Drive, Harrisburg, PA 17110, USA
2
Department of Biology and Center of Biodiversity Studies, Western Kentucky University, Bowling Green, KY 42101, USA
*
Author to whom correspondence should be addressed.
Ecologies 2023, 4(3), 442-460; https://doi.org/10.3390/ecologies4030028
Submission received: 9 March 2023 / Revised: 16 June 2023 / Accepted: 19 June 2023 / Published: 22 June 2023
(This article belongs to the Special Issue Feature Papers of Ecologies 2023)

Abstract

:
Protected areas are relatively free of human disturbance, are especially common in montane regions, and provide opportunities to study native fauna and flora. Stoneflies are model organisms to assess present and future environmental changes. While stoneflies inhabit cold lakes and a wide size range of lotic systems, diversity is greatest in streams draining mountain landscapes. This study addressed seasonal and elevation patterns of a stonefly fauna inhabiting a protected landscape draining the eastern flank of Mount Mitchell, the highest point of the Appalachian Mountains, USA. In total, 58 species were collected with estimated richness values ranging from 63 to 65. Species determinations were assisted with an integrative molecular approach using the mitochondrial barcode gene. Sampling during spring yielded the most species seasonally. Although certain species were only found at lower or higher sites, several were collected from across a broad range of elevations. Roughly 1/3 (21 = 36%) of the fauna present is known only from the southern Appalachian Highlands region, including one species described as new during this study. The assemblage reported here, however, did not closely align with other Appalachian fauna. Overall, well-structured faunal research continues to be important in light of continuing habitat modifications and climate change.

1. Introduction

Established protected areas are relatively free of human-induced disturbances and Libbyprovide opportunities to study native flora and fauna [1]. Protected areas are widespread throughout the United States of America (USA), typically in remote areas and especially within montane regions. Mountain regions represent approximately 25% of the earth’s land and contain diverse ecosystems [2]. Mountains are important components of climatic and hydrologic systems as they are a barrier to atmospheric flow and are the main sources of several major river systems globally.
Protected freshwater sites provide opportunities to address impacts throughout a catchment area [3]. Freshwater ecosystems are subject to several stressors, including pollutants [4,5], deforestation [6], invasion of non-native species [7], urbanization [8], and climate change [9,10]. Aquatic organisms are influenced by tolerance adaptations to natural thermal regimes as the majority can only endure a specific range of temperatures [11,12]. Freshwater systems are particularly vulnerable to climate change due to the variable thermal properties of water [13] and anticipated precipitation stochasticity [14].
Populations are responding to climate change by lessening population connectivity and changing geographic distributions [10,15]. Species ranges have shifted both in altitude and latitude [16,17]. North American fishes and aquatic macroinvertebrates have responded with a latitudinal shift in response to a 3–4 °C increase [18,19]. Extinction can only be avoided if organisms can move to a more favorable habitat [20]. Some mountain environments, including north–south ranges, have limited possibilities for species to migrate [21] and are therefore sensitive to alterations in climatic conditions [22]. Many species are mountaintop endemics to which climate warming would pose a large threat [23]. Low-elevation mountain ranges are especially susceptible to summit traps in which species will run out of space to occupy [11,24].
Taxonomic surveys can assess the influence of multiple stressors on freshwater species [25,26]. Macroinvertebrates are used in nearly 80% of all biomonitoring studies of lotic systems [27]. Stoneflies are used in water-quality biomonitoring studies due to their high sensitivity to environmental contamination and specified environmental tolerances [28]. Using Natural Heritage methodologies, stoneflies were assessed as the third most imperiled freshwater biotic group in the United States of America (USA), behind only mussels and crayfish [29]. Stoneflies are among the first aquatic insects to disappear from freshwater systems due to altered environmental conditions [30,31]. Stoneflies inhabit a broad range of stream sizes, elevations, streamflow permanence conditions, and thermal regimes [32], but species richness is highest in cold-water streams of montane regions. The most vulnerable are cold-stenotherm species at higher altitudes that are confined to upper reaches of catchments [33].
The southeastern USA in general has served as a biodiversity hotspot and has provided protection for regional biota. The overarching objective of this study was to perform a comprehensive study of the stonefly fauna of a southern Appalachian Highlands watershed in western North Carolina, USA, by collecting over different seasons of multiple years. More specifically, we addressed if (a) there were distinct elevation patterns present for individual families and species and (b) this watershed acted as a protective landscape for species that are considered to be rare, regionally restricted, or currently known only from a geographic small range.

2. Materials and Methods

2.1. Blue Ridge Region

This research was conducted along the eastern flank of Mount Mitchell, the southern extent of the north–south Black Mountains that are part of the ancient Blue Ridge region of the Appalachian Mountains that formed approximately 480 million years ago and spans portions of eight USA states from north Georgia to southern Pennsylvania (Figure 1). More specifically, Mount Mitchell is located within the U.S. Environmental Protection Agency (USEPA) Level III Blue Ridge Ecoregion (66). In North Carolina, this ecoregion is equivalent to the Mountains Ecoregion in Beaty [34]. Mount Mitchell is also the highest point of eastern North America at 2037 m (=6684 ft). Igneous and metamorphic rocks allowed Mount Mitchell to erode at a slower pace compared to other subranges in the southern Appalachian Highland region [35].
After the decline in Fraser fir (Abies fraseri (Pursh) Poir) in the 1960s and 1970s, this species has returned as a co-dominant canopy species at higher elevations [36], together with red spruce (Picea rubens Sarg.) and eastern hemlock (Tsuga canadensis (L.) Carrière). Several hardwoods are also present, including mountain ash (Sorbus americana Marshall), yellow birch (Betula allegheniensis Britt.), and fire cherry (Prunus pensylvanica L.f.) [37].
Mean regional temperatures range from −3.0 °C (January) to 19.3 °C (July) and precipitation occurs across all seasons, totaling nearly 110 cm of rainfall annually [38]. Streams draining the Black Mountains are part of the upper Tennessee River Basin and are nested between the South Toe River and French Broad River subbasins [39]. High-elevation springs, seeps, and streams have a primarily boulder-dominated substrate, whereas the lower-elevation higher-order streams have a gravel–pebble substrate intermixed with boulders. Regional tributaries are generally cold and remain this way even as they enter larger rivers at valley floors [40].

2.2. Field Methods

Sampling occurred within the Mount Mitchell State Park (MMSP) and the adjacent Appalachian Ranger District of Pisgah National Forest (PNF) in 2014–2017 and 2019. Sites sampled in 2014–2017 were assessed for gaps in elevation and drainage area. New sites in 2019 were added to address these gaps. Field collections occurred mainly between spring and autumn based on weather conditions at the MMSP (https://www.ncparks.gov/mount-mitchell-state-park/home, accessed on 30 March 2019). The Blue Ridge Parkway leading into the access road to the MMSP is closed during harsher winter weather. Sites were accessed mainly along trails, forest service roads, and at campgrounds along an elevation gradient of ca. 1150 m (831–1983 m ASL; Table 1). Location data in decimal degrees for each locality were recorded directly on site with a portable GPS unit and were georeferenced for accuracy using Acme Mapper 2.2 (https://mapper.acme.com, accessed on 20 August 2022). A dot distribution map for all collection localities was prepared with ArcMap 10.8 (Figure 2). The drainage area of each site was determined using the CONTDA function in StreamStats 4.0 (https://streamstats.usgs.gov/ss/, accessed on 20 August 2022). The drainage area was used as a proxy of stream size. The elevation of each site was determined using GPS Visualizer (https://www.gpsvisualizer.com/elevation, accessed on 20 August 2022).
During each site visit, adult stoneflies were collected using an aerial net and a beating sheet to dislodge individuals from riparian vegetation plus by hand-picking from emergent leaf packs, rocks, and trees. An ultraviolet light (UV) was deployed on four warm summer evenings to collect adults of Acroneuria, Beloneuria, Perlesta, and Isoperla. The UV light was used at only one site (site 1—see Table 1). Males of each of the four aforementioned genera have an aedeagus that needs to be fully extruded to ensure positive identification. Therefore, males were kept alive in 50 mL polypropylene conical tubes and the aedeagus was extruded under a Leica S6E dissecting microscope. Larval samples were collected using a standard dip net and by hand-picking from rocks and debris in October 2019 to ensure representation of larger-bodied individuals of Perlidae and Perlodidae. We used a structured, sampling design of exactly 15 min to provide equal effort across all 43 sites. All specimens were preserved in 95% ethanol. Sites were assigned a unique field number identifier and specimens were stored in the Western Kentucky University Collection, Bowling Green (WKUC).

2.3. Microscopy and Molecular Methods

Most individuals were identified in terms of species using Olympus SZ61 and SZX12 stereo microscopes (Table 2). Females of Leuctra, Isoperla, and Remenus, however, are difficult to identify in terms of species. An integrated molecular approach was necessary to tease out richness patterns more accurately for these genera. The mitochondrial cytochrome c oxidase subunit 1 (mtCO1) gene for 41 males and 282 females of these 3 genera was extracted, amplified, sequenced, and analyzed with phylogenetic methods as outlined in [41,42].
Total DNA was extracted from two adult legs and associated thoracic tissue per individual using a DNeasy Blood and Tissue Kit according to the manufacturer’s instructions. The mtCOI gene was amplified through a polymerase chain reaction (PCR) using the primers HCO2190 (5′-TAAACTTCAGGGTGACCCAAAAAATCA-3′) and LCO1490 (5′-GGTCAACAAATCATAAAGATATTGG-3′ [73]. The PCR products were sequenced at the North Carolina State University Genomics Lab (Raleigh, NC, USA).
Molecular data were analyzed with each of tree- and genetic-distance phylogenetic methods. A maximum-likelihood tree was generated using RAxML with the autoMRE setting. A Bayesian-inference tree was constructed using MrBayes MPI with the following settings: GTR_I_G model; default Markov chain Monte Carlo commands (four chains, three heated); default number of runs (n = 2); stationary nucleotide frequency; burn-in of 25%; random starting tree; a sampling frequency of 1000 generations; and a stop value between 0.01 and 0.05. A consensus tree was generated following the stop rule.
Pairwise divergence distances were calculated in MEGA X [74] using the Kimura two-parameter model of nucleotide substitution with the complete codon deletion option. We focused on the maximum intraspecific divergence between males and putative females of the same species and the minimum interspecific divergence between all species. In addition, Automatic Barcode Gap Discovery (ABGD [75]) was employed to complement the pairwise divergence approach. Relative gap width was set at 1.5 with the Kimura two-parameter model and all other settings at default.

2.4. Data Analyses

Species data were organized in matrix format by incidence (1 = collected, 0 = not collected) by sampling trip and site. The freeware program EstimateS [76] was used to calculate two estimators of species richness (Chao2 estimator and ICE mean) and the number of singletons and doubletons. Both richness estimators are non-parametric models that are appropriate for use with incidence data [77]. While the Chao 2 estimator focuses on rare species (i.e., singletons and doubletons [78]), ICE takes into account both rare and common (i.e., in 10 or more samples [79]). We compared study-scale proportionality to state-level proportionality, the latter derived from the species list for North Carolina available as a faunal list search in Plecoptera Species File [80]. Proportionality was calculated at the family level as the number of species within a family divided by the total number of species present in the study area or state.
We assess the relationship of the Mount Mitchell fauna to 11 eastern Nearctic assemblages. We amplified the presence–absence CSV data file from DeWalt and Snyder [81] (p. 73) with [82] (Great Smoky Mountains National Park, North Carolina and Tennessee) [83], (Talladega Mountains, Alabama) [84], (Mammoth Cave National Park, Kentucky), and this study (Supplementary Table S1). The data list by Parker et al. [82] was amended with Soyedina parkeri [85] in lieu of Soyedina, i.e., “new species” [82], and Zapada fumosa [86]. A Jaccard distance matrix between faunal assemblages was constructed and then analyzed on average linkage and percent distance in SYSTAT 11. Faunal relationships were displayed as a simple dendrogram.

3. Results and Discussion

3.1. Species Richness and Community Composition

This study addressed species richness patterns of stoneflies occupying streams draining the highest-elevation mountain peak in eastern North America. Intensive and thoughtful faunistic studies, especially within protected landscapes, have the capacity to address specific ecological questions. There are several recent examples that have addressed questions regarding Nearctic stonefly communities, including altitudinal zonation patterns [83], dispersal capacity [87], habitat suitability [88], and streamflow duration [84,89].
In total, the 2014–2019 sampling resulted in 726 records (=vials) and 3128 adults and larvae in total from 43 unique locations (Supplementary Table S2). Over 80% of the sampling trips added unique species (Figure 3). Although sampling efforts were amplified during 2019, relatively few additional species were collected across the final five months of collecting. Between 1 and 31 species were collected from each unique location; this broad range was obtained because some sites were sampled more often than others (Figure 4).
Morphological and molecular methods resulted in 58 verified species, including an undetermined Leuctra OTU (Table 3) and additional information for adult Leuctra female presence. For example, L. grandis females were identified that had extended presence through late July, speaking to the importance of accurate identifications, even if with integrated molecular methods.
The most common species were Leuctra grandis (n = 31 sites), L. triloba (n = 27), Amphinemura wui (n = 26), Paraleuctra sara (n = 25), L. ferruginea (n = 24), and Sweltsa lateralis (n = 23) (Table 3). Nine of the ten families known from the Nearctic were represented (Table 3. The most speciose were Perlodidae (n = 18), Leuctridae (n = 12), Chloroperlidae (n = 9), and Perlidae (n = 8). The least speciose family was Pteronarcyidae (n = 1), represented by one Pteronarcys scotti exuvium collected along the South Toe River (site 1, Table 1).
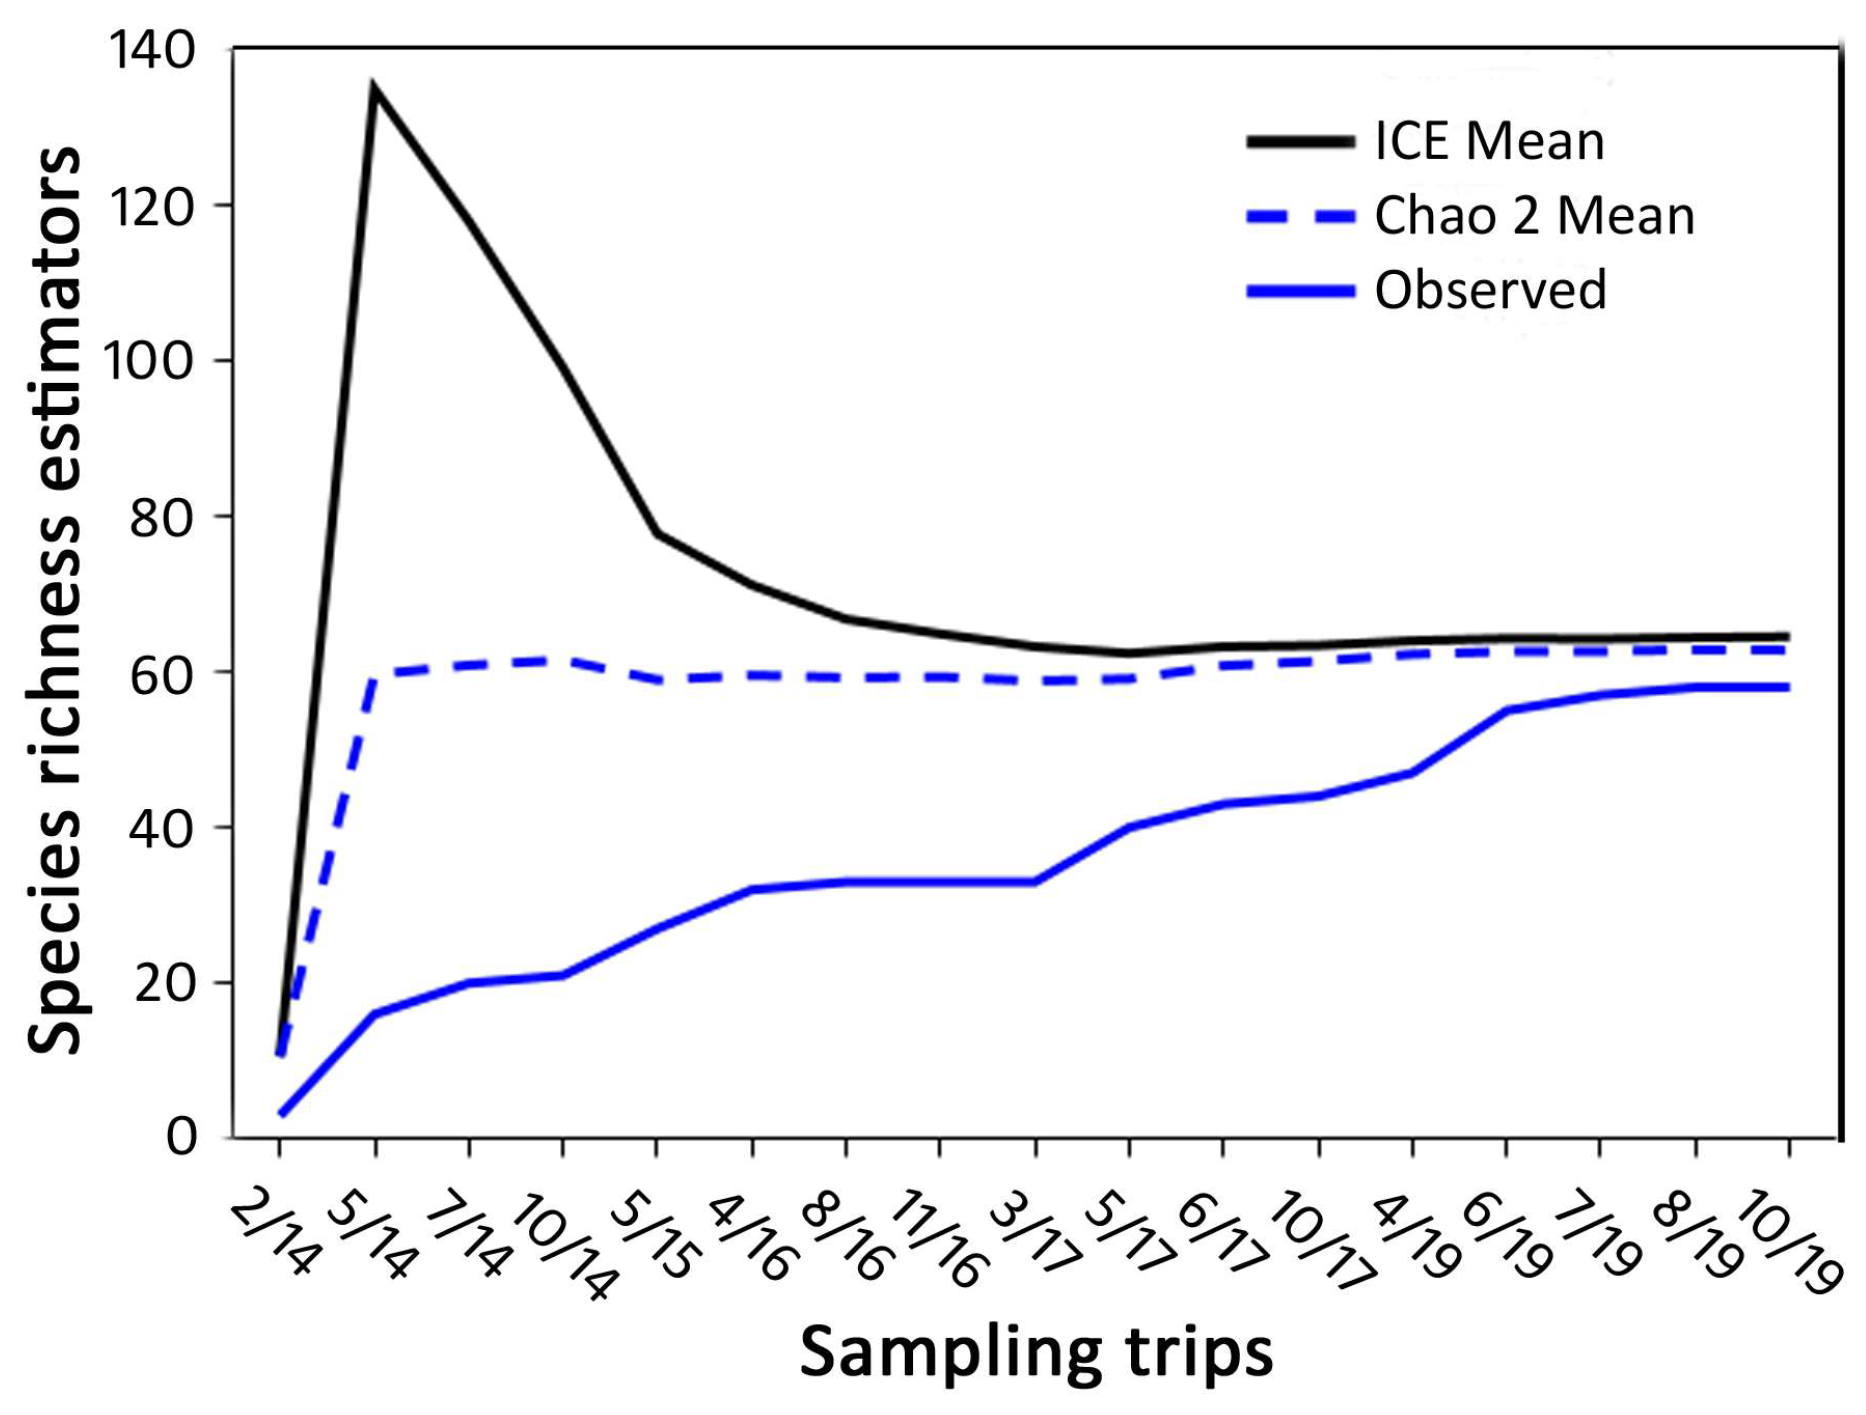
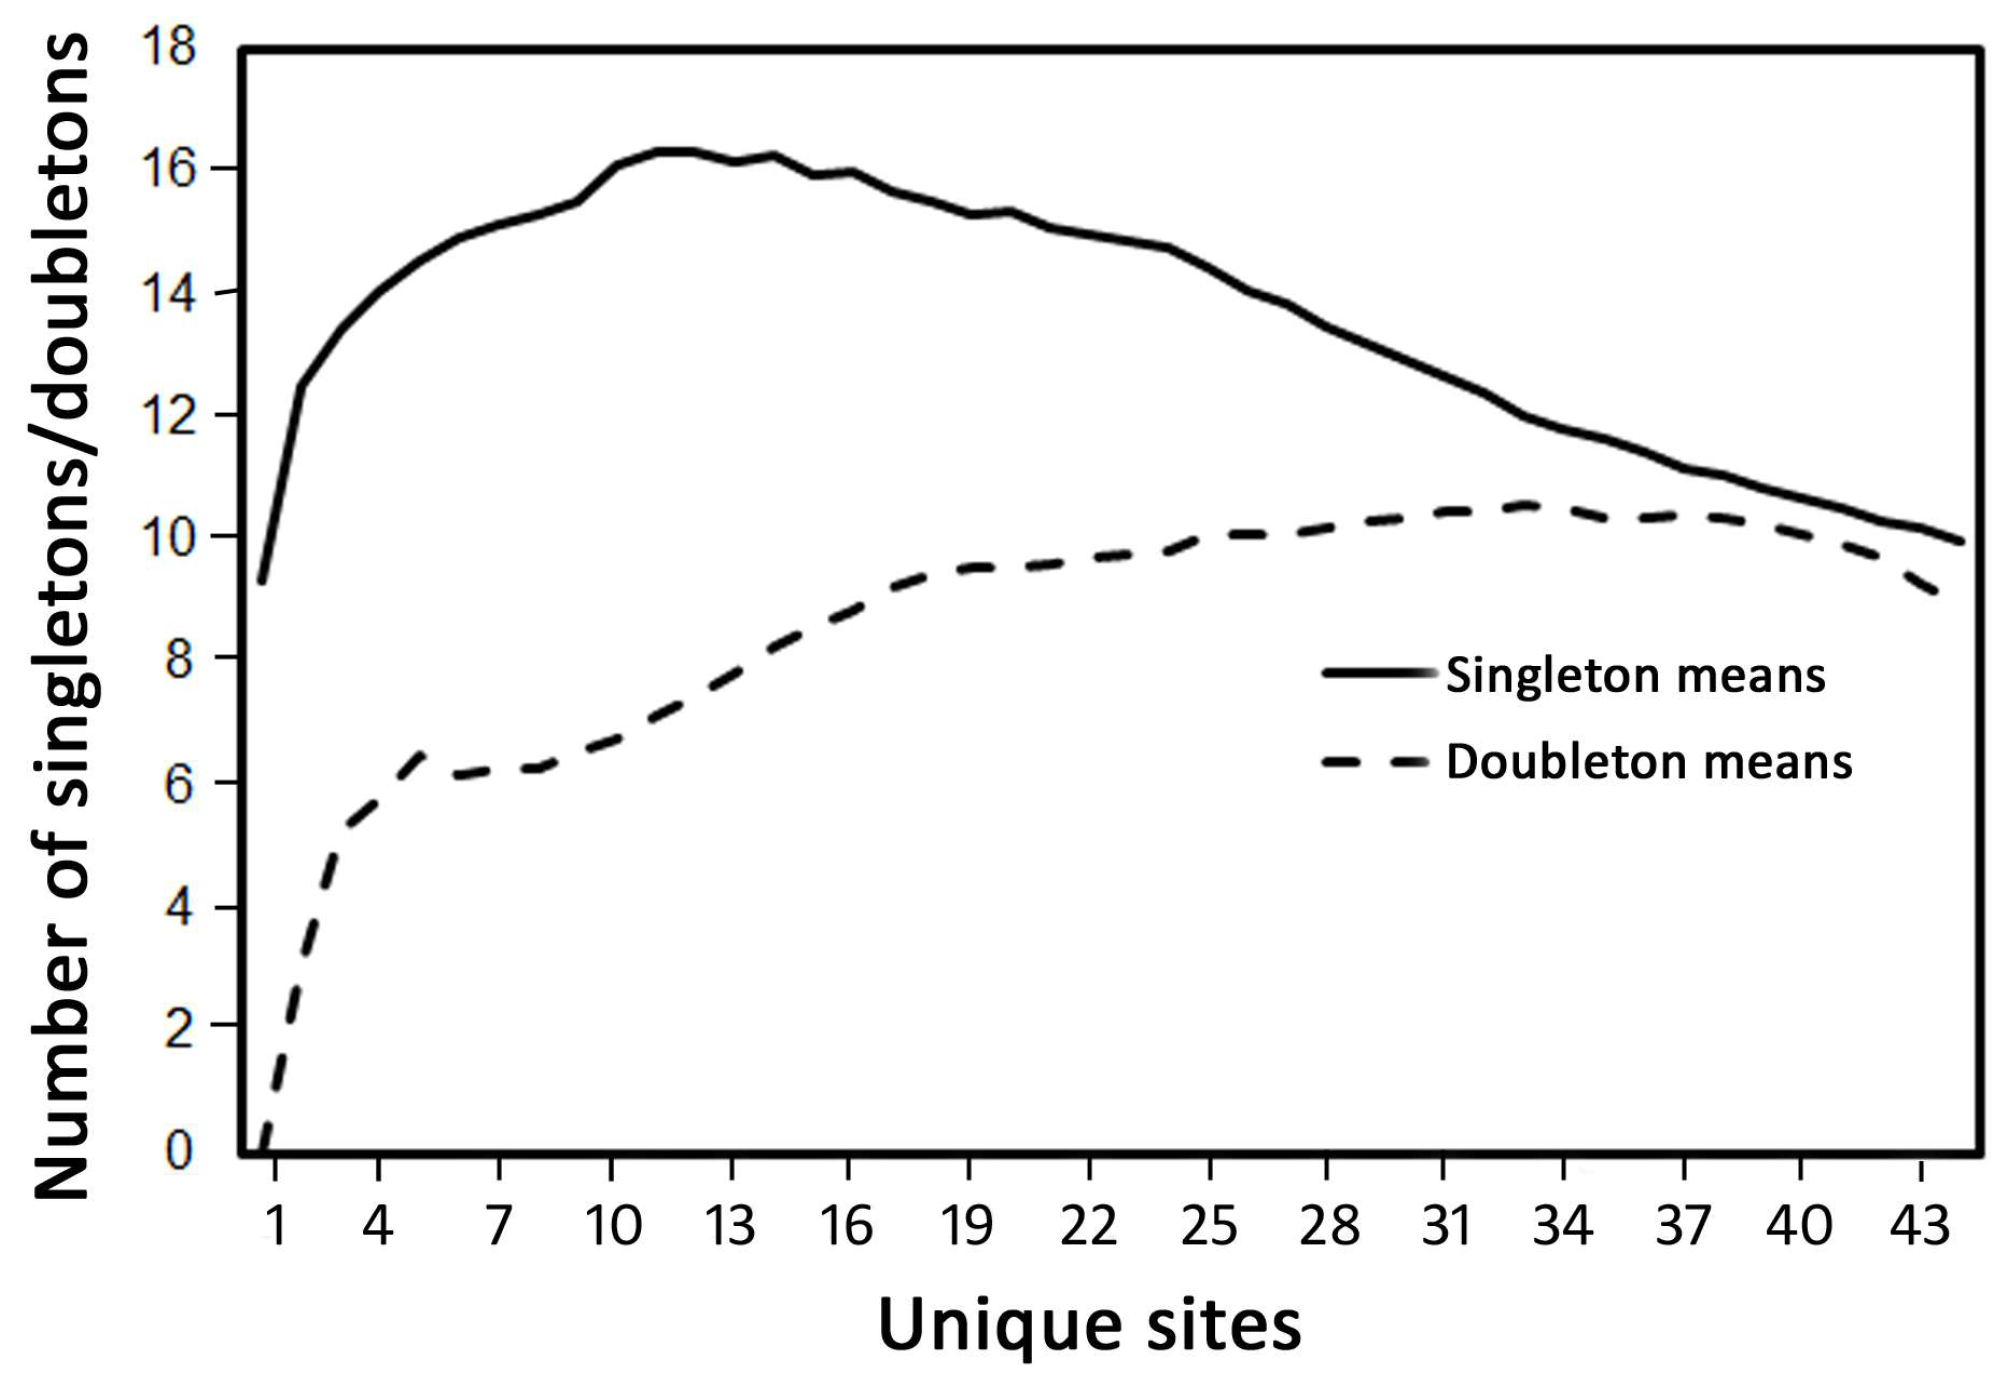
Species richness was both similar to and less than the three richness estimators (Figure 5). The Chao2 estimator and ICE mean predicted 63 and 65 species. Approximately 33% (ten singletons, nine doubletons) of species were collected from only one or two locations (Figure 6), and nearly 90% of all species were collected at less than half of the unique locations.
Two sites with the least number of species appeared to be intermittent and lacked visible surface flow during summer and early autumn. Many species found in intermittent streams are also found in perennial systems [90,91], but only a subset of taxa can exist in the harsh drying conditions of seasonal channels [92]. Species that inhabit intermittent streams typically have univoltine fast life cycles and desiccation-resistant dormant stages in which development and reproduction occur during briefer periods of flow [93]. Leuctra tenella and Soyedina sheldoni were found at the intermittent Railroad Grid spring. Specific life-cycle traits are unknown for these two species. While western USA S. interrupta and S. producta have univoltine fast life cycles [94], eastern USA S. vallicularia and S. calcarea have univoltine slow life cycles [95,96]. Leuctra species are also split between univoltine slow and univoltine fast life cycles [97].

3.2. Proportionality and Comparisons to Other Fauna

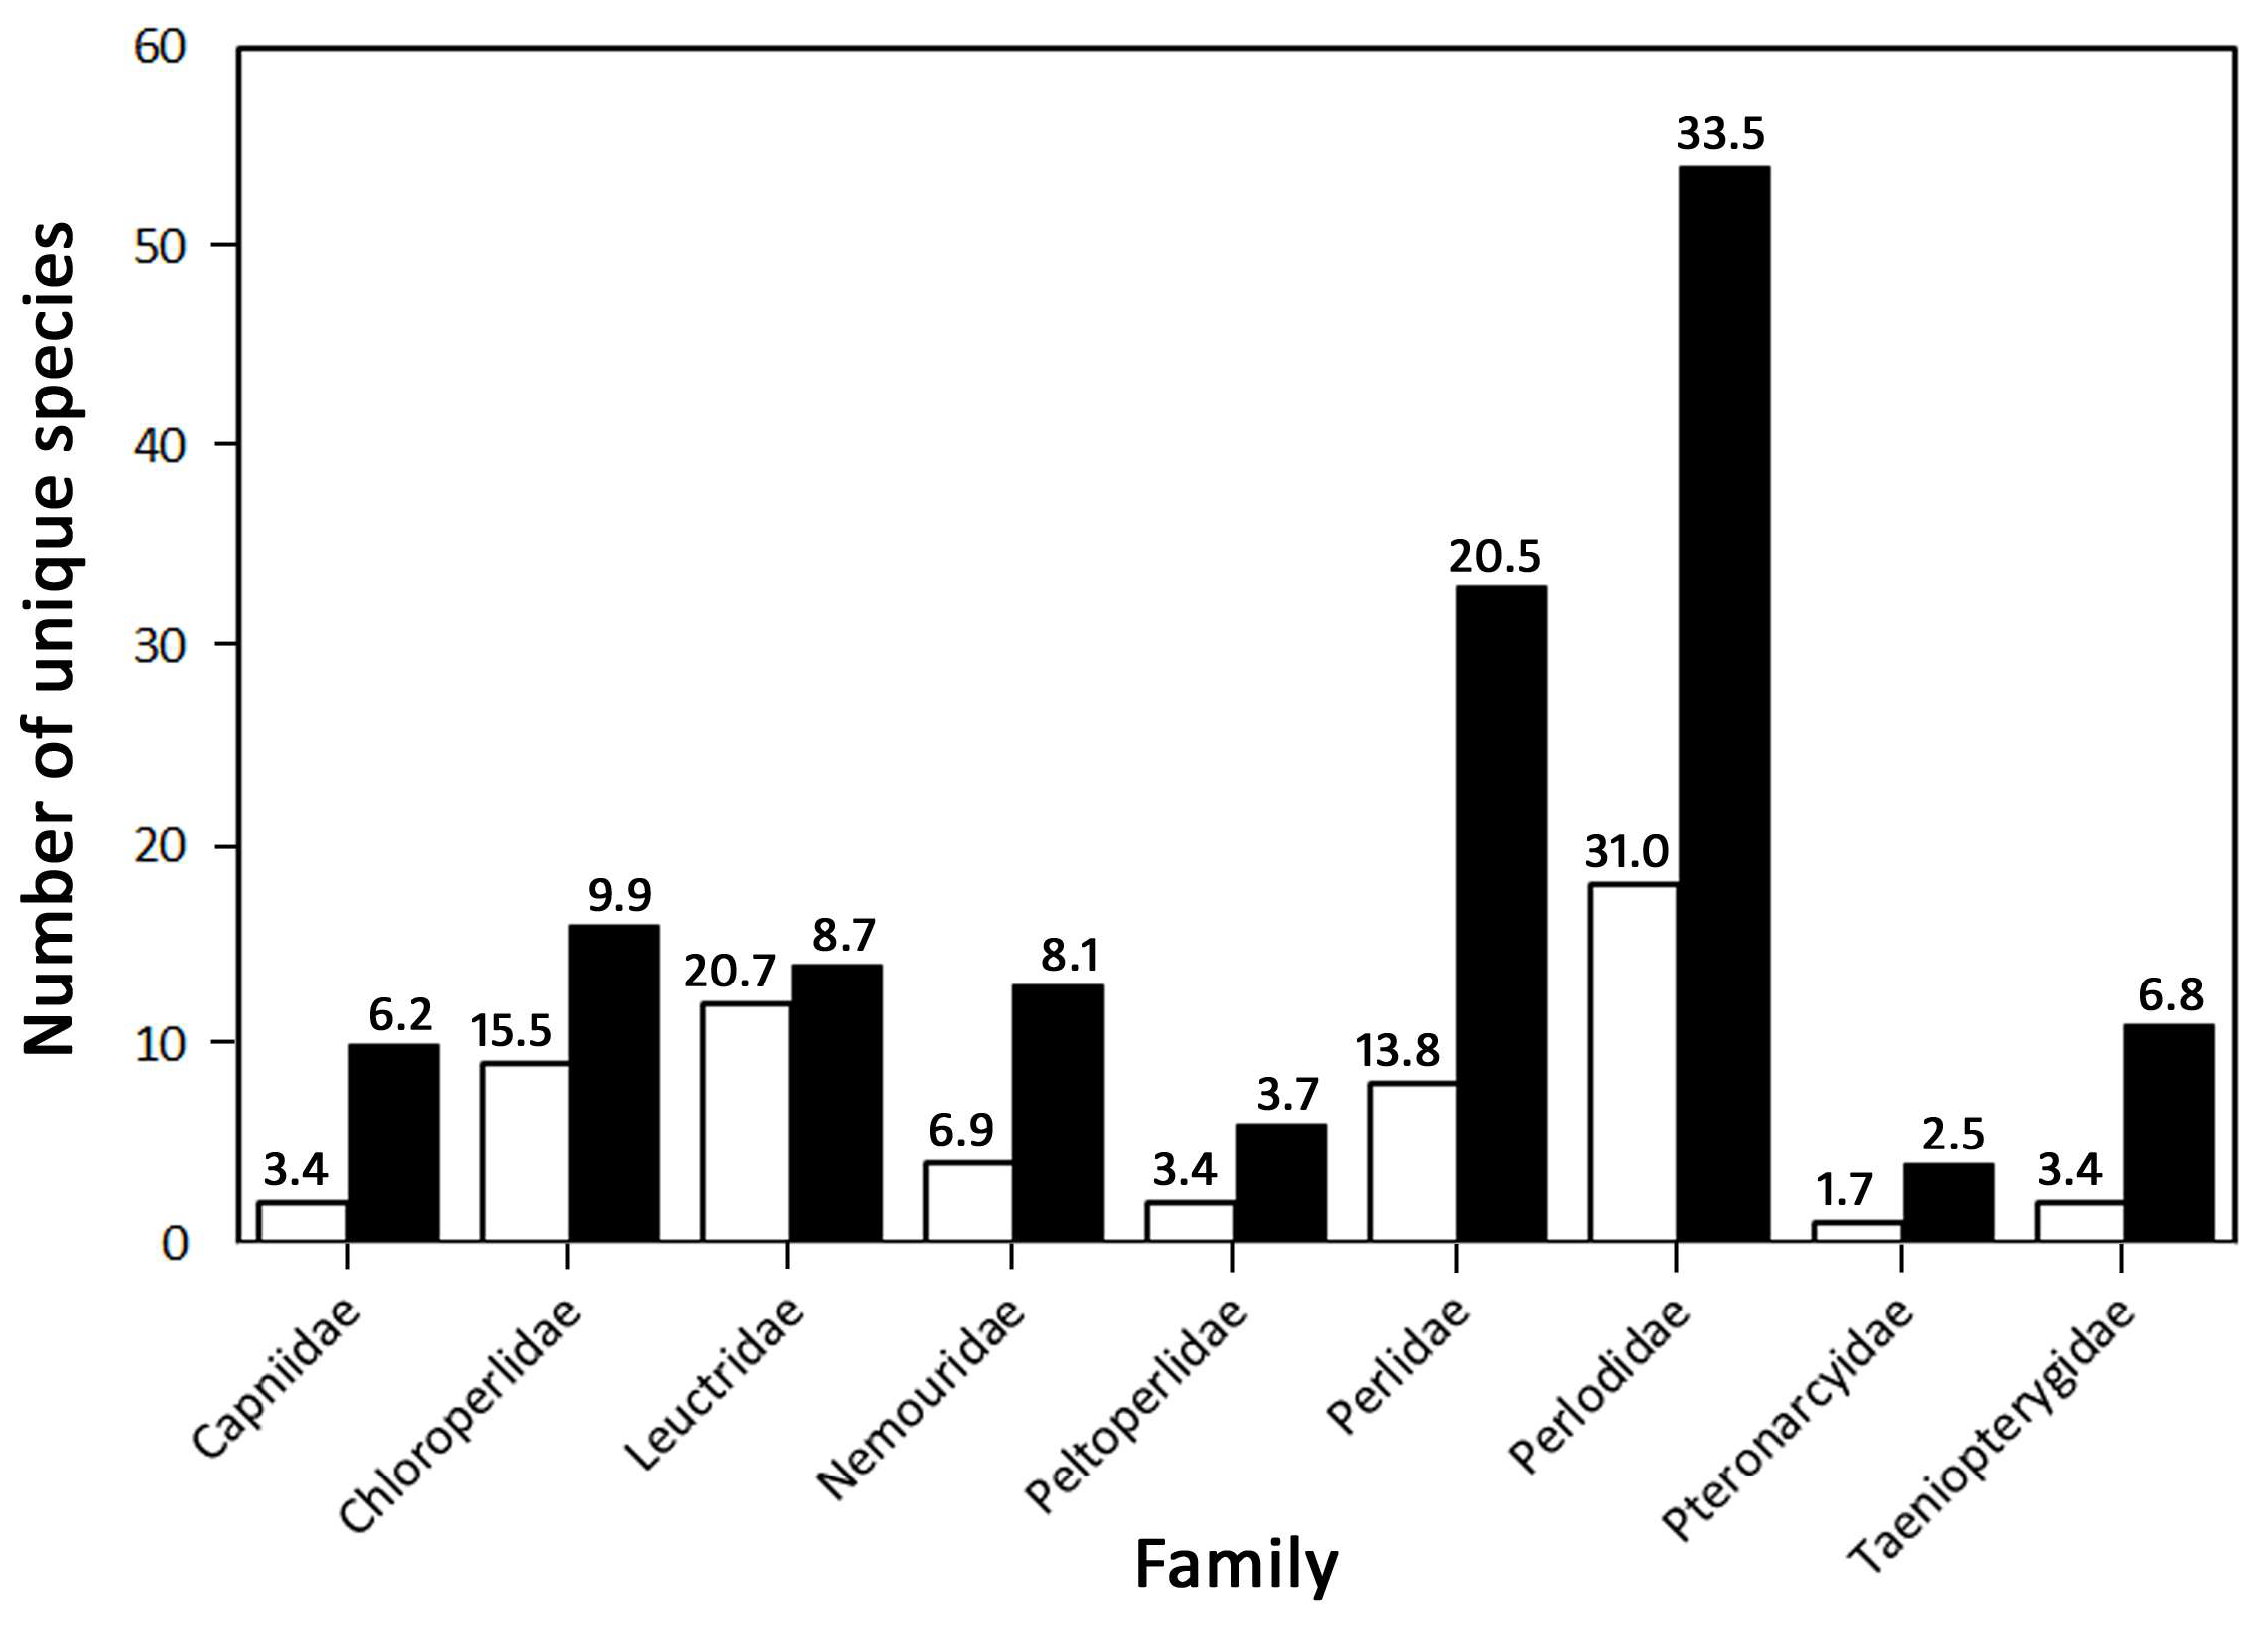
Study-specific vs. state-wide proportionality was roughly comparable for Nemouridae, Peltoperlidae, Perlodidae, and Pteronarcyidae (Figure 7). For example, we only collected one species of Pteronarcyidae. However, the ratio of 1/58 study-scale species was proportionally similar to the state (=4/161). The low richness of Nemouridae (four species) was due to having only one Nemourinae (S. sheldoni) collected during this study. Ostrocerca, Paranemoura, Prostoia, three additional species of Soyedina, and Zapada have all been reported in the Blue Ridge Ecoregion in North Carolina [34,60]. Perlodidae make up the richest family in the Blue Ridge region with 39 species [34,66,67,68,69,70] and is likewise the richest in the state (n = 53; [34,43]). Perlodidae were found in relatively low abundance (only 5% of the total stoneflies) in this study, but still made up the richest family in the study area. The integrated molecular approach was not able to confidently place species names on several Isoperla in the absence of males (i.e., I. arcana/holochlora, I. WKUC 1, I. WKUC 2). Molecular methods did, however, yield the separation of two Remenus females into distinct species units [41]. Larval collecting added species records, but six regional genera were not found during this study: monotypic Clioperla clio, Diploperla, Helopicus, Hydoperla, Isogenoides, and monotypic Oconoperla innubila.
There are two notable examples regarding low proportionality (Figure 7). The first is Capniidae, which emerge in winter and spring in the eastern Nearctic [62,98]. Because sampling sites are much less accessible during winter, only Allocapnia harperi and Paracapnia angulata were collected during this study. Seven other species of Allocapnia Claassen, 1928 have been reported from the Blue Ridge [34]. Two, the only Taeniopterygidae collected, were Oemopteryx contorta and Strophopteryx limata. Like Capniidae, taeniopterygid adults emerge during winter and early spring, and sampling limitations may have led to fewer than anticipated species. Ten species in total have been reported [34], including Bolotoperla rossi, Taenionema atlanticum, and several species of Taeniopteryx.
In contrast, Chloroperlidae and Leuctridae proportionality was notably higher within the study area compared to the state. For example, 12 Leuctridae species were collected during this study. This is nearly similar to the number reported from the Blue Ridge within the state (=14; [34]). Molecular methods helped to positively identify approximately 35% of the total Leuctra females collected, including an undetermined Leuctra OTU [42] and 10 species in total. Paraleuctra sara and Megaleuctra williamsae were the other two species collected during this study.
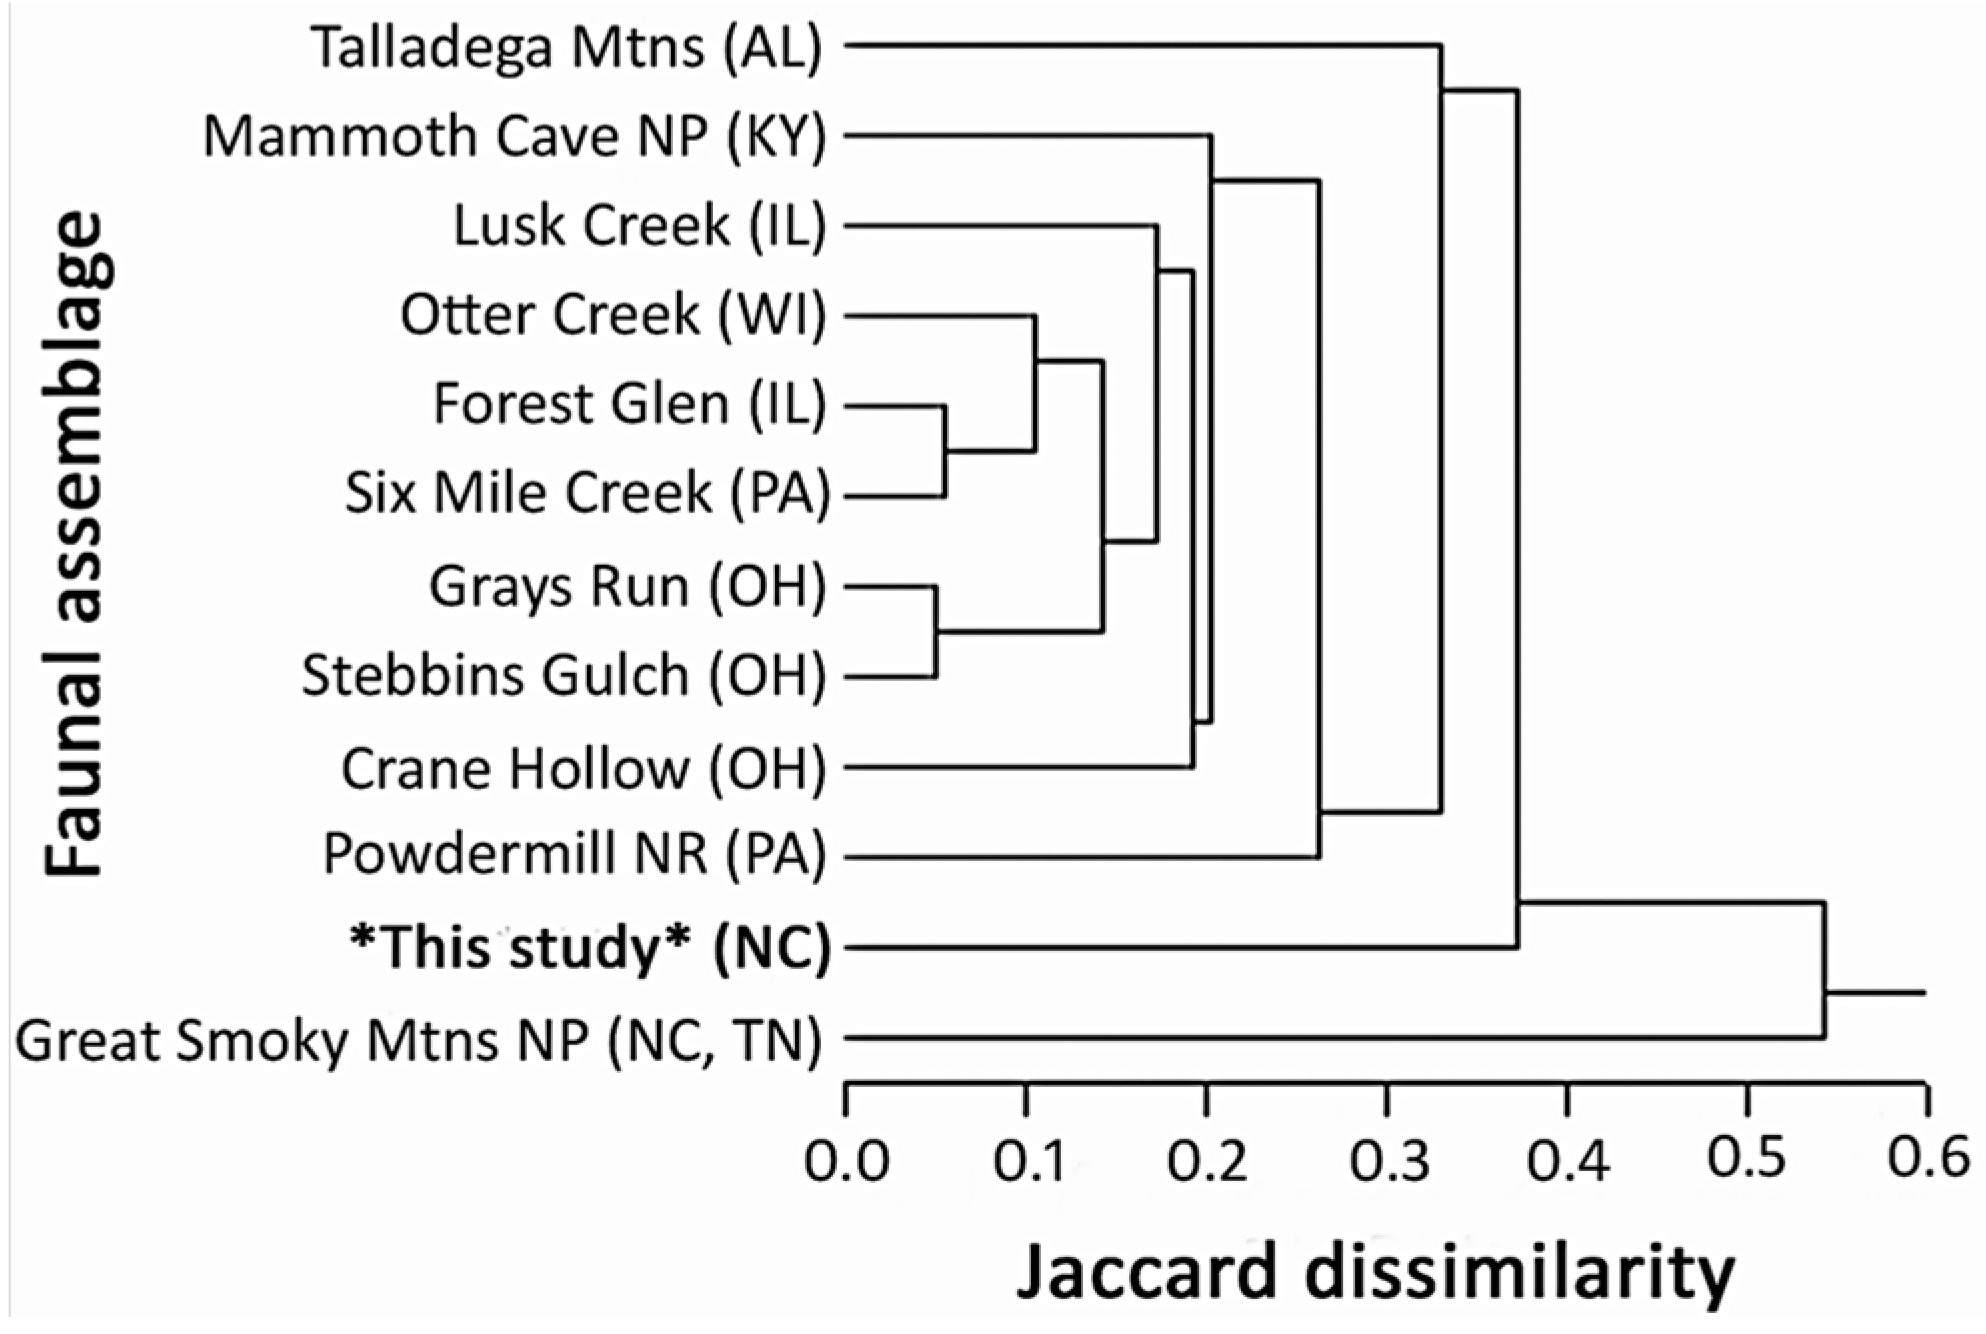
The clustering of the 11 eastern Nearctic faunal assemblages was partially a function of geographic proximity but imperfect (Figure 8). The middle cluster (i.e., Mammoth Cave NP down through the Crane Hollow Nature Preserve) represents a Midwestern USA grouping. The three southern Appalachian assemblages (Talladega Mountains, Great Smoky Mountains NP, and this study), however, have less faunal overlap. Grubbs and Sheldon (2018) reported a species richness value (=57) from the Talladega Mountain region of eastern Alabama that is nearly identical to that of this study (n = 58). However, as many as seven species may be endemic to the Talladega Mountains and the two study localities/regions are minimally distant from each other by 355 km. Although the high peaks of the MMSP (Mount Mitchell) and the Great Smoky Mountains National Park (Clingmans Dome) are only approximately 115 km apart, 111 species were reported in the latter [82] from a markedly larger landscape, representing a composite of data accumulated over a much longer time period.

3.3. Seasonal Trends

Adults of most species were present for less than three months (Supplementary Table S3), yet there were three collected from late spring through autumn (L. ferruginea, L. truncata, and A. wui). Extended adult presence of L. ferruginea has been documented previously [83,95]. Eighteen species were present in both spring and summer, followed by only four collected in summer and autumn. Paracapnia angulata was the only species collected in both winter and spring, but this is an artifact of data deficiency (Supplementary Table S3). Adult data are missing from December–January. Few data were available for winter (one day in February 2014) and accordingly with the fewest number of species (A. harperi, P. angulata, and O. contorta) (Supplementary Table S3).
Spring sampling yielded the most species (n = 47, Figure 9), including 20 collected from this season only and 9 of the 10 families found in the Nearctic. Perlodidae was the most speciose family (n = 15), followed by Leuctridae (n = 9), Chloroperlidae (n = 7), and Perlidae (n = 6). Summer followed with 31 species collected (Figure 9), with approximately 2/3 represented by the families Leuctridae, Chloroperlidae, and Perlodidae (n = 7 each) plus five Perlidae. Autumn was represented by 10 species (Figure 9), including one undetermined Isoperla (I. WKUC 2) that was collected only as females in early October and five species of Leuctra.

3.4. Elevation Trends

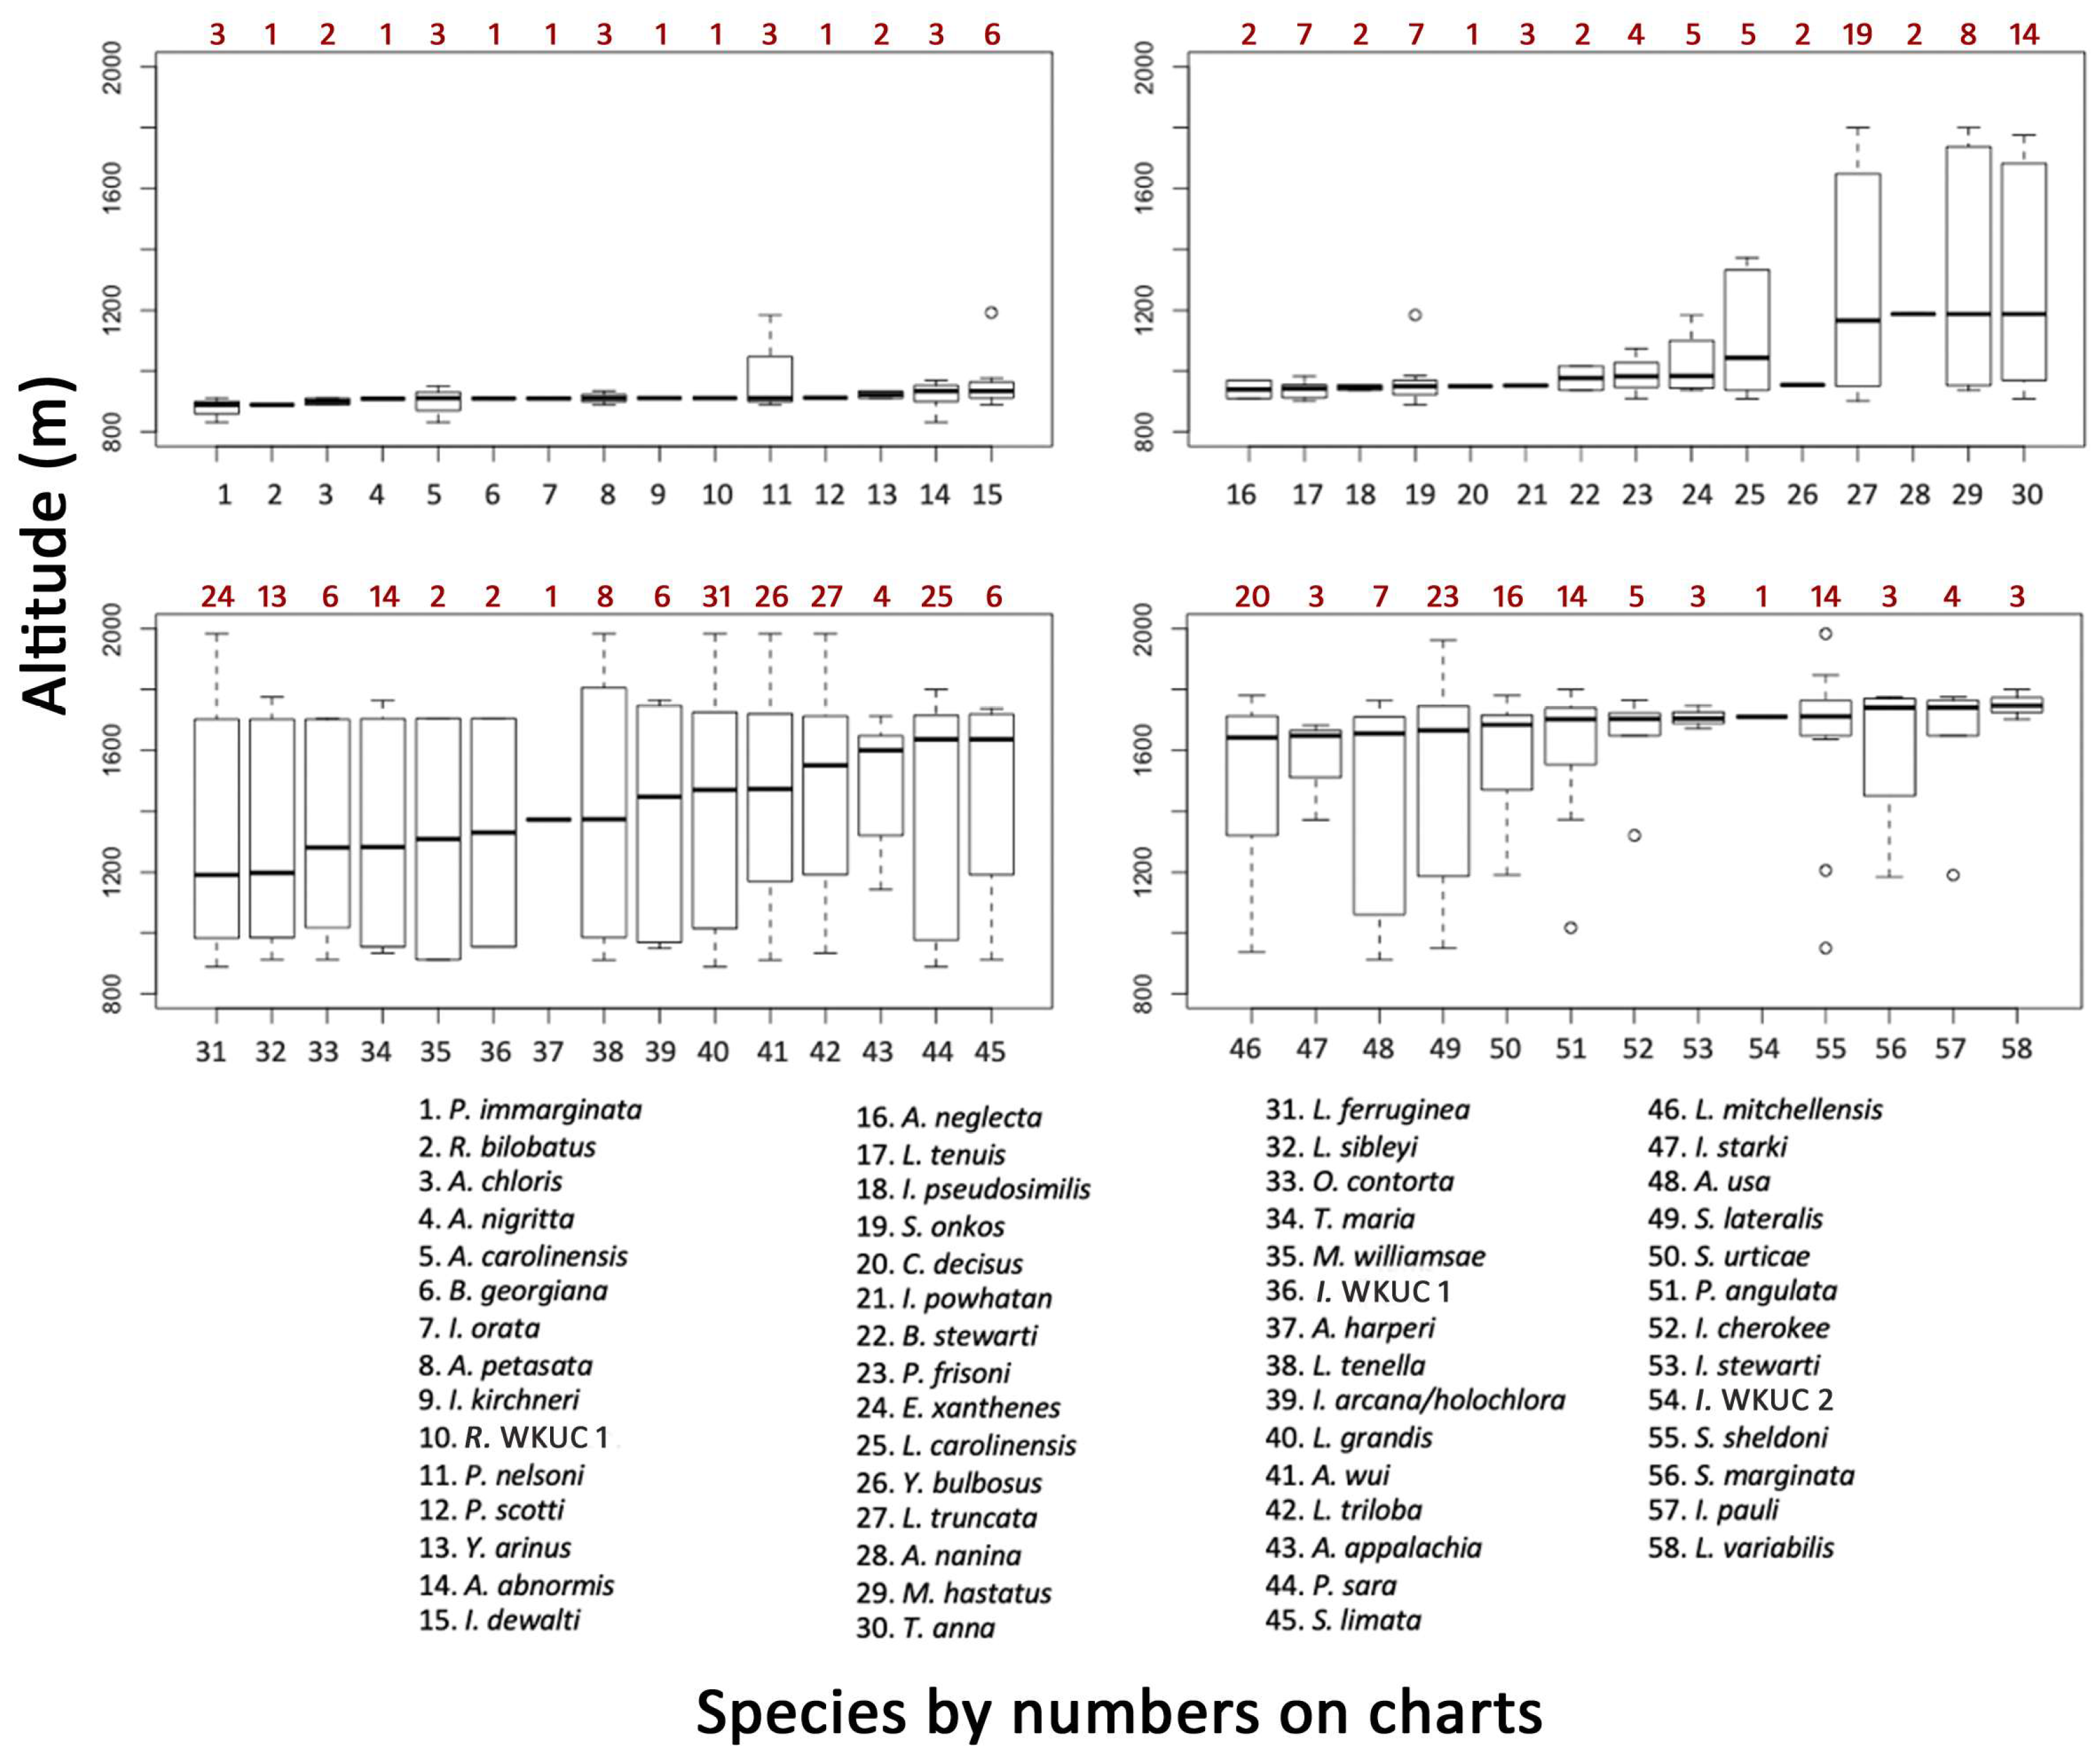
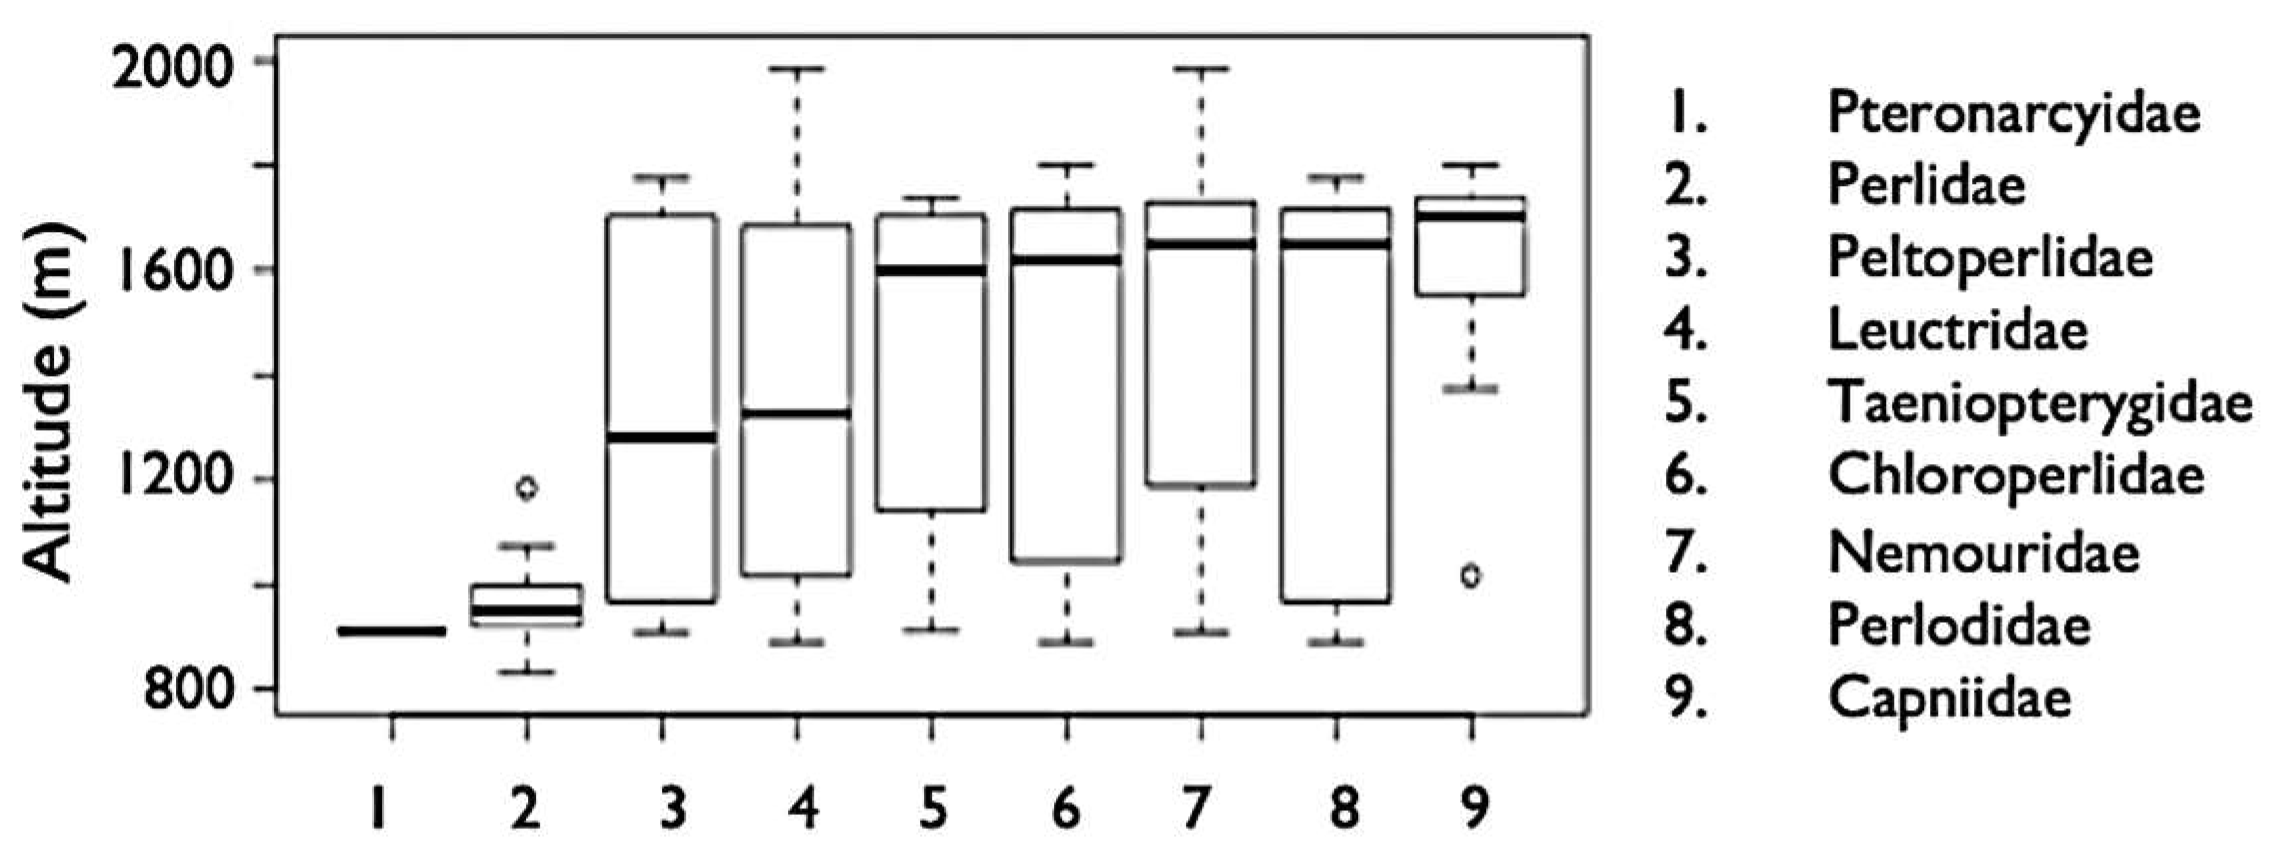
The South Toe River at the Black Mountain Campground yielded the highest number of species (n = 31). This was the second largest drainage site in the study area, yet it was also sampled the most frequently, including four UV light collections. Another 15 sites had at least 10 species collected, but there was no pattern of more species being present at a specific elevation. Median elevations ranged from 889 m (Paragnetina immarginata) to 1747 m (L. variabilis) (Figure 10). Excluding Pteronarcyidae, with too little information to generalize, median elevations at the family-level scale ranged from 950 m (Perlidae) to ≥1600 m for Taeniopterygidae, Chloroperlidae, Nemouridae, Perlodidae, and Capniidae (Figure 10 and Figure 11).
For Capniidae, only P. angulata was collected broadly across the study area (Figure 10, median = 1703 m). Most Leuctridae species, except for L. tenuis, were found across the study area, ranging in stream sizes from small seeps to the South Toe River (Figure 10 and Figure 11). With the exception of Amphinemura nigritta (Figure 10), Nemouridae were also found across all elevations (Figure 10 and Figure 11). Although only two Taeniopterygidae, O. contorta and S. limata, were collected, both were found across a wide range of elevations (Figure 10 and Figure 11).
Within Chloroperlidae, Alloperla was mainly found at lower elevations (with the exception of A. usa), whereas Suwallia marginata and two species of Sweltsa were commonly found (Figure 10). Peltoperlidae, Tallaperla anna and T. maria, were present across all elevations (Figure 10 and Figure 11). Perlidae were mainly collected in lower-elevation streams (Figure 11). Eccoptura xanthenes was the only common perlid found at a median elevation >1000 m (Figure 10).
No pattern was observed for Perlodidae, likely because most species were represented by few collections (Table 3). Isoperla pauli was found at a median elevation of 1741 m in contrast to doubleton I. orata (910 m). Undetermined Isoperla WKUC 2 was collected only from one stream at 1711 m in early October. Even in the southern Appalachian Highland Region, females are typically found as adults no later than mid-summer [66]. Several Perlodinae were collected from low-elevation larger streams, ranging from doubleton Yugus arinus (911 m, 934 m) to Malirekus hastatus (median = 1187 m).

3.5. Rare and Regional Species

Approximately 36% (=21/58) of species collected are known only in the southern Appalachian Highlands region (Table 3). Regionally restricted, however, does not necessarily mean “rare”. Isoperla pauli, I. starki, I. stewarti, and S. sheldoni have each been described within the previous eight years and distributional knowledge for all four species is limited at best. Leuctra mitchellensis (Hanson, 1941) may only be present in a small range in western North Carolina (Table 2 and Table S2; Grubbs, S.A. (Western Kentucky University, Bowling Green, KY, USA; Unpublished work)), yet was found commonly during this study. We were mildly surprised that Zapada fumosa was not collected during this study. Although there are only nine published locality records for Z. fumosa from southwestern Virginia, east Tennessee, and western North Carolina [86], the latter harbors six of these sites from habitats close in proximity and similar in elevation and degree of protection. We did collect one (M. williamsae) of the two species listed by North Carolina (NC) as a Species of Greatest Conservation Need in their state’s Wildlife Action Plan (WAP) [99], but the second species listed (Z. chila) is presently known from only one stream in east Tennessee in the Great Smoky Mountains National Park [86]. The full extent of the taxonomic concepts of the two southeastern Zapada species were likely not known to the NC WAP authors at time of publication in 2015.

4. Conclusions

The Mount Mitchell State Park and adjacent Pisgah National Forest provides a protected landscape to address ecological and conservation questions. In a six-year period, fifty-eight species were collected, and most sampling trips added additional species records. Many species were found across elevations and are typical of cold headwater streams in the Appalachian Mountains. Prior to this study, approximately 140 species had been reported from the Blue Ridge of western North Carolina [34]. In addition to one new species description [60], three species, namely A. harperi, L. truncata, and S. onkos, are new additions to the state’s faunal list. More species, especially winter-emergent stoneflies, are likely present in the study area because there were very few sampling efforts between December and March. The integrative molecular approach added additional information on species presence, namely the number of individuals and unique sites for each species. Limitations, however, with female Leuctra identifications remain. Nearly 500 females from 2014–2019 are still unidentified and could potentially provide additional information. This paper lays a foundation for the use of integrative approaches on different taxonomic groups to describe the fauna and assess ecological patterns of a region.

Supplementary Materials

The following supporting information can be downloaded at: https://www.mdpi.com/article/10.3390/ecologies4030028/s1, Table S1: Presence–absence dataset for 11 eastern USA stonefly fauna used to construct the Jaccard dissimilarity dendrogram. Families are organized by alphabetical order. 0 = absent; 1 = present. AL = Alabama; IL = Illinois; KY = Kentucky; NC = North Carolina; OH = Ohio; PA = Pennsylvania; TN = Tennessee; WI = Wisconsin.; Table S2: Darwin Core Archive (DwC-A) file of all specimen records accrued during 2014–2019 at Mount Mitchell State Park and adjacent Pisgah National Forest, North Carolina, USA. Columns are represented by official DwC-A headers. Families are organized by alphabetical order.; Table S3: Adult presence of stoneflies in the study region. Pteronarcyidae were collected only as a single exuvium and were not included. Species are partitioned by family; families are listed in alphabetical order. Months were divided into 10-day units. Blue shading represents when the individuals were collected; grey represents periods where they were likely present but not collected by the authors. Sampling did not occur in December–January.

Author Contributions

M.L.M. collected and identified specimens, managed specimen curation and storage, performed laboratory and data analyses, prepared images, and wrote and edited the text. S.A.G. participated in the conception of this project, collected and identified specimens, managed specimen curation and storage, and wrote and edited the text. All authors have read and agreed to the published version of the manuscript.

Funding

Funding for work performed during 2019–2020 was provided by the Western Kentucky University (WKU) Center for Biodiversity Studies and the WKU Graduate School.

Institutional Review Board Statement

Not applicable.

Informed Consent Statement

Not applicable.

Data Availability Statement

The data presented in this study are available on request from the corresponding author. The data are not publicly available due to ongoing analyses.

Acknowledgments

The late Andy Sheldon, formerly of the University of Montana, was the origin of this research. He was intrigued by mountain stoneflies in general, including the fauna of the southern Appalachian Mountain Highlands. His quest to collect from Mt. Mitchell in particular stemmed from his desire to find eastern Nearctic Zapada. He was responsible for most of the collecting during 2014–2017. Garret Kratina, Cris Metzger, Elizabeth Metzger, and Margaret Metzger assisted with long hours of fieldwork during 2019.

Conflicts of Interest

The authors declare no conflict of interest. The funders had no role in the design of the study; in the collection, analyses, or interpretation of data; in the writing of the manuscript; or in the decision to publish the results.

References

  1. Venter, O.; Fuller, R.A.; Segan, D.B.; Carwardine, J.; Brooks, T.; Butchart, S.H.M.; Di Marco, M.; Iwamura, T.; Joseph, L.; O’Grady, D.; et al. Targeting global protected area expansion for imperiled biodiversity. PLoS Biol. 2014, 12, e1001891. [Google Scholar] [CrossRef] [PubMed] [Green Version]
  2. Scott, D. Global environmental change and mountain tourism In Tourism and Global Environmental Change; Gössling, S., Hall, M.C., Eds.; Routledge: London, UK, 2006; pp. 54–75. [Google Scholar]
  3. Mainstone, C.P. The role of specially designated wildlife sites in freshwater conservation—An English perspective. Freshwat. Rev. 2008, 1, 89–98. [Google Scholar] [CrossRef] [Green Version]
  4. Nelson, G.C.; Rosegrant, M.W.; Koo, J.; Robertson, R.; Sulser, T.; Zhu, T.; Ringler, C.; Msangi, S.; Palazzo, A.; Batka, M.; et al. Climate Change: Impact on Agriculture and Costs of Adaptation; International Food Policy Research Institute Food Policy Report, International Food Policy Research Institute: Washington, DC, USA, 2009; 199p. [Google Scholar]
  5. Niño-García, J.P.; Ruiz-González, C.; del Giogrio, P.A. Interactions between hydrology and water chemistry shape bacterioplankton biogeography across boreal freshwater. IMSE J. 2016, 10, 1755–1766. [Google Scholar] [CrossRef] [PubMed] [Green Version]
  6. Bojsen, B.H. Effects of deforestation on fish community structure in Ecuadorian Amazon streams. Freshwat. Biol. 2002, 47, 2246–2260. [Google Scholar] [CrossRef]
  7. Mainstone, C.P.; Clarke, S.J. Managing multiple stressors on sites with special protection for freshwater wildlife—The concept of limits of liability. Freshwat. Rev. 2008, 1, 175–187. [Google Scholar] [CrossRef]
  8. Nelson, K.C.; Palmer, M.A. Stream temperature surges under urbanization and climate change: Data, models, and responses. J. Am. Wat. Res. Assoc. 2007, 43, 440–452. [Google Scholar] [CrossRef]
  9. Treanor, H.B.; Giersch, J.J.; Kappenman, K.M.; Muhlfeld, C.C.; Webb, M.A.H. Thermal tolerance of meltwater stonefly Lednia tumana nymphs from an alpine stream in Waterton-Glacier International Peace Park, Montana, USA. Freshwat. Sci. 2013, 32, 597–605. [Google Scholar] [CrossRef]
  10. Jordan, S.; Giersch, J.J.; Muhlfeld, C.C.; Hotaling, S.; Fanning, L.; Tappenbeck, T.H.; Luikart, G. Loss of genetic diversity and increased subdivision in an endemic alpine stonefly threatened by climate change. PLoS ONE 2016, 11, e0157386. [Google Scholar] [CrossRef] [Green Version]
  11. Domisch, S.; Jähnig, S.C.; Haase, P. Climate-change winners and losers: Stream macroinvertebrates of a submontane region in Central Europe. Freshwat. Biol. 2011, 56, 2009–2020. [Google Scholar] [CrossRef]
  12. Muhlfeld, C.C.; Giersch, J.J.; Hauer, F.R.; Pederson, G.T.; Luikart, G.; Peterson, D.P.; Downs, C.C.; Fagre, D.B. Climate change links fate of glaciers and an endemic alpine invertebrate. Clim. Chang. 2011, 106, 337–345. [Google Scholar] [CrossRef]
  13. Webb, B.W.; Clack, P.D.; Walling, D.E. Water-air temperature relationships in a Devon River system and the role of flow. Hydrol. Proc. 2003, 17, 3069–3084. [Google Scholar] [CrossRef]
  14. Kundzewicz, Z.W.; Döll, P. Will groundwater ease freshwater stress under climate change? Hydrol. Sci. J. 2009, 54, 665–675. [Google Scholar] [CrossRef] [Green Version]
  15. Parmesan, C.; Yohe, G. A globally coherent fingerprint of climate change impacts across natural systems. Nature 2003, 421, 37–42. [Google Scholar] [CrossRef] [PubMed]
  16. Walther, G.R.; Post, E.; Convey, P.; Menzel, A.; Parmesan, C.; Beebee, T.J.; Fromentin, J.M.; Hoegh-Guldberg, O.; Bairlein, F. Ecological responses to recent climate change. Nature 2002, 416, 389–395. [Google Scholar] [CrossRef] [PubMed]
  17. Sheldon, A.L. Possible climate-induced shift of stoneflies in a southern Appalachian catchment. Freshwat. Sci. 2012, 31, 765–774. [Google Scholar] [CrossRef]
  18. Shuter, B.J.; Post, J.R. Climate, population viability and the zoogeography of temperate fishes. Trans. Am. Fish. Soc. 1990, 119, 314–336. [Google Scholar] [CrossRef]
  19. Sweeney, B.W.; Jackson, J.K.; Newbold, D.N.; Funk, D.H. Climate change and the life histories and biogeography of aquatic insects in eastern North America. In Global Climate Change and Freshwater Ecosystems; Firth, P., Fisher, S.G., Eds.; Springer: New York, NY, USA, 1992; pp. 143–176. [Google Scholar]
  20. Williams, S.E.; Shoo, L.P.; Isaac, J.L.; Hoffman, A.A.; Langham, G. Towards an integrated framework for assessing the vulnerability of species to climate change. PLoS Biol. 2008, 12, e235. [Google Scholar] [CrossRef]
  21. Busby, J.R. Potential impacts of climate change on Australia’s flora and fauna. In Greenhouse: Planning for Climate Change; Pearman, G.I., Ed.; E.J. Brill: New York, NY, USA, 1988; pp. 387–398. [Google Scholar]
  22. Thuiller, W.; Lavorel, S.; Araújo, M.B.; Sykes, M.T.; Prentice, I.C. Climate change threats to plant diversity in Europe. Proc. Nat. Acad. Sci. USA 2005, 102, 8245–8250. [Google Scholar] [CrossRef] [Green Version]
  23. Williams, L.R.; Taylor, C.M.; Warren, M.L., Jr.; Clingenpeel, J.A. Environmental variability, historical contingency, and the structure of regional fish and macroinvertebrate faunas in Ouachita Mountain stream systems. Trans. Amer. Fish. Soc. 2003, 132, 120–130. [Google Scholar] [CrossRef]
  24. Sauer, J.; Domsich, S.; Nowak, C.; Haase, P. Low mountain ranges: Summit traps for montane freshwater species under climate change. Biodivers. Conserv. 2011, 20, 3133–3146. [Google Scholar] [CrossRef]
  25. Downes, B.J. Back to the future: Little-used tools and principles of scientific inference can help disentangle effects of multiple stressors on freshwater ecosystems. Freshwat. Biol. 2010, 55, 60–79. [Google Scholar] [CrossRef]
  26. Statzner, B.; Bêche, L.A. Can biological invertebrate traits resolve effects of multiple stressors on running water ecosystems? Freshwat. Biol. 2010, 55, 80–119. [Google Scholar] [CrossRef]
  27. Resh, V.H. Which group is best? Attributes of different biological assemblages used in freshwater biomonitoring programs. Env. Mon. Assess. 2008, 138, 131–138. [Google Scholar] [CrossRef] [PubMed]
  28. Saltveit, S.J.; Brittain, J.E.; Lillehammer, A. Stoneflies and river regulation—A Review. In Regulated Streams; Craig, J.F., Kemper, J.B., Eds.; Springer: Boston, MA, USA, 1987; pp. 117–129. [Google Scholar]
  29. Master, L.L.; Stein, B.A.; Kutner, L.S.; Hammerson, G.A. Vanishing assets, conservation status of U.S. species. In Precious Heritage, The Status of Biodiversity in the United States; Stein, B.A., Kutner, L.S., Adams, J.S., Eds.; Oxford University Press: New York, NY, USA, 2000; pp. 93–118. [Google Scholar]
  30. DeWalt, R.E.; Favret, C.; Webb, D.W. Just how imperiled are aquatic insects? A case study of stoneflies (Plecoptera) in Illinois. Ann. Ent. Soc. Am. 2005, 98, 941–950. [Google Scholar] [CrossRef]
  31. Bojková, J.; Komprdova, K.; Soldán, T.; Zahrádková, S. Species loss of stoneflies (Plecoptera) in the Czech Republic during the 20th century. Freshwat. Biol. 2012, 57, 2550–2567. [Google Scholar] [CrossRef]
  32. DeWalt, R.E.; Ower, G.D. Ecosystem services, global biodiversity and rate of stonefly species descriptions (Insecta: Plecoptera). Insects 2019, 10, 99. [Google Scholar] [CrossRef] [Green Version]
  33. Figueroa, J.M.; López-Rodríguez, M.J.; Lorenz, A.; Graf, A.; Schmidt-Kloiber, A.; Hering, D. Vulnerable taxa of European Plecoptera (Insecta) in the context of climate change. Biodiv. Conserv. 2009, 19, 1269–1277. [Google Scholar] [CrossRef]
  34. Beaty, S.R. The Plecoptera of North Carolina: A Biologist’s Handbook for the Identification of Stonefly Nymphs with Standard Taxonomic Effort Levels; Version 4.0; North Carolina Department of Environmental Quality, Division of Water Resources, Biological Assessment Branch: Raleigh, NC, USA, 2015; iv + 93p. [Google Scholar]
  35. Keith, A. Description of the Mount Mitchell Quadrangle; North Carolina-Tennessee: U.S. Geological Survey Geological Atlas, Folio 124; U.S. Geological Survey: Washington, DC, USA, 1905; 9p. [Google Scholar]
  36. Moore, P.T.; van Miegroet, H.; Nicholas, N.S. Examination of forest recovery scenarios in Southern Appalachian Picea-Abies forest. Forestry 2008, 81, 183–194. [Google Scholar] [CrossRef] [Green Version]
  37. Lusk, L.; Mutel, M.; Walker, E.S.; Levey, F. Forest change in high-elevation forests of Mt. Mitchell, North Carolina: Re-census and analysis of data collected over 40 years. In Proceedings of the Conference on the Ecology and Management of High-Elevation Forests in the Central and Southern Appalachian Mountains, Snowshoe Mountain Resort, Slatyfork, WV, USA, 14–15 May 2009. [Google Scholar]
  38. North Carolina State Climate Office. Available online: https://climate.ncsu.edu/office/ (accessed on 15 July 2022).
  39. Deyton, J.B. The Toe River Valley to 1865. N. Car. Hist. Rev. 1947, 24, 423–466. [Google Scholar]
  40. Silver, T. Mount Mitchell and the Black Mountains: An Environmental History of the Highest Peaks in Eastern America; The University of North Carolina Press: Chapel Hill, NC, USA, 2003; 322p. [Google Scholar]
  41. Metzger, M.L. An Integrative Ecological and Taxonomic Assessment of the Stoneflies (Plecoptera) of the Black Mountains, North Carolina, USA. Master’s Thesis, Western Kentucky University, Bowling Green, KY, USA, 2020. Available online: https://digitalcommons.wku.edu/theses/3198 (accessed on 30 March 2023).
  42. Metzger, M.L.; Grubbs, S.A.; Johnson, J.J. An integrative phylogenetic analysis of eastern Nearctic Leuctra (Plecoptera: Leuctridae), with an emphasis on the fauna of southern Appalachian Highlands landscape. Can. Ent. 2022, 154, e15. [Google Scholar] [CrossRef]
  43. Stark, B.P.; Nelson, C.R. The Nearctic plecopteran families: Morphology and systematics. In Stoneflies (Plecoptera) of Eastern North America. Volume 1. Pteronarcyidae, Peltoperlidae, and Taeniopterygidae; Stark, B.P., Armitage, B.J., Eds.; Bulletin of the Ohio Biological Series; Ohio Biological Survey: Columbus, OH, USA, 2000; Volume 14, pp. 11–28. [Google Scholar]
  44. Ross, H.H.; Ricker, W.E. The classification, evolution, and dispersal of the winter stonefly genus Allocapnia. Ill. Biol. Monogr. 1971, 45, 1–167. [Google Scholar]
  45. Kirchner, R.F. A new Allocapnia from Virginia (Plecoptera: Capniidae). Ent. News 1980, 91, 19–21. [Google Scholar]
  46. Stark, B.P.; Baumann, R.W. The winter stonefly genus Paracapnia. Monogr. West. N. Am. Nat. 2004, 2, 96–108. [Google Scholar]
  47. Surdick, R.F. Chloroperlidae (The Sallflies). In The Stoneflies (Plecoptera) of Eastern North America. Volume II. Chloroperlidae, Perlidae, and Perlodidae (Perlodinae); Stark, B.P., Armitage, B.J., Eds.; Bulletin of the Ohio Biological Series; Ohio Biological Survey: Columbus, OH, USA, 2004; Volume 14, pp. 1–60. [Google Scholar]
  48. Grubbs, S.A.; Baumann, R.W. Alloperla clarki sp. nov. (Plecoptera: Chloroperlidae), a new species from the eastern Nearctic with discussion of a new species group. Zootaxa 2019, 4624, 241–255. [Google Scholar] [CrossRef]
  49. Kondratieff, B.C.; Kirchner, R.F. A new species in the Sweltsa onkos Complex (Plecoptera: Chloroperlidae). In A Lifetime Contributions to Myriapodology and the Natural History of Virginia: A Festschrift in Honor of Richard, L. Hoffman’s 80th Birthday; Roble, S.M., Mitchell, J.C., Eds.; Virginia Museum of Natural History Special Publication: Martinsville, VA, USA, 2009; Volume 16, pp. 295–300. [Google Scholar]
  50. Hitchcock, S.W. Guide to the insects of Connecticut. Part VII. The Plecoptera or stoneflies of Connecticut. Bull. State Geol. Nat. Hist. Surv. 1974, 107, 1–262. [Google Scholar]
  51. Claassen, P.W. New species of North American Plecoptera. Can. Ent. 1923, 55, 257–263, 281–293. [Google Scholar] [CrossRef]
  52. Grubbs, S.A. Leuctra schusteri, a new stonefly species (Plecoptera: Leuctridae) of the L. tenuis (Pictet) group from the southeastern USA. Illiesia 2015, 11, 147–166. [Google Scholar]
  53. Hanson, J.F. Studies on the Plecoptera of North America, II. Bull. Brook. Ent. Soc. 1941, 36, 57–66. [Google Scholar]
  54. Hanson, J.F. Records and descriptions of North American Plecoptera. Part I. New species of Leuctra of the eastern United States. Am. Mid. Nat. 1941, 26, 174–178. [Google Scholar] [CrossRef]
  55. Harper, P.P.; Harper, F. The genus Leuctra Stephens in North America: A preliminary report. In Ephemeroptera & Plecoptera: Biology-Ecology-Systematics; Landolt, P., Sartori, M., Eds.; MTL: Fribourg, Switzerland, 1997; pp. 467–472. [Google Scholar]
  56. Baumann, R.W.; Stark, B.P. The genus Megaleuctra Neave (Plecoptera: Leuctridae) in North America. Illiesia 2013, 9, 65–93. [Google Scholar]
  57. Stark, B.P.; Kyzar, J.W. Systematics of Nearctic Paraleuctra with description of a new genus (Plecoptera: Leuctridae). Tijd. Ent. 2000, 144, 135–199. [Google Scholar] [CrossRef] [Green Version]
  58. Baumann, R.W. Revision of the stonefly family Nemouridae (Plecoptera): A study of the world fauna at the generic level. Smithson. Cont. Zool. 1975, 211, 1–74. [Google Scholar] [CrossRef] [Green Version]
  59. Grubbs, S.A.; Baumann, R.W. The Nemourinae (Insecta, Nemouridae) of the eastern Nearctic. Zootaxa 2023, 5306, 1–53. [Google Scholar] [CrossRef]
  60. Grubbs, S.A.; Baumann, R.W. Soyedina Ricker, 1952 (Plecoptera: Nemouridae) in the eastern Nearctic: Review of species concepts, proposed morphology-based species groups, and description of a new species from North Carolina. Zootaxa 2019, 4658, 223–250. [Google Scholar] [CrossRef]
  61. Stark, B.P. Peltoperlidae (The Roachflies). In The Stoneflies (Plecoptera) of Eastern North America. Volume I. Pteronarcyidae, Peltoperlidae, and Taeniopterygidae; Stark, B.P., Armitage, B.J., Eds.; Bulletin of the Ohio Biological Series; Ohio Biological Survey: Columbus, OH, USA, 2000; Volume 14, pp. 41–54. [Google Scholar]
  62. Stewart, K.W.; Stark, B.P. Nymphs of the North American Stonefly Genera (Plecoptera), 2nd ed.; Caddis Press: Columbus, OH, USA, 2002; 510p. [Google Scholar]
  63. Stark, B.P. Perlidae (The Stones). In The Stoneflies (Plecoptera) of Eastern North America. Volume II. Chloroperlidae, Perlidae, and Perlodidae (Perlodinae); Stark, B.P., Armitage, B.J., Eds.; Bulletin of the Ohio Biological Series; Ohio Biological Survey: Columbus, OH, USA, 2004; Volume 14, pp. 61–148. [Google Scholar]
  64. Stark, B.P.; Szczytko, S.W. Contributions to the systematics of Paragnetina (Plecoptera: Perlidae). J. Kansas Ent. Soc. 1981, 54, 625–648. [Google Scholar]
  65. Kondratieff, B.C. Perlodidae—Perlodinae (The Springflies). In The Stoneflies (Plecoptera) of Eastern North America. Volume II. Chloroperlidae, Perlidae, and Perlodidae (Perlodinae); Stark, B.P., Armitage, B.J., Eds.; Bulletin of the Ohio Biological Series; Ohio Biological Survey: Columbus, OH, USA, 2004; Volume 14, pp. 149–190. [Google Scholar]
  66. Beaty, S.R.; Holland, V.B.; Lenat, D.R. Isoperla arcana and Isoperla borisi (Plecoptera: Perlodidae), two new stonefly species from North Carolina, USA with notes on the distribution of Isoperla powhatan. Illiesia 2017, 13, 140–166. [Google Scholar]
  67. Szczytko, S.W.; Kondratieff, B.C. A review of the eastern Nearctic Isoperlinae (Plecoptera: Perlodidae) with the description of twenty-two new species. Monogr. Illiesia 2015, 1, 1–289. [Google Scholar]
  68. Verdone, C.J.; Kondratieff, B.C. A new species of Isoperla Banks (Plecoptera: Perlodidae) from the Appalachian Mountains, Virginia & West Virginia, USA. Illiesia 2016, 12, 74–85. [Google Scholar]
  69. Verdone, C.J.; Kondratieff, B.C. A new species of Isoperla Banks (Plecoptera: Perlodidae) from the Appalachian Mountains, with notes on the I. montana group. Illiesia 2017, 13, 111–126. [Google Scholar]
  70. Verdone, C.J.; Kondratieff, B.C. Holomorphology and systematics of the eastern Nearctic stonefly genus Remenus Ricker (Plecoptera: Perlodidae). Illiesia 2018, 14, 81–125. [Google Scholar]
  71. Myers, L.; Kondratieff, B.C. Larvae of North American species of Pteronarcys (Plecoptera: Pteronarcyidae). Illiesia 2017, 13, 192–224. [Google Scholar]
  72. Stewart, K.W. Taeniopterygidae (The Willowflies). In The Stoneflies (Plecoptera) of Eastern North America. Volume I. Pteronarcyidae, Peltoperlidae, and Taeniopterygidae; Stark, B.P., Armitage, B.J., Eds.; Bulletin of the Ohio Biological Series; Ohio Biological Survey: Columbus, OH, USA, 2000; Volume 14, pp. 55–98. [Google Scholar]
  73. Folmer, O.; Black, M.; Hoeh, W.; Lutz, R.; Vrijenhoek, R. DNA primers for amplification of mitochondrial cytochrome c oxidase subunit I from diverse metazoan invertebrates. Mol. Mar. Biol. Biotech. 1994, 3, 294–299. [Google Scholar]
  74. Kumar, S.; Stecher, G.; Li, M.; Knyaz, C.; Tamura, K. MEGA X: Molecular Evolutionary Genetics Analysis across computing platforms. Mol. Biol. Evol. 2018, 35, 1547–1549. [Google Scholar] [CrossRef] [PubMed]
  75. Puillandre, N.; Lambert, A.; Brouillet, S.; Achaz, G. ABGD, Automatic Barcode Gap Discovery for primary species delimitation. Mol. Ecol. 2012, 21, 1864–1877. [Google Scholar] [CrossRef]
  76. Colwell, R.K. EstimateS: Statistical Estimation of Species Richness and Shared Species from Samples. 2013. Version 9. User’s Guide and Application. Available online: http://purl.oclc.org/estimates (accessed on 2 June 2023).
  77. Gotelli, N.J.; Colwell, R.K. Estimating species richness. In Biological Diversity: Frontiers in Measurement and Assessment; Magurran, A.E., McGill, B.J., Eds.; Oxford University Press: Oxford, UK, 2010; pp. 39–54. [Google Scholar]
  78. Chao, A. Estimating the population size of for capture-recapture data with unequal catchability. Biometrics 1987, 43, 789–791. [Google Scholar] [CrossRef]
  79. Lee, S.M.; Chao, A. Estimating population size via sample coverage for closed capture-recapture models. Biometrics 1994, 50, 88–97. [Google Scholar] [CrossRef]
  80. DeWalt, R.E.; Maehr, M.D.; Hopkins, H.; Neu-Becker, U.; Stueber, G.; Plecoptera Species File Online. Version 5.0/5.0. 2023. Available online: http://Plecoptera.SpeciesFile.org (accessed on 28 June 2022).
  81. DeWalt, R.E.; Snyder, E.D. Plecoptera of Crane Hollow Nature Preserve, Ohio, comparison to similar efforts. Illiesia 2017, 13, 70–81. [Google Scholar]
  82. Parker, C.R.; Flint, O.S., Jr.; Jacobus, L.M.; Kondratieff, B.C.; McCafferty, W.P.; Morse, J.C. Ephemeroptera, Plecoptera, Megaloptera, and Trichoptera of Great Smoky Mountains National Park. Southeast. Nat. Spec. Iss. 2007, 1, 159–174. [Google Scholar] [CrossRef]
  83. Grubbs, S.A.; Sheldon, A.L. The stoneflies (Insecta, Plecoptera) of the Talladega Mountain region, Alabama, USA: Distribution, elevation, endemism, and rarity patterns. Biodivers. Data J. 2018, 6, e22839. [Google Scholar] [CrossRef] [Green Version]
  84. McRoberts, T.C.; Grubbs, S.A. Effects of stream permanence on stonefly (Insecta, Plecoptera) community structure at Mammoth Cave National Park, Kentucky, USA Biodivers. Data J. 2021, 9, e62242. [Google Scholar] [CrossRef]
  85. Grubbs, S.A.; Kondratieff, B.C.; Baumann, R.W. A surprising rediscovery and description of a new species of Soyedina Ricker, 1952 (Plecoptera: Nemouridae) from Great Smoky Mountains National Park, USA. J. Ins. Biodiv. 2019, 13, 1–5. [Google Scholar] [CrossRef]
  86. Grubbs, S.A.; Baumann, R.W.; Sheldon, A.L. A review of eastern Nearctic Zapada (Plecoptera: Nemouridae) with a new species from the Great Smoky Mountains. Freshwat. Sci. 2015, 34, 1312–1323. [Google Scholar] [CrossRef]
  87. DeWalt, R.E.; South, E.J. Ephemeroptera, Plecoptera, and Trichoptera on Isle Royale National Park, USA, compared to mainland species pool and size distribution. ZooKeys 2015, 532, 137–158. [Google Scholar] [CrossRef]
  88. DeWalt, R.E.; South, E.J.; Robertson, D.R.; Marburger, J.E.; Smith, W.W.; Brinson, V. Mayflies, stoneflies, and caddisflies of streams and marshes of Indiana Dunes National Lakeshore, USA. ZooKeys 2016, 556, 43–63. [Google Scholar] [CrossRef]
  89. Bogan, M.T.; Carslon, S.M. Diversity and phenology of stoneflies (Plecoptera) from intermittent and perennial streams in Pinnacles National Park, California, USA. Illiesia 2018, 14, 144–154. [Google Scholar]
  90. Datry, T.; Larned, S.T.; Fritz, K.M.; Bogan, M.T.; Wood, P.J.; Meyer, E.I.; Santos, A.N. Broad-scale patterns of invertebrate richness and community composition in temporary rivers: Effects of flow intermittence. Ecography 2014, 37, 94–104. [Google Scholar] [CrossRef] [Green Version]
  91. Mazor, R.D.; Stein, E.D.; Ode, P.R.; Schiff, K. Integrating intermittent streams into watershed assessments: Applicability of an index of biotic integrity. Freshwat. Sci. 2014, 33, 459–474. [Google Scholar] [CrossRef] [Green Version]
  92. Schriever, T.A.; Bogan, M.T.; Boersma, K.S.; Cañedo-Argüelles, M.; Jaeger, K.L.; Olden, J.D.; Lytle, D.A. Hydrology shapes taxonomic and functional structure of desert stream invertebrate communities. Freshwat. Sci. 2015, 34, 399–409. [Google Scholar] [CrossRef] [Green Version]
  93. Bogan, M.T. Hurry up and wait: Life cycle and distribution of an intermittent stream specialist (Mesocapnia arizonensis). Freshwat. Sci. 2017, 36, 805–815. [Google Scholar] [CrossRef] [Green Version]
  94. Kerst, C.D.; Anderson, N.H. The Plecoptera community of a small stream in Oregon, USA. Freshwat. Biol. 1975, 5, 189–203. [Google Scholar] [CrossRef]
  95. Harper, P.P. Life histories of Nemouridae and Leuctridae in southern Ontario (Plecoptera). Hydrobiologia 1973, 41, 309–356. [Google Scholar] [CrossRef]
  96. Grubbs, S.A.; Thomas, C.M.; Hutchins, B.T.; Taylor, J.M. Life cycles of Allocapnia recta and Leuctra spp. (Plecoptera: Capniidae and Leuctridae) across a flow gradient in a central Kentucky karst headwater stream. Southeast. Nat. 2006, 5, 321–332. [Google Scholar] [CrossRef]
  97. DeWalt, R.E.; Cao, Y.; Tweddale, T.; Grubbs, S.A.; Hinz, L.; Pessino, M.; Robinson, J.L. Ohio USA stoneflies (Insecta: Plecoptera): Species richness estimation, distribution of functional niche traits, drainage affiliations, and relationships to other states. ZooKeys 2012, 178, 1–26. [Google Scholar] [CrossRef] [PubMed] [Green Version]
  98. Harper, P.P.; Hynes, H.B.N. The Leuctridae of eastern Canada (Insecta; Plecoptera). Can. J. Zool. 1971, 49, 915–920. [Google Scholar] [CrossRef]
  99. North Carolina State Wildlife Action Plan. Wildlife Action Plan. Available online: https://ncwildlife.org/plan (accessed on 22 March 2023).
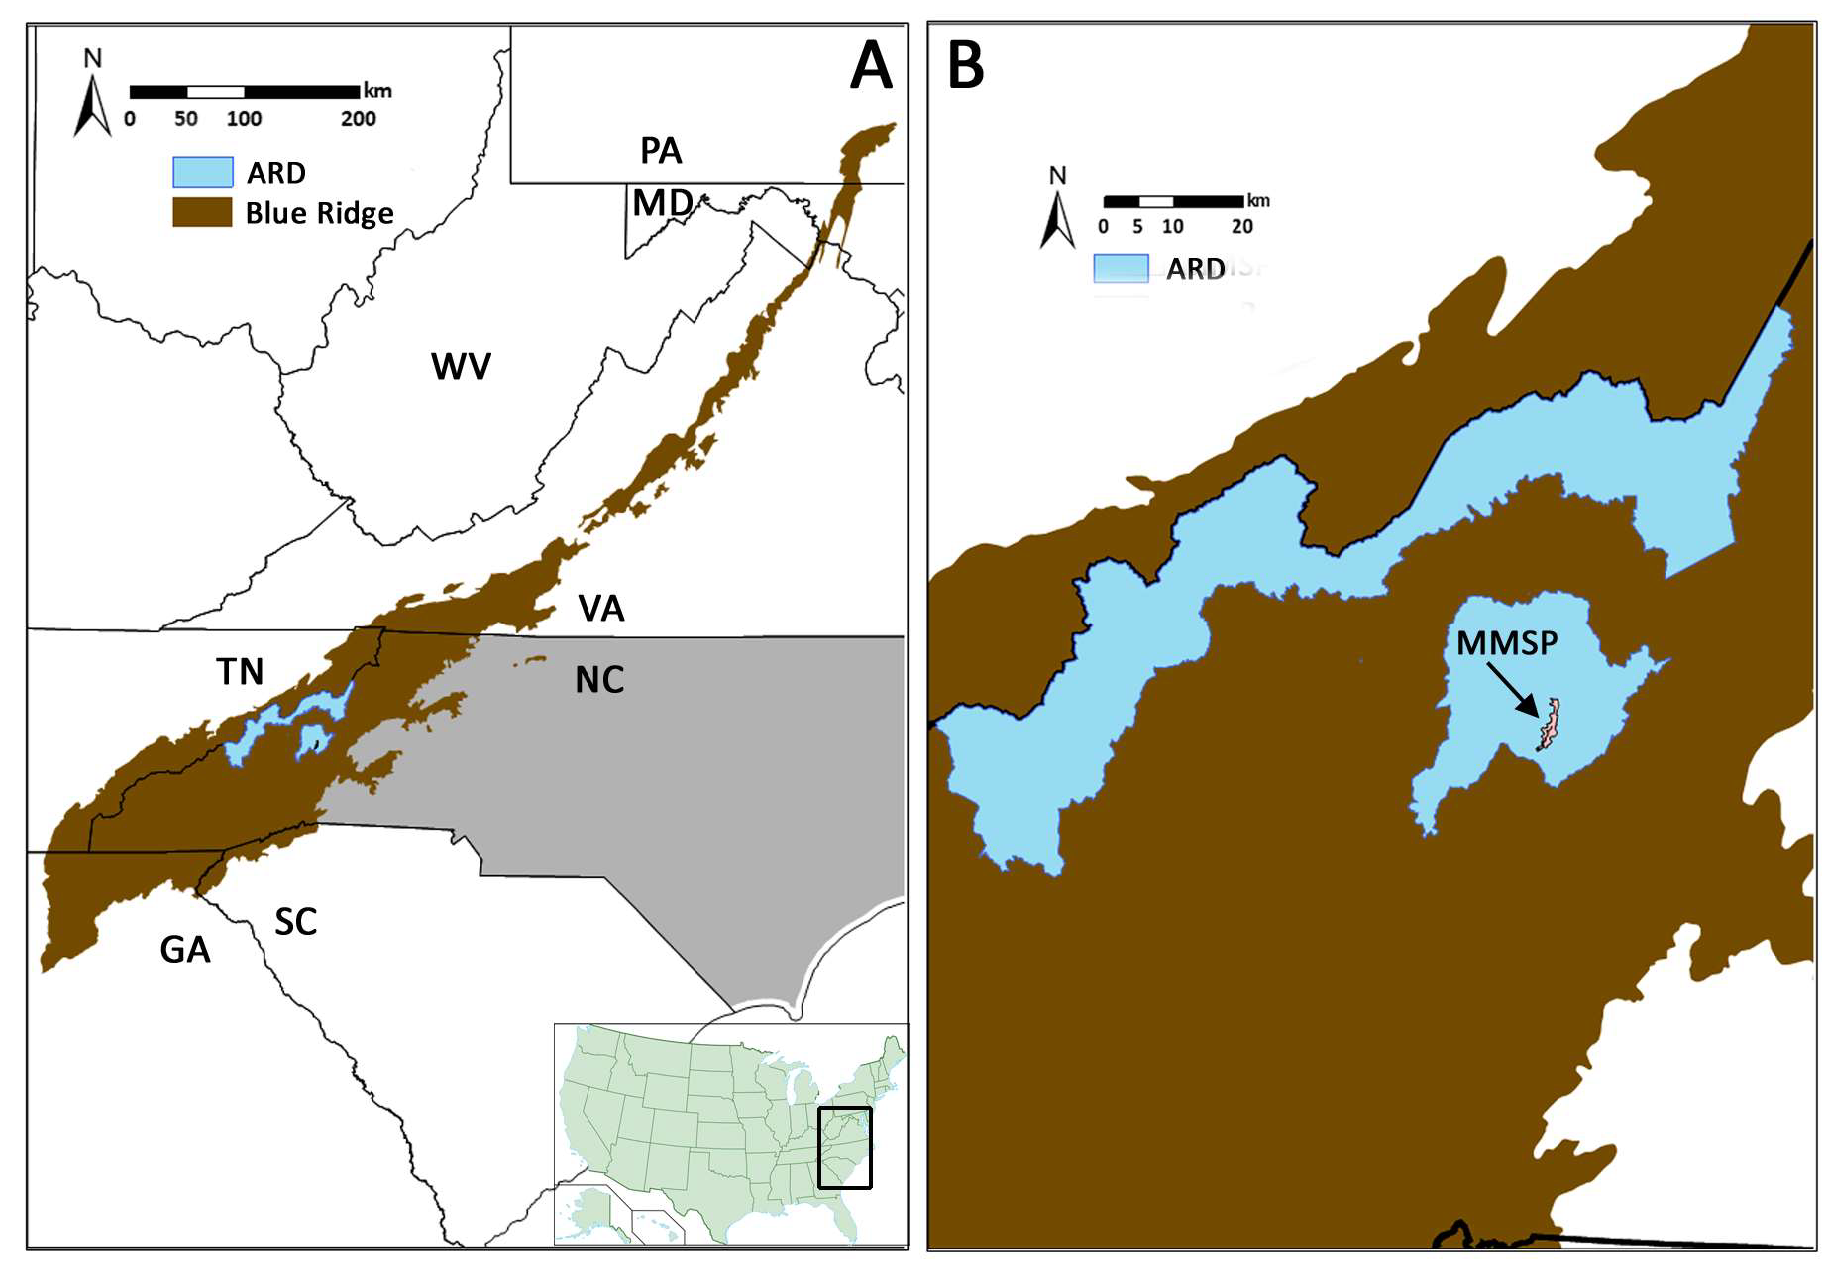
Figure 1. (A) Distribution of the Blue Ridge Region and the Appalachian Ranger District (ARD) in the USA. North Carolina is filled in light gray. (B) Blow-up of the Mount Mitchell State Park (MMSP) within ARD. GA = Georgia; MD = Maryland; NC = North Carolina; PA = Pennsylvania; SC = South Carolina; TN = Tennessee; VA = Virginia; WV = West Virginia.
Ecologies 04 00028 g001
Figure 2. Collection sites during 2014–2019 from Mount Mitchell State Park and adjacent Appalachian Ranger District, Pisgah National Forest, North Carolina, USA. SP = state park; RD = ranger district. Symbols refer to site locations; values refer to site numbers (see Table 1).
Ecologies 04 00028 g002
Figure 3. Number of unique species collected by sampling trips. Numbers parenthetically in red below the sampling date refer to number of unique collections sites.
Ecologies 04 00028 g003
Figure 4. Unique number species collected from each site (red bars) vs. the number of collection events per site (blue line). Sites numbers are the same as in Table 1.
Ecologies 04 00028 g004
Figure 5. Species richness estimators vs. observed number of species from Mount Mitchell State Park and adjacent Pisgah National Forest.
Ecologies 04 00028 g005
Figure 6. Number of species in the region represented by singletons (10) and doubletons (9).
Ecologies 04 00028 g006
Figure 7. Comparison of Nearctic families collected during this study (open bars) vs. North Carolina (closed bars). Proportions are listed above each bar.
Ecologies 04 00028 g007
Figure 8. Jaccard dissimilarity dendrogram of the study fauna from Mount Mitchell and adjacent Pisgah National Forest, North Carolina, USA, and 11 other eastern USA faunal assemblages. AL = Alabama; IL = Illinois; KY = Kentucky; NC = North Carolina; OH = Ohio; PA = Pennsylvania; TN = Tennessee; WI = Wisconsin; Mtns = mountains; NP = national park, NR = nature reserve. *This study* refers to the fauna reported in this paper.
Ecologies 04 00028 g008
Figure 9. Species presence during each season from Mount Mitchell State Park and adjacent Pisgah National Forest, North Carolina, USA. The values on each bar represent the number of collection events in each season.
Ecologies 04 00028 g009
Figure 10. Boxplots representing species by elevation from Mount Mitchell State Park and adjacent Pisgah National Forest. Species are arranged by median elevation or one elevation only if the species is a singleton. Values in red above each plot represent the number of unique sites for each species. Round symbols represent outliers not used to calculate median values (black bar), interquartile range (box), or whiskers (range).
Ecologies 04 00028 g010
Figure 11. Boxplots representing the nine Nearctic families by elevation from Mount Mitchell State Park and adjacent Pisgah National Forest. Families are arranged by median elevation. Round symbols represent outliers not used to calculate median values (black bar), interquartile range (box), or whiskers (range).
Ecologies 04 00028 g011
Table 1. Locality information for 43 unique sites at Mount Mitchell State Park and adjacent Pisgah National Forest, North Carolina, U.S.A. Sites are listed in order of most to fewest species collected.
Site #Water BodyLongitudeLatitudeAltitude (m)Drainage Area (km2)
1South Toe River35.75176−82.2203391129.27
2Lower Creek35.75564−82.2680317190.54
3Neals Creek35.74176−82.214929542.93
4Lower Creek35.75803−82.2677217640.39
5Left Prong South Toe River35.71130−82.2505811841.79
6Right Prong South Toe River35.72900−82.2833016480.22
7Big Lost Cove Creek35.74298−82.211279500.21
8Hemphill Creek35.71024−82.2505711921.35
9tributary Lower Creek35.75630−82.2646017470.14
10Right Prong South Toe River35.73015−82.2841416840.12
11South Fork Upper Creek35.73634−82.2794617050.22
12South Toe River35.74417−82.2283393425.80
13Little Mountain Creek35.75202−82.225349370.12
14unnamed seep35.74279−82.2746817030.09
15Lower Creek35.75953−82.2668318000.13
16Setrock Creek35.75561−82.2432514710.28
17Setrock Creek35.75369−82.2377913730.47
18tributary Setrock Creek35.75393−82.2377313730.09
19tributary Right Prong South Toe River35.72718−82.2837916360.54
20Thee Creek35.78222−82.2543517410.12
21Setrock Creek35.75047−82.2300910160.85
22tributary Hemphill Creek35.71005−82.2495912060.06
23Thee Creek35.78013−82.2509316000.62
24Upper Creek35.73135−82.238589846.60
25Lower Creek35.73407−82.234669694.14
26unnamed seep35.75298−82.2682317040.08
27Balsam Spring35.76647−82.2640619830.01
28tributary Little Mountain Creek35.75627−82.2349410440.12
29(left) tributary South Toe River35.71342−82.2488111543.55
30rock faces35.75592−82.2353413200.14
31Right Prong South Toe River35.73095−82.2848717230.12
32Middle Fork Rock Creek35.76408−82.257261781<0.01
33South Toe River35.74021−82.2323796023.36
34Right Prong South Toe River35.72194−82.2488810744.12
35unnamed seep35.75655−82.235231320<0.00
36Lower Creek35.75694−82.2682517460.47
37North Fork Rock Creek35.77470−82.2559517750.09
38South Toe River35.74000−82.2316695023.36
39unnamed seep35.75369−82.2377913730.47
40South Toe River35.80400−82.2057083184.95
41Rock Creek35.77315−82.218961017<0.00
42Spring35.74395−82.2817218470.01
43Hemphill Creek35.71030−82.2578413321.48
Table 2. Taxonomic references used to identify adult and larval stoneflies in terms of family, genus, and species. References are organized by family and genus (if applicable).
FamilyGenus (If Applicable)References
All families [43]
CapniidaeAllocapnia[44,45]
Paracapnia[46]
Chloroperlidaeall genera[47]
Alloperla[47,48]
Sweltsa[47,49]
Leuctridaeall genera[50]
Leuctra[51,52,53,54,55]
Megaleuctra[56]
Paraleuctra[57]
Nemouridaeall genera [58,59]
AmphinemuraGrubbs and Baumann (unpublished key)
Soyedina[60]
Peltoperlidaeall genera and species[61]
Perlidaeall genera (larvae only) and species[62,63]
Acroneuria (larvae only)[50]
Paragnetina (larvae only)[64]
Perlodidaeto Perlodinae genera (larvae only) and species)[62,65]
Isoperla[66,67,68,69]
Remenus[70]
PteronarcyidaePteronarcys (larvae only)[71]
Taeniopterygidaeall genera/species[72]
Table 3. Species list for Mount Mitchell State Park and adjacent Pisgah National Forest, North Carolina, USA. Families are presented in alphabetical order. * = new state records, ** = species with known distributions only in the southern Appalachian Highlands region.
SpeciesTotal No. CollectionsNo. Unique SitesSpeciesTotal No CollectionsNo. Unique Sites
Family Capniidae Family Perlidae
Allocapnia harperi *11Acroneuria abnormis93
Paracapnia angulata1914Acroneuria carolinensis53
Beloneuria georgiae **11
Family Chloroperlidae Beloneuria stewarti **22
Alloperla chloris32Eccoptura xanthenes55
Alloperla nanina **42Paragnetina immarginata53
Alloperla neglecta **32Perlesta frisoni *64
Alloperla petasata33Perlesta nelsoni43
Alloperla usa107
Suwallia marginata93Family Perlodidae
Sweltsa lateralis3323Isoperla arcana/holochlora66
Sweltsa onkos *107Isoperla cherokee **55
Sweltsa urticae **2416Isoperla dewalti **76
Isoperla kirchneri11
Family Leuctridae Isoperla orata21
Leuctra carolinensis65Isoperla pauli **54
Leuctra ferruginea6424Isoperla powhatan33
Leuctra grandis5431Isoperla pseudosimilis **22
Leuctra mitchellensis **2320Isoperla starki **33
Leuctra sibleyi1913Isoperla stewarti **33
Leuctra tenella88Isoperla WKUC 122
Leuctra tenuis117Isoperla WKUC 211
Leuctra triloba3527Cultus decisus11
Leuctra truncate *1919Remenus bilobatus11
Leuctra variabilis33Remenus WKUC 111
Megaleuctra williamsae **22Malirekus hastatus **88
Paraleuctra sara3425Yugus arinus **22
Yugus bulbosus **22
Family Nemouridae
Amphinemura appalachia64Family Pteronarcyidae
Amphinemura nigritta31Pteronarcys scotti **11
Amphinemura wui5026
Soyedina sheldoni **1614Family Taeniopterygidae
Oemopteryx contorta66
Family Peltoperlidae Strophopteryx limata66
Tallaperla anna **1814
Tallaperla maria1514
Disclaimer/Publisher’s Note: The statements, opinions and data contained in all publications are solely those of the individual author(s) and contributor(s) and not of MDPI and/or the editor(s). MDPI and/or the editor(s) disclaim responsibility for any injury to people or property resulting from any ideas, methods, instructions or products referred to in the content.