Article

Implications of Climate-Induced Localised Extinction of Bull Kelp (Durvillaea amatheiae) for Holdfast Macrofauna

1
Fisheries Research, Marine Ecosystems, NSW Department of Primary Industries, Locked Bag 1, Nelson Bay, NSW 2315, Australia
2
National Marine Science Centre, Southern Cross University, P.O. Box 4321, Coffs Harbour, NSW 2450, Australia
3
Aquamarine Australia, Mullaway, NSW 2456, Australia
*
Author to whom correspondence should be addressed.
Ecologies 2024, 5(2), 218-232; https://doi.org/10.3390/ecologies5020014
Submission received: 22 March 2024 / Revised: 2 April 2024 / Accepted: 6 April 2024 / Published: 14 April 2024

Abstract

:
Globally, work is being undertaken to preserve biodiversity and prevent further species extinctions. Yet, without adequate data about the presence of species within ecosystems, hidden extinctions can occur without our knowledge. Given that poleward range retractions are projected for bull kelp (Durvillaea amatheiae) in southeastern Australia, there is the potential for hidden extinctions to occur in associated macrofaunal species. However, this risk cannot be assessed due to the limited data on the invertebrate macrofauna associated with D. amatheiae. We documented macrofauna within D. amatheiae holdfasts, with the objective of establishing a first analysis of the holdfast fauna for this kelp and identifying, where possible, any host-specific taxa. Holdfasts were collected at six locations, spanning most of the range of D. amatheiae on the southeastern Australian mainland. Macrofauna were removed from holdfasts and identified to the lowest possible taxonomic level. Modelling was applied to determine factors correlated with patterns of assemblages among locations. Holdfast assemblages were found to vary significantly among locations and exhibited a latitudinal gradient in assemblage structure. The northernmost location (Aragunnu), which has the highest risk of D. amatheiae range retractions, was found to have distinct species assemblages and generally higher diversity and abundance than locations further south. However, no host-specific taxa were identified in samples, indicating that there is a low risk of multiple hidden species extinctions occurring in holdfast macrofauna, due to future range retractions of D. amatheiae. Rather, most of the macrofauna taxa in D. amatheiae holdfasts were found to also occur in association with the sympatric golden kelp Ecklonia radiata, which is not expected to undergo range retractions at the latitudes where losses of D. amatheiae are projected. Overall, there is an urgent need to develop strategies to combat projected future range retractions of D. amatheiae to reduce impacts on the species that rely on D. amatheiae for habitat.

1. Introduction

The world is facing an unprecedented extinction crisis [1] with consequent, increased efforts to protect biodiversity and prevent further species extinctions. However, due to a lack of data regarding species distributions and habitat requirements, particularly for invertebrates [2,3], species extinctions may be occurring without our knowledge. One of the major drivers of species extinctions is loss of habitat, caused by anthropogenic impacts, such as land clearing and climate change [4,5]. Climate change is causing habitat loss by driving the poleward range retraction of many habitat-forming foundation species, both on land [6] and in coastal waters [7,8]. In coastal waters, range shifting by foundation macroalgal species, such as kelps, can have major consequences for other species that are dependent on these habitats for food and shelter [9,10]. Concerningly, under some future climate scenarios, modelling predicts local extinctions of some kelp species in southeastern Australia by 2100 [11], which may in turn lead to hidden extinctions among the species that are dependent on these macroalgae. Given the Australian Government’s recent commitment to work towards preventing further species extinctions in Australia [12], there is a need to improve our understanding about the potential for loss of species that are dependent on kelp habitats when poleward range contractions of kelp occur.
Of particular concern is the impact that range contractions by bull kelp (Durvillaea amatheiae, [13]) will have on dependent species in southeastern Australia. Durvillaea amatheiae is endemic to southeastern Australia, including eastern and western, but not northern, Tasmania [13]. It is an intertidal species inhabiting wave-exposed rocky reefs and is currently found along the mainland Australian coast from Aragunnu (36.59° S, 150.04° E) in New South Wales (NSW) to Wilson’s Promontory (39.06° S, 146.46° E) in Victoria [13,14]. This species is projected to become extinct on mainland Australia by 2100, under Representative Concentration Pathway 6.0 [11]. Kelps from the genus Durvillaea are important foundation species, providing habitat for low-intertidal and subtidal marine communities [15,16,17]. Therefore, any range contractions for D. amatheiae will generate negative impacts for dependent species and may precipitate hidden extinctions. Closely related Durvillaea spp. in New Zealand have already experienced local extinctions during marine heatwaves in 2017/2018 [15], leading to long-term community shifts [18], indicating that fears for the future of D. amatheiae and its dependent species in Australia are not unfounded.
However, little is known about the faunal assemblages associated with D. amatheiae, so the risk of hidden extinctions under range contractions cannot presently be assessed. Previous research has demonstrated that other habitat-forming macroalgal species (e.g., Ecklonia radiata, Durvillaea antarctica) can shelter diverse faunal assemblages, particularly within their holdfasts [17,19,20]. Additionally, holdfast macrofauna can vary significantly among locations [17] and different kelp species can shelter unique assemblages [21,22,23]. Consequently, given the range contractions projected for D. amatheiae and the current limited data available on the holdfast macrofauna associated with this species, more data are needed to determine whether D. amatheiae holdfast macrofaunal assemblages are unique and, thus, at risk of localised extinction.
To address this knowledge gap, surveys of holdfast fauna were conducted at locations across most of the mainland geographic range of D. amatheiae in southeastern Australia. The main objectives of the study were to conduct a first analysis of the holdfast fauna for this kelp, to compare D. amatheiae holdfast macrofaunal assemblages against previous macrofaunal data obtained from holdfasts of the co-occurring kelp E. radiata, and to determine whether D. amatheiae holdfasts contain host-specific taxa at risk of local extinction when D. amatheiae range retractions occur. We also examined whether holdfast macrofaunal assemblages varied among locations, to ascertain whether northern populations, which are threatened by imminent poleward range retractions, are distinct and, thus, in greater need of increased protection. Finally, we examined whether macrofaunal assemblages were influenced by the physical size of the holdfasts from which samples were collected, to determine whether larger D. amatheiae holdfasts contain more diverse assemblages and, thus, are deserving of increased levels of protection.

2. Materials and Methods
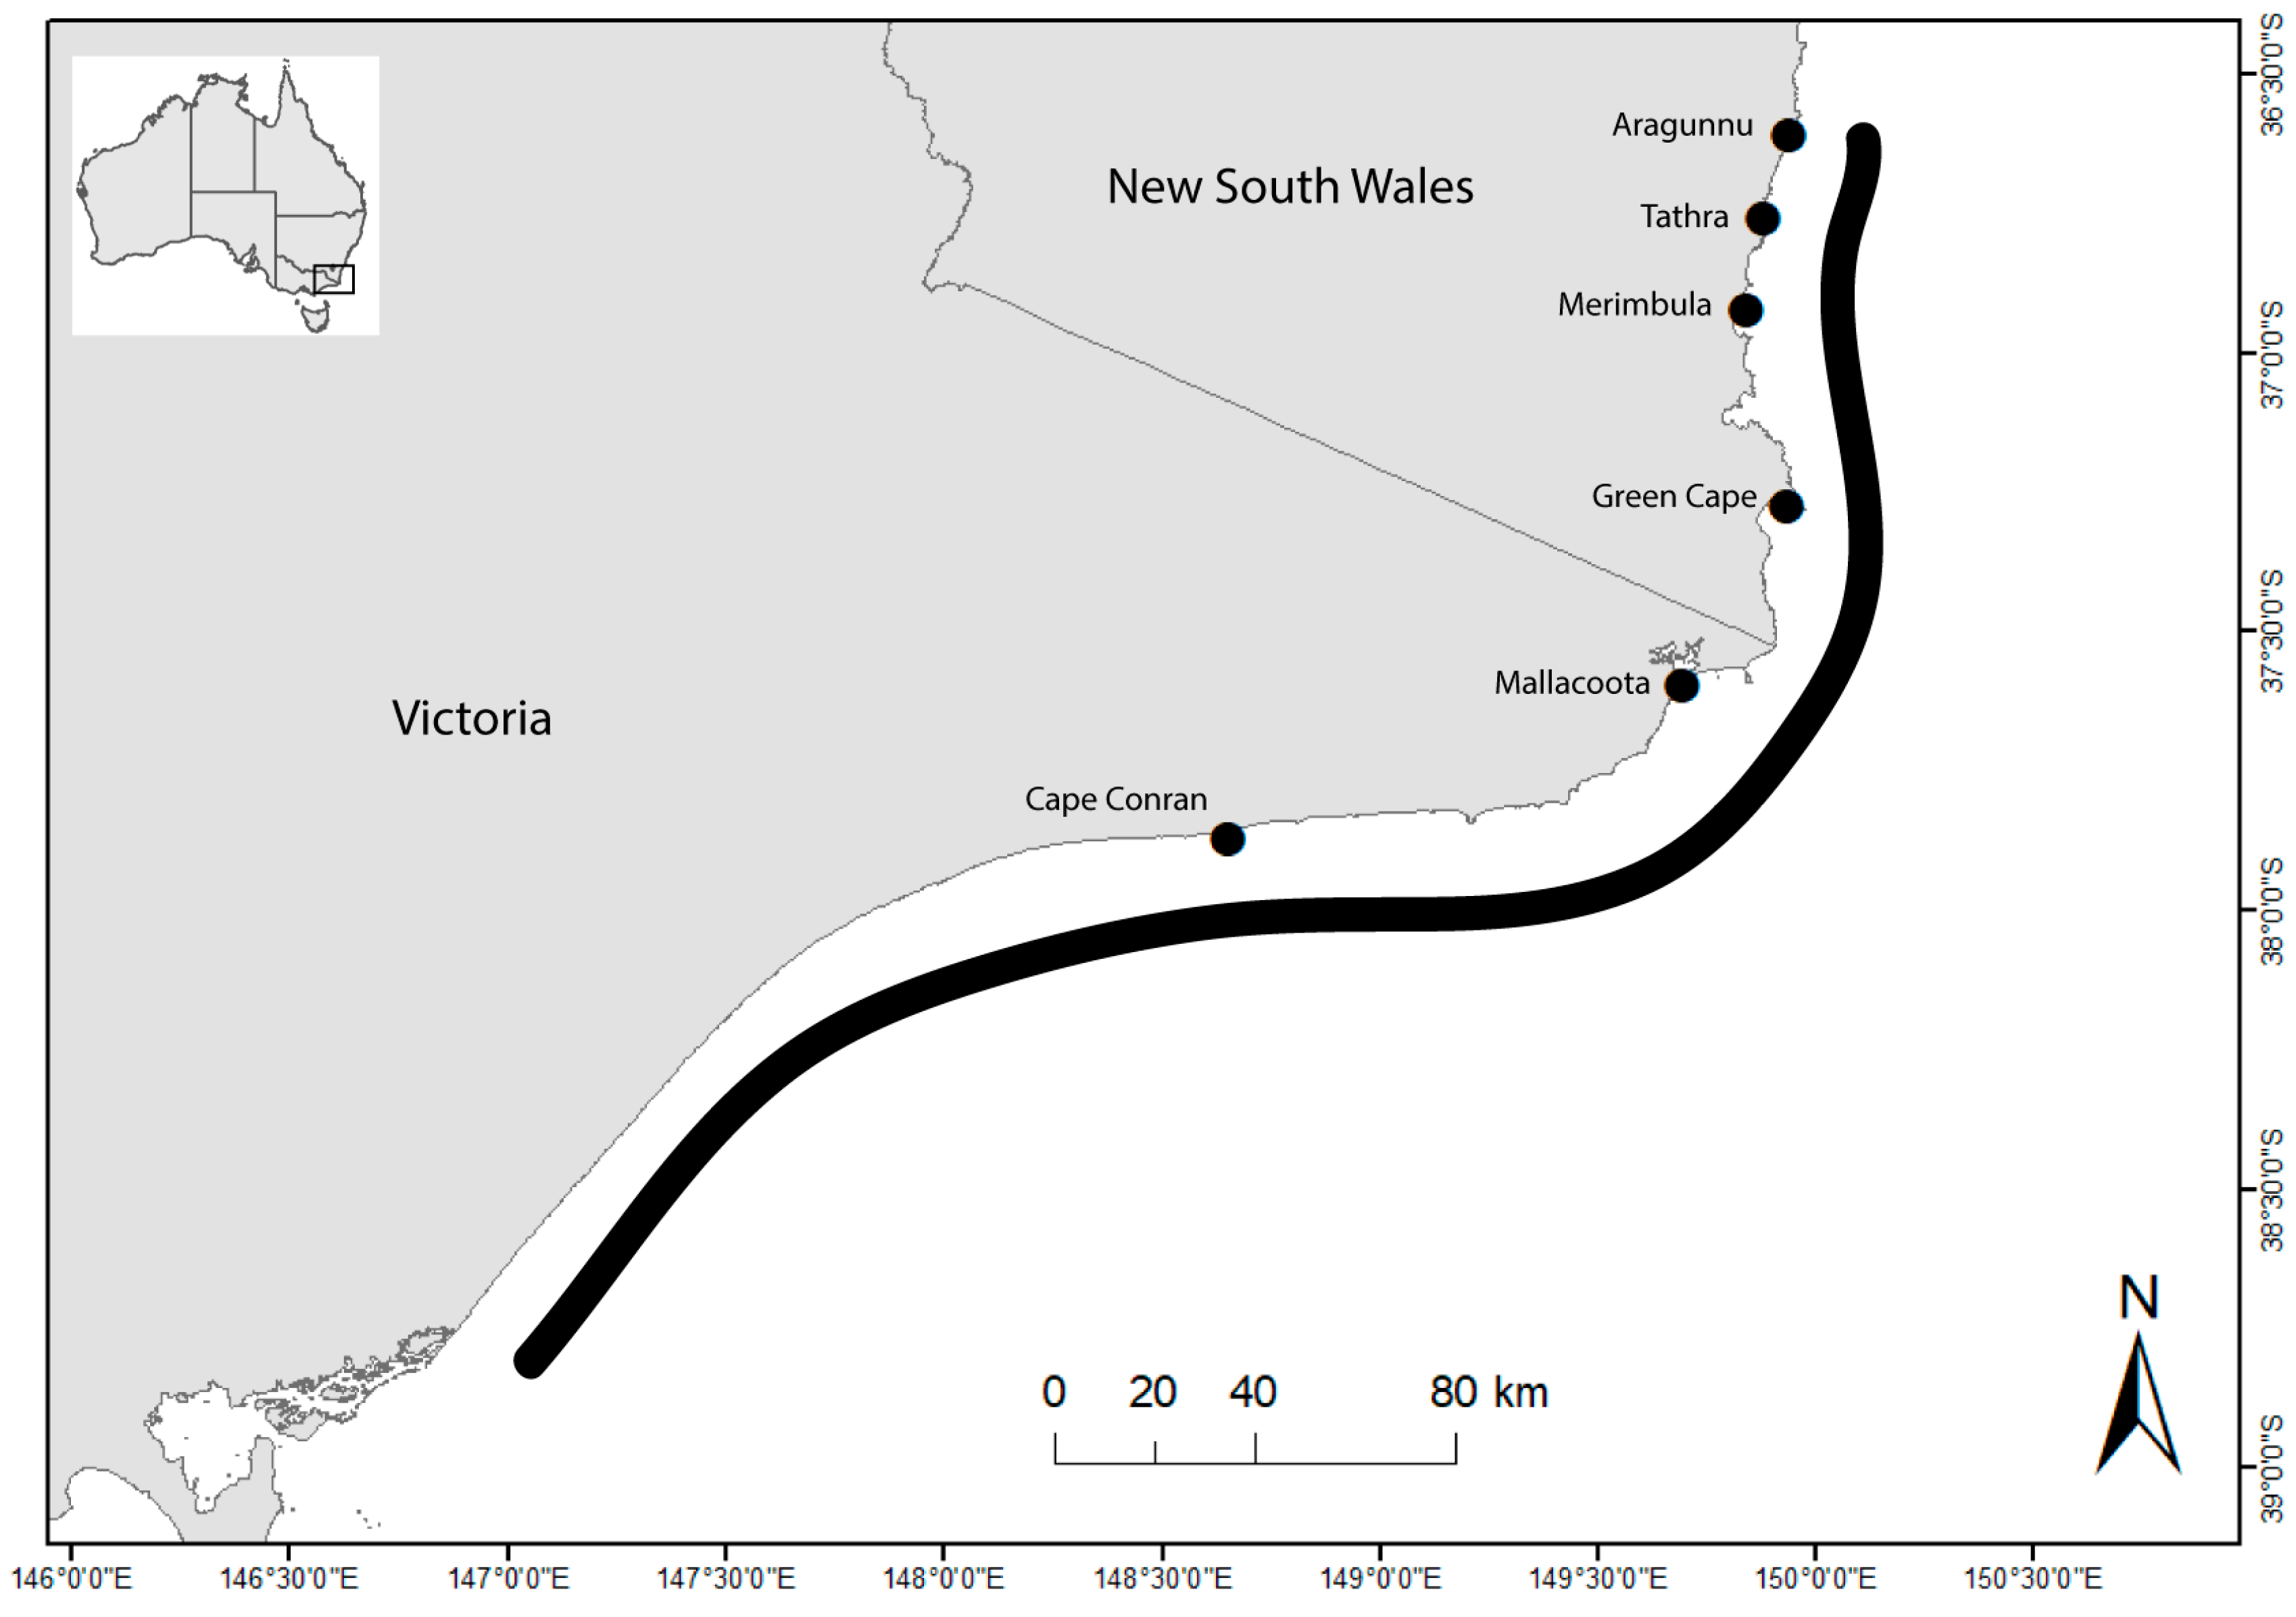
2.1. Study Area

Durvillaea amatheiae holdfasts were collected in January 2022 from six locations (Table 1) spread over ~230 km of the coastlines of New South Wales and Victoria, with locations spanning most of the current range of the species on mainland Australia (Figure 1). The study area was selected to include locations spread from the current northern distributional limit of D. amatheiae (Aragunnu, NSW, Australia) to Cape Conran in Victoria, as this region is where incipient range retractions are expected to occur over coming decades [11]. Sampling excluded sites in Bass Strait and Tasmania, as D. amatheiae is expected to persist in these areas in the short to medium term [11].

2.2. Holdfast Sampling

At each location, holdfast samples were collected haphazardly across a section of the lower intertidal zone spanning ~100 m, with 7–10 holdfasts collected at each location (Table 1). All sampling locations were on wave-exposed intertidal rock platforms, with locations spanning a latitudinal gradient in sea surface temperatures of ~2.5 °C (Table 1). Only seven samples were collected at Merimbula due to difficulties associated with safely accessing the rock platform at this site. Holdfast samples were collected at low tide by cutting the kelp stipe immediately above the holdfast, levering the holdfast off the substrate, and placing the holdfast into a calico bag, ensuring that the entire holdfast was collected, along with any material and organisms trapped under the holdfast, as recommended by Smith and Simpson [24]. Holdfast removal was conducted using a broad-bladed scraper, which was held under the holdfast during transfer to the sampling bag to prevent, as much as possible, any loss of fauna or sediment during sampling. Any sediment or fauna remaining on the rock after holdfast removal was added to the sampling bag. Holdfast samples were preserved by immediately immersing the entire bag into 7% buffered formalin.

2.3. Holdfast Geometry

The holdfast diameter, thickness, volume, stipe diameter, and sediment content were recorded to allow examination of whether these factors influenced macrofaunal assemblages [20,25]. Holdfast volume was measured by submerging the holdfast in water and measuring the volume of water displaced. Sediment content was measured by washing holdfast samples over a 1 mm sieve and measuring the dry weight of the sediment material that passed through the sieve.

2.4. Macrofaunal Sampling

Prior to sampling, holdfasts were thoroughly rinsed to remove formalin, and holdfasts were then dissected under a fume hood, by cutting each holdfast into sections of approximately 10 mm width. Each section was carefully examined by eye to locate macrofauna and further dissected if necessary to remove all macrofauna. Macrofauna samples from each holdfast were then stored in individual glass vials, containing 70% ethanol. Macrofauna samples were subsequently examined to count and identify species to the lowest taxonomic level possible [24]. Many specimens were very small, or juveniles, making identification to species level difficult. Individuals from Mytilidae spp. were likely to be a combination of juveniles of a few species. Similarly, Hyale sp. were likely a combination of a few species, with the condition of many specimens making it difficult to identify obvious diagnostic features. Nematoda spp. and Nemertea spp. were pooled into two groups, one for each of these taxa. A type collection for the samples collected, preserved in 70% alcohol, was retained for future reference.

2.5. Comparison with Ecklonia Radiata Holdfast Fauna

Data on E. radiata holdfast fauna from southern NSW were obtained from surveys conducted between 1989–1991 [26]. These data were compared against the fauna identified in D. amatheiae holdfasts in the current study, thereby enabling determination of the overlap in assemblages between D. amatheiae and E. radiata, and the potential for loss of host-specific taxa.

2.6. Statistical Analysis

All statistical analyses were conducted using PRIMER v7 software [27,28]. Prior to analyses, samples with only a single animal in the whole sample (i.e., one sample at Aragunna and three at Cape Conran) were removed, as these were found to be extreme outliers. For comparisons among assemblages, similarity matrices for species counts were constructed using the Bray–Curtis similarity measure, with data square-root transformed to reduce the influence of abundant species. Permutational multivariate analysis-of-variance (PERMANOVA) analyses were used to test for significant differences in assemblages among locations. Pairwise tests were applied to identify location pairs with significant differences in assemblages, with similarity percentage (SIMPER) analyses used to identify the species making the largest contributions to the significant differences among locations. Similarities of average assemblages among locations were visualised using a metric multidimensional scaling (mMDS) plot, which showed the relative similarity of average assemblages and 95% confidence intervals for average locations obtained using bootstrap averaging [28].
Tests for significant correlations between species richness/abundance and holdfast diameter were conducted using Pearson’s product-moment correlations in R [29]. PERMANOVA analyses were used to test for significant differences in species richness and total faunal abundance among locations, with data standardised by holdfast diameter to compensate for the effect of variations in holdfast sizes among locations.
Distance-based linear modelling (DistLM) [27] was used to examine relationships among assemblages and environmental and physical explanatory variables. DistLM model selection was conducted using the “BEST” procedure, to examine potential alternate models, with the Akaike information criteria (AIC) used to select the most parsimonious model, as recommended by Burnham et al. [30]. Six explanatory variables were selected for testing in models: sample latitude, holdfast diameter, holdfast thickness, holdfast volume, stipe diameter, and sediment weight.
Correlations among all explanatory variables were examined, prior to modelling, to determine whether excessive autocorrelation existed (i.e., |r| > 0.7), as recommended by Dormann et al. [31]. This analysis identified that holdfast diameter, holdfast thickness, holdfast volume, and stipe diameter were all highly correlated with each other. Consequently, only the best performing of these variables for explaining assemblage variation (i.e., holdfast diameter) was retained in modelling to represent this group of variables. This left three of the original six explanatory variables for model development: latitude, holdfast diameter, and sediment weight.

3. Results

3.1. Holdfast Geometry and Habitat Description

Holdfasts of D. amatheiae consisted of dorso-ventrally flattened, approximately conical discs, with smooth upper surfaces (Figure 2a). The average diameters of collected holdfasts ranged from 37.5 to 130.0 mm, which is typical of D. amatheiae holdfasts, which are generally <10 cm in width [13], although larger holdfasts were observed in the field, particularly in Victoria (personal observation). Stipe diameters ranged from 7.22 to 29.50 mm, with each holdfast generally supporting a single stipe, although two of the holdfasts collected had three stipes. The undersides of holdfasts were found to closely follow the contours of the rocks to which they were attached, growing over organisms that were already attached to the substrate (Figure 2b). This growth pattern provided limited space for establishment of macrofauna, with most fauna found living in the spaces formed by overgrowth of previously established organisms (mostly turfing algae, barnacles, and mussels). There was little evidence that fauna were creating additional living space by burrowing into holdfasts, although single individuals of a burrowing eophliantid amphipod were found in three holdfasts from Eden and Cape Conran.

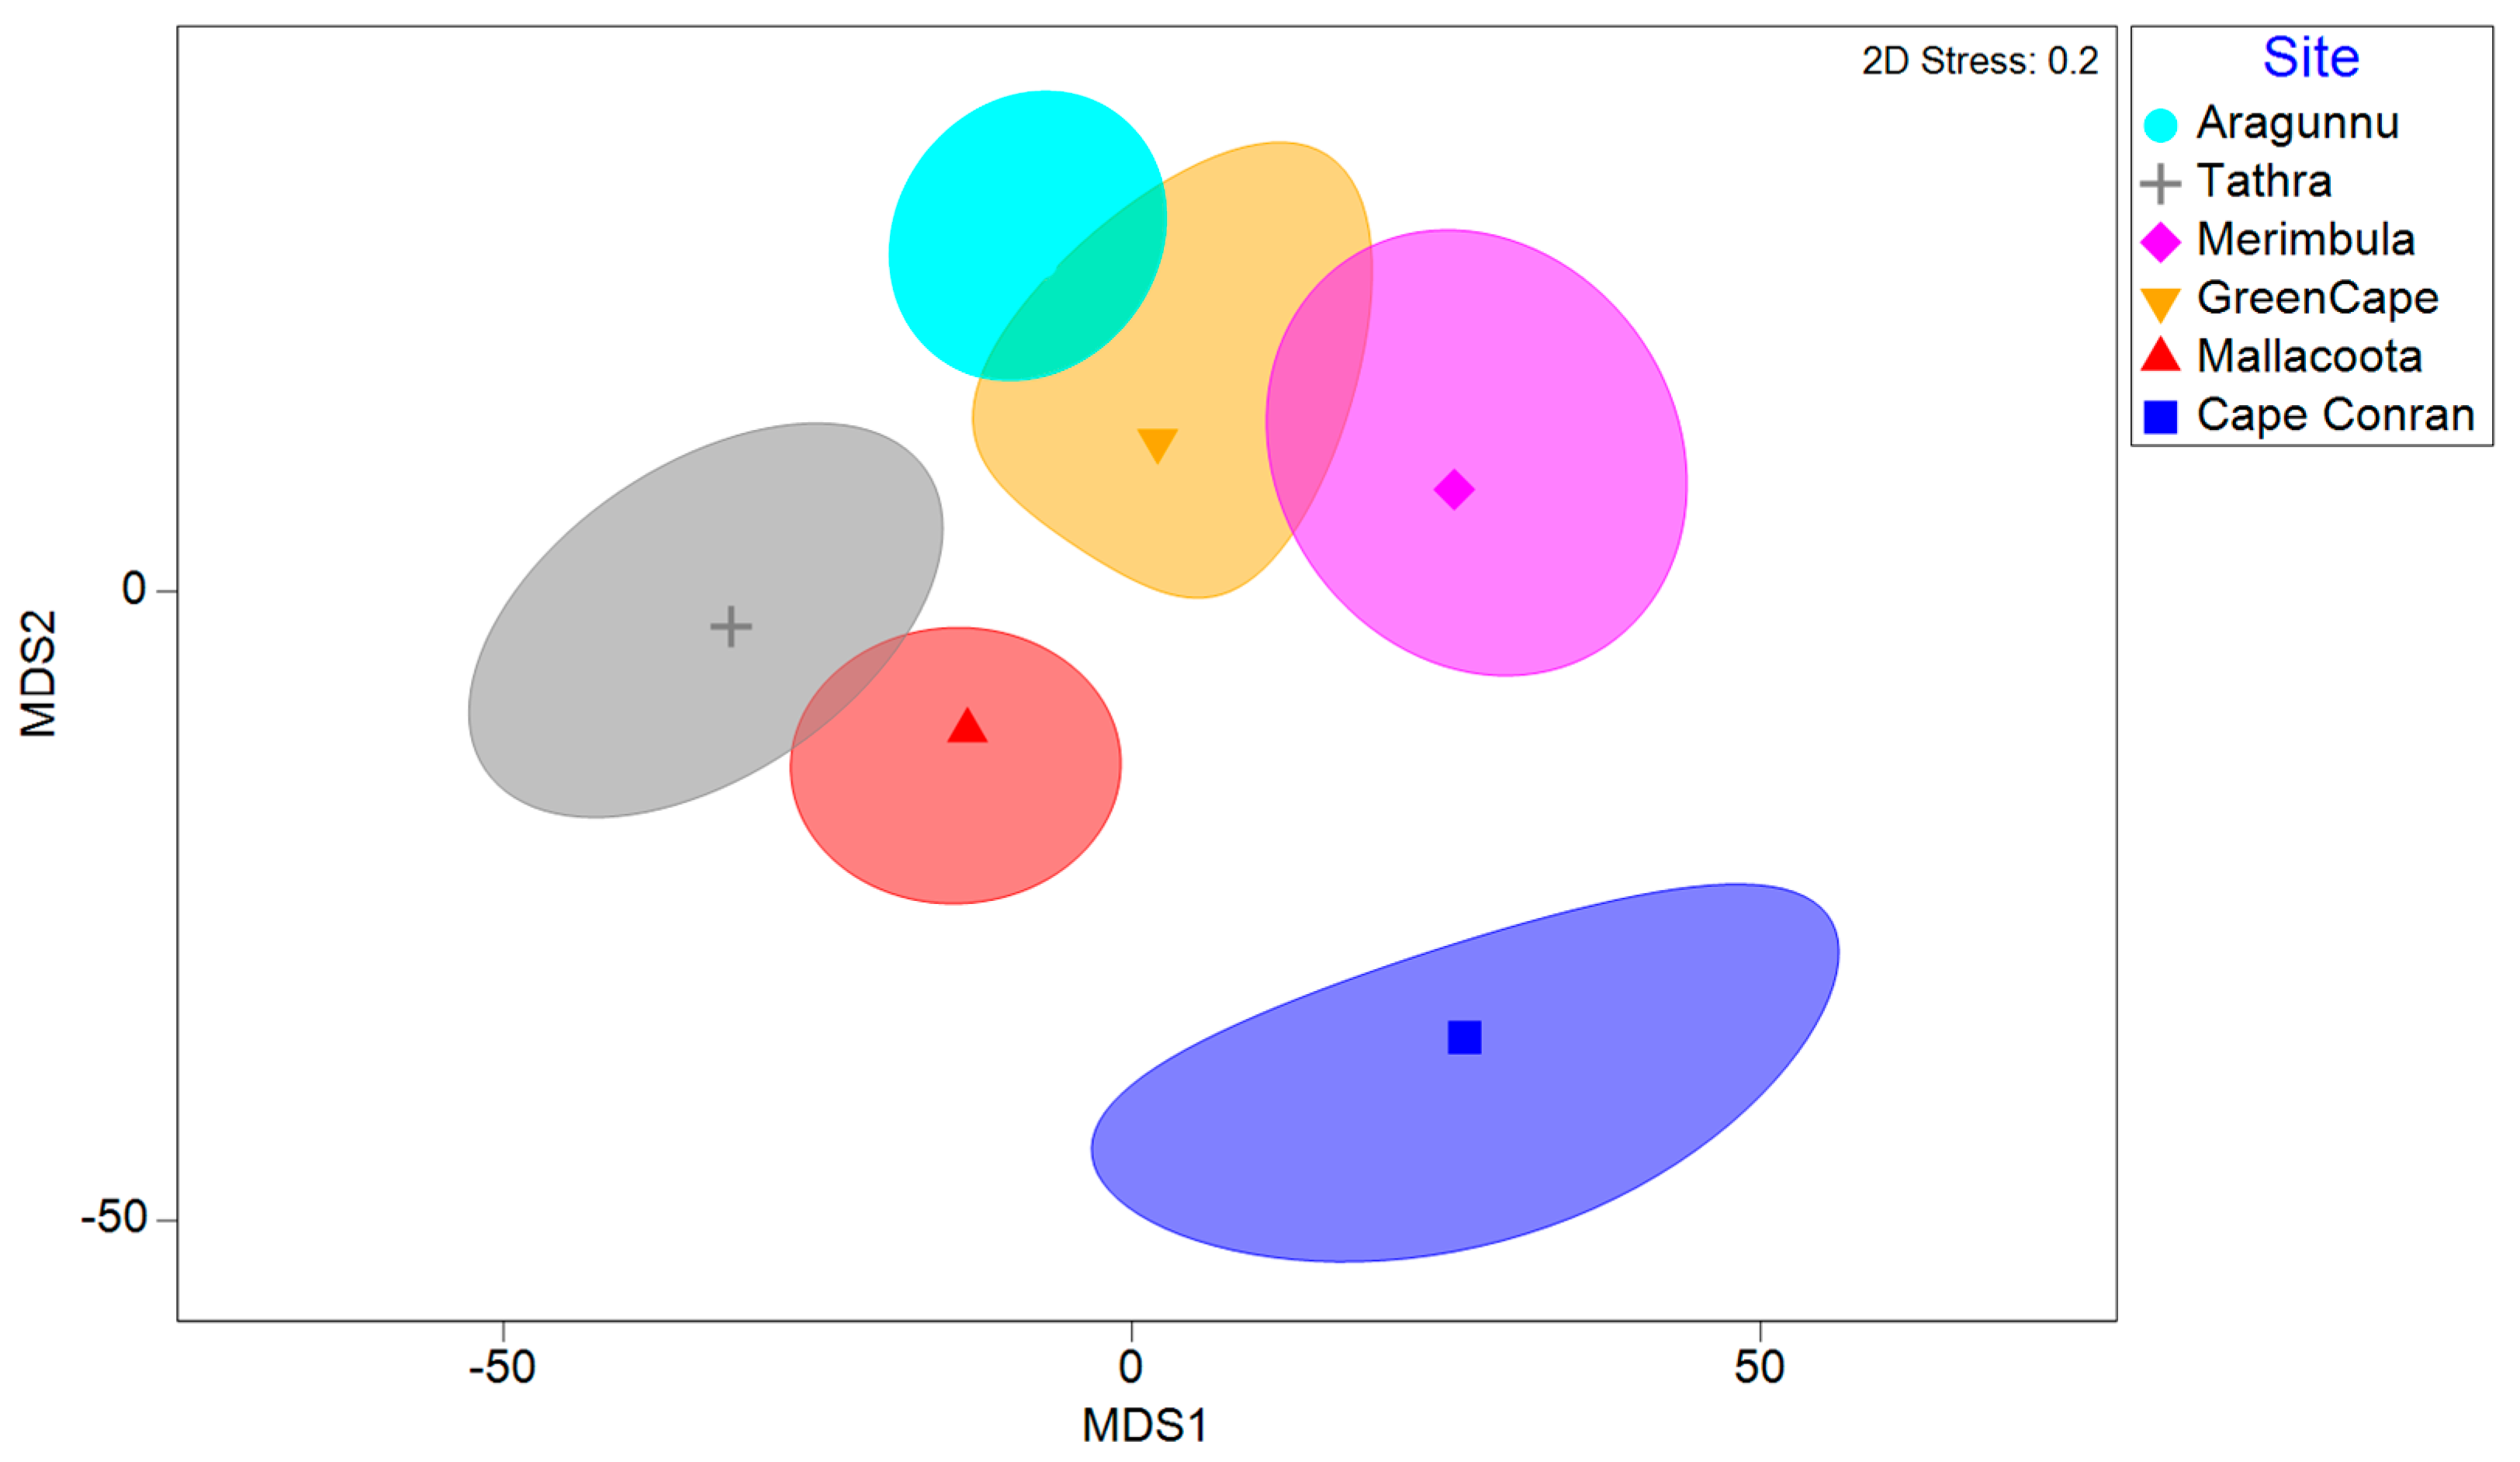
3.2. Macrofaunal Assemblages

The D. amatheiae holdfasts examined (n = 57) contained 1040 macrofauna from 51 discrete taxa in nine phyla (Table A1). The most diverse phyla were Annelida (24) and Crustacea (14), while the most numerous species were the bivalves Lasaea australis (413) and Mytilidae spp. (96). Both of the bivalves, as well as barnacles, were present as live individuals and also, in some cases more frequently, as dead animals (not counted) overgrown by the holdfast matrix.
As far as could be determined, based on a comparison of the species found in D. amatheiae holdfasts with those found in previous research in E. radiata holdfasts (personal communication 2023 to SDAS), all taxa identified in D. amatheiae holdfasts also occur in E. radiata holdfasts within the region [26]. This overlap in holdfast fauna indicates that D. amatheiae holdfasts shelter few, if any, host-specific taxa.
PERMANOVA analyses identified significant differences in D. amatheiae holdfast assemblages among locations (p < 0.001, Figure 3, Table A3), with pairwise testing identifying that assemblages at all locations were significantly different from each other (p < 0.022 all tests, Table A4). Holdfasts at Aragunnu sheltered the greatest diversity of macrofaunal species (33) and the greatest diversity of Annelida (14) and Mollusca (9), whereas Green Cape had the greatest diversity of Crustacea (10, Table 2). It should be noted that a lower numbers of species may have been recorded at Merimbula, as fewer samples were collected at this location. SIMPER analyses identified that differences in macrofaunal assemblages among locations were primarily driven by differences in abundances of the two dominant species, L. australis and Mytilidae spp., with these two species contributing over 23% to the total difference among locations (Table 3).

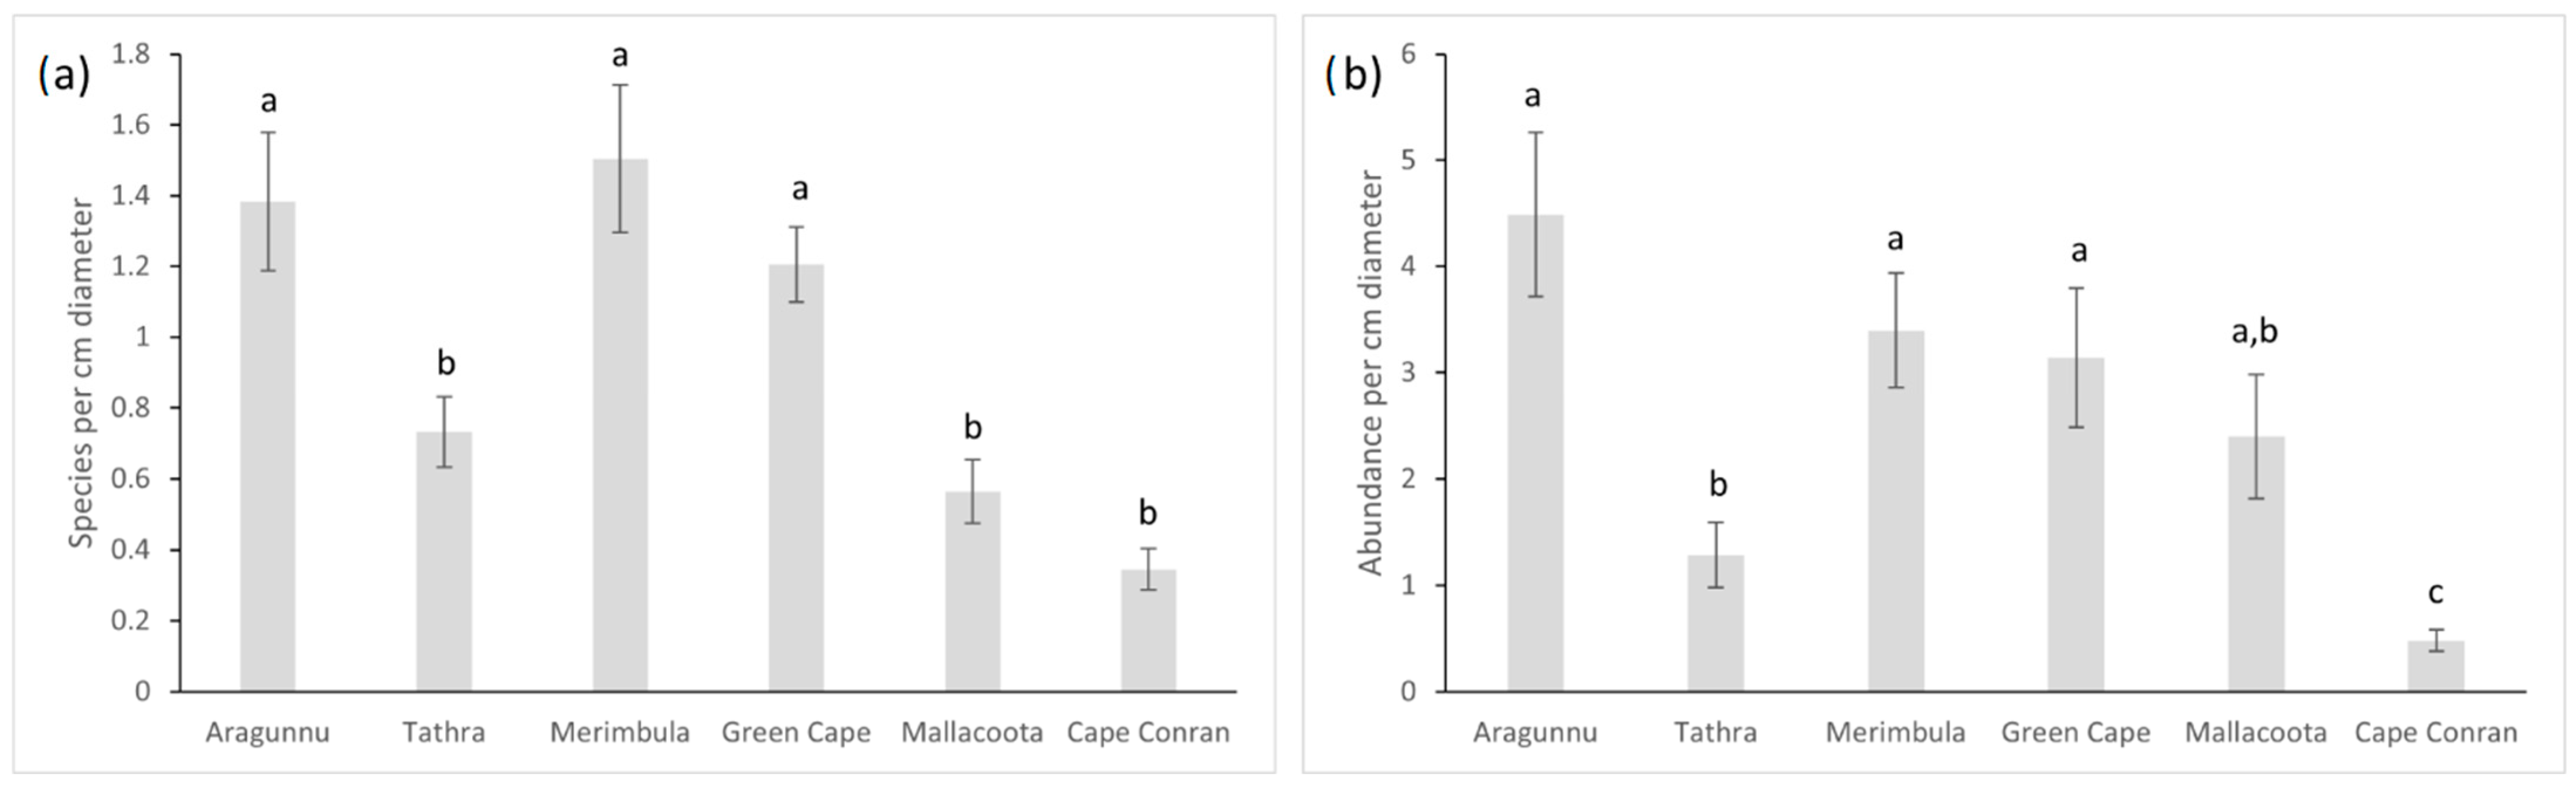
3.3. Macrofaunal Species Richness and Abundance

PERMANOVA analysis found significant differences in species richness (p < 0.001) and in abundance (p < 0.001) among locations, taking differences in holdfast diameters among locations into consideration. Pairwise testing showed that, on average, Aragunnu, Green Cape, and Merimbula had significantly more diverse assemblages than Mallacoota, Tathra, and Cape Conran (Figure 4a). Similarly, Aragunnu, Green Cape, and Merimbula had a significantly higher abundance of macrofauna than Tathra, while Cape Conran had significantly fewer macrofauna than all the other sites (Figure 4b).

3.4. Factors Associated with Variations in Macrofaunal Assemblage Structures

Modelling identified a strong association between latitude and macrofaunal assemblage structure (p < 0.001), a weak association among assemblages and holdfast diameter (p = 0.031), and no significant association among assemblage structure and sediment weight (p = 0.055). The overall best model developed explained 11% of the variations in assemblage structure and contained two explanatory variables, latitude and holdfast diameter (Table 4). Examining the effects of diameter showed that both species richness (p = 0.006) and fauna abundance (p = 0.0004) increased significantly with increasing holdfast diameter (Figure 5).

4. Discussion

Data from the current study provide valuable new insights into the macrofaunal species that dwell within D. amatheiae holdfasts, with significant differences in holdfast assemblages detected among locations. However, contrary to our expectations, we find that there is a low probability that projected range retractions by D. amatheiae (as per Martínez et al. [11]) will lead to multiple localised extinctions in D. amatheiae holdfast macrofauna. This is due to the D. amatheiae holdfast taxa identified having a substantial overlap with the macrofauna of co-occurring E. radiata holdfasts [24]. Consequently, D. amatheiae holdfast macrofauna will largely remain extant within E. radiata holdfasts when range retractions of D. amatheiae occur, given the expected continued presence of E. radiata at the latitudes where D. amatheiae range retractions are anticipated [11,32]. Additionally, individual macrofaunal species from D. amatheiae holdfasts are likely be able to persist within other habitats, with previous research showing that E. radiata holdfast macrofauna commonly occur in other habitats, such as within soft sediments, sponges, and seagrass beds [25]. Some of the more abundant species (bivalves, barnacles, and tubicolous polychaetes—Serpulidae and Spirorbidae) were found both alive and dead, the latter usually embedded in the base of the holdfast. Most of these taxa are sedentary, suggesting that they also occur on the rocky substratum and were overgrown by spreading holdfasts [20]. It is therefore likely that many macrofaunal species associated with D. amatheiae holdfasts are also present in other habitats and will be able to persist within these habitats when D. amatheiae range retractions occur. However, further research is required to confirm the presence of D. amatheiae macrofauna within other habitats in the region. Further research is also needed to more comprehensively assess the risk of local extinctions among D. amatheiae holdfast macrofauna, given the possibility that undetected, rare species may occur in holdfasts. Furthermore, local extinctions may result from the broader impacts of climate change, with climate change driving species extinctions globally, by changing environmental conditions [4]. Examination of the environmental tolerances of holdfast macrofaunal species is warranted, to determine whether they are at risk from changing environmental conditions, especially given that increasing ocean temperatures are expected to drive local extinction of many marine species in southeastern Australia [11].

4.1. Comparison of D. amatheiae and Co-Occurring E. radiata Holdfast Macrofauna

This study revealed that while D. amatheiae holdfast macrofaunal assemblages showed differences among sampling locations, the overall faunal complement is highly depauperate in comparison to that present in the holdfasts of co-occurring E. radiata. Data collected in an investigation of E. radiata holdfasts in Jervis Bay (~175 km to the north of Aragunnu) indicated average faunal densities of 0.99–6.29 individuals.mL−1 of holdfast habitat [25], which is more than double the values recorded in this study (average = 0.6 individuals.mL−1, range of 0.01 to 3.06, Table A2). Similarly, species richness in E. radiata is much higher, with Smith [26] recording 32,283 individual animals from 292 discrete taxa (mostly identified to species level) from 59 holdfasts in Jervis Bay, and Anderson et al. [33] recording 351 species of macrofauna from 80 E. radiata holdfasts in New Zealand, whereas only 1040 individuals from 51 taxa were found in the 57 holdfasts examined in the current study. There is little doubt that the primary reason for this disparity is the morphology of D. amatheiae holdfasts, which are flat and discoid and provide little primary space for occupation by macrofauna relative to the highly complex structure of intertwined haptera in E. radiata [20]. At Macquarie Island, subantarctic, the discoid holdfasts of D. antarctica also support a much lower density of fauna by volume in comparison to E. radiata, with an average of 1.0 individuals.mL−1 habitat [24].

4.2. Comparison of D. amatheiae Holdfast Macrofauna to Other Kelp Species

Compared to other kelp species, the macrofaunal species richness in D. amatheiae holdfasts in the current study (51 taxa in 57 holdfasts) was greater than that identified in Macrocystis pyrifera (42 taxa in 62 holdfasts) in Chile [34], but lower than that in D. antarctica (96 taxa in 60 holdfasts) at Macquarie Island [17]. It should be noted, however, that the size of the holdfasts examined for D. amatheiae (i.e., generally <10 cm) was much lower than the size reported for D. antartica (up to 60 cm [24]), which potentially contributed to the differences in holdfast macrofaunal richness recorded in these two studies. Comparisons among studies from different kelp species are often confounded by differences in holdfast size, geometry, and complexity among the species, and by differences in the number and the size of holdfasts examined. Additionally, the resolution of taxonomic identification often varies among studies of holdfast macrofauna, further confounding meaningful comparisons among these studies [21].

4.3. Variations in D. amatheiae Holdfast Macrofauna among Locations

Macrofaunal assemblages and species richness and abundance of D. amatheiae macrofauna all varied significantly among the locations examined in southeastern Australia. Variations in holdfast macrofauna among locations is common for kelp species, with differences among locations also detected for D. antarctica at Macquarie Island [17] and E. radiata in New Zealand [33]. Often, differences among locations are attributed to site-level factors, such as wave exposure [17,35]; however, for D. amatheiae, we found that assemblage variation at a broad spatial scale exhibited a significant latitudinal gradient. The presence of latitudinal differences among D. amatheiae holdfast assemblages has important implications for the management of these species as range retractions at the northern edge of D. amatheiae’s distribution (i.e., at Aragunnu) will lead to loss of the distinct and diverse macrofaunal assemblages that occur at this location. However, it should be noted that the macrofauna themselves are likely to persist within other habitats.

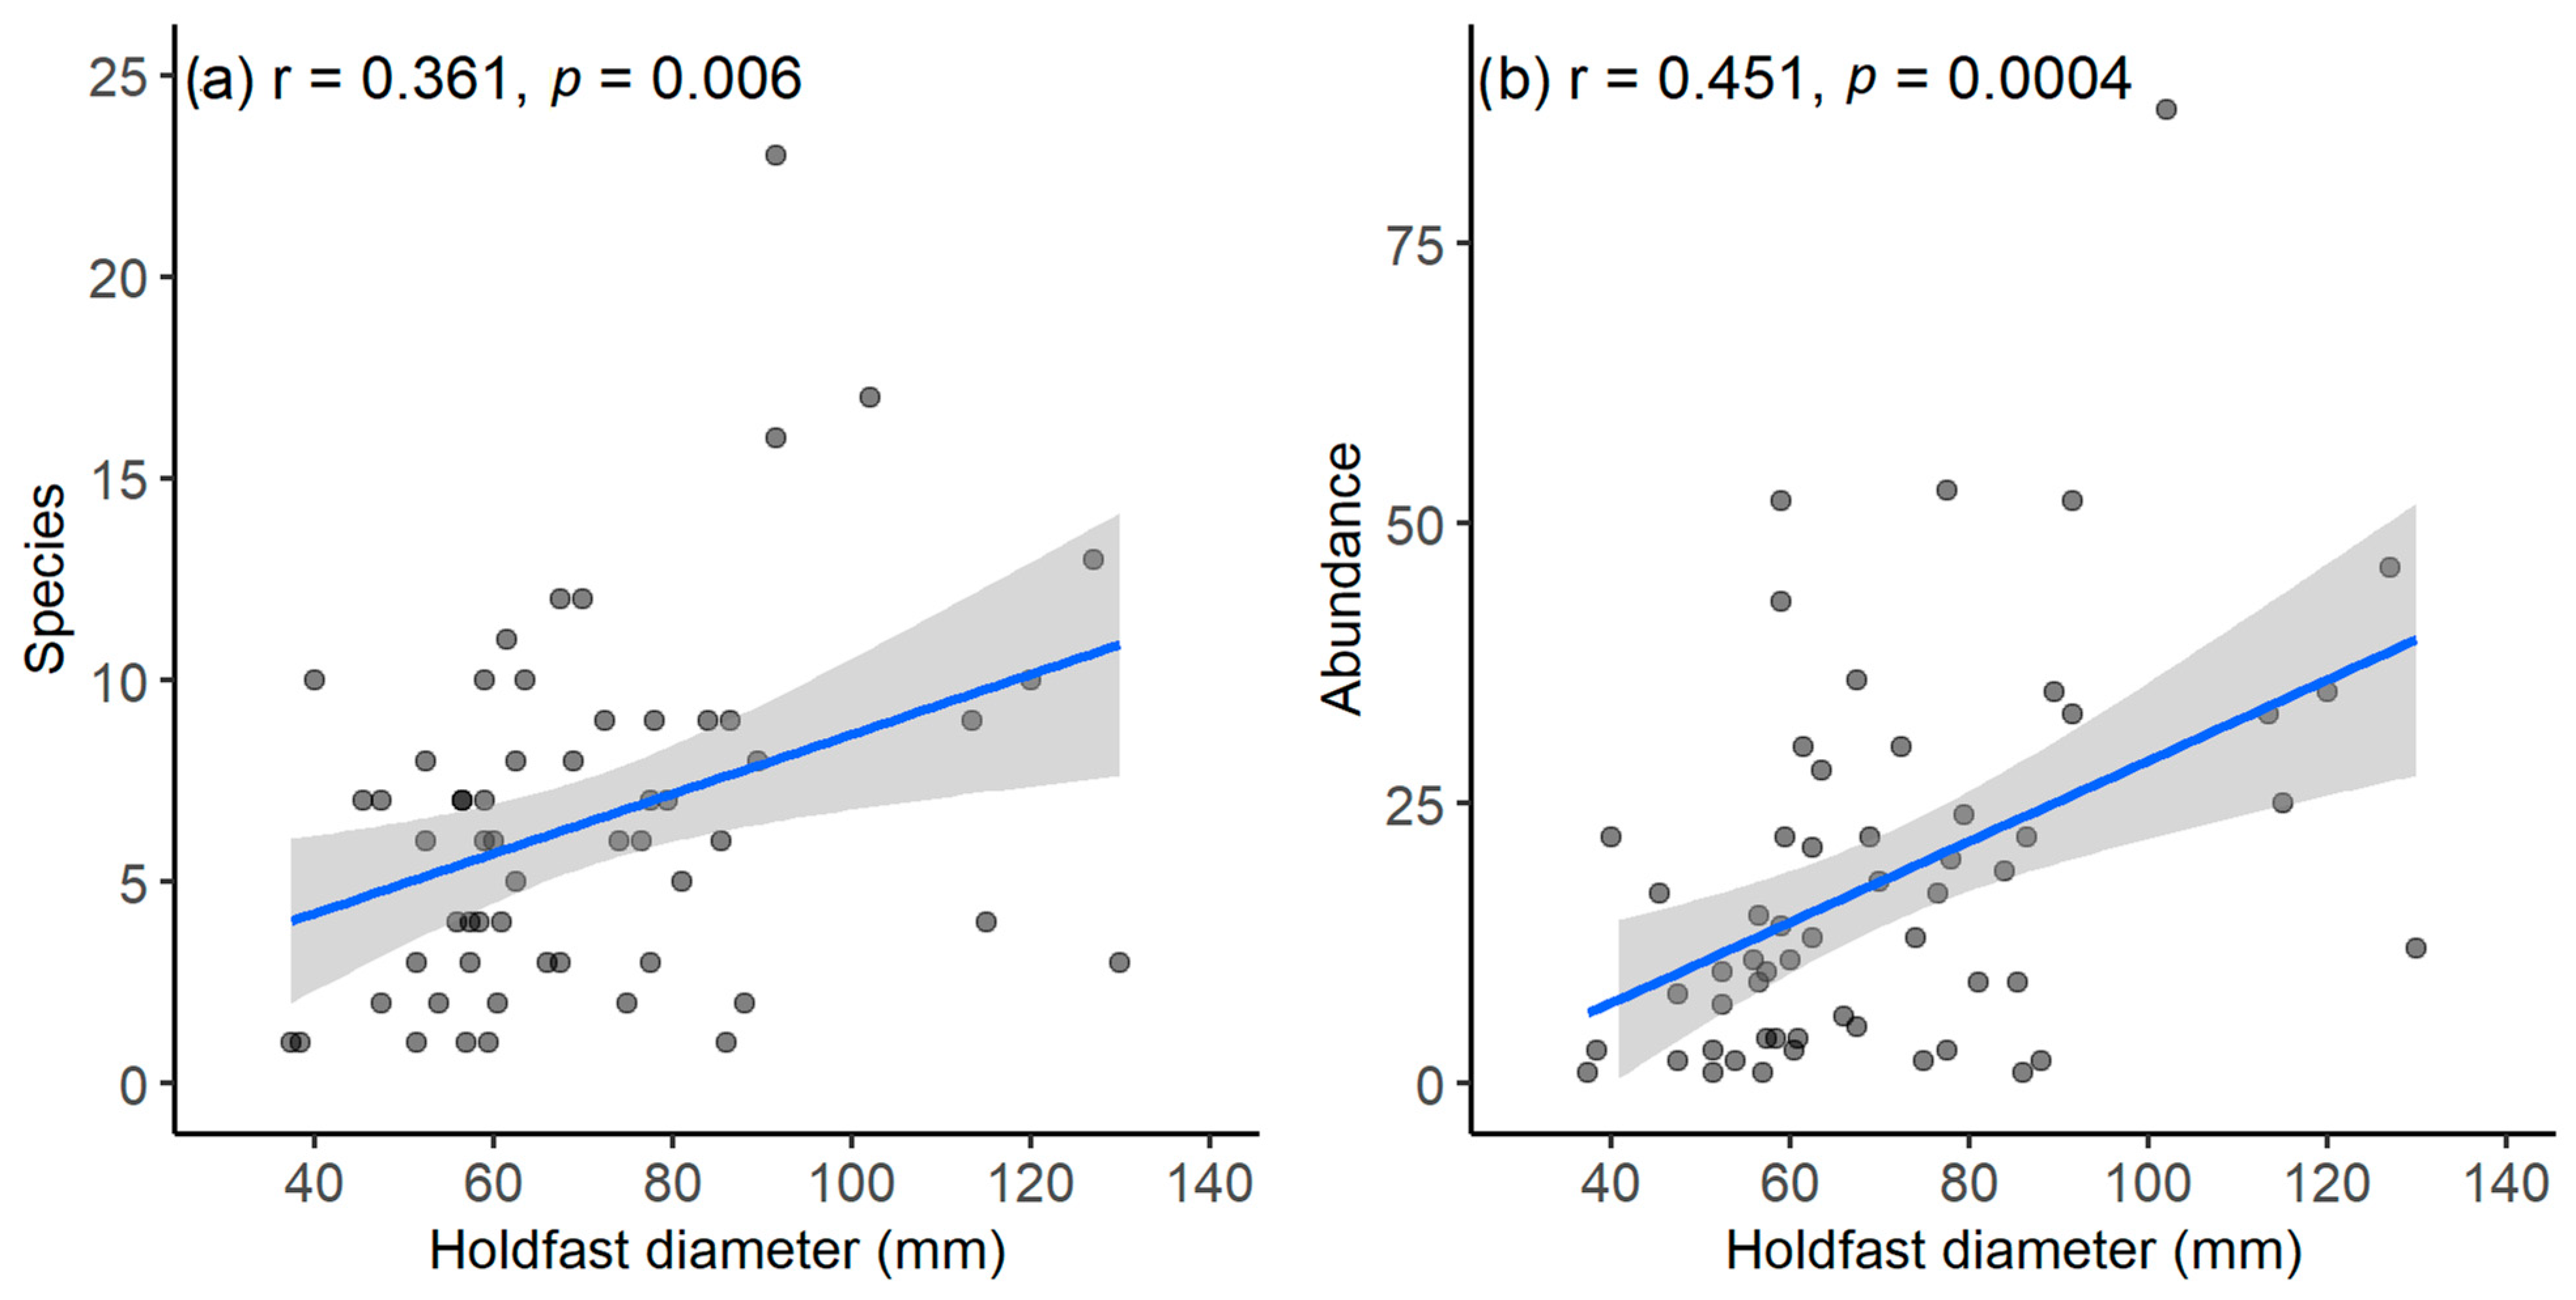
4.4. Influence of D. amatheiae Holdfast Size on Macrofaunal Assemblages

Overall, holdfast size was found to have a significant effect on holdfast macrofauna, with both species richness and abundance of macrofauna increasing with increased size. This was unsurprising, as it is widely acknowledged that species richness and abundance of fauna increase with increased living space, with these same increases observed in holdfast macrofauna for E. radiata [20,33] and Lessonia trabeculata [21]. It should be noted that holdfast size will generally increase with age, and it is difficult to disentangle whether larger holdfasts have greater species richness and abundance because they are larger, providing more habitat, or because they are older, which gives more time for colonization. Further research is needed to examine relationships between holdfast age and macrofaunal assemblages; however, this would need a reliable method for aging D. amatheiae. Aging could potentially be achieved by counting growth rings in D. amatheiae stipes, as has been applied for aging of E. radiata [36]. Interestingly, we found limited evidence that macrofauna were creating additional living space by burrowing into holdfasts, although single individuals of a burrowing eophliantid amphipod were found in three holdfasts from Eden and Cape Conran. This contrasts with observations for closely related D. antarctica, where extensive tunnels are created in holdfasts by macrofauna, particularly by the isopod Limnoria stephenseni [24]. The lack of holdfast burrows, which is consistent with the species description for D. amatheiae [13], limits space under and within holdfasts and restricts macrofaunal diversity and abundance when compared to kelp species with larger and more complex cavities within their holdfasts. Examination of D. amatheiae holdfast geometry identified that the physical dimensions of D. amatheiae holdfasts (i.e., holdfast diameter, thickness, volume, stipe diameter) were all closely correlated among holdfasts. Consequently, these dimensions could all be used to represent holdfast size in modelling, although we found that holdfast diameter had the strongest association with variations in macrofaunal assemblages.

5. Conclusions

Here, we provide the first quantitative insights into the macrofaunal assemblages within D. amatheiae holdfasts. It can be concluded that a wide range of detrimental impacts will be associated with the loss of D. amatheiae in southeastern Australia, particularly if range retractions occur at Aragunnu, where D. amatheiae holdfasts shelter distinct and relatively diverse macrofaunal assemblages. However, it is difficult to determine whether D. amatheiae range retractions will lead to local extinctions for individual species of D. amatheiae holdfast macrofauna, as many of these species are likely to co-occur in other habitats which are less at risk from climate change. Consequently, there is an urgent need to determine which species are solely dependent on D. amatheiae and to develop strategies to reduce impacts on those species which rely on D. amatheiae for habitat. Furthermore, over the longer term, the projected incipient local extinction of D. amatheiae itself in southeastern Australia [11], and the loss of associated fauna, will have unquantified consequences for local marine ecosystems, with more research needed to investigate likely flow-on effects. In New Zealand, where marine heatwaves led to local extinctions of several Durvillaea spp. [15], losses of Durvillaea spp. have led to a phase shift, from ecosystems dominated by Durvillaea spp. to ecosystems dominated by other algal species, with an associated long-term shift in the composition of local marine communities [18]. In Australia, regional loss of D. amatheiae will likely have similar impacts, with D. amatheiae acting as a foundation species in many marine food chains [16]. Additionally, loss of D. amatheiae will reduce ecosystem capacity for carbon capture and storage, with Durvillaea spp. making a substantial contribution to carbon sequestration in Australia [37]. Finally, D. amatheiae is culturally important, being historically used by indigenous communities for food and to make objects such as footwear and water carriers [38], with its loss likely to have as-yet unquantified cultural impacts.

Author Contributions

Conceptualization, T.R.D. and S.D.A.S.; methodology, T.R.D. and S.D.A.S.; formal analysis, T.R.D., A.B. and S.D.A.S.; investigation, T.R.D., A.B. and M.J.N.; resources, T.R.D. and S.D.A.S.; data curation, T.R.D., A.B. and S.D.A.S.; writing—original draft preparation, T.R.D. and M.J.N.; writing—review and editing, T.R.D., A.B., S.D.A.S. and M.J.N.; visualization, T.R.D.; project administration, T.R.D.; funding acquisition, T.R.D. All authors have read and agreed to the published version of the manuscript.

Funding

This research was funded by the NSW Marine Estate Management Strategy, Initiative 3.

Institutional Review Board Statement

Not applicable.

Informed Consent Statement

Not applicable.

Data Availability Statement

The original data presented in the study are openly available in FigShare at DOI: 10.6084/m9.figshare.25521670.

Conflicts of Interest

The authors declare no conflicts of interest. The funders had no role in the design of the study; in the collection, analyses, or interpretation of data; in the writing of the manuscript; or in the decision to publish the results.

Appendix A

Table A1. Macrofauna species and abundance in Durvillaea amatheiae holdfasts.
PhylumClassFamilySpeciesCount
AnnelidaPolychaetaChrysopetalidaeChrysopetalidae sp.2
PolychaetaCirratulidaeCirriformia capensis11
PolychaetaCirratulidaeCirriformia filigera4
PolychaetaDorvilleidaeDorvilleidae sp.1
PolychaetaEunicidaeMarphysa sp. 112
PolychaetaEunicidaeMarphysa sp. 28
PolychaetaLumbrineridaeLumbrinereis sp. 11
PolychaetaLumbrineridaeLumbrinereis sp. 244
PolychaetaNereidaeCeratonereis70
PolychaetaNereidaeNereididae sp. 221
PolychaetaNereidaeNereididae sp. 32
PolychaetaNereidaeNereididae sp. 41
PolychaetaPhyllodocidaeEulalia sp.1
PolychaetaPhyllodocidaePhyllodocidae sp.3
PolychaetaSabellariidaeIdanthyrsus pennatus2
PolychaetaScalibregmatidaeHyboscolex sp.9
PolychaetaSerpulidaeGaleolaria caespitosa7
PolychaetaSphaerodorididaeSphaerodorum sp.1
PolychaetaSpionidaeSpionidae sp.9
PolychaetaSyllidaeSf. Syllinae3
PolychaetaSyllidaeSyllis gracilis80
PolychaetaSyllidaeSyllis sp. 18
PolychaetaSyllidaeSyllis variegata2
SipunculaSipunculaSipuncula4
CnidariaActiniariaActiniidaeActiniidae sp.2
CrustaceaAmphipodaAmphilochidaeAmphilochidae sp. 12
AmphipodaAmphilochidaeAmphilochidae sp. 22
AmphipodaAoridaeAora hebes20
AmphipodaEophliantidaeEophliantidae sp.3
AmphipodaHyalidaeHyale sp.25
AmphipodaIschyroceridaeIschyroceros sp.25
AmphipodaLeucothoidaeLeucothoe sp.2
AmphipodaMaeridaeMaera mastersi1
CirripediaCirripediaBalanus amphitrite7
IsopodaAnthuridaeAnthuridae sp.1
IsopodaJaniridaeJaniridae sp.5
IsopodaSphaeromatidaeSphaeromatidae22
TanaidTanaidaeTanaidae sp.19
TanaidaceaApseudidaeApseudidae sp.1
ForaminiferaForaminiferaForaminiferaForaminifera sp.1
InsectaInsectDipteraDiptera sp.2
MolluscaBivalviaHiatellidaeHiatella australis15
BivalviaLasaeidaeLasaea australis413
BivalviaMytilidaeMytilidae spp.96
ChitonidaAcanthochitonidaeAcanthochitona sp.1
ChitonidaChitonidaeChitonidae sp.1
GastropodFissurellidaeEmarginula sp.1
GastropodaPatellidaeScutellastra peronii3
NematodaNematodaNematodaNematoda spp.25
NemerteaNemerteansNemerteaNemertea spp.28
PlatyhelminthesPlatyhelminthesPlatyhelminthesPlatyhelminth sp.1

Appendix B

Table A2. Durvillaea amatheiae holdfast location, dimensions, species count, fauna abundance, and fauna abundance per unit volume.
LocationSampleDiameter (mm)Height (mm)Volume (mL)SpeciesAbundanceAbundance Per mL
AragunnuA159.015206140.70
AragunnuA291.5259016330.37
AragunnuA359.020227431.95
AragunnuA467.5153212361.13
AragunnuA537.5103110.33
AragunnuA659.0151710523.06
AragunnuA763.5222310281.22
AragunnuA889.522498350.71
AragunnuA991.5226823520.76
AragunnuA1069.020228221.00
Cape ConranCC157.01212110.08
Cape ConranCC288.02048220.04
Cape ConranCC357.51515340.27
Cape ConranCC447.51110220.20
Cape ConranCC538.51010130.30
Cape ConranCC651.51410110.10
Cape ConranCC786.02270110.01
Cape ConranCC885.51742690.21
Cape ConranCC967.51015350.33
Cape ConranCC1077.52545330.07
Green CapeGC1102.0328017871.09
Green CapeGC2127.03516013460.29
Green CapeGC356.52320790.45
Green CapeGC486.523799220.28
Green CapeGC570.0162112180.86
Green CapeGC674.022326130.41
Green CapeGC772.523359300.86
Green CapeGC8113.5321089330.31
Green CapeGC960.020216110.52
Green CapeGC1052.520158100.67
MallacootaMA1130.0251353120.09
MallacootaMA2115.0281204250.21
MallacootaMA3120.0259810350.36
MallacootaMA477.515587530.91
MallacootaMA562.515215130.62
MallacootaMA675.02339220.05
MallacootaMA781.01532590.28
MallacootaMA859.512161221.38
MallacootaMA976.515256170.68
MallacootaMA1057.515134100.77
MerimbulaM161.5173011301.00
MerimbulaM262.516198211.11
MerimbulaM356.518187150.83
MerimbulaM440.0161010222.20
MerimbulaM556.016204110.55
MerimbulaM645.512117171.55
MerimbulaM747.5149780.89
TathraT166.02029360.21
TathraT260.52020230.15
TathraT378.022299200.69
TathraT479.522367240.67
TathraT558.51820440.20
TathraT654.02020220.10
TathraT751.51210330.30
TathraT884.025509190.38
TathraT952.51520670.35
TathraT1061.01719440.21

Appendix C

Table A3. Results of PERMANOVA test for differences in Durvillaea amatheiae holdfast macrofaunal assemblages among locations.
VariabledfSSMSPseudo-FP (Perm)Unique Perms
Location5381317626.13.93260.001998
Table A4. Results of PERMANOVA tests for differences in Durvillaea amatheiae holdfast macrofaunal assemblages among pairs of locations.
Location PairtP (Perm)Unique Perms
Mallacoota, GreenCape1.69920.002995
Mallacoota, CapeConran2.37450.001978
Mallacoota, Merimbula1.91390.001973
Mallacoota, Aragunnu1.91610.008993
Mallacoota, Tathra1.61250.022996
GreenCape, CapeConran2.29590.001973
GreenCape, Merimbula1.37950.019975
GreenCape, Aragunnu1.41880.019991
GreenCape, Tathra1.77630.005992
CapeConran, Merimbula1.72730.008740
CapeConran, Aragunnu2.62440.001955
CapeConran, Tathra2.50170.002975
Merimbula, Aragunnu1.65830.004951
Merimbula, Tathra2.0810.001973
Aragunnu, Tathra2.21810.002991

References

  1. Ceballos, G.; García, A.; Ehrlich, P.R. The Sixth Extinction Crisis: Loss of Animal Populations and Species. J. Cosmol. 2010, 8, 31. [Google Scholar]
  2. Régnier, C.; Achaz, G.; Lambert, A.; Cowie, R.H.; Bouchet, P.; Fontaine, B. Mass Extinction in Poorly Known Taxa. Proc. Natl. Acad. Sci. USA 2015, 112, 7761–7766. [Google Scholar] [CrossRef] [PubMed]
  3. Dunn, R.R. Modern Insect Extinctions, the Neglected Majority. Conserv. Biol. 2005, 19, 1030–1036. [Google Scholar] [CrossRef]
  4. Thomas, C.D.; Cameron, A.; Green, R.E.; Bakkenes, M.; Beaumont, L.J.; Collingham, Y.C.; Erasmus, B.F.N.; De Siqueira, M.F.; Grainger, A.; Hannah, L. Extinction Risk from Climate Change. Nature 2004, 427, 145–148. [Google Scholar] [CrossRef] [PubMed]
  5. Brooks, T.M.; Mittermeier, R.A.; Mittermeier, C.G.; Da Fonseca, G.A.B.; Rylands, A.B.; Konstant, W.R.; Flick, P.; Pilgrim, J.; Oldfield, S.; Magin, G. Habitat Loss and Extinction in the Hotspots of Biodiversity. Conserv. Biol. 2002, 16, 909–923. [Google Scholar] [CrossRef]
  6. Chen, I.-C.; Hill, J.K.; Ohlemüller, R.; Roy, D.B.; Thomas, C.D. Rapid Range Shifts of Species Associated with High Levels of Climate Warming. Science 2011, 333, 1024–1026. [Google Scholar] [CrossRef]
  7. Sorte, C.J.B.; Williams, S.L.; Carlton, J.T. Marine Range Shifts and Species Introductions: Comparative Spread Rates and Community Impacts. Glob. Ecol. Biogeogr. 2010, 19, 303–316. [Google Scholar] [CrossRef]
  8. Booth, D.J.; Bond, N.; Macreadie, P. Detecting Range Shifts among Australian Fishes in Response to Climate Change. Mar. Freshw. Res. 2011, 62, 1027–1042. [Google Scholar] [CrossRef]
  9. Wernberg, T.; Bennett, S.; Babcock, R.C.; De Bettignies, T.; Cure, K.; Depczynski, M.; Dufois, F.; Fromont, J.; Fulton, C.J.; Hovey, R.K.; et al. Climate-Driven Regime Shift of a Temperate Marine Ecosystem. Science 2016, 353, 169–172. [Google Scholar] [CrossRef]
  10. Vergés, A.; Steinberg, P.D.; Hay, M.E.; Poore, A.G.B.; Campbell, A.H.; Ballesteros, E.; Heck, K.L.; Booth, D.J.; Coleman, M.A.; Feary, D.A. The Tropicalization of Temperate Marine Ecosystems: Climate-Mediated Changes in Herbivory and Community Phase Shifts. Proc. R. Soc. B 2014, 281, 20140846. [Google Scholar] [CrossRef]
  11. Martínez, B.; Radford, B.; Thomsen, M.S.; Connell, S.D.; Carreño, F.; Bradshaw, C.J.A.; Fordham, D.A.; Russell, B.D.; Gurgel, C.F.D.; Wernberg, T. Distribution Models Predict Large Contractions of Habitat-forming Seaweeds in Response to Ocean Warming. Divers. Distrib. 2018, 24, 1350–1366. [Google Scholar] [CrossRef]
  12. DCCEEW. Threatened Species Strategy Action Plan 2022–2032; DCCEEW: Canberra, Australia, 2022. [Google Scholar]
  13. Weber, X.A.; Edgar, G.J.; Banks, S.C.; Waters, J.M.; Fraser, C.I. A Morphological and Phylogenetic Investigation into Divergence among Sympatric Australian Southern Bull Kelps (Durvillaea Potatorum and D. Amatheiae Sp. Nov.). Mol. Phylogenet. Evol. 2017, 107, 630–643. [Google Scholar] [CrossRef] [PubMed]
  14. Glasby, T.M.; Gibson, P.T.; Cruz-Motta, J.J. Differences in Rocky Reef Habitats Related to Human Disturbances across a Latitudinal Gradient. Mar. Environ. Res. 2017, 129, 291–303. [Google Scholar] [CrossRef] [PubMed]
  15. Thomsen, M.S.; Mondardini, L.; Alestra, T.; Gerrity, S.; Tait, L.; South, P.M.; Lilley, S.A.; Schiel, D.R. Local Extinction of Bull Kelp (Durvillaea Spp.) Due to a Marine Heatwave. Front. Mar. Sci. 2019, 6, 84. [Google Scholar] [CrossRef]
  16. Velásquez, M.; Fraser, C.I.; Nelson, W.A.; Tala, F.; Macaya, E.C. Concise Review of the Genus Durvillaea Bory de Saint-Vincent, 1825. J. Appl. Phycol. 2020, 32, 3–21. [Google Scholar] [CrossRef]
  17. Smith, S.D.A.; Simpson, R.D. Spatial Variation in the Community Structure of Intertidal Habitats at Macquarie Island (Sub-Antarctic). Antarct. Sci. 2002, 14, 374–384. [Google Scholar] [CrossRef]
  18. Montie, S.; Thomsen, M.S. Long-term Community Shifts Driven by Local Extinction of an Iconic Foundation Species Following an Extreme Marine Heatwave. Ecol. Evol. 2023, 13, e10235. [Google Scholar] [CrossRef] [PubMed]
  19. Arranz, V.; Liggins, L.; Aguirre, J.D. Metabarcoding Hyperdiverse Kelp Holdfast Communities on Temperate Reefs: An Experimental Approach to Inform Future Studies. Environ. DNA 2022, 4, 492–509. [Google Scholar] [CrossRef]
  20. Smith, S.D.A.; Simpson, R.D.; Cairns, S.C. The Macrofaunal Community of Ecklonia Radiata Holdfasts: Description of the Faunal Assemblage and Variation Associated with Differences in Holdfast Volume. Aust. J. Ecol. 1996, 21, 81–95. [Google Scholar] [CrossRef]
  21. Carbajal, P.; Gamarra Salazar, A.; Moore, P.J.; Pérez-Matus, A. Different Kelp Species Support Unique Macroinvertebrate Assemblages, Suggesting the Potential Community-wide Impacts of Kelp Harvesting along the Humboldt Current System. Aquat. Conserv. 2022, 32, 14–27. [Google Scholar] [CrossRef]
  22. Montie, S.; Thomsen, M.S. Facilitation of Animals Is Stronger during Summer Marine Heatwaves and around Morphologically Complex Foundation Species. Ecol. Evol. 2023, 13, e10512. [Google Scholar] [CrossRef] [PubMed]
  23. Tuya, F.; Larsen, K.; Platt, V. Patterns of Abundance and Assemblage Structure of Epifauna Inhabiting Two Morphologically Different Kelp Holdfasts. Hydrobiologia 2011, 658, 373–382. [Google Scholar] [CrossRef]
  24. Smith, S.D.A.; Simpson, R.D. Effects of the “Nella Dan” Oil Spill on the Fauna of Durvillaea Antarctica Holdfasts. Mar. Ecol. Prog. Ser. 1995, 121, 73–89. [Google Scholar] [CrossRef]
  25. Smith, S.D.A. The Macrofaunal Community of Ecklonia Radiata Holdfasts: Variation Associated with Sediment Regime, Sponge Cover and Depth. Aust. J. Ecol. 1996, 21, 144–153. [Google Scholar] [CrossRef]
  26. Smith, S.D.A. Impact of Domestic Sewage Effluent versus Natural Background Variability: An Example from Jervis Bay, New South Wales. Mar. Freshw. Res. 1994, 45, 1045–1064. [Google Scholar] [CrossRef]
  27. Anderson, M.J.; Gorley, R.N.; Clarke, K.R. PERMANOVA+ for PRIMER: Guide to Software and Statistical Methods; PRIMER-E Ltd.: Plymouth, UK, 2008. [Google Scholar]
  28. Clarke, K.R.; Gorley, R.N. PRIMER v7: User Manual/Tutorial; PRIMER-E Ltd.: Plymouth, UK, 2015. [Google Scholar]
  29. R Core Team. R: A Language and Environment for Statistical Computing; R Core Team: Vienna, Austria, 2022. [Google Scholar]
  30. Burnham, K.P.; Anderson, D.R.; Huyvaert, K.P. AIC Model Selection and Multimodel Inference in Behavioral Ecology: Some Background, Observations, and Comparisons. Behav. Ecol. Sociobiol. 2011, 65, 23–35. [Google Scholar] [CrossRef]
  31. Dormann, C.F.; Elith, J.; Bacher, S.; Buchmann, C.; Carl, G.; Carré, G.; Marquéz, J.R.G.; Gruber, B.; Lafourcade, B.; Leitão, P.J. Collinearity: A Review of Methods to Deal with It and a Simulation Study Evaluating Their Performance. Ecography 2013, 36, 27–46. [Google Scholar] [CrossRef]
  32. Davis, T.R.; Champion, C.; Coleman, M.A. Ecological Interactions Mediate Projected Loss of Kelp Biomass under Climate Change. Divers. Distrib. 2022, 28, 306–317. [Google Scholar] [CrossRef]
  33. Anderson, M.J.; Diebel, C.E.; Blom, W.M.; Landers, T.J. Consistency and Variation in Kelp Holdfast Assemblages: Spatial Patterns of Biodiversity for the Major Phyla at Different Taxonomic Resolutions. J. Exp. Mar. Biol. Ecol. 2005, 320, 35–56. [Google Scholar] [CrossRef]
  34. Ojeda, F.P.; Santelices, B. Invertebrate Communities in Holdfasts of the Kelp Macrocystic Pyrifera from Southern Chile. Mar. Ecol. Prog. Ser. Oldendorf 1984, 16, 65–73. [Google Scholar] [CrossRef]
  35. Teagle, H.; Moore, P.J.; Jenkins, H.; Smale, D.A. Spatial Variability in the Diversity and Structure of Faunal Assemblages Associated with Kelp Holdfasts (Laminaria Hyperborea) in the Northeast Atlantic. PLoS ONE 2018, 13, e0200411. [Google Scholar] [CrossRef] [PubMed]
  36. Novaczek, I. Stipe Growth Rings in Ecklonia Radiata (C. AG.) J. AG.(Laminariales). Br. Phycol. J. 1981, 16, 363–371. [Google Scholar] [CrossRef]
  37. Hill, R.; Bellgrove, A.; Macreadie, P.I.; Petrou, K.; Beardall, J.; Steven, A.; Ralph, P.J. Can Macroalgae Contribute to Blue Carbon? An A Ustralian Perspective. Limnol. Oceanogr. 2015, 60, 1689–1706. [Google Scholar] [CrossRef]
  38. Thurstan, R.H.; Brittain, Z.; Jones, D.S.; Cameron, E.; Dearnaley, J.; Bellgrove, A. Aboriginal Uses of Seaweeds in Temperate Australia: An Archival Assessment. J. Appl. Phycol. 2018, 30, 1821–1832. [Google Scholar] [CrossRef]
Figure 1. Study area in southeastern Australia, Durvillaea amatheiae sampling locations (black dots), and D. amatheiae current distribution on mainland Australia, excluding Tasmania (solid line).
Ecologies 05 00014 g001
Figure 2. Typical Durvillaea amatheiae holdfast (ex situ) showing (a) top surface and (b) underside and overgrown organisms.
Ecologies 05 00014 g002
Figure 3. Metric multidimensional scaling plot showing relative similarity of average Durvillaea amatheiae macrofaunal holdfast assemblages at sampling locations in southeastern Australia. Ellipses indicate 95% confidence limit on location of average assemblages.
Ecologies 05 00014 g003
Figure 4. (a) Average number of macrofaunal species in Durvillaea amatheiae holdfasts at sampling locations in southeastern Australia standardised by holdfast diameter and (b) average abundance of macrofauna per holdfast standardised by holdfast diameter. Bars indicate standard error; different letters indicate significant differences among locations.
Ecologies 05 00014 g004
Figure 5. Pearson’s correlations between Durvillaea amatheiae holdfast diameter and (a) number of macrofaunal species in holdfast and (b) abundance of macrofauna in holdfast. Blue line indicates Pearson’s correlation best-fit to data and shaded area indicates standard error on best-fit.
Ecologies 05 00014 g005
Table 1. Survey locations and number of Durvillaea amatheiae holdfast samples collected.
LocationLatitude (° S)Longitude (° E)SamplesMean Annual Sea Surface Temperature (°C)
Aragunnu36.5910150.04351018.38
Tathra36.7379149.98461018.12
Merimbula36.9005149.9371717.94
Green Cape37.2552150.01331017.51
Mallacoota37.5719149.76481016.98
Cape Conran37.8125148.72681015.83
Table 2. Total number of macrofauna species in Durvillaea amatheiae holdfasts by phylum at sampling locations in southeastern Australia across all holdfasts sampled (N).
PhylumAragunnu (10)Tathra (10)Merimbula (7)Green Cape (10)Mallacoota (10)Cape Conran (10)Total (57)
Annelida149111311624
Cnidaria0101001
Crustacea937103114
Foraminifera0010001
Insecta1000001
Mollusca7334327
Nematoda1111111
Nemertea1111111
Platyhelminthes0001001
Total33182431191151
Table 3. Contributions of individual species to dissimilarity among average Durvillaea amatheiae macrofaunal holdfast assemblages at sampling locations in southeastern Australia.
SpeciesContribution to Differences among Assemblages %Cumulative Contribution %
Lasaea australis15.9%15.9%
Mytilidae spp.7.8%23.7%
Syllis gracilis7.4%31.1%
Ceratonereis6.8%37.9%
Lumbrinereis sp. 24.9%42.7%
Nemertea spp.3.9%46.6%
Nereididae sp. 23.3%49.9%
Nematoda spp.2.9%52.8%
Table 4. Distance-based linear models trialled, explanatory variables for models, and model performance in explaining variations in macrofaunal assemblages in Durvillaea amatheiae holdfasts.
ModelExplanatory VariablesAICR2RSS
1Latitude, holdfast diameter413.180.110115,030
2Latitude413.730.066120,690
3Latitude, sediment content414.050.095116,940
4Latitude, diameter, sediment414.530.121113,630
5Holdfast diameter415.360.037124,470
6Sediment content415.510.034124,820
7Diameter, sediment416.210.057121,800
Disclaimer/Publisher’s Note: The statements, opinions and data contained in all publications are solely those of the individual author(s) and contributor(s) and not of MDPI and/or the editor(s). MDPI and/or the editor(s) disclaim responsibility for any injury to people or property resulting from any ideas, methods, instructions or products referred to in the content.

