
Effects of Landscape Heterogeneity and Disperser Movement on Seed Dispersal


1
U.S. Army Corps of Engineers, Engineer Research and Development Center, P.O. Box 9005, Champaign, IL 61826, USA
2
Endangered Species Branch, Bldg 0-9125 McKellors Road, Fort Liberty, NC 28310, USA
*
Author to whom correspondence should be addressed.
Ecologies 2024, 5(2), 198-217; https://doi.org/10.3390/ecologies5020013
Submission received: 9 March 2024
/
Revised: 3 April 2024
/
Accepted: 6 April 2024
/
Published: 11 April 2024
Abstract
:The primacy of endozoochory for the maintenance and expansion of many woody plant populations is well known, but seed dispersal is not well understood for most species. This is especially true for rare species, where small population size and low fruit production can limit field- or observation-based experiments. Additionally, the effect of environmental heterogeneity on disperser movement is rarely investigated but has been shown to improve estimates of plant population spatial patterns and dynamics. We used simulation experiments to explore the effects of environmental heterogeneity and disperser movement on Lindera subcoriacea seed dispersal, a rare shrub from the southeastern United States with avian-dispersed seeds. Our experiments incorporated environmental heterogeneity and simulated disperser movement for five bird species, based on either landscape permeability or straight path rules. We anticipated that permeability-based movement would result in greater dispersal distances and seed dispersal effectiveness, which characterizes both quantity and quality. Generally, we did not find differences in seed dispersal between permeability and straight path experiments. However, we did find that permeability-based experiments had greater deposition into suitable habitat during flight (23 vs. 1%). These rare but longer distance depositions may be especially important for plants that are influenced by gap or interpopulation dynamics. We also found consistently greater dispersal into high quality habitats regardless of disperser species in permeability experiments, implying that incorporating species-specific assessments of landscape utilization (occupancy) could influence the effectiveness of seed dispersal. Our study suggests that including environmental heterogeneity in seed dispersal models can provide additional insights not provided by avian parameters (e.g., gut capacity, seed retention time, and flight speed) commonly used to inform dispersal models.
1. Introduction
Seed dispersal is a key ecological phenomenon that contributes to many ecological processes, including individual fitness, population demography, metapopulation dynamics, gene flow, biodiversity maintenance, and community development [1,2]. Our understanding of seed dispersal for most plants is not well-resolved, due to difficulties in tracking individual seeds before, during, and after dispersal [3,4]. While endozoochory is a well-studied plant–animal interaction, it remains an active research area because of the marked variation in dispersers and environmental conditions that can affect the ecological processes linked to seed dispersal [5,6,7,8,9]. Simulation experiments, in particular, have been used successfully to overcome the limitations of field-based experiments imposed by this variation and other factors [10,11].
Estimating how many and where seeds are likely to be dispersed is key to understanding the ecological processes affected by seed dispersal [12]. Dispersal kernels are the probability distributions of dispersal distances [13] and characterize how likely is it that a seed is dispersed a given distance. Kernel scale and shape are the statistical properties that are of ecological interest [13,14]. The scale of the kernel is determined by the mean and variance of the dispersal distance, whereas the shape describes the tail of the kernel and is estimated from the dispersal distance kurtosis. In addition to dispersal distance, probability estimates of dispersal to suitable habitats are also important for understanding processes affected by seed dispersal.
This information can be used to estimate the seed dispersal effectiveness (SDE) of a disperser, which is the product of the quantity (SDEQ; number of seeds dispersed) and quality (SDED; the probability a dispersed seed produces a new adult) components of seed dispersal, and is useful for understanding the dispersal services that a plant receives [15,16,17]. Thus, a better understanding of seed dispersal can be achieved by exploring the effects of disperser identity and environmental heterogeneity. For example, estimates of dispersal kernels and SDE can help determine the likelihood and quality of long-distance dispersal (LDD) events, which are important for metapopulation processes and may provide conservation insight [18,19].
For seeds dispersed through endozoochory, dispersal patterns (i.e., seed rain) are affected by disperser identity and behavior, environmental heterogeneity, and their interactions [20,21,22]. Disperser identity is important, because some inter- and intra-specific characteristics may affect the seed dispersal kernel and SDE differently among dispersers [21,23,24]. For example, the length of time from seed consumption until digestive passage or regurgitation (seed retention time [SRT]) varies among species and is an important predictor of dispersal kernel properties [8,25,26]. The size, movement, and habitat preferences of animals have all been shown to contribute to SDE [25,27,28]. Disperser movement, behavior, and seed retention times provide necessary inputs to estimate seed dispersal kernels [29,30,31,32,33,34,35].
The movement of animals between locations is likely better characterized as directed rather than random walks [36,37]; that is, movement decisions (direction, route, and speed) are affected by the distance between locations and landscape environmental heterogeneity. Accordingly, incorporating environmental heterogeneity into animal movement better approximates reality [38], and the interactive effect of dispersers and the environment on seed dispersal is an area of active research [22,39,40]. Environmental heterogeneity may include characteristics of vegetation physiognomy, topography, and landscape fruit availability, among others. A suite of these characteristics can be used to estimate the likelihood that a given disperser would occupy a given area [41,42]. Occupancy likelihood has been promoted as a tool to identify potential least-cost pathways/corridors for conservation [43,44], and habitat suitability and use, from which occupancy is modeled, have been used to characterize avian movement pathways [45,46,47,48]. Thus, occupancy provides a way to identify potential routes and distances a disperser may travel between locations.
There is vast temporal and spatial variation in the many intrinsic (i.e., variation in traits of individual plants) and extrinsic (i.e., variation in ecological context) drivers that can affect multiple (sub)components of SDE [49]. Considering this variation, we developed a model to describe seed dispersal for of one the largest aggregations of the rare wetland shrub, Lindera subcoriacea Wofford (Lauraceae; bog spicebush) [50], by five generalist, avian frugivores. The species is relatively unknown, but is considered vulnerable due to factors like poor recruitment, recent population extirpations, and population growth rates near unity [50,51].
To test whether animal movement rules, environmental heterogeneity, and disperser identity can explain dispersal kernel estimates and SDE of L. subcoriacea, we conducted a series of simulation experiments. We compared the differences in seed dispersal when disperser movement was determined by straight path- or landscape permeability-based rules [20,45,52]. The use of permeability-based movement rules for dispersers, using occupancy likelihoods and other factors, may be beneficial in describing seed dispersal and may differ from straight path movement between locations, but we are unaware of a quantitative comparison of these movement methods. Our expectations for experiments using permeability-based movement were that dispersers would accrue longer travel distances and thus have more dispersal during flight. For bird species that are more likely to occupy upland habitat that is unsuitable for L. subcoriacea recruitment, the permeability-based movement method would result in lower SDE. We evaluated the potential usefulness of this more nuanced simulated disperser movement, as there are few published examples of models that incorporate both animal movement and environmental heterogeneity to describe seed dispersal [24,29,53,54]. We also conducted experiments comparing dispersal when disperser species were parameterized with distinct vs. the same physiological parameters to parse the effects of physiology (e.g., gut capacity, SRT, and flight speed) versus environmental heterogeneity on seed dispersal. Our expectations for these experiments were that SDE would differ, but SDED would not, due to the effects of environmental heterogeneity on disperser movement. Lastly, to assess the conservation implications of our results for this vulnerable species [3], we evaluated our dispersal estimates in relation to several metrics that characterize inter-population connectivity, including nearest neighbor distance, Hanski’s connectivity [55], and the number of individuals in L. subcoriacea populations.
2. Materials and Methods
2.1. Study System and Species
Fort Liberty (previously known as Fort Bragg; 35°07′ N, 79°10′ W), a U.S. Army installation located within the Sand Hills ecoregion of the southeastern U.S. [56], served as the location for our field-based and simulation efforts. Fort Liberty hosts one of the largest remaining intact areas of the longleaf pine (Pinus palustris Mill.) ecosystem and includes multiple high-quality natural communities that are under active fire-based management [57]. Longleaf pine–wiregrass (Aristida stricta Michx.) savanna (xeric Sandhill scrub) is the dominant vegetation community [57], though numerous wetlands (e.g., streamhead pocosin, sandhill seep) are interspersed throughout the landscape [58].
Lindera subcoriacea is a rare, dioecious, avian-dispersed [59] shrub that inhabits several wooded wetland communities of the southeastern U.S. [51]. Small, isolated populations of L. subcoriacea have been identified in seven southeastern states [50]. Fruits (drupe) contain a single ovoid seed (7.02 ± 0.29 mm long and 4.0 ± 0.2 mm wide; [51]). As compared to other Lindera spp. in the southeastern U.S. (e.g., L. benzoin (L.) Blume [northern spicebush], L. melissifolia Blume [pondberry]), relatively little is known about L. subcoriacea. However, recent work has revealed that the species has low and uneven fruit production (maturing in early August) among individuals, poor recruitment into larger size classes, and an estimated population growth rate near unity [51,60]. Given what is known about L. subcoriacea and its populations, the species has been classified with a global range rank of G3 (vulnerable) [61]. Moreover, it is currently under review by the U.S. Fish and Wildlife Service for listing under the Endangered Species Act [62].
Fort Liberty hosts at least 100 bird species, although the duration and seasonality of residency varies by species [63]. During the post-breeding period, which overlaps with peak dispersal/removal of mature L. subcoriacea fruit [59], a total of 22 seasonally-frugivorous bird species were observed on Fort Liberty (authors’ unpublished data). A subset (n = 18) of the observed species had sufficient observations to develop species occupancy models [64]. We performed simulation experiments to characterize L. subcoriacea dispersal, using five generalist bird species to represent the frugivore community: Turdus migratorius L. (American Robin), Cyanocitta cristata L. (Blue Jay), Sialia sialis L. (Eastern Bluebird), Melanerpes erythrocephalus L. (Red-headed Woodpecker), and Vireo griseus Boddaert (White-eyed Vireo). These dispersers spanned a range of body masses (~11–88 g) and exhibited varying landscape occupancy patterns. For plant species dispersed by generalists, like L. subcoriacea, understanding the dispersal characteristics of a complement of likely dispersers should provide a good summary of dispersal [65]. Our evaluation of this assumption for our study species is summarized in Tables S1 and S2; see the Supporting Information for this article.
2.2. Model Design
We developed an agent-based, spatially-explicit, stochastic, and event-driven model to simulate seed dispersal for one of the largest aggregations of L. subcoriacea. The purpose of our model is to describe how disperser characteristics, key environmental conditions, and their interactions affect L. subcoriacea seed dispersal patterns. The model shares fundamental elements used in other woody plant seed dispersal simulation experiments [22,30,66]. Our model and supporting analyses were conducted in R [67], and the agent-based framework was implemented with the package NetLogoR (0.3.7) [68]. A thorough description of the model that follows the ODD (overview, design concepts, and details) protocol of Grimm et al. [69,70] is included in Appendix S1.
Briefly, our model represented the movement of individual birds of a given species across the Fort Liberty landscape as they visited and foraged upon L. subcoriacea or visited other locations (Figure S1). Movement and foraging decisions varied by species as a function of pertinent bird and environmental parameters (Table 1). Birds selected locations to forage and/or visit based on their fruit availability and distance to other locations; the product of these two components determined the attractiveness of the potential destinations (Figure S1B,C). Attractiveness varied by species (Appendix S1). We used these characteristics for attractiveness as previous work has identified negative relationships between frugivory and distance to fruit resources, and positive relationships between frugivory and fruit resource availability [8,71]. Upon arrival at a new location, birds were assigned a perching time, drawn from a Gamma distribution, based on multi-species estimates used in other avian seed dispersal simulations [22,24,66]. When the perching time elapsed, birds moved to a new location if they were still active for the day. Birds were active for four hours per day, based on anticipated and observed patterns of peak avian activity at our study site [72,73]. Birds flew at constant speeds (Table 1), derived allometrically [74], between locations. Because L. subcoriacea has no specialist avian frugivores, and for modeling simplicity, the probability of moving to a L. subcoriacea location was generically set at 25%, and at 75% for a non-Lindera location (Appendix S1). While perched at L. subcoriacea, birds could have one or no foraging events; this was dependent on fruit availability and gut capacity (Figure S1B). Birds did not forage at non-Lindera locations in the model. In general, birds are thought to eat as much as their current capacity allows [75] and in our model the quantity consumed followed a type II functional response [76,77], but did not exceed gut capacity (Table 1). For modeling simplicity, the same SRT, drawn from a Gamma distribution (allometrically-derived parameters vary by species (Table 1)), was assigned to all seeds consumed during a foraging event. Once the SRT elapsed for a given foraging event, all seeds from that event were dispersed (i.e., deposited via defecation or regurgitation), whether perched or flying. Additionally, at the end of each day any remaining seeds were dispersed at the final perching location, where the bird remained until the following day.
2.3. Modelling Landscape
The modelling landscape consisted of cells that represented an area of 30 × 30 m, emulating the spatial extent of Fort Liberty at the same resolution. We chose this cell size to match the resolution of remotely-sensed and derivative data used in this effort. Landscape cells were characterized by their location, occupancy likelihood (per bird species), and fruit availability (kg ha−1). The locations of L. subcoriacea within the modelling landscape were based on previously reported spatial coordinates of all known female individuals (n = 88) [50,51]. We located individuals at the nearest landscape cell centroid. We set the initial fruit availability for each L. subcoriacea cell (LISU) as the maximum number of fruits reported for the plant over nine annual surveys conducted from 2011–2019 [50,51]. Each LISU cell was considered to be one plant. For any cells that would have hosted multiple observed individuals, we summed their fruits and used the value as the initial fruit availability for that cell. LISU cells (n = 75) had a mean of 130.5 ± 33.5 (SE) and a median of 3 fruits. All fruits were considered mature (ripe) throughout modelling and no additional fruits were produced within the model; this summarized our field observations of fruit maturation trends [59]. Non-LISU locations varied within and among bird species and were a subset (n = 100) of the remaining cells in the landscape; their fruit availability was representative of their vegetation type and season (see Appendix S1).
2.4. Simulation Experiments
We performed simulation experiments using the model described above. We varied movement method (landscape permeability, straight path) and bird physiological parameter set (distinct, same), and used their pairs as the basis for our experiments. Experiments using the same bird physiological parameters used T. migratorius parameters for all species, as it was moderately sized among the five. We did not use mean parameter values, because we could not assume that a ~55 g frugivorous bird was ecologically viable when considering scale-dependent resource availability constraints [80,81]. Complete experiment descriptions are described in our Appendix S1. For each of the four experiments, we executed 30 replicates, each lasting for 7 simulation days, representing the mean duration of ripe fruit dispersal/removal [59]. Each bird species (n = 5) had their own set of experiments. Each bird (n = 5) continuously foraged, perched, or moved for 240 min per day. There were no direct interactions of the conspecific individuals in the model, aside from preventing each other from occupying the same location and, as fruit was depleted, birds may have travelled greater distances to forage. Birds started each replicate at a pseudo-randomly selected, weighted by occupancy probability, LISU cell. The spatial arrangement and starting fruit availability of LISU cells and other locations did not vary between replicates or bird species. For each replicate, we recorded LISU cell fruit availability, seed starting and ending location, distance dispersed, and habitat suitability of dispersal location. Seeds were recorded as dispersed when they were deposited at a non-origin location (Appendix S1: Section 1.3: Process overview and scheduling). For birds, we recorded the number of fruits eaten, number of seeds dispersed, and distance travelled (i.e., route distance) (Figure S1D; see Appendix S1: Section 3.1-Submodels).
We varied the movement method to evaluate the utility of the more demanding permeability-based approach, as there is a dearth of models that include both animal movement and environmental heterogeneity to describe seed dispersal. Our expectation was that this nuance would identify SDE differences for L. subcoriacea based on disperser identity. Experiments that used T. migratorius physiological parameters for all species investigated the effects of bird parameters versus environmental conditions as revealed by SDEQ, SDED, and SDE values. Results from these experiments are found in the Tables S3–S10.
2.5. Analyses
2.5.1. Seed Dispersal Effectiveness
We estimated SDE as the product of SDEQ and SDED. For SDEQ, we first summed the number of dispersed seeds (i.e., consumed seeds deposited at a non-origin location) for each experimental replicate. Given the resolution of our modelling landscape, this represents the minimum distance needed to move into a different cell. We then used the mean number of dispersed seeds per experiment to characterize SDEQ. The quality component of SDE, SDED, was similarly aggregated and is recorded as the mean proportion of seeds that were dispersed to suitable locations. Lindera subcoriacea habitat suitability was represented by the values reported for a species distribution model [82]. This model estimated habitat suitability with MaxEnt [83] using L. subcoriacea presence data from 126 populations and climatic, edaphic, vegetation, topographic, and fire history data. Hohmann and Wall [82] set a threshold of 0.73 for suitable habitat, as this value represented the lower limit of most known L. subcoriacea populations. Given the possibility that the species recruitment niche might differ from its persistence niche [51], we chose to not overinterpret the habitat suitability values and instead used a binary approach where landscape cells with a value ≥ 0.73 were considered suitable habitat. We compared the mean SDEQ and SDED components between bird species or movement methods with the Wilcoxon–Mann–Whitney (base::wilcox.test) or Kruskal–Wallis tests (base::kruskal.test).
2.5.2. Seed Dispersal Kernels
For dispersal kernel analyses, we considered the movement of each dispersed seed and combined the results of the five birds across instances and recorded the mean distance of all dispersal events. For each experiment by bird species, we fitted a Weibull probability density function (Equation (1)) using MASS::fitdistr [84] to the dispersal distance data, using the function described in Austerlitz et al. [85] to estimate the dispersal kernel.
Here, α is the scale parameter and β the shape parameter. The Weibull distribution has been used in other studies to describe seed dispersal kernels and has generally outperformed other density functions for endozoochory [22,66,86]. The scale of the Weibull distribution is used to estimate mean seed dispersal distance and the shape parameter, which determines the shape (slope) of the curve [86], is used to estimate kurtosis. We estimated the mean and standard error of the dispersal kernel parameters using the maximum likelihood solution for the Hessian matrix with numDeriv::hessian [87]. We also estimated the mean dispersal distance and kurtosis [85].
2.5.3. Population Size, Nearest Neighbor Distance and Connectivity
To assess the conservation implications of our results, we evaluated our dispersal estimates in relation to several metrics that characterize inter-population connectivity, including nearest neighbor distance (NND), Hanski’s connectivity [55], and the number of individuals in L. subcoriacea populations [50]. All three of these metrics are expected to influence seed rain and potentially promote emigration/immigration, thereby enhancing gene flow, population rescue, and dioecious species mate assurance [3,88]. We calculated the perimeter to perimeter NND for the 62 distinct subpopulations (sensu subelement occurrences [89,90]) of L. subcoriacea (hereafter populations) on Fort Liberty using metacapa::patch_config [91]. We estimated the connectivity for each population (patch) using the following formula (Equation (2)).
Here, α is a distance decay parameter, d is the distance (m) from patch i to patch j, p is patch occupancy, and A is the area (m2) of the patch j [55]. We set α to 0.0076, which is the inverse of the average dispersal distance estimated by our simulations.
3. Results
3.1. Seed Dispersal Kernels
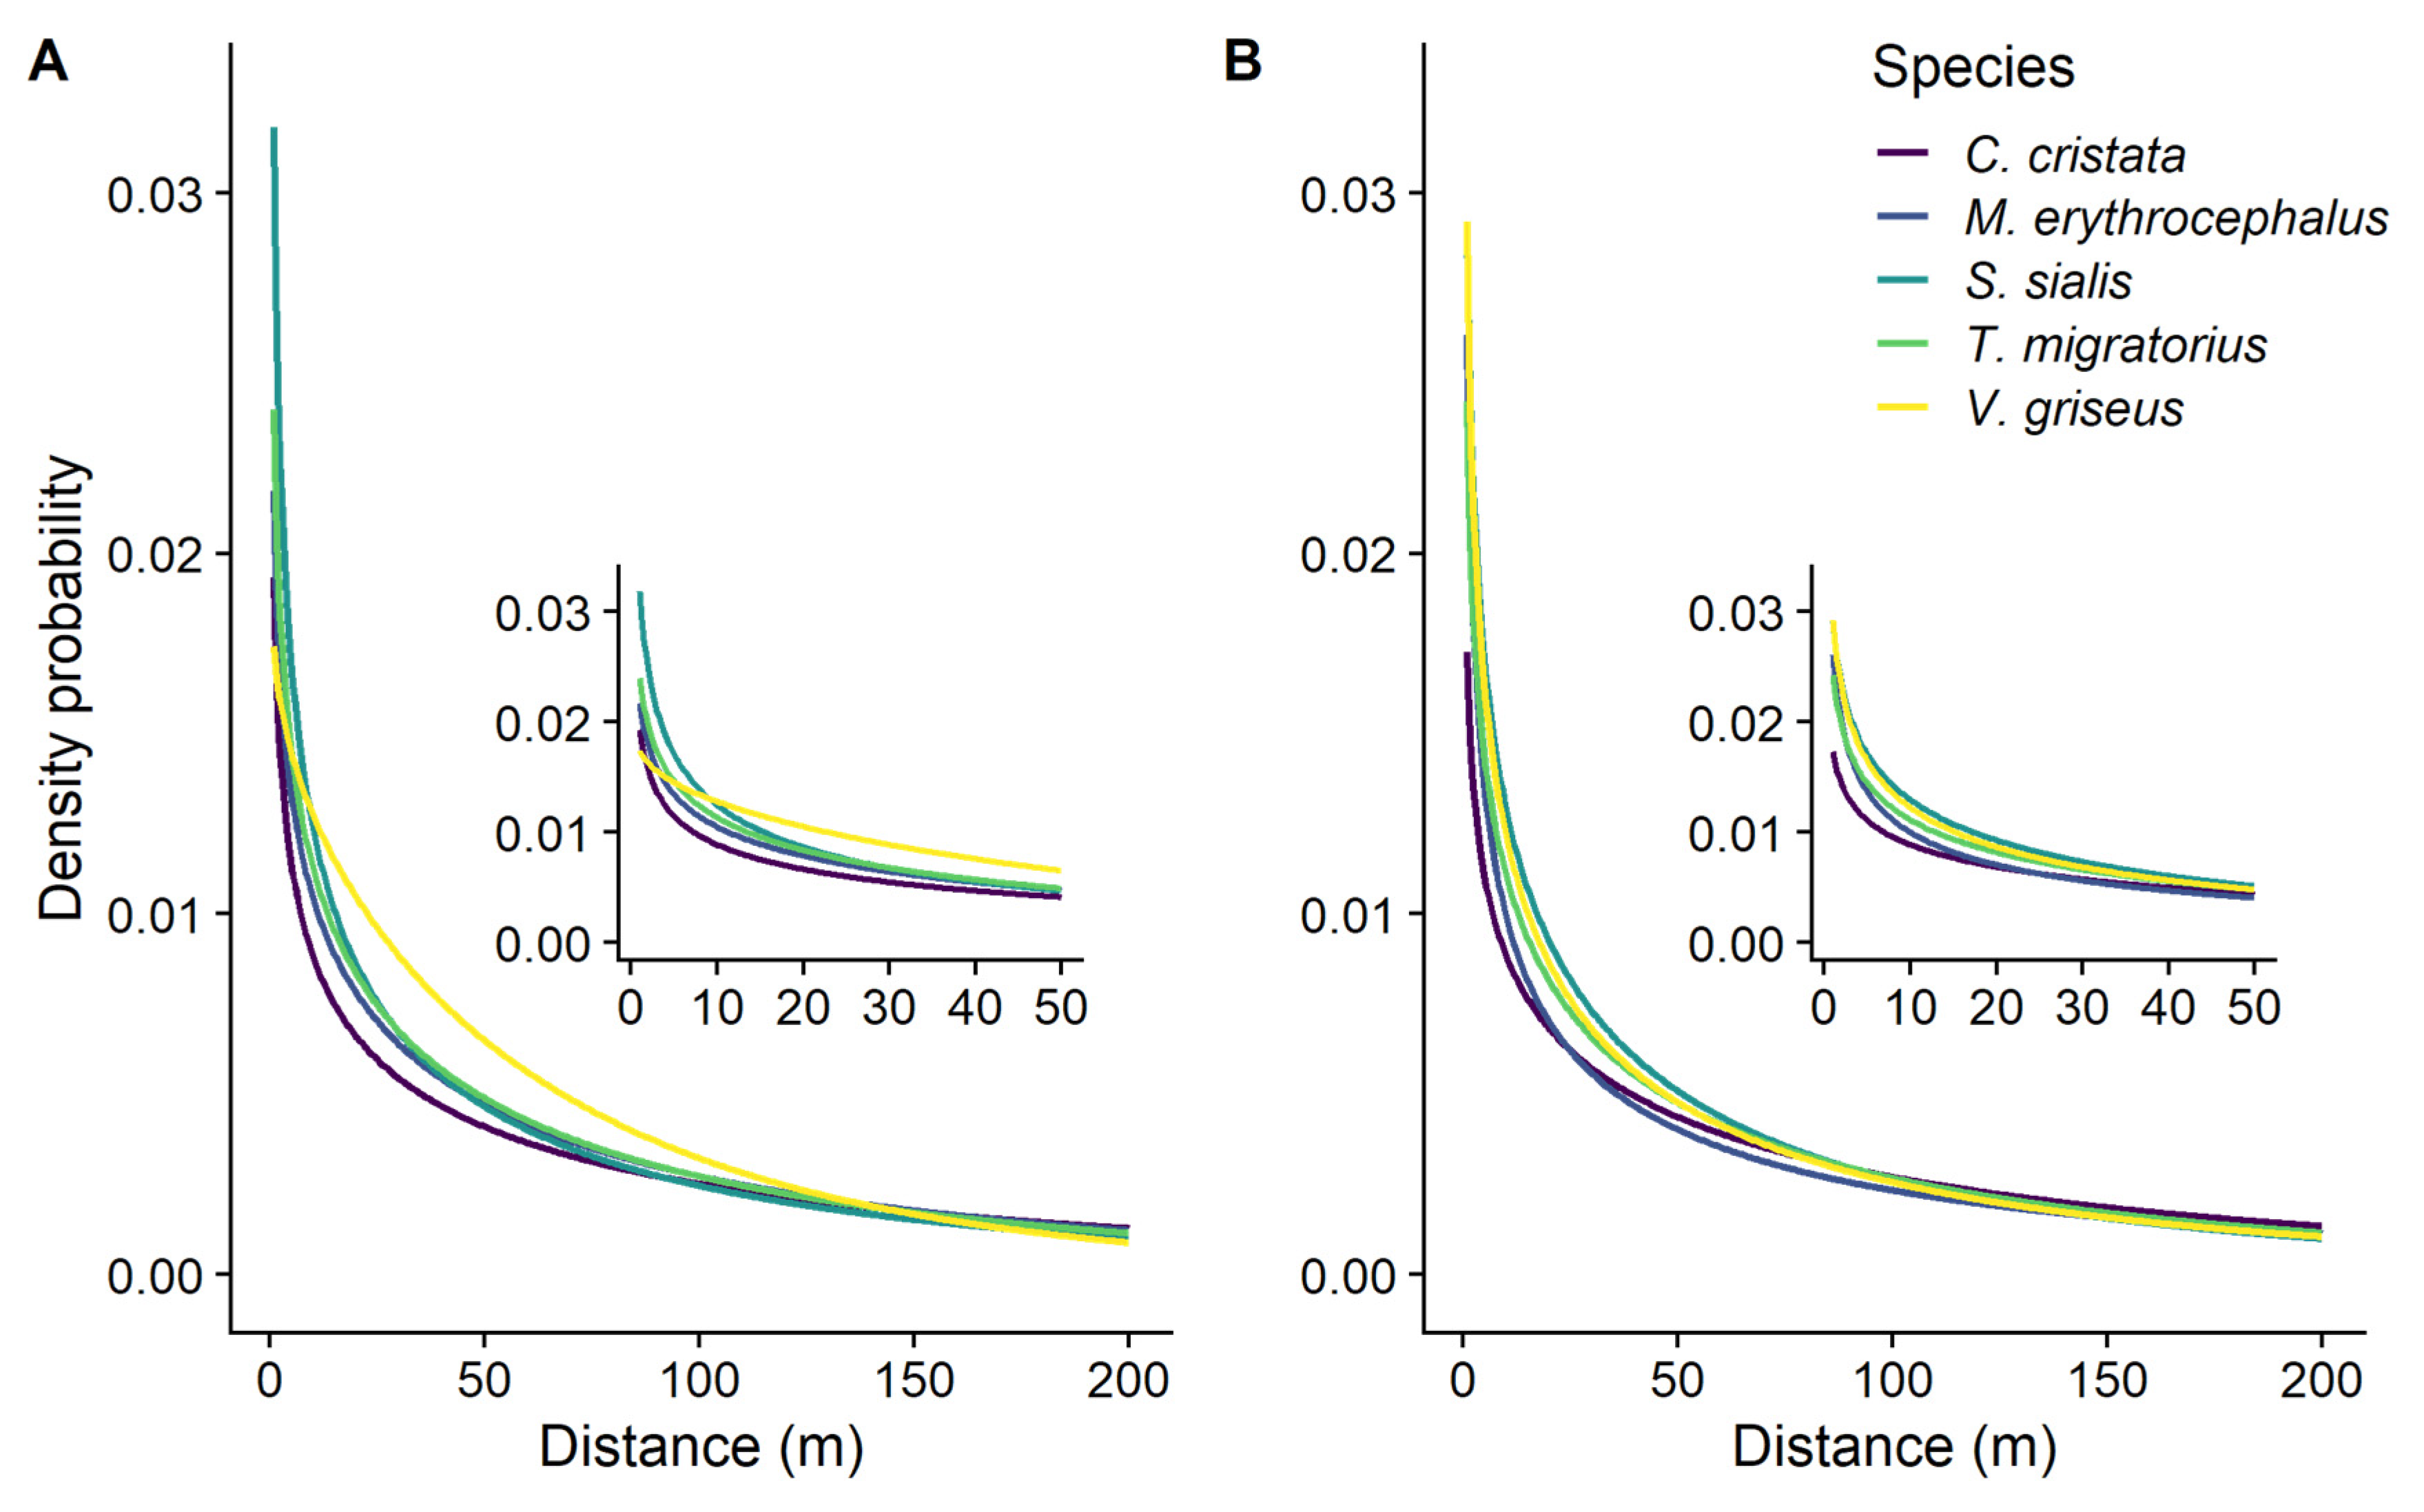
For landscape permeability experiments, the mean kernel shape ranged from 0.93 ± 0.07 to 0.67 ± 0.03 across the five bird species, all of which describe a decreased likelihood of dispersal with increased distance from the source (Table 2; Figure 1A). The mean scale of the permeability-based dispersal kernels ranged from 71.1 ± 9.07 to 152.0 ± 10.35 m; these are the distances within which an estimated 63.2% of the seeds would be dispersed. We found a similar range of values, 78.9 ± 8.77 to 141.6 ± 9.25 m, for the straight path experiments (Table 2; Figure 1B).
3.2. Seed Disperser Effectiveness
3.2.1. SDEQ and Proportion Dispersed
Within movement methods, the mean SDEQ varied among species (permeability: p < 0.001, = 123.84; straight path: p < 0.001, = 123.51). For landscape permeability experiments, SDEQ varied among species, ranging from 5.7 ± 0.57 to 141.4 ± 5.95 for V. griseus and T. migratorius, respectively (Table 3; Figure 2). For landscape permeability experiments, SDEQ for C. cristata and T. migratorius did not differ. For straight path experiments, the mean number of seeds dispersed did not differ between C. cristata and T. migratorius, nor between C. cristata and M. erythocephalus (Table 3).
Considering all species and comparing within movement methods, SDEQ differed between experiments using distinct or T. migratorius parameters (Table S9, Figure 3). Sialis sialis and V. griseus SDEQ differed between movement methods (Table S10).
Within movement methods, the mean relative percentage of seeds dispersed varied among species (landscape permeability: p < 0.001, = 125.64; straight path: p < 0.001, = 126.30). Across permeability experiments, T. migratorius dispersed, on average, 35.59 ± 1.25% of all dispersed seeds, whereas V. griseus dispersed 1.46 ± 0.16% (Table 3). We found a similar range of values for the straight path experiments, where T. migratorius dispersed, on average, 37.58 ± 1.47% of all dispersed seeds, whereas V. griseus dispersed 1.57 ± 0.14% (Table 3). Within species, neither the SDEQ, nor the proportion of seeds dispersed, differed between movement methods (Table 3). Similarly, across species, both SDEQ (H1 = 0.30, p = 0.56) and the proportion of seeds dispersed (H1 = 0.002, p = 0.97) did not differ between movement methods.
3.2.2. SDED
For permeability experiments, the mean proportion of seeds dispersed to suitable locations (SDED) varied between species (p < 0.001, = 40.58) and ranged from 0.44 ±0.03 to 0.75 ± 0.02 for S. sialis and T. migratorius, respectively (Table 4; Figure 2). For straight path experiments, SDED also varied among species (p < 0.001, = 26.11) with a range of 0.51 ± 0.04 to 0.76 ± 0.02 for S. sialis and T. migratorius, respectively (Table 4). Turdus migratorius differed from the other four species, which did not differ. Within (Table 4) or across (H1 = 0.09, p = 0.76) species, SDED did not differ between movement methods. We found no differences in SDED, across species and within movement methods between experiments using distinct or T. migratorius physiological parameters (Table S9, Figure 3).
3.2.3. SDE
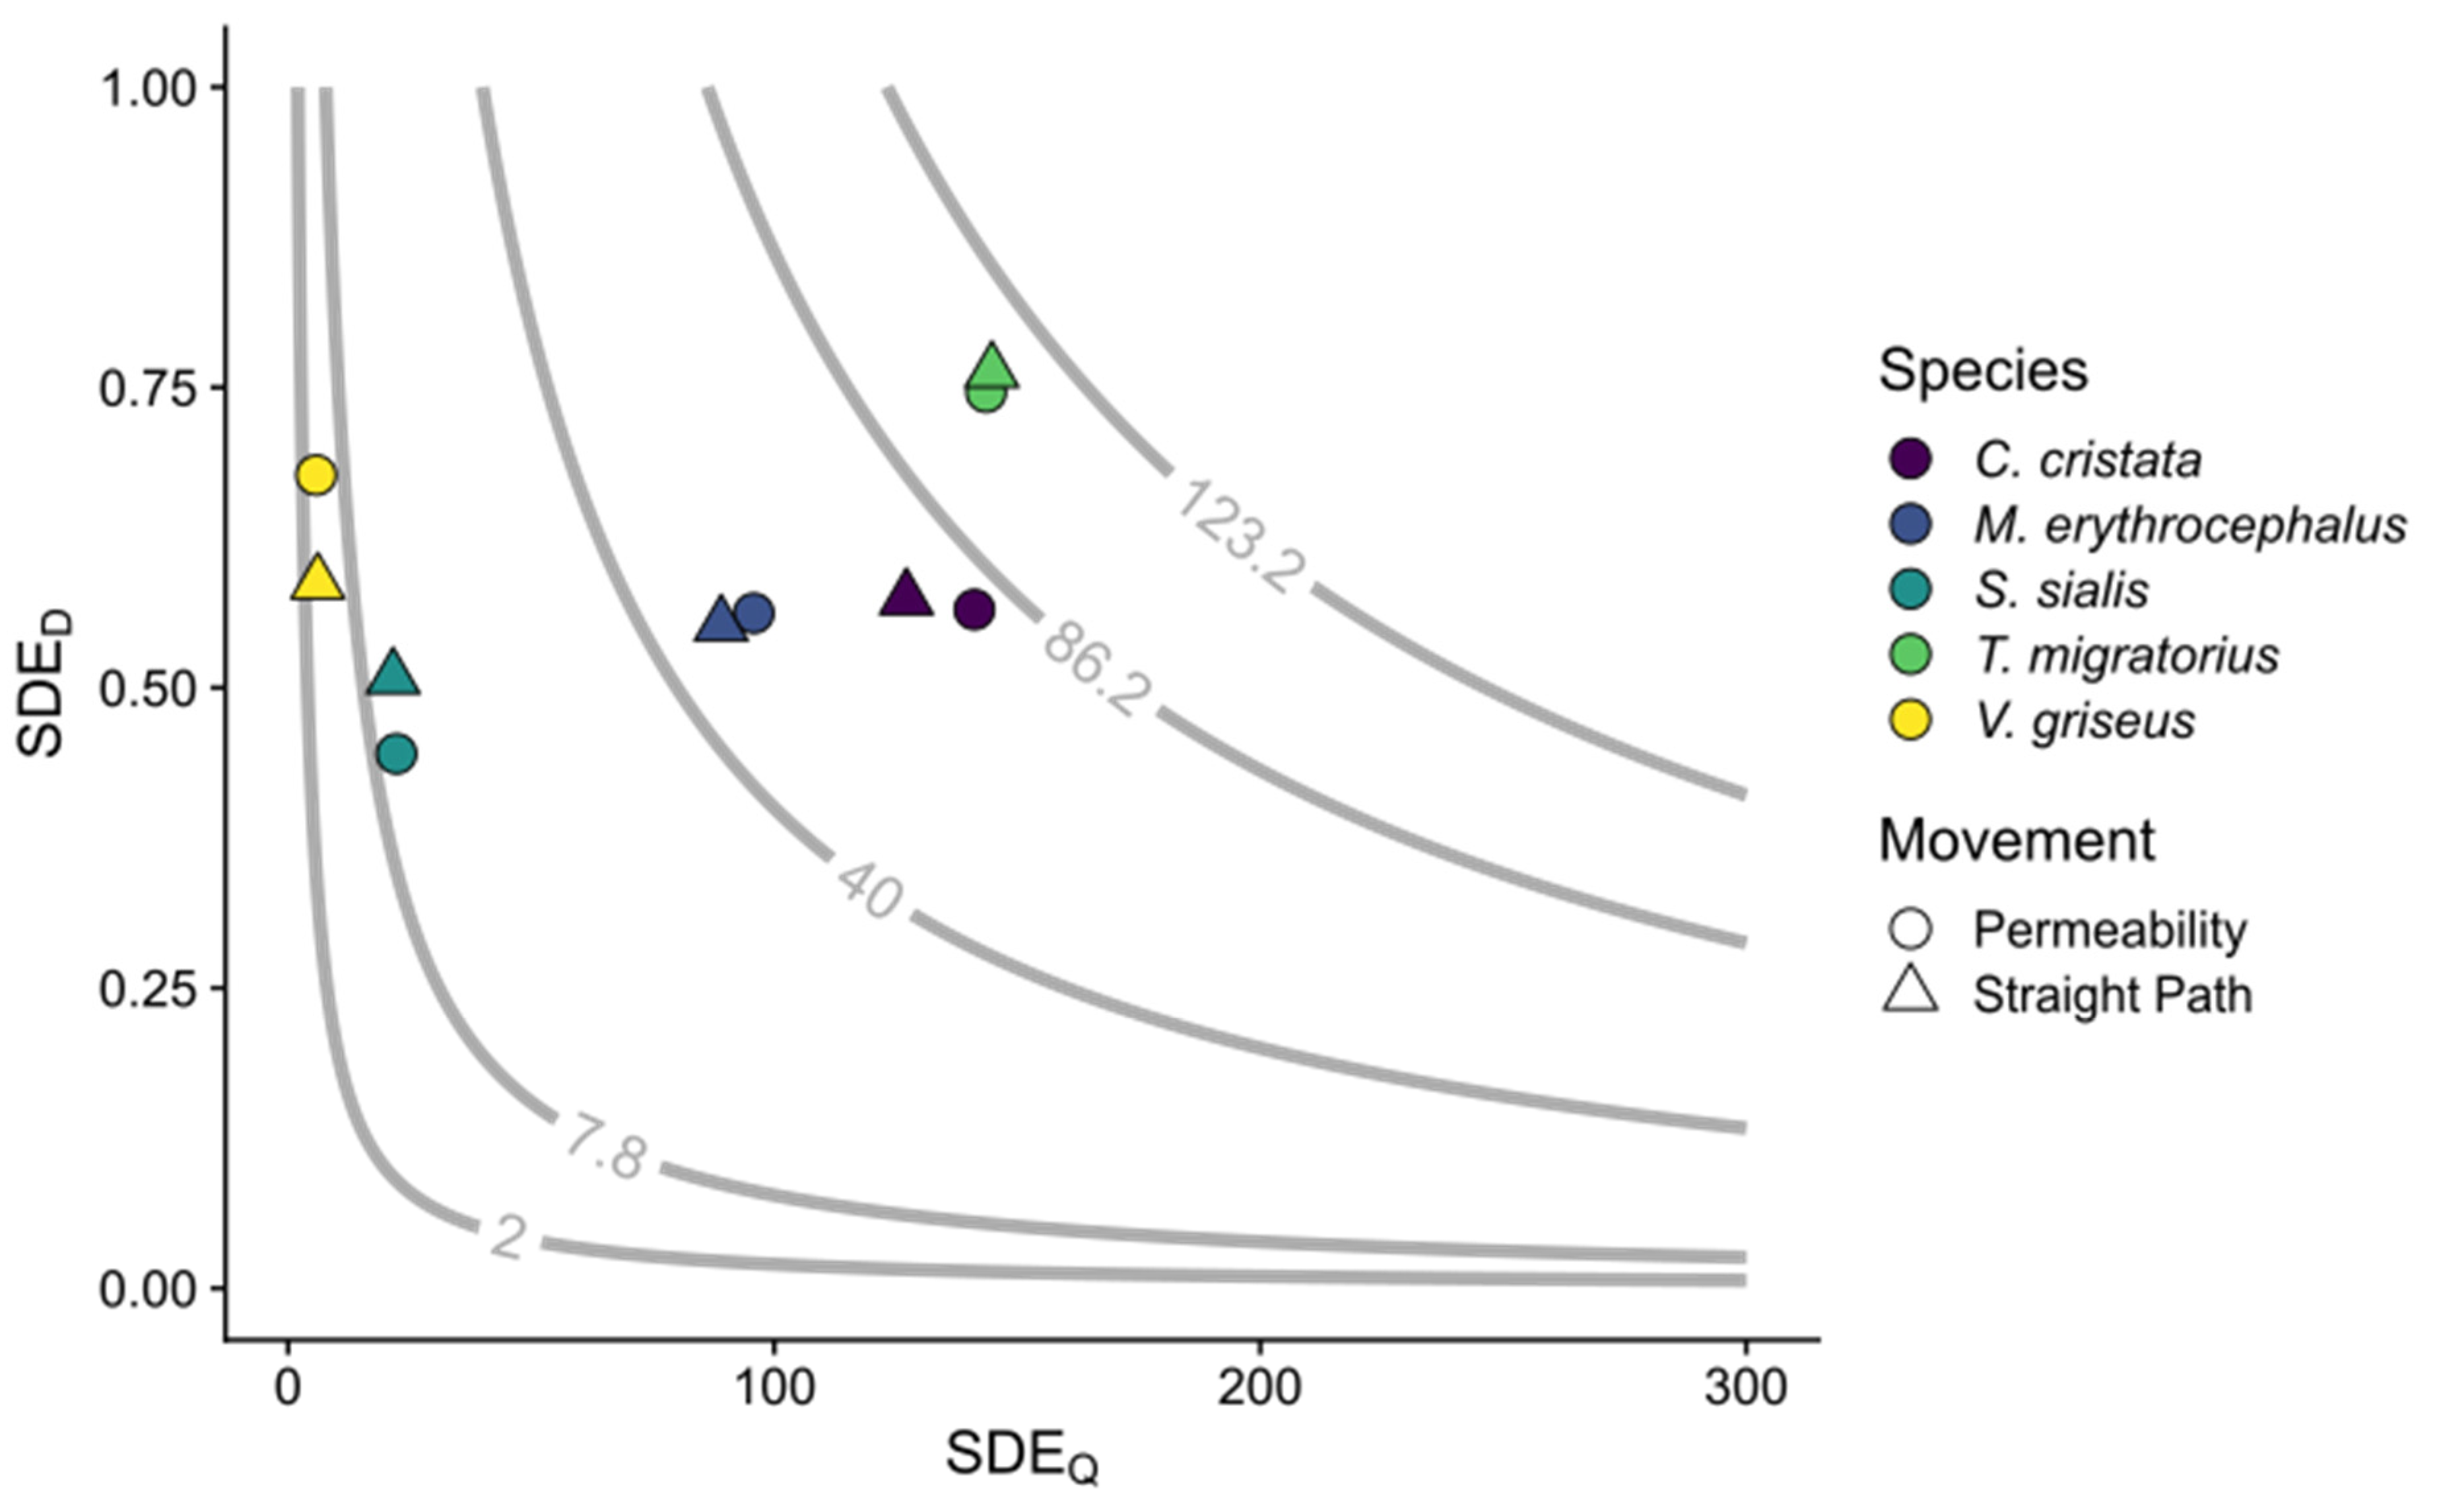
Within movement methods, the mean seed dispersal effectiveness (SDE; the product of SDEQ and SDED) varied between species (permeability: p < 0.001, = 124.00; straight path: p < 0.001, = 44.12; Figure 2). For both movement methods, T. migratorius had the greatest SDE, while V. griseus had the lowest (Table 5). Within (Table 5) and across (H1 = 0.03, p = 0.85) species, SDE did not differ between movement methods. Like SDEQ, SDE also varied between experiments, across species within movement methods, and when parametrized with distinct or T. migratorius parameters (Table S9, Figure 3). Sialis sialis and V. griseus differed between experiments in both movement methods for SDE (Table S10).
3.3. Route and Seed Dispersal Distances
Within movement methods, mean route distances varied between bird species (permeability: p < 0.001, = 31.2; straight path: p < 0.001, = 42.2). When comparing species pairwise, V. griseus had the shortest mean route distance (92.4 ± 17.82 m) and was different than the other species for permeability experiments, while straight path experiments had idiosyncratic post hoc differences among dispersers (Table 6). Within or across species, route distances did not differ between the two movement methods.
Within movement methods, mean seed dispersal distances varied among species (permeability: p < 0.001, = 41.3; straight path: p < 0.001, = 48.0). Pairwise species comparisons revealed idiosyncratic post hoc groupings for both movement methods (Table 6). Within species, dispersal distances did not differ between the two movement methods, except for M. erythocephalus (Table 6). Across species, dispersal distances did not differ between the two movement methods.
3.4. Seed Deposition
For landscape permeability experiments, the percentage of seeds (of those consumed) that were deposited at the same location as where they were eaten differed (p < 0.001, = 121.6) between species and ranged from 84.3 ± 0.62% to 98.3 ± 0.16% for C. cristata and V. griseus, respectively. By design, all dispersal events were >15 m. Again, we found a similar range of values for the percentage of seeds not dispersed for the straight path experiments, from 84.8 ± 0.58% to 98.4 ± 0.14% for C. cristata and V. griseus, respectively (Table 6).
Within and across species, the mean percentage of dispersed seeds deposited in flight did not differ between permeability and straight path experiments (2.0% vs. 1.3%), and no species had a mean greater than 3.5% (Table 6). Species did not differ in the percentage of seeds deposited in flight. The mean dispersal distance and number of seeds deposited in suitable or unsuitable L. subcoriacea sites during flight or while perched is presented in Table 7.
3.5. Population Size, Nearest Neighbor Distance, and Connectivity
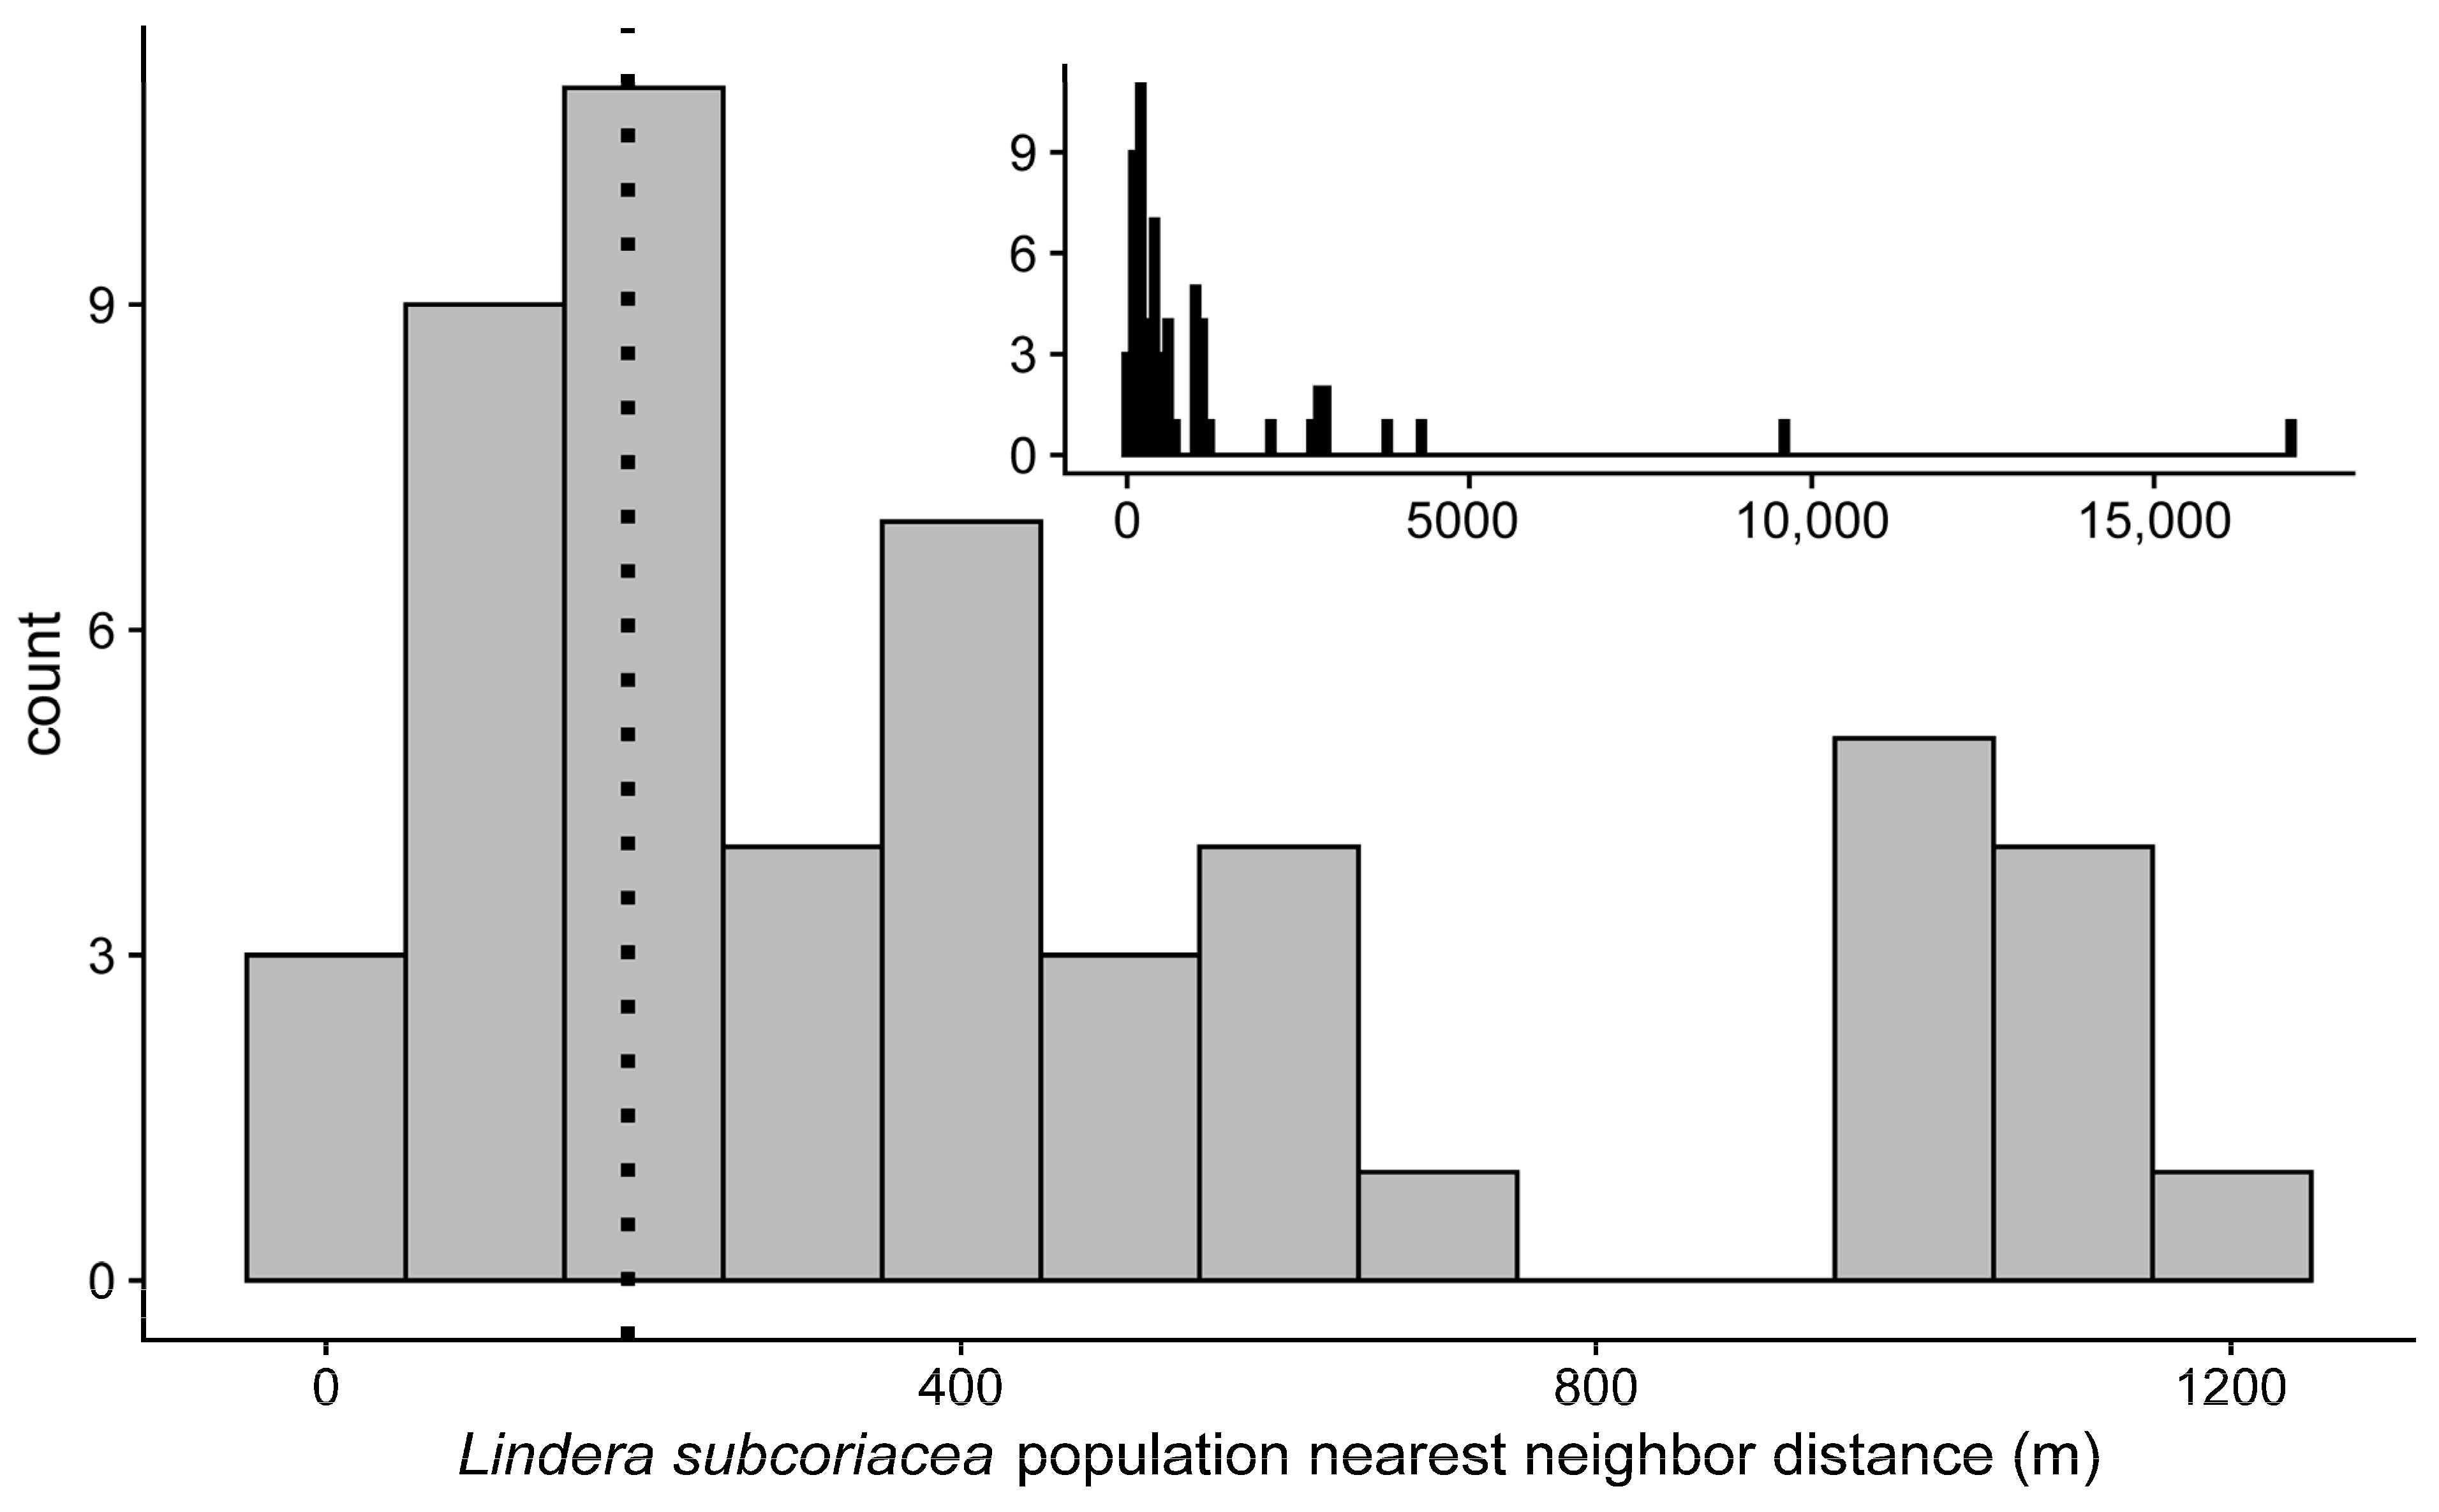
Eighteen of the 62 (29.0%) L. subcoriacea populations on Fort Liberty had a NND ≤ 190 m (Table S11, Figure 4), the distance within which 90% of dispersed seeds were deposited. Populations had a mean connectivity of 389.6 ± 118.6; individual values ranged from 0–5388.4. There also was a positive relationship between the number of individuals within populations and (log10 +1) population connectivity (y = 2.42 + 5.09x, adj. R2 = 0.21, p < 0.01; Table S11, Figure S2).
4. Discussion
We used simulation experiments to investigate how environmental heterogeneity (i.e., fruit availability, distance, and occupancy) and disperser movement, using landscape permeability- or straight path-based rules, affected the seed dispersal of L. subcoriacea, as characterized by the seed dispersal kernel and SDE. We conducted experiments with five generalist disperser species that likely interact with the heterogeneous environment differently (unpublished data). However, for this effort, we are not particularly interested in any given species’ effect on dispersal. Instead, our discussion emphasizes across-species results, as this aggregation is more relevant to our objective to compare environmental heterogeneity and disperser movement methods on the overall dispersal of L. subcoriacea. In general, we did not find differences between the landscape permeability and straight path movement experiments. This first comparison of these two movement methods suggests that use of the less computationally intensive straight path model may be a suitable and preferable methodology. However, we acknowledge that there may be cases where permeability-based movement may be more appropriate (see below). Our unique approach using species-specific occupancy models and avian parameters for dispersers also provided an opportunity to evaluate how their interactions affect seed dispersal. Indeed, we observed differences in SDED between species that were attributable to environmental heterogeneity, distinct from avian parameters (Table S10). Additionally, 29.0% of L. subcoriacea populations on Fort Liberty had a NND ≤ 190 m; 90% of seeds were dispersed within this distance. Our experiments have provided important insights about how aspects of seed dispersal might affect L. subcoriacea inter-population connectivity.
Importantly, for our case study, our simulation was different than many simulations with complete or near-complete in silico landscapes [22,30,66]. Our landscape and its features that determined disperser occupancy probability, which influenced disperser movement distance and travel route, were confined to reality (as abstracted to a 30 × 30 m cell for a static time point) in terms of L. subcoriacea location, seasonally-specific landscape fruit availability, features affecting occupancy, etc. Therefore, we did not find that it would be useful to evaluate a ‘full range’ of landscape values as the majority of the values included would not align with reasonably, ecologically expected conditions for our study site. Moreover, there are a number of seed dispersal simulations that do not include a full range of values in their analyses [20,24,32,92]. For some studies, including ours, this is because the study design inherently explored the varied effects of different parameters of interest. For example, our use of the five bird species, each with specific parameters, allowed us to examine the response of our dispersal metrics to the varied parameters (i.e., gut capacity, seed retention time, and flight speed; the state variables related to perching time, seed retention time, the number of fruits consumed, and the selection of next locations and background fruit loss were probabilistic, not static/single values). These parameters are pertinent to seed dispersal and provided an ecologically reasonable opportunity to evaluate how our model responded to key disperser variations.
We found SDE did not differ between movement methods within our five disperser species or when all species were considered together (Table 5; Figure 2). Our expectation that SDE would differ between experiments using landscape permeability- or straight path-based movement was not met. Instead, for our study system and parameters that varied between experiments, our findings suggest that using straight path movement can be as useful as using landscape permeability rules for describing seed dispersal from simulations. Moreover, since experiments utilizing straight path movement need fewer input data and are less computationally intensive, they could be the preferred method for simulating disperser movement. For plants dispersed by many disperser species, the preference for straight path experiments could be ever stronger for these same reasons. However, there may be scenarios when modelers might want to consider the use of permeability-based movement. For example, we anticipate permeability-based movement would be preferred when (1) there is marked spatial variation in the occupancy of a disperser (i.e., patchy habitat usage) and the size and isolation of habitat patches is coarse (i.e., large interpatch distances) relative to the movement distances of the disperser [93,94], or (2) when there is strong correlation between disperser occupancy and suitable habitat for recruitment.
Our experiments using T. migratorius parameters for all disperser species, but still using species-specific occupancy models, were conducted to evaluate the variation in seed dispersal, specifically SDE, due to environmental heterogeneity or avian parameters. Looking at species collectively, both SDE and SDEQ differed between experiments using distinct or T. migratorius physiological parameters (Table S9). These results could have been expected, as T. migratorius was the second largest species after C. cristata, and increasing the capacity to eat more fruit and fly at a faster speed for the remaining species should increase SDEQ and subsequently SDE values (Table S9; Figure 3). However, perhaps more interesting and important for modelling seed dispersal is that SDED did not differ between the experiments across species (Table S9). This finding aligns with our expectations and suggests that using species-based estimates of heterogeneous landscape utilization (occupancy) can affect the quality of seed dispersal.
Lindera subcoriacea seeds were not dispersed great distances in our experiments. For example, the scale of the dispersal kernel was less than 152 m across species and movement methods. Unlike the scale of the dispersal kernel, the shape did not differ among species; all shape values were less than one (Table 2); thus, the probability of seed dispersal decreases with distance [95]. Most consumed seeds (~84–98%) were not dispersed, and these proportions did not differ between movement methods (Table 6). This limited dispersal distance agrees with observational findings for other large-seeded drupes in the region [96]. We recognize that disperser movement among individual L. subcoriacea or other perches within a 30 × 30 m area is expected behavior, but such movements are at a finer resolution than our experiments. While capturing movement within cells may have increased the numbers of dispersed seeds, it seems unlikely that this would have resulted in different conclusions from our findings, which were focused on increasing our understanding of potential inter-population connectivity. For example, although we occasionally observe L. subcoriacea seedlings near maternal plants, we anticipate low SDED at short dispersal distances due to conspecific negative density/distance dependence (CNDD) effects on seedling recruitment, as has been documented for L. benzoin [97,98].
For rare species, especially those within dynamic, fragmented, or heterogeneous landscapes (as has been described for L. subcoriacea; [51]), LDD events have been recognized as important for inter-population processes, which affect gene flow, and population persistence and expansion [18,99,100]. If L. subcoriacea inter-population processes rely on long dispersal distances, then LDD events would be those of greater importance. There is not a standard definition for LDD, but it is generally characterized as an extremely far dispersal distance that occurs at an extremely low frequency [18,101,102]. Across our experiments only a small proportion (~0.02–0.16) of consumed seeds were dispersed and approximately 90% of dispersed seeds were deposited within 190 m of their starting location. While this result and the observed NND of populations suggest some demographic connectivity may exist among 29% of L. subcoriacea populations, LDD events are needed to facilitate inter-population processes for the majority of populations in our system. Although infrequent, with a mean percentage of only 1.6% of dispersed seeds, seeds dispersed during flight may enable LDD (Table 6). For example, considering all disperser species, the mean dispersal distance for seeds dispersed during flight was 1582.1 ± 130.0 m (n = 152) or 1626.8 ± 146.6 m (n = 95) for permeability or straight path experiments, respectively (Table 7). In contrast the mean dispersal distance for seeds deposited at perches was 179.0 ± 6.1 m (n = 11,789) or 194.6 ± 8.1 m (n = 11,303) for permeability or straight path experiments, respectively. Although in-flight distances were very similar between permeability and straight path experiments, we found that ~23% (35/152) were dispersed into suitable habitat from permeability and ~1% (1/95) from straight path experiments (Table 7), suggesting permeability experiments may provide an improved understanding of SDED. For example, quality of deposition may contribute to the observed positive relationship between population connectivity and number of individuals within L. subcoriacea populations.
The importance of dispersal for L. subcoriacea inter-population dynamics is expected to be magnified for several reasons related to the species sexual system, single-seed fruit, seed longevity, seed production, and seedling recruitment. As a dioecious species, L. subcoriacea is subject to both Baker’s law and the seed shadow handicap. Baker’s law states that self-incompatible species are less likely to establish a sexually reproducing colony after LDD than self-compatible species because only the latter can do so with a single individual [103,104,105,106]. Thus, (re)colonization, a key inter-population process, is expected to be negatively affected due to the lack of reproductive assurance in dioecious species. Although high fecundity, seed dormancy, high immigration (i.e., SDE), and perenniality can reduce population extinction rates and increase the proportion of occupied sites across a landscape [88,107], L. subcoriacea has low seed production, low seedling survivorship, and presumably no seed bank [108,109]. For example, L. subcoriacea has an average survival rate of 1% at one year post-dispersal [51]. This suggests that dispersal and/or perenniality may be largely responsible for maintaining L. subcoriacea occupancy across our study landscape. While rare and infrequent, over time LDD can provide important demographic and genetic connectivity among populations of long-lived plants [99,110,111]. Additionally, large avian species capable of consuming many L. subcoriacea fruits may deposit multiple seeds in the same location during an LDD event, increasing the likelihood that individuals of both sexes recruit into isolated locations [112,113]. For example, in our results, 85.7% of LDD events (dispersal > 190 m) resulted in the deposition of multiple seeds at the same location. However, variation in SRT for multiple seeds consumed during the same event would likely reduce the number of seeds anticipated to be dispersed to the same location, reducing the potential for reproductive assurance during these LDD events.
The seed shadow handicap, which describes the smaller seed shadow, higher spatial aggregation, and greater intra-specific competition anticipated for the offspring of dioecious species relative to self-compatible, cosexual species [106], is also affected by dispersal. A general expectation of having separate sexes is that females of dioecious species need to produce at least twice as many seeds as self-compatible individuals in order to compensate for males. However, all else being equal, these seeds will originate from half as many locations and be dispersed at twice the density to half the area than the seeds of self-compatible species. To compensate for the seed shadow handicap, dioecious species require greater dispersal ability and/or reduced CNDD effects [106,114]. However, if the mean dispersal distance is much greater than the spatial scale over which CNDD effects occur, the seed shadow handicap is expected to disappear [106]. Indeed, our estimated mean dispersal distance of 177 m is much greater than the 15–20 m maximum distance over which CNDD effects are typically expected to occur [115]. On the other hand, the majority (~84–98%) of seeds eaten in our simulations were deposited in the same cell in which they were eaten. Although no information about the magnitude of CNDD effects for L. subcoriacea are available, it is interesting that among 29 co-occurring woody species, the lowest CNDD effect (~0.55) on seedling recruitment was reported for the closely related dioecious L. benzoin [98].
5. Conclusions
There are still additional considerations to be addressed when modeling L. subcoriacea seed dispersal, including various intrinsic and extrinsic drivers, and use of allometrically estimated versus observed avian parameters. For example, Hohmann et al. [59] found that understory cover affected the magnitude of pre-dispersal seed predation and individual height affected L. subcoriacea SDEQ, but neither of these drivers were captured within our current model. The effects of vegetation management, such as prescribed fire, can also affect the availability of L. subcoriacea and other fleshy fruits in time and space [51,116] and influence L. subcoriacea SDEQ [59], but this variation was not included in our experiments. Finally, more nuanced, empirical information on dispersers (e.g., fruit-specific SRT, or perching times) could be incorporated into our model to potentially improve our understanding of L. subcoriacea seed dispersal [117,118].
Supplementary Materials
The following supporting information can be downloaded at: https://www.mdpi.com/article/10.3390/ecologies5020013/s1, Appendix S1: Model description (Overview, Design concepts, and Details [ODD] protocol); Table S1: Seasonal avian frugivores on Fort Liberty, NC; Table S2: Wilcoxon rank sum tests for Quasi-SDE and subcomponents; Table S3: Seed dispersal kernels for avian disperser species; Table S4: Mean number of seeds dispersed and mean relative percentage of total seeds dispersed; T. migratorius physiological parameters; Table S5: Mean proportion of seeds deposited in suitable L. subcoriacea habitat by movement method; Table S6: SDE by movement method; Table S7: Mean route and seed dispersal distances by movement method; Table S8: Mean percentage of foraged seeds not dispersed and seeds dispersed during flight by movement method; Table S9: Comparison of seed dispersal effectiveness subcomponents between experiments (across species) using distinct or T. migratorius physiological parameters by movement method; Table S10: Comparison of seed dispersal effectiveness subcomponents between experiments within species using distinct or T. migratorius physiological parameters by movement method; Table S11: Nearest neighbor distance and connectivity for the L. subcoriacea sub-element occurrences; Figure S1: Seed dispersal simulation conceptual diagram; Figure S2: Number of L. subcoriacea individuals within populations versus the connectivity of those populations.
Author Contributions
Conceptualization: M.G.J. and M.G.H.; Methodology: M.G.J. and M.G.H.; Formal analysis and investigation: M.G.J., M.G.H. and W.A.W.; Writing—original draft preparation: M.G.J. and M.G.H.; Writing—review and editing: M.G.J., M.G.H., W.A.W. and S.D.H.; Funding acquisition: S.D.H. All authors have read and agreed to the published version of the manuscript.
Funding
This research was funded by Fort Liberty and The APC was funded by ERDC CERL.
Data Availability Statement
Lindera subcoriacea population spatial location data (element occurrences) are a data product of the North Carolina Natural Heritage Program [90].
Acknowledgments
Fort Liberty and the U.S. Army provided financial support for this research. We thank the Endangered Species Branch at Fort Liberty for technical and logistical support. We also thank the anonymous reviewers who provided thoughtful comments.
Conflicts of Interest
The authors declare no conflicts of interest.
References
- Nathan, R.; Muller-Landau, H.C. Spatial Patterns of Seed Dispersal, Their Determinants and Consequences for Recruitment. Trends Ecol. Evol. 2000, 15, 278–285. [Google Scholar] [CrossRef] [PubMed]
- Levin, S.A.; Muller-Landau, H.C.; Nathan, R.; Chave, J. The Ecology and Evolution of Seed Dispersal: A Theoretical Perspective. Annu. Rev. Ecol. Evol. Syst. 2003, 34, 575–604. [Google Scholar] [CrossRef]
- Traveset, A.; Heleno, R.; Nogales, M. The Ecology of Seed Dispersal. In Seeds: The Ecology of Regeneration in Plant Communities; Gallagher, R., Ed.; CAB International: Wallingford, UK, 2014; pp. 62–93. ISBN 978 1 78064 183 6. [Google Scholar]
- Thomson, F.J.; Moles, A.T.; Auld, T.D.; Ramp, D.; Ren, S.; Kingsford, R.T. Chasing the Unknown: Predicting Seed Dispersal Mechanisms from Plant Traits. J. Ecol. 2010, 98, 1310–1318. [Google Scholar] [CrossRef]
- Carlo, T.A. Interspecific Neighbors Change Seed Dispersal Pattern of an Avian-Dispersed Plant. Ecology 2005, 86, 2440–2449. [Google Scholar] [CrossRef]
- Kleyheeg, E.; Fiedler, W.; Safi, K.; Waldenström, J.; Wikelski, M.; van Toor, M.L. A Comprehensive Model for the Quantitative Estimation of Seed Dispersal by Migratory Mallards. Front. Ecol. Evol. 2019, 7, 40. [Google Scholar] [CrossRef]
- Rey, P.J.; Alcántara, J.M. Recruitment Dynamics of a Fleshy-Fruited Plant (Olea europaea): Connecting Patterns of Seed Dispersal to Seedling Establishment. J. Ecol. 2000, 88, 622–633. [Google Scholar] [CrossRef]
- Saracco, J.F.; Collazo, J.A.; Groom, M.J.; Carlo, T.A. Crop Size and Fruit Neighborhood Effects on Bird Visitation to Fruiting Schefflera morototoni Trees in Puerto Rico. Biotropica 2005, 37, 81–87. [Google Scholar] [CrossRef]
- Falcón, W.; Moll, D.; Hansen, D.M. Frugivory and Seed Dispersal by Chelonians: A Review and Synthesis. Biol. Rev. 2020, 95, 142–166. [Google Scholar] [CrossRef] [PubMed]
- Morales, J.M.; Morán López, T. Mechanistic Models of Seed Dispersal by Animals. Oikos 2022, 2022, e08328. [Google Scholar] [CrossRef]
- Carlo, T.A.; Morales, J.M. Generalist Birds Promote Tropical Forest Regeneration and Increase Plant Diversity via Rare-Biased Seed Dispersal. Ecology 2016, 97, 1819–1831. [Google Scholar] [CrossRef]
- Levey, D.J.; Silva, W.R.; Galetti, M. (Eds.) Seed Dispersal and Frugivory: Ecology, Evolution and Conservation; CABI Publishing: New York, NY, USA, 2002; ISBN 0-85199-525-X. [Google Scholar]
- Bullock, J.M.; Mallada González, L.; Tamme, R.; Götzenberger, L.; White, S.M.; Pärtel, M.; Hooftman, D.A.P. A Synthesis of Empirical Plant Dispersal Kernels. J. Ecol. 2017, 105, 6–19. [Google Scholar] [CrossRef]
- Law, R.; Murrell, D.J.; Dieckmann, U. Population Growth in Space and Time: Spatial Logistic Equations. Ecology 2003, 84, 252–262. [Google Scholar] [CrossRef]
- Bustamante, R.O.; Canals, M. Dispersal Quality in Plants: How to Measure Efficiency and Effectiveness of a Seed Disperser. Oikos 1995, 73, 133. [Google Scholar] [CrossRef]
- Schupp, E.W.; Jordano, P.; Gómez, J.M. Seed Dispersal Effectiveness Revisited: A Conceptual Review. New Phytol. 2010, 188, 333–353. [Google Scholar] [CrossRef] [PubMed]
- Schupp, E.W. Quantity, Quality and the Effectiveness of Seed Dispersal by Animals. In Frugivory and Seed Dispersal: Ecological and Evolutionary Aspects. Vegetatio 1993, 107/108, 15–29. [Google Scholar] [CrossRef]
- Jordano, P. What Is Long-Distance Dispersal? And a Taxonomy of Dispersal Events. J. Ecol. 2017, 105, 75–84. [Google Scholar] [CrossRef]
- Bohrer, G.; Nathan, R.; Volis, S. Effects of Long-Distance Dispersal for Metapopulation Survival and Genetic Structure at Ecological Time and Spatial Scales. J. Ecol. 2005, 93, 1029–1040. [Google Scholar] [CrossRef]
- Morán-López, T.; Carlo, T.A.; Morales, J.M. The Role of Frugivory in Plant Diversity Maintenance—A Simulation Approach. Ecography 2018, 41, 24–31. [Google Scholar] [CrossRef]
- Carlo, T.A.; Morales, J.M. Inequalities in Fruit-Removal and Seed Dispersal: Consequences of Bird Behaviour, Neighbourhood Density and Landscape Aggregation. J. Ecol. 2008, 96, 609–618. [Google Scholar] [CrossRef]
- Pegman, A.P.M.; Perry, G.L.W.; Clout, M.N. Exploring the Interaction of Avian Frugivory and Plant Spatial Heterogeneity and Its Effect on Seed Dispersal Kernels Using a Simulation Model. Ecography 2017, 40, 1098–1109. [Google Scholar] [CrossRef]
- Skeate, S.T. Interactions between Birds and Fruits in a Northern Florida Hammock Community. Ecology 1987, 68, 297–309. [Google Scholar] [CrossRef]
- Morales, J.M.; García, D.; Martínez, D.; Rodriguez-Pérez, J.; Herrera, J.M. Frugivore Behavioural Details Matter for Seed Dispersal: A Multi-Species Model for Cantabrian Thrushes and Trees. PLoS ONE 2013, 8, e65216. [Google Scholar] [CrossRef] [PubMed]
- Godínez-Alvarez, H.; Ríos-Casanova, L.; Peco, B. Are Large Frugivorous Birds Better Seed Dispersers than Medium- and Small-Sized Ones? Effect of Body Mass on Seed Dispersal Effectiveness. Ecol. Evol. 2020, 10, 6136–6143. [Google Scholar] [CrossRef] [PubMed]
- Breitbach, N.; Böhning-Gaese, K.; Laube, I.; Schleuning, M. Short Seed-Dispersal Distances and Low Seedling Recruitment in Farmland Populations of Bird-Dispersed Cherry Trees. J. Ecol. 2012, 100, 1349–1358. [Google Scholar] [CrossRef]
- González-Castro, A.; Calviño-Cancela, M.; Nogales, M. Comparing Seed Dispersal Effectiveness by Frugivores at the Community Level. Ecology 2015, 96, 808–818. [Google Scholar] [CrossRef] [PubMed]
- Côrtes, M.C.; Uriarte, M. Integrating Frugivory and Animal Movement: A Review of the Evidence and Implications for Scaling Seed Dispersal. Biol. Rev. 2013, 88, 255–272. [Google Scholar] [CrossRef] [PubMed]
- Nield, A.P.; Nathan, R.; Enright, N.J.; Ladd, P.G.; Perry, G.L.W. The Spatial Complexity of Seed Movement: Animal-Generated Seed Dispersal Patterns in Fragmented Landscapes Revealed by Animal Movement Models. J. Ecol. 2020, 108, 687–701. [Google Scholar] [CrossRef]
- Will, H.; Tackenberg, O. A Mechanistic Simulation Model of Seed Dispersal by Animals. J. Ecol. 2008, 96, 1011–1022. [Google Scholar] [CrossRef]
- Abraham, A.J.; Prys-Jones, T.O.; De Cuyper, A.; Ridenour, C.; Hempson, G.P.; Hocking, T.; Clauss, M.; Doughty, C.E. Improved Estimation of Gut Passage Time Considerably Affects Trait-Based Dispersal Models. Funct. Ecol. 2020, 35, 860–869. [Google Scholar] [CrossRef]
- Jones, L.R.; Duke-Sylvester, S.M.; Leberg, P.L.; Johnson, D.M. Closing the Gaps for Animal Seed Dispersal: Separating the Effects of Habitat Loss on Dispersal Distances and Seed Aggregation. Ecol. Evol. 2017, 7, 5410–5425. [Google Scholar] [CrossRef]
- Cousens, R.D.; Hill, J.; French, K.; Bishop, I.D. Towards Better Prediction of Seed Dispersal by Animals. Funct. Ecol. 2010, 24, 1163–1170. [Google Scholar] [CrossRef]
- Fedriani, J.M.; Wiegand, T.; Ayllón, D.; Palomares, F.; Suárez-Esteban, A.; Grimm, V. Assisting Seed Dispersers to Restore Oldfields: An Individual-Based Model of the Interactions among Badgers, Foxes and Iberian Pear Trees. J. Appl. Ecol. 2018, 55, 600–611. [Google Scholar] [CrossRef]
- Wotton, D.M.; Kelly, D. Do Larger Frugivores Move Seeds Further? Body Size, Seed Dispersal Distance, and a Case Study of a Large, Sedentary Pigeon. J. Biogeogr. 2012, 39, 1973–1983. [Google Scholar] [CrossRef]
- Westcott, D.A.; Graham, D.L. Patterns of Movement and Seed Dispersal of a Tropical Frugivore. Oecologia 2000, 122, 249–257. [Google Scholar] [CrossRef] [PubMed]
- Wenny, D.G. Advantages of Seed Dispersal: A Re-Evaluation of Directed Dispersal. Evol. Ecol. Res. 2001, 3, 51–74. [Google Scholar]
- Nams, V.O. Using Animal Movement Paths to Measure Response to Spatial Scale. Oecologia 2005, 143, 179–188. [Google Scholar] [CrossRef] [PubMed]
- Thierry, H.; Rose, E.; Rogers, H. Landscape Configuration and Frugivore Identity Affect Seed Rain during Restoration. Oikos 2022, 2022, e08323. [Google Scholar] [CrossRef]
- Fedriani, J.M.; Ayllón, D.; Wiegand, T.; Grimm, V. Intertwined Effects of Defaunation, Increased Tree Mortality and Density Compensation on Seed Dispersal. Ecography 2020, 43, 1352–1363. [Google Scholar] [CrossRef]
- Joseph, M.B.; Preston, D.L.; Johnson, P.T.J. Integrating Occupancy Models and Structural Equation Models to Understand Species Occurrence. Ecology 2016, 97, 765–775. [Google Scholar] [CrossRef]
- MacKenzie, D.I.; Nichols, J.; Royle, J.; Pollock, K.; Bailey, L.; Hines, J. Occupancy Estimation and Modeling: Inferring Patterns and Dynamics of Species Occurrence; Elsevier: New York, NY, USA, 2006. [Google Scholar]
- Gould, M.J.; Gould, W.R.; Cain, J.W.; Roemer, G.W. Validating the Performance of Occupancy Models for Estimating Habitat Use and Predicting the Distribution of Highly-Mobile Species: A Case Study Using the American Black Bear. Biol. Conserv. 2019, 234, 28–36. [Google Scholar] [CrossRef]
- Meyer, N.F.V.; Moreno, R.; Reyna-Hurtado, R.; Signer, J.; Balkenhol, N. Towards the Restoration of the Mesoamerican Biological Corridor for Large Mammals in Panama: Comparing Multi-Species Occupancy to Movement Models. Mov. Ecol. 2020, 8, 3. [Google Scholar] [CrossRef]
- Zeller, K.A.; McGarigal, K.; Whiteley, A.R. Estimating Landscape Resistance to Movement: A Review. Landsc. Ecol. 2012, 27, 777–797. [Google Scholar] [CrossRef]
- Evans, B.S.; Kilpatrick, A.M.; Hurlbert, A.H.; Marra, P.P. Dispersal in the Urban Matrix: Assessing the Influence of Landscape Permeability on the Settlement Patterns of Breeding Songbirds. Front. Ecol. Evol. 2017, 5, 63. [Google Scholar] [CrossRef]
- Vasudev, D.; Goswami, V.R.; Oli, M.K. Detecting Dispersal: A Spatial Dynamic Occupancy Model to Reliably Quantify Connectivity across Heterogeneous Conservation Landscapes. Biol. Conserv. 2021, 253, 108874. [Google Scholar] [CrossRef]
- Betts, M.G.; Rodenhouse, N.L.; Scott Sillett, T.; Doran, P.J.; Holmes, R.T. Dynamic Occupancy Models Reveal Within-Breeding Season Movement up a Habitat Quality Gradient by a Migratory Songbird. Ecography 2008, 31, 592–600. [Google Scholar] [CrossRef]
- Schupp, E.W.; Zwolak, R.; Jones, L.R.; Snell, R.S.; Beckman, N.G.; Aslan, C.; Cavazos, B.R.; Effiom, E.; Fricke, E.C.; Montaño-Centellas, F.; et al. Intrinsic and Extrinsic Drivers of Intraspecific Variation in Seed Dispersal Are Diverse and Pervasive. AoB PLANTS 2019, 11, plz067. [Google Scholar] [CrossRef]
- Wall, W.A.; Hohmann, M.G.; Walker, A.S.; Gray, J.B. Sex Ratios and Population Persistence in the Rare Shrub Lindera subcoriacea Wofford. Plant Ecol. 2013, 214, 1105–1114. [Google Scholar] [CrossRef]
- Wall, W.A.; Walker, A.S.; Gray, J.B.; Hohmann, M.G. Fire Effects on the Vital Rates and Stochastic Population Growth Rate of the Rare Shrub Lindera subcoriacea Wofford. Plant Ecol. 2021, 222, 119–131. [Google Scholar] [CrossRef]
- Herrera, J.M.; Morales, J.M.; García, D. Differential Effects of Fruit Availability and Habitat Cover for Frugivore-Mediated Seed Dispersal in a Heterogeneous Landscape. J. Ecol. 2011, 99, 1100–1107. [Google Scholar] [CrossRef]
- Bhakti, T.; Pena, J.C.; Niebuhr, B.B.; Sampaio, J.; Goulart, F.F.; de Azevedo, C.S.; Ribeiro, M.C.; Antonini, Y. Combining Land Cover, Animal Behavior, and Master Plan Regulations to Assess Landscape Permeability for Birds. Landsc. Urban Plan. 2021, 214, 104171. [Google Scholar] [CrossRef]
- Treep, J.; de Jager, M.; Bartumeus, F.; Soons, M.B. Seed Dispersal as a Search Strategy: Dynamic and Fragmented Landscapes Select for Multi-Scale Movement Strategies in Plants. Mov. Ecol. 2021, 9, 4. [Google Scholar] [CrossRef]
- Hanski, I. Habitat Connectivity, Habitat Continuity, and Metapopulations in Dynamic Landscapes. Oikos 1999, 87, 209. [Google Scholar] [CrossRef]
- Griffith, G.; Omernik, J.; Comstock, J.; Schafale, M.; NcNab, W.; Lenat, D.; MacPherson, T.; Glover, J.; Shelburne, V. Ecoregions of North Carolina and South Carolina (U.S. Geological Survey Map); U.S. Geological Survey: Reston, VA, USA, 2002. [Google Scholar]
- Sorrie, B.A.; Gray, J.B.; Crutchfield, P.J. The Vascular Flora of the Longleaf Pine Ecosystem of Fort Bragg and Weymouth Woods, North Carolina. Castanea 2006, 71, 129–161. [Google Scholar] [CrossRef]
- Just, M.G.; Hohmann, M.G.; Hoffmann, W.A. Where Fire Stops: Vegetation Structure and Microclimate Influence Fire Spread along an Ecotonal Gradient. Plant Ecol. 2016, 217, 631–644. [Google Scholar] [CrossRef]
- Hohmann, M.G.; Wall, W.A.; Just, M.G.; Huskins, S.D. Multiple Intrinsic and Extrinsic Drivers Influence the Quantity and Quality Components of Seed Dispersal Effectiveness in the Rare Shrub Lindera subcoriacea. PLoS ONE 2023, 18, e0283810. [Google Scholar] [CrossRef]
- Wall, W.; Just, M.; Huskins, S.; Hohmann, M. Enhancing Rare Plant Population Predictions through Demographic Modeling of Seed Predation, Dispersal, and Habitat Suitability. Plant Ecol. 2023, 225, 63–74. [Google Scholar] [CrossRef]
- NatureServe Lindera subcoriacea. NatureServe Network Biodiversity Location Data Accessed through NatureServe Explorer [Web Application]. NatureServe, Arlington, Virginia. Available online: https://explorer.natureserve.org/Taxon/ELEMENT_GLOBAL.2.133279/Lindera_subcoriacea (accessed on 7 February 2021).
- U.S. Fish and Wildlife Service Endangered and Threatened Wildlife and Plants. Partial 90-Day Finding on a Petition to List 404 Species in the Southeastern United States as Endangered or Threatened with Critical Habitat (FWS–R4–ES–2011–0049). Fed. Regist. 2011, 76, 59836–59862. [Google Scholar]
- Albert, S.; Kaschube, D.R.; Taylor, R. The 2016 Annual Report of the Monitoring Avian Productivity and Survivorship (MAPS) Program on Fort Bragg, North Carolina; The Institute for Bird Populations: Point Reyes Station, CA, USA, 2017; p. 22. [Google Scholar]
- Wall, W.; Hohmann, M.; Wilcox, M. Canopy Cover and Understory Heterogeneity Effects on Post-Breeding Avian Occupancy and Species Richness in a Longleaf Pine Ecosystem under Active Fire Management; ERDC-CERL: Champaign, IL, USA, 2024; To be submitted. [Google Scholar]
- Garcia, D.; Zamora, R.; Amico, G.C. Birds as Suppliers of Seed Dispersal in Temperate Ecosystems: Conservation Guidelines from Real-World Landscapes. Conserv. Biol. 2010, 24, 1070–1079. [Google Scholar] [CrossRef]
- Morales, J.M.; Carlo, T.A. The Effects of Plant Distribution and Frugivore Density on the Scale and Shape of Dispersal Kernels. Ecology 2006, 87, 1489–1496. [Google Scholar] [CrossRef]
- R Foundation for Statistical Computing. R Core Team R (4.1.0): A Language and Environment for Statistical Computing; R Foundation for Statistical Computing: Vienna, Austria, 2021. [Google Scholar]
- Bauduin, S.; McIntire, E.J.B.; Chubaty, A.M. NetLogoR: A Package to Build and Run Spatially Explicit Agent-Based Models in R. Ecography 2019, 42, 1841–1849. [Google Scholar] [CrossRef]
- Grimm, V.; Berger, U.; Bastiansen, F.; Eliassen, S.; Ginot, V.; Giske, J.; Goss-Custard, J.; Grand, T.; Heinz, S.K.; Huse, G.; et al. A Standard Protocol for Describing Individual-Based and Agent-Based Models. Ecol. Model. 2006, 198, 115–126. [Google Scholar] [CrossRef]
- Grimm, V.; Berger, U.; DeAngelis, D.L.; Polhill, J.G.; Giske, J.; Railsback, S.F. The ODD Protocol: A Review and First Update. Ecol. Model. 2010, 221, 2760–2768. [Google Scholar] [CrossRef]
- Smith, A.D.; McWilliams, S.R. Fruit Removal Rate Depends on Neighborhood Fruit Density, Frugivore Abundance, and Spatial Context. Oecologia 2014, 174, 931–942. [Google Scholar] [CrossRef]
- Robbins, C.S.S. Effect of Time of Day on Bird Activity. Stud. Avian Biol. 1981, 6, 275–286. [Google Scholar]
- Allen, J.C.; Krieger, S.M.; Walters, J.R.; Collazo, J.A. Associations of Breeding Birds with Fire-Influenced and Riparian-Upland Gradients in a Longleaf Pine Ecosystem. Auk 2006, 123, 1110–1128. [Google Scholar] [CrossRef]
- Alerstam, T.; Rosén, M.; Bäckman, J.; Ericson, P.G.P.; Hellgren, O. Flight Speeds among Bird Species: Allometric and Phylogenetic Effects. PLoS Biol. 2007, 5, 1656–1662. [Google Scholar] [CrossRef]
- Hampe, A. Fruit Tracking, Frugivore Satiation, and Their Consequences for Seed Dispersal. Oecologia 2008, 156, 137–145. [Google Scholar] [CrossRef]
- Krebs, C.J. Some Historical Thoughts on the Functional Responses of Predators to Prey Density. Front. Ecol. Evol. 2022, 10, 1052289. [Google Scholar] [CrossRef]
- Real, L.A. Ecological Determinants of Functional Response. Ecology 1979, 60, 481–485. [Google Scholar] [CrossRef]
- Yoshikawa, T.; Kawakami, K.; Masaki, T. Allometric Scaling of Seed Retention Time in Seed Dispersers and Its Application to Estimation of Seed Dispersal Potentials of Theropod Dinosaurs. Oikos 2019, 128, 836–844. [Google Scholar] [CrossRef]
- Dunning, J., Jr. CRC Handbook of Avian Body Masses; CRC Press: Boca Raton, FL, USA, 2008; ISBN 978-1-4200-6444-5. [Google Scholar]
- Holling, C.S. Cross-Scale Morphology, Geometry, and Dynamics of Ecosystems. Ecol. Monogr. 1992, 62, 447–502. [Google Scholar] [CrossRef]
- Thibault, K.M.; White, E.P.; Hurlbert, A.H.; Ernest, S.K.M. Multimodality in the Individual Size Distributions of Bird Communities. Glob. Ecol. Biogeogr. 2011, 20, 145–153. [Google Scholar] [CrossRef]
- Hohmann, M.G.; Wall, W.A. A Species Distribution Modeling Informed Conservation Assessment of Bog Spicebush. ERDC/CERL TR-16-21; U.S. Army Engineer Research and Development Center: Champaign, IL, USA, 2016. [Google Scholar]
- Merow, C.; Smith, M.J.; Silander, J.A. A Practical Guide to MaxEnt for Modeling Species’ Distributions: What It Does, and Why Inputs and Settings Matter. Ecography 2013, 36, 1058–1069. [Google Scholar] [CrossRef]
- Venables, W.N.; Ripley, B.D. Modern Applied Statistics with S; Springer: New York, NY, USA, 2013; ISBN 978-0-387-95457-8. [Google Scholar]
- Austerlitz, F.; Dick, C.W.; Dutech, C.; Klein, E.K.; Oddou-Muratorio, S.; Smouse, P.E.; Sork, V.L. Using Genetic Markers to Estimate the Pollen Dispersal Curve. Mol. Ecol. 2004, 13, 937–954. [Google Scholar] [CrossRef] [PubMed]
- Nathan, R.; Klein, E.K.; Robledo-Arnuncio, J.; Revilla, E. Dispersal Kernels: Review. In Dispersal Ecology and Evolution; Bullock, J., Clobert, J., Baguette, M., Benton, T., Eds.; Oxford University Press: Oxford, UK, 2012. [Google Scholar]
- Gilbert, P.; Varadhan, R. The numDeriv Package, R Package Version 2016.8-1.1 2019; Available online: https://cran.r-project.org/web/packages/numDeriv/index.html (accessed on 5 April 2024).
- Pannell, J.R.; Barrett, S.C.H. Baker’s Law Revisited: Reproductive Assurance in a Metapopulation. Evolution 1998, 52, 657–668. [Google Scholar] [CrossRef] [PubMed]
- NatureServe Element Occurrence. Available online: https://help.natureserve.org/biotics/content/record_management/Element_Occurrence/EO_Element_Occurrence.htm (accessed on 26 May 2022).
- North Carolina Natural Heritage Program. Natural Heritage Data Explorer [Web Application]; Lindera subcoriacea; NCDNCR: Raleigh, NC, USA, 2022; Available online: www.ncnhp.org (accessed on 4 April 2022).
- Strimas-Mackey, M.; Brodie, J. Metacapa: Metapopulation Capacity-Based Conservation Prioritization; R Package Version 0.1.0; 2018. Available online: https://strimas.com/metacapa/ (accessed on 5 April 2024).
- Russo, S.E.; Portnoy, S.; Augspurger, C.K. Incorporating Animal Behavior into Seed Dispersal Models: Implications for Seed Shadows. Ecology 2006, 87, 3160–3174. [Google Scholar] [CrossRef] [PubMed]
- King, A.W.; With, K.A. Dispersal Success on Fractal Landscapes: A Consequence of Lacunarity Thresholds. Landsc. Ecol. 1999, 14, 73–82. [Google Scholar]
- Skelsey, P.; With, K.A.; Garrett, K.A. Why Dispersal Should Be Maximized at Intermediate Scales of Heterogeneity. Theor. Ecol. 2013, 6, 203–211. [Google Scholar] [CrossRef] [PubMed]
- Pinder, J.E.; Wiener, J.G.; Smith, M.H. The Weibull Distribution: A New Method of Summarizing Survivorship Data. Ecology 1978, 59, 175–179. [Google Scholar] [CrossRef]
- Clark, J.S.; Macklin, E.; Wood, L. Stages and Spatial Scales of Recruitment Limitation in Southern Appalachian Forests. Ecol. Monogr. 1998, 68, 213–235. [Google Scholar] [CrossRef]
- Cook-Patton, S.C.; LaForgia, M.; Parker, J.D. Positive Interactions between Herbivores and Plant Diversity Shape Forest Regeneration. Proc. R. Soc. B Biol. Sci. 2014, 281, 20140261. [Google Scholar] [CrossRef]
- Lamanna, J.A.; Walton, M.L.; Turner, B.L.; Myers, J.A. Negative Density Dependence Is Stronger in Resource-Rich Environments and Diversifies Communities When Stronger for Common but Not Rare Species. Ecol. Lett. 2016, 19, 657–667. [Google Scholar] [CrossRef]
- Trakhtenbrot, A.; Nathan, R.; Perry, G.; Richardson, D.M. The Importance of Long-Distance Dispersal in Biodiversity Conservation. Divers. Distrib. 2005, 11, 173–181. [Google Scholar] [CrossRef]
- Zhu, J.; Hrušková, K.; Pánková, H.; Münzbergová, Z. Quantifying Patch-Specific Seed Dispersal and Local Population Dynamics to Estimate Population Spread of an Endangered Plant Species. Ecol. Evol. 2021, 11, 14070–14078. [Google Scholar] [CrossRef]
- Schurr, F.M.; Spiegel, O.; Steinitz, O.; Trakhtenbrot, A.; Tsoar, A.; Nathan, R. Long-Distance Seed Dispersal. Annu. Plant Rev. 2009, 38, 204–237. [Google Scholar] [CrossRef]
- Nathan, R.; Schurr, F.M.; Spiegel, O.; Steinitz, O.; Trakhtenbrot, A.; Tsoar, A. Mechanisms of Long-Distance Seed Dispersal. Trends Ecol. Evol. 2008, 23, 638–647. [Google Scholar] [CrossRef]
- Baker, H.G. Self-Compatibility and Establishment After “Long-Distance” Dispersal. Evolution 1955, 9, 347. [Google Scholar] [CrossRef]
- Baker, H.G. Support for Baker’s Law-As a Rule. Evolution 1967, 21, 853. [Google Scholar] [CrossRef]
- Stebbins, G.L. Self Fertilization and Population Variability in the Higher Plants. Am. Nat. 1957, 91, 337–354. [Google Scholar] [CrossRef]
- Heilbuth, J.C.; Ilves, K.L.; Otto, S.P. The Consequences of Dioecy for Seed Dispersal: Modeling the Seed-Shadow Handicap. Evolution 2001, 55, 880–888. [Google Scholar] [CrossRef] [PubMed]
- Vamosi, J.C.; Zhang, Y.; Wilson, W.G. Animal Dispersal Dynamics Promoting Dioecy over Hermaphroditism. Am. Nat. 2007, 170, 485–491. [Google Scholar] [CrossRef] [PubMed]
- Hawkins, T.S.; Walck, J.L.; Hidayati, S.N. Seed Ecology of Lindera melissifolia (Lauraceae) as It Relates to Rarity of the Species. J. Torrey Bot. Soc. 2011, 138, 298–307. [Google Scholar] [CrossRef]
- Cipollini, M.L.; Whigham, D.; O’Neill, J. Seed Size, Sexual Dimorphism, and Sex Ratio in Lindera benzoin L. (Lauraceae). J. Torrey Bot. Soc. 2013, 140, 300–312. [Google Scholar] [CrossRef]
- Di Musciano, M.; Di Cecco, V.; Bartolucci, F.; Conti, F.; Frattaroli, A.R.; Di Martino, L. Dispersal Ability of Threatened Species Affects Future Distributions. Plant Ecol. 2020, 221, 265–281. [Google Scholar] [CrossRef]
- Cain, M.L.; Milligan, B.G.; Strand, A.E. Long-Distance Seed Dispersal in Plant Populations. Am. J. Bot. 2000, 87, 1217–1227. [Google Scholar] [CrossRef]
- White, D.; Stiles, E. Fruit Harvesting by American Robins: Influence of Fruit Size. Wilson Bull. 1991, 103, 690–692. [Google Scholar]
- Stiles, E.W.; White, D.W. Seed Deposition Patterns: Influence of Season, Nutrients, and Vegetation Structure. In Frugivores and Seed Dispersal; Estrada, A., Fleming, T.H., Eds.; Springer: Dordrecht, The Netherlands, 1986; pp. 45–54. ISBN 978-94-009-4812-9. [Google Scholar]
- Barot, S.; Gignoux, J. How Do Sessile Dioecious Species Cope with Their Males? Theor. Popul. Biol. 2004, 66, 163–173. [Google Scholar] [CrossRef] [PubMed]
- Johnson, D.J.; Bourg, N.A.; Howe, R.; Mcshea, W.J.; Johnson, D.J.; Bourg, N.A.; Howe, R.; Mcshea, W.J.; Wolf, A.; Clay, K. Conspecific Negative Density-Dependent Mortality and the Structure of Temperate Forests. Ecology 2017, 95, 2493–2503. [Google Scholar] [CrossRef]
- Lashley, M.; Chitwood, M.; Harper, C.; DePerno, C.; Moorman, C. Variability in Fire Prescriptions to Promote Wildlife Foods in the Longleaf Pine Ecosystem. Fire Ecol. 2015, 11, 62–79. [Google Scholar] [CrossRef]
- Nelson, A.S.; Whitehead, S.R. Fruit Secondary Metabolites Shape Seed Dispersal Effectiveness. Trends Ecol. Evol. 2021, 36, 1113–1123. [Google Scholar] [CrossRef]
- Kleyheeg, E.; van Leeuwen, C.H.A.; Morison, M.A.; Nolet, B.A.; Soons, M.B. Bird-Mediated Seed Dispersal: Reduced Digestive Efficiency in Active Birds Modulates the Dispersal Capacity of Plant Seeds. Oikos 2015, 124, 899–907. [Google Scholar] [CrossRef]
Figure 1.
Seed dispersal density probability plots (seed dispersal kernels) using a Weibull distribution with parameters estimated from experiments using (A) landscape permeability or (B) straight path movement rules. Different colored lines represent different avian disperser species.
Figure 1.
Seed dispersal density probability plots (seed dispersal kernels) using a Weibull distribution with parameters estimated from experiments using (A) landscape permeability or (B) straight path movement rules. Different colored lines represent different avian disperser species.

Figure 2.
Seed dispersal effectiveness (SDE). Each point represents the mean SDE value for a given disperser species (color) by movement type (shape); 30 experiments per species per movement method. SDE is estimated as the product of SDEQ (mean number of seeds dispersed) and SDED (mean proportion of seeds deposited in suitable locations). The grey lines and values are isoclines for the 5th, 25th, 50th, 75th, and 95th percentiles of SDE as averaged across all experiments.

Figure 3.
Seed dispersal effectiveness (SDE). Each point represents the mean SDE value for a given disperser species (color) by movement method experiment using distinct or T. migratorius physiological parameters (shape). Panel (A) displays landscape permeability and Panel (B) straight path experiments. SDE is estimated as the product of SDED and SDEQ. The grey lines and values are isoclines for the 5th, 25th, 50th, 75th, and 95th percentiles of SDE as averaged across all experiments for the given movement method; 30 experiments per species per movement method per physiological parameter set.
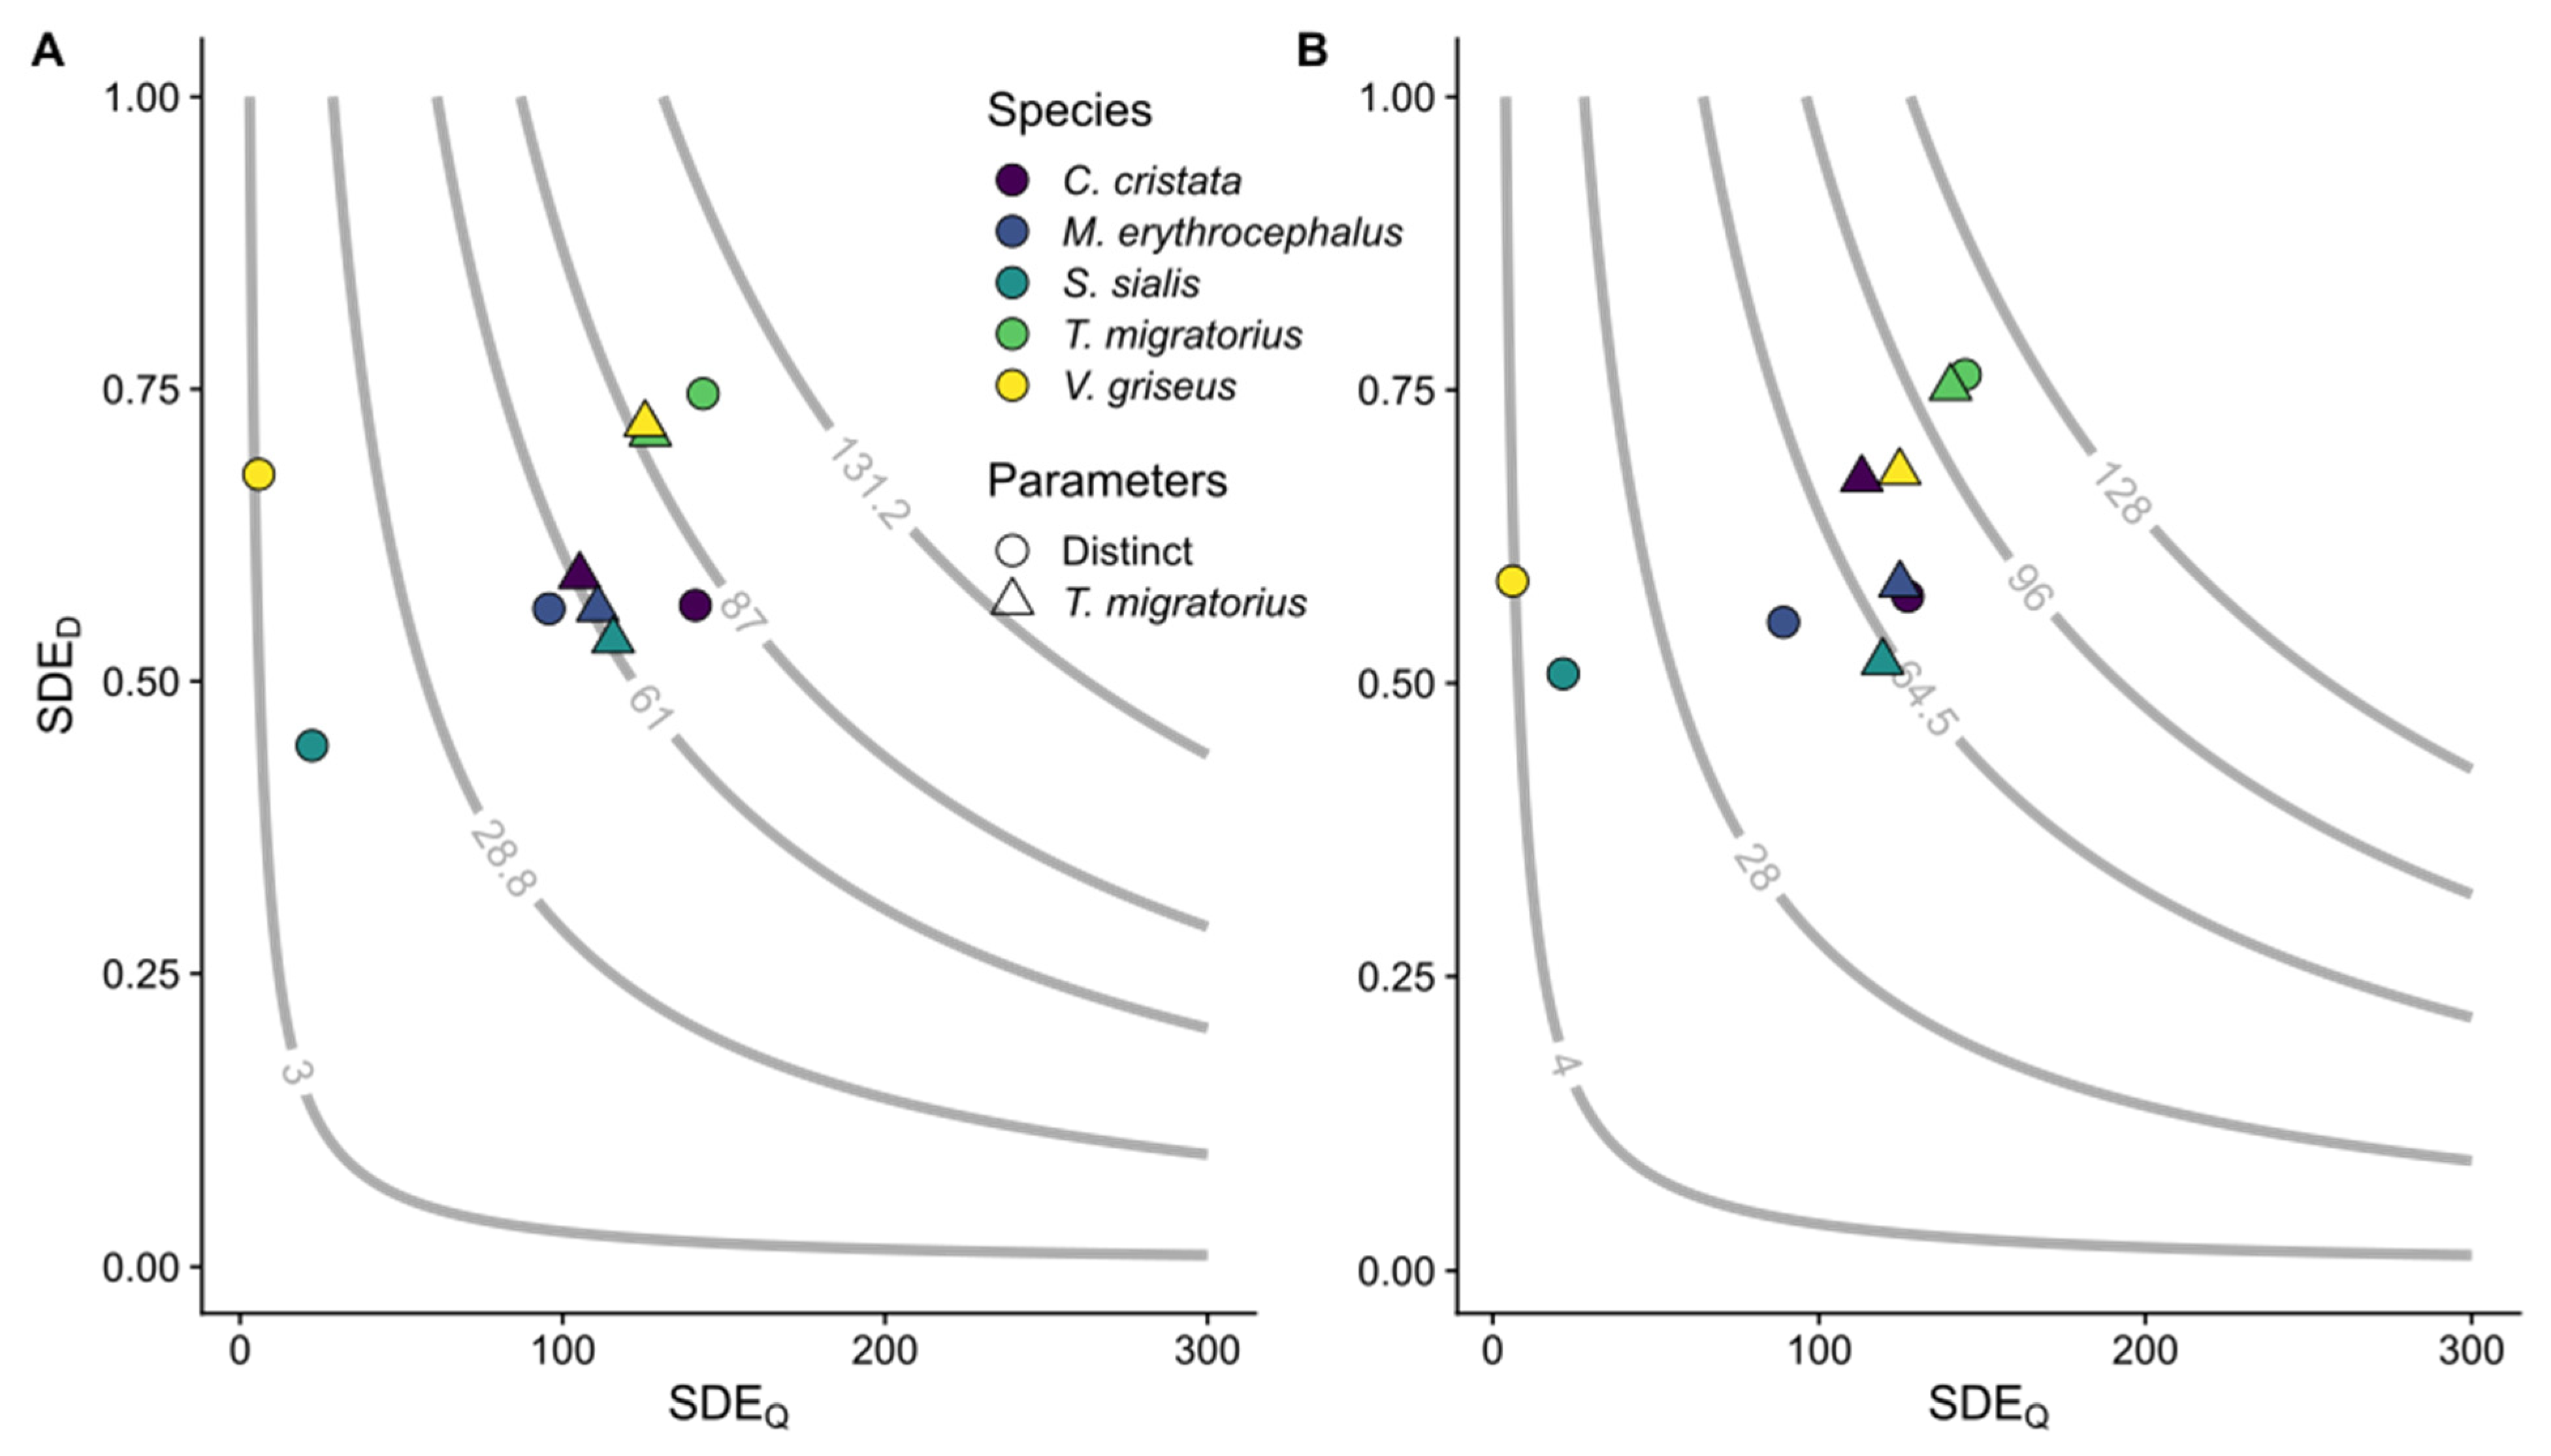
Figure 4.
Histogram of the nearest neighbor distance for L. subcoriacea populations ≤2 km (n = 52). Ninety percent of dispersed seeds were deposited at a distance ≤190 m (vertical dotted line). Inset histogram also includes populations with nearest neighbor distances ≥2 km (n = 62).
Figure 4.
Histogram of the nearest neighbor distance for L. subcoriacea populations ≤2 km (n = 52). Ninety percent of dispersed seeds were deposited at a distance ≤190 m (vertical dotted line). Inset histogram also includes populations with nearest neighbor distances ≥2 km (n = 62).

Table 1.
Parameters for the five avian disperser species used in our experiments. Maximum fruit is the maximum number of L. subcoriacea fruits an individual could consume during a foraging event. Gut capacity is the number of L. subcoriacea fruits a bird can digestively process at a given time. Flight speed (meters/minute). Mean seed retention time (SRT) and standard deviation (minutes).
| Species | Body Mass (g) | Maximum Fruit | Gut Capacity | SRT (SD) (min) | Flight Speed (m/min) |
|---|---|---|---|---|---|
| C. cristata | 88.0 | 10 | 15 | 35.8 (17.92) | 695.6 |
| M. erythrocephalus | 69.5 | 8 | 12 | 28.51 (14.27) | 674.5 |
| S. sialis | 27.5 | 4 | 6 | 11.96 (5.99) | 597.9 |
| T. migratorius | 78.5 | 9 | 14 | 32.05 (16.04) | 685.3 |
| V. griseus | 11.4 | 3 | 4 | 5.62 (2.81) | 533.3 |
Table 2.
Seed dispersal kernels for avian disperser species based on landscape permeability or straight path-based movements. Means of 30 simulations are shown with standard errors in parentheses for each species by movement method. Dispersal kernels were fit with a two-parameter (scale, shape) Weibull distribution. The standard errors of the parameters were estimated using a Hessian matrix and maximum likelihood procedures [85]. Kurtosis was estimated using the kernel parameters and the method described by [85].
| Movement | Species | Scale (m) | Shape | Kurtosis |
|---|---|---|---|---|
| Permeability | C. cristata | 152.0 (10.35) | 0.71 (0.02) | 19.3 (2.1) |
| M. erythrocephalus | 111.4 (8.08) | 0.74 (0.02) | 16.5 (1.95) | |
| S. sialis | 86.4 (10.1) | 0.67 (0.03) | 23.8 (4.2) | |
| T. migratorius | 98.1 (6.47) | 0.74 (0.02) | 16.7 (1.77) | |
| V. griseus | 71.1 (9.07) | 0.93 (0.07) | 7.7 (1.88) | |
| Straight path | C. cristata | 141.6 (9.25) | 0.76 (0.02) | 15.3 (1.61) |
| M. erythrocephalus | 134.6 (11.21) | 0.65 (0.02) | 27.8 (3.56) | |
| S. sialis | 78.9 (8.77) | 0.73 (0.03) | 17.8 (3.09) | |
| T. migratorius | 102.1 (6.77) | 0.73 (0.02) | 17.8 (1.89) | |
| V. griseus | 88.6 (14.94) | 0.70 (0.05) | 20.8 (5.26) |
Table 3.
Mean number of seeds dispersed (SDEQ) and mean relative percentage of total seeds dispersed (across experiments for all species; % Disp.) for the five study species; standard error of the mean is presented within parentheses. Results depict thirty experiments per species by movement method.
| Permeability | Straight Path | Permeability | Straight Path | |||
|---|---|---|---|---|---|---|
| Species | SDEQ | SDEQ | U | % Disp. | % Disp. | U |
| C. cristata | 135.4 (8.36) a | 122.4 (6.93) ab | 519 | 33.73 (1.57) a | 32.09 (1.49) a | 492 NS |
| M. erythrocephalus | 93.3 (4.91) b | 87.1 (4.24) a | 520.5 | 23.65 (1.16) b | 23.17 (1.08) b | 475 NS |
| S. sialis | 22.1 (1.29) c | 21.4 (1.72) c | 471 | 5.56 (0.27) c | 5.59 (0.42) c | 447.5 NS |
| T. migratorius | 141.4 (5.95) a | 143 (7.05) b | 469.5 | 35.59 (1.25) a | 37.58 (1.47) a | 403 NS |
| V. griseus | 5.7 (0.57) d | 6 (0.55) d | 416.5 | 1.46 (0.16) d | 1.57 (0.14) d | 402 NS |
Results of Wilcoxon–Mann–Whitney tests (U) comparing SDEQ or proportion dispersed permeability and straight path movement experiments for each bird species (NS not significant; p ≥ 0.05). Different letters within movement methods represent species’ differences using Dunn’s Test post hoc comparisons (α = 0.05) on Kruskal–Wallis analysis of the given variable between species.
Table 4.
Mean proportion of seeds deposited in suitable L. subcoriacea habitat (SDED) for the five study species by movement method; standard error of the mean is presented within parentheses. Results depict thirty experiments per species by movement method.
Table 4.
Mean proportion of seeds deposited in suitable L. subcoriacea habitat (SDED) for the five study species by movement method; standard error of the mean is presented within parentheses. Results depict thirty experiments per species by movement method.
| Permeability | Straight Path | ||
|---|---|---|---|
| Species | SDED | SDED | U |
| C. cristata | 0.57 (0.03) ab | 0.57 (0.04) a | 431 NS |
| M. erythrocephalus | 0.56 (0.03) ab | 0.55 (0.03) a | 471 NS |
| S. sialis | 0.44 (0.03) a | 0.51 (0.04) a | 339.5 NS |
| T. migratorius | 0.75 (0.02) c | 0.76 (0.02) b | 403 NS |
| V. griseus | 0.68 (0.06) bc | 0.59 (0.07) a | 512 NS |
Results of Wilcoxon–Mann–Whitney tests (U) comparing SDED between landscape permeability and straight path movement experiments for each bird species (NS not significant; p ≥ 0.05). SDED is presented as the mean value with standard error of the mean in parentheses. Different letters within movement methods represent species’ differences using Dunn’s Test post hoc comparisons (α = 0.05) on Kruskal–Wallis analysis of SDED between species.
Table 5.
The product (SDE) of the mean number of dispersed seeds (SDEQ) and the mean proportion of seeds dispersed to suitable locations (SDED), for the five study species for experiments by movement method; standard error of the mean is presented within parentheses. Results depict thirty experiments per species per movement method.
| Permeability | Straight Path | ||
|---|---|---|---|
| Species | SDE | SDE | U |
| C. cristata | 76.6 (6.06) ab | 73 (6.55) ab | 474.5 NS |
| M. erythrocephalus | 53.7 (4.21) a | 49.8 (4.29) a | 511 NS |
| S. sialis | 9.7 (0.75) c | 10.8 (1.19) c | 430 NS |
| T. migratorius | 104.2 (4.5) b | 107 (4.79) b | 435 NS |
| V. griseus | 3.8 (0.49) c | 3.7 (0.46) c | 443.5 NS |
Results of Wilcoxon–Mann–Whitney tests (U) comparing SDE between landscape permeability and straight path movement experiments for each bird species (NS not significant; p ≥ 0.05). SDE is presented as the mean value with standard error of the mean in parentheses. Different letters within movement methods represent species’ differences using Dunn’s Test post hoc comparisons (α = 0.05) on Kruskal–Wallis analysis of SDE between species.
Table 6.
Mean route and seed dispersal distances (m) for the five study species by movement method and mean percentage of foraged seeds not dispersed (Not Disp.) and seeds dispersed during flight (Flight) for the five study species by movement method. Standard error of the mean is presented within parentheses. Results depict thirty experiments per species per movement method.
| Permeability | Straight Path | Permeability | Straight Path | |||
|---|---|---|---|---|---|---|
| Species | Route Dist. (m) | Route Dist. (m) | U | Disp. Dist. (m) | Disp. Dist. (m) | U |
| C. cristata | 320.9 (51.8) a | 270.9 (40.9) ab | 508 | 242.3 (29.97) a | 217.8 (28.66) ab | 509 NS |
| M. erythrocephalus | 230.2 (41.08) a | 302.2 (40.77) a | 333 | 200.5 (34.93) ab | 288.1 (39.42) a | 299 * |
| S. sialis | 278.9 (60.45) a | 233.1 (77.15) cd | 558 | 161.7 (34.15) bc | 135.8 (33.13) cd | 494 NS |
| T. migratorius | 272.6 (43.73) a | 179.3 (34.14) bc | 563 | 165.8 (18.47) ab | 159.7 (25.72) bc | 499 NS |
| V. griseus | 92.4 (17.82) b | 158.3 (62.08) d | 439.5 | 74.4 (14.61) c | 127.5 (43.08) d | 410.5 NS |
| Species | % Not Disp. | % Not Disp. | U | % Flight | % Flight | U |
| C. cristata | 84.3 (0.62) a | 85.8 (0.58) a | 330 | 1.28 (0.51) a | 1.28 (0.48) a | 406 NS |
| M. erythrocephalus | 88.8 (0.49) b | 88.8 (0.53) a | 427 | 0.82 (0.34) a | 0.84 (0.38) a | 460 NS |
| S. sialis | 95.3 (0.25) c | 95.6 (0.35) b | 412 | 3.16 (0.8) a | 3.11 (1.38) a | 504.5 NS |
| T. migratorius | 86.6 (0.53) ab | 86.9 (0.54) a | 421 | 1.13 (0.38) a | 0.4 (0.22) a | 538.5 NS |
| V. griseus | 98.3 (0.16) d | 98.4 (0.14) b | 444.5 | 3.5 (1.99) a | 0.88 (0.66) a | 468 NS |
Results of Wilcoxon–Mann–Whitney tests (U) comparing route or dispersal distance, or percentage of seeds not dispersed or dispersed during flight between landscape permeability and straight path movement experiments for each bird species (NS not significant; p ≥ 0.05, * p < 0.05). Route and dispersal distance (m) and the percentage of seeds not dispersed and dispersed during flight (%) are presented as the mean value with standard error of the mean in parentheses. Different letters within movement methods represent species’ differences using Dunn’s Test post hoc comparisons (α = 0.05) on Kruskal–Wallis analysis of the given variable between species.
Table 7.
Mean dispersal distance and number of depositions by L. subcoriacea habitat suitability across all species by movement method. Dispersal is parsed between flight and perched. Standard errors of the mean are presented in parentheses.
Table 7.
Mean dispersal distance and number of depositions by L. subcoriacea habitat suitability across all species by movement method. Dispersal is parsed between flight and perched. Standard errors of the mean are presented in parentheses.
| Not Suitable | Suitable | Total | ||||
|---|---|---|---|---|---|---|
| Dispersal/Movement | n | Distance (m) | n | Distance (m) | n | Distance (m) |
| Flight | ||||||
| Permeability | 117 | 1735.4 (164.5) | 35 | 1070.0 (85.4) | 152 | 1582.1 (130.0) |
| Straight Path | 94 | 1594.9 (144.6) | 1 | 4626.2 | 95 | 1626.8 (146.6) |
| Perched | ||||||
| Permeability | 4386 | 218.6 (9.9) | 7403 | 155.6 (7.8) | 11,789 | 179.0 (6.1) |
| Straight Path | 3974 | 302.6 (19.1) | 7329 | 136.1 (6.9) | 11,303 | 194.6 (8.1) |
Disclaimer/Publisher’s Note: The statements, opinions and data contained in all publications are solely those of the individual author(s) and contributor(s) and not of MDPI and/or the editor(s). MDPI and/or the editor(s) disclaim responsibility for any injury to people or property resulting from any ideas, methods, instructions or products referred to in the content. |
© 2024 by the authors. Licensee MDPI, Basel, Switzerland. This article is an open access article distributed under the terms and conditions of the Creative Commons Attribution (CC BY) license (https://creativecommons.org/licenses/by/4.0/).
Share and Cite
MDPI and ACS Style
Just, M.G.; Wall, W.A.; Huskins, S.D.; Hohmann, M.G. Effects of Landscape Heterogeneity and Disperser Movement on Seed Dispersal. Ecologies 2024, 5, 198-217. https://doi.org/10.3390/ecologies5020013
AMA Style
Just MG, Wall WA, Huskins SD, Hohmann MG. Effects of Landscape Heterogeneity and Disperser Movement on Seed Dispersal. Ecologies. 2024; 5(2):198-217. https://doi.org/10.3390/ecologies5020013
Chicago/Turabian StyleJust, Michael G., Wade A. Wall, Stacy D. Huskins, and Matthew G. Hohmann. 2024. "Effects of Landscape Heterogeneity and Disperser Movement on Seed Dispersal" Ecologies 5, no. 2: 198-217. https://doi.org/10.3390/ecologies5020013