Article

Comparing Energetics and Physiological Trait Patterns of North American Birds to Support Ecological Risk Assessment

1
ibacon GmbH, Arheilger Weg 17, 64380 Roßdorf, Germany
2
Marine Science Institute, University of California, Santa Barbara, CA 93106, USA
3
Syngenta Crop Protection LLC, Greensboro, NC 27409, USA
4
Syngenta Crop Protection AG, 4058 Basel, Switzerland
*
Author to whom correspondence should be addressed.
Ecologies 2024, 5(3), 354-367; https://doi.org/10.3390/ecologies5030022 (registering DOI)
Submission received: 13 May 2024 / Revised: 26 June 2024 / Accepted: 27 June 2024 / Published: 5 July 2024

Abstract

:
The environmental risk assessment (ERA) of plant protection products (PPPs) is commonly conducted for a number of standard laboratory species, though its scope includes all species, especially those that are vulnerable or endangered. This begs the question of how the eco-physiological and life history traits of those data-rich species compare to those of less documented species. This paper investigates the utility of a database of such traits, the Add-my-Pet collection of Dynamic Energy Budget theory, for the ERA of North American birds. We identified 72 bird species in the collection that have a federal listing status or are otherwise of interest for the ERA of PPPs and compared their eco-physiological and life history traits in relation to body size, feeding guild, and taxonomic identity to those of 446 terrestrial Holarctic birds, as well as those of standard lab species, notably the northern bobwhite, mallard, and zebra finch. The properties of standard lab species generally align with those of a similar taxonomy and size, with the notable exception of the relatively high reproductive capacity of the northern bobwhite and mallard due to the unique properties of laboratory study data. In addition, taxonomy appears to be a better predictor of eco-physiological traits than feeding guild. We conclude that, to identify representative species for the ERA of PPPs, more traits need to be included, such as those directly linked to the likelihood of exposure and those related to reproductive behavior.

1. Introduction

Environmental Risk Assessments (ERAs) quantify the potential risks of exposure to chemicals for a wide range of species, especially those that are vulnerable or endangered. For assessing risks from exposure to pesticides to birds, toxicity studies provide information on effects on survival, growth, and several reproductively important endpoints, such as egg production, shell thickness, and egg hatchability [1,2]. These have been conducted for a few standard species, such as the mallard (Anas platyrhynchos), northern bobwhite (Colinus virginianus), and zebra finch (Taeniopygia guttata), which, in addition to the chicken, are likely the best understood in terms of physiology and general biology. However, ERAs are more concerned with assessing risks to focal or otherwise vulnerable species in environmentally realistic contexts [3], for which information on biology, ecology, and behavior are often fragmentary, and will likely remain so due to ethical, practical, and technical constraints. The diversity of avian species and the omnipresent data gaps make ERAs for birds challenging. The question, then, is if and how we can combine the extensive knowledge we have about a few test and domesticated species with the little we know about the majority of species, including vulnerable and endangered species, in order to better inform ERAs.
We believe this is a two-pronged question, with the first part addressing the similarities in physiological and life history traits across avian species more broadly, and exploring how those compare to standard testing and more data-rich species. The aim of this exercise would be to (1) understand if and which species can be identified as representative using a trait-based analysis, and (2) understand how they compare to standard test species. The second part pertains to questions of how toxicant impacts extrapolate across species and whether such cross-species extrapolations are indeed feasible given data availability. The first part is a prerequisite to the second and forms the scope of this paper.
Trait-based approaches can help address data gaps and inform risk assessments of data-poor species [4]. For instance, trait-based group analysis allows grouping species based on relevant life history characteristics [5], thereby facilitating the representative species selection, whereas combining information on exposure, life history, and intrinsic sensitivity can help identify vulnerable species [6]. Furthermore, to assess impacts from exposure to chemicals, the US EPA has been developing a trait-based model to simulate reproductive phases across North American bird species [7]. The MCnest model uses a common set of traits driving avian reproductive behaviors to provide outcomes on the breeding success of more than 55 species [8]. Species are characterized through trait values, i.e., model parameters, which are compiled in a database accompanying the model. Data compiled in such a database could help bridge data gaps and inform risk assessment. However, the MCnest model currently focuses solely on the reproductive traits of a subset of North American species, therefore possibly ignoring other relevant species properties. In this study, we consider life history traits more broadly by building on the developed field of comparative energetics in the context of Dynamic Energy Budget (DEB) theory. This theory is a general and evolutionarily consistent modeling framework that aims to describe the rates at which any organism acquires resources from its environment and uses the energy and nutrients therein for its growth, sustenance, development, and propagation [9,10,11]. The generality of the theory is due to its modular structure. At its core lies a universal model consisting of a few dynamic equations; supplementary modules can be seamlessly added to account for taxon- or context-specific features, including those describing toxicant impacts [12] and references therein. This means, for example, that the growth and reproduction of birds is described with a single model and that bird species differ only in parameter values. This makes it possible to analyze differences among species by comparing their parameter values. Since many traits are functions of model parameter values and can thus be calculated from the latter [13,14], this comparison can then be extended to include those traits.
At the time of writing, models for approximately 4000 animal species, of which about a quarter are birds, have been parameterized. These parameters, together with some 280 derived traits, are contained in a curated and freely accessible database called the Add-my-Pet (AmP) collection [15]. The information encompassed in this database has been mined to study eco-physiological similarities and divergences within and among taxonomic groups including, for example, ray-finned fishes [16], carnivorans and pangolins [17], crocodiles and turtles [18], and cephalopods [19]. Interspecific parameter and trait analyses also provided a bioenergetic base for body size scaling relationships, such as those between respiration and maximum size [13], and revealed trends in life history strategies [20,21].
The overarching aim of this paper is to evaluate the utility of the AmP collection and associated software applications for ERA purposes, specifically to understand if it can inform representative species selection as well as provide a comparison with standard test species, which are considered to be relatively data-rich. In this study, we compare several groups of avian species: (1) all terrestrial Holarctic birds covered in the AmP collection, (2) the focal species of this paper, which include those with a federal listing status and others deemed of interest due to their overall vulnerability and likeliness of exposure to plant protection products, and (3) standard laboratory species, notably the mallard, northern bobwhite, and zebra finch. This comparison also seeks to gauge the differences and similarities in eco-physiological properties across the three groups, across major taxonomic groups, as well as among feeding guild memberships during breeding season, and to evaluate the feasibility of identifying representative species for the ERA of plant protection products.

2. Materials and Methods

2.1. Data Source, Selection Criteria, and Guild Classification

On the census date (31 January 2023), the Add-my-Pet collection consisted of 3957 animals, of which 1002 were birds. Of these, 446 bird species were classified as terrestrial Holarctic, referred to here as TH birds (see Supplementary Information for the list of TH bird species). Of the TH birds, 234 and 142 were Nearctic and Palearctic, respectively, while the remaining 70 species had a circumpolar distribution. Trait values of TH birds were used as a background for the comparison of species and served as entries in multidimensional scaling.
Our list of species of ERA interest consisted of 107 North American birds that are either (1) federally listed as endangered or threatened, or (2) otherwise deemed of interest for pesticide risk assessment (e.g., because they occur in agroecosystems). Of those, 64 were included in the AmP collection on the census date, and thus could be used in our analysis. However, several birds on the federal list are classified at the subspecies level. After generalization to the species level, another 7 birds could be added to the analysis. Furthermore, we added one substitution: the greater sage grouse for the closely related Gunnison sage grouse. Accordingly, our list of species of ERA interest with AmP entries, denoted as Risk Assessment Species (RAS), consisted of 72 species (see list in Supplementary Information). The RAS contained 2 species that are classified as marine (marbled murrelet and roseate tern) in the AmP collection, and 1 as neotropical (turkey). The remaining 69 species are classified as terrestrial Holarctic birds (i.e., occurring in non-tropical Eurasia, North Africa, and/or North America), of which 57 are terrestrial Nearctic (i.e., occurring in North America only).
The RAS were classified by feeding guild, mostly in line with their classification in Birds of the World [22]. Eight of these species were classified differently to reflect food preference during the breeding season, which is the period of greatest interest for ERA (see RAS list in the Supplementary Information). The RAS contained 25 omnivores, 22 insectivores, 10 invertivores, 5 granivores, 5 piscivores, 2 herbivores, 2 carnivores, and 1 frugivore, according to food preferences during the breeding season.
For the standard laboratory species such as the mallard and northern bobwhite, it should be emphasized that some of the inputs into the AmP database could inflate the modeled reproductive output when compared to their wild conspecifics. These laboratory studies are designed to promote increased reproductive output via continuous experimenter removal and the incubation of eggs to generate sufficient data (i.e., improve precision) for estimates of hatching success, embryo viability, hatchling survival and growth, 14 d-old survivor survival and growth, etc. [2]. Thus, eggs laid per female from this laboratory data would not be directly representative of wild-type female clutch size or representative of any other direct measures of fecundity [23]. However, these data are useful (and required regulatorily) for understanding the effects of chronic chemical exposures and can be used in ERAs, interpretations of discrete breeding cycle phases, and ultimately mechanistic modeling [23,24,25]. It should also be noted that wild mallards have a similar clutch size (as a measure of reproductive output) as other Anas congenerics, and the wild northern bobwhite has a similar clutch size to other North American quail species [26].

2.2. DEB Model, Parameters, and Traits

The bioenergetics of birds are described by the so-called standard DEB model. It describes the growth and development of all life stages with three state equations specifying the dynamics of reserve, size and level of maturity, and an additional equation specifying reproduction. Together with core model assumptions and thermodynamic constraints, those equations imply the dynamics and values of many other processes and quantities, such as respiration, size, and age at life stage transitions. The model also includes an aging module, which links survival probability to physiological wear and tear. In short, the model describes the rate at which an animal feeds depending on its size and on food availability. The energy in ingested food is then assimilated into energy reserve. Under non-starvation conditions, the reserve is made available to support somatic processes (somatic maintenance and growth), maturity processes (maturity maintenance, and in embryos and juveniles, maturation) and reproduction (adults only); a fixed fraction of the mobilized reserve is allocated to somatic processes, while the remainder is used for maturity and/or reproduction. Maintenance processes are demand-driven, i.e., they take priority, whereas all other processes are driven by supply.
The standard DEB model uses 14 primary parameters to describe the bioenergetic performance of a ‘general’ animal. Data available for any given species are generally insufficiently varied to estimate all primary parameters. To complete the full parameter table for a given species, the AmP collection uses an algorithm in which the values of the primary parameters of a ‘generalized’ animal are included in the estimation process [27,28]. The parameter values of the ‘generalized’ animal are weighted such that they do not significantly affect the values of parameters that, given the data that are available, can be reasonably well estimated, but constrain the values of those about which the data contain little information. For most birds, 6 primary parameters are generally well estimable (see Table 1) and are therefore central in the comparison of primary parameters in this paper. A more in-depth description of the AmP estimation methods can be found on the DEB portal [29].
Secondary parameters as well as many traits are functions of primary parameters and can thus be calculated from the latter. Secondary parameters and traits evaluated in this paper are listed in Table 1.

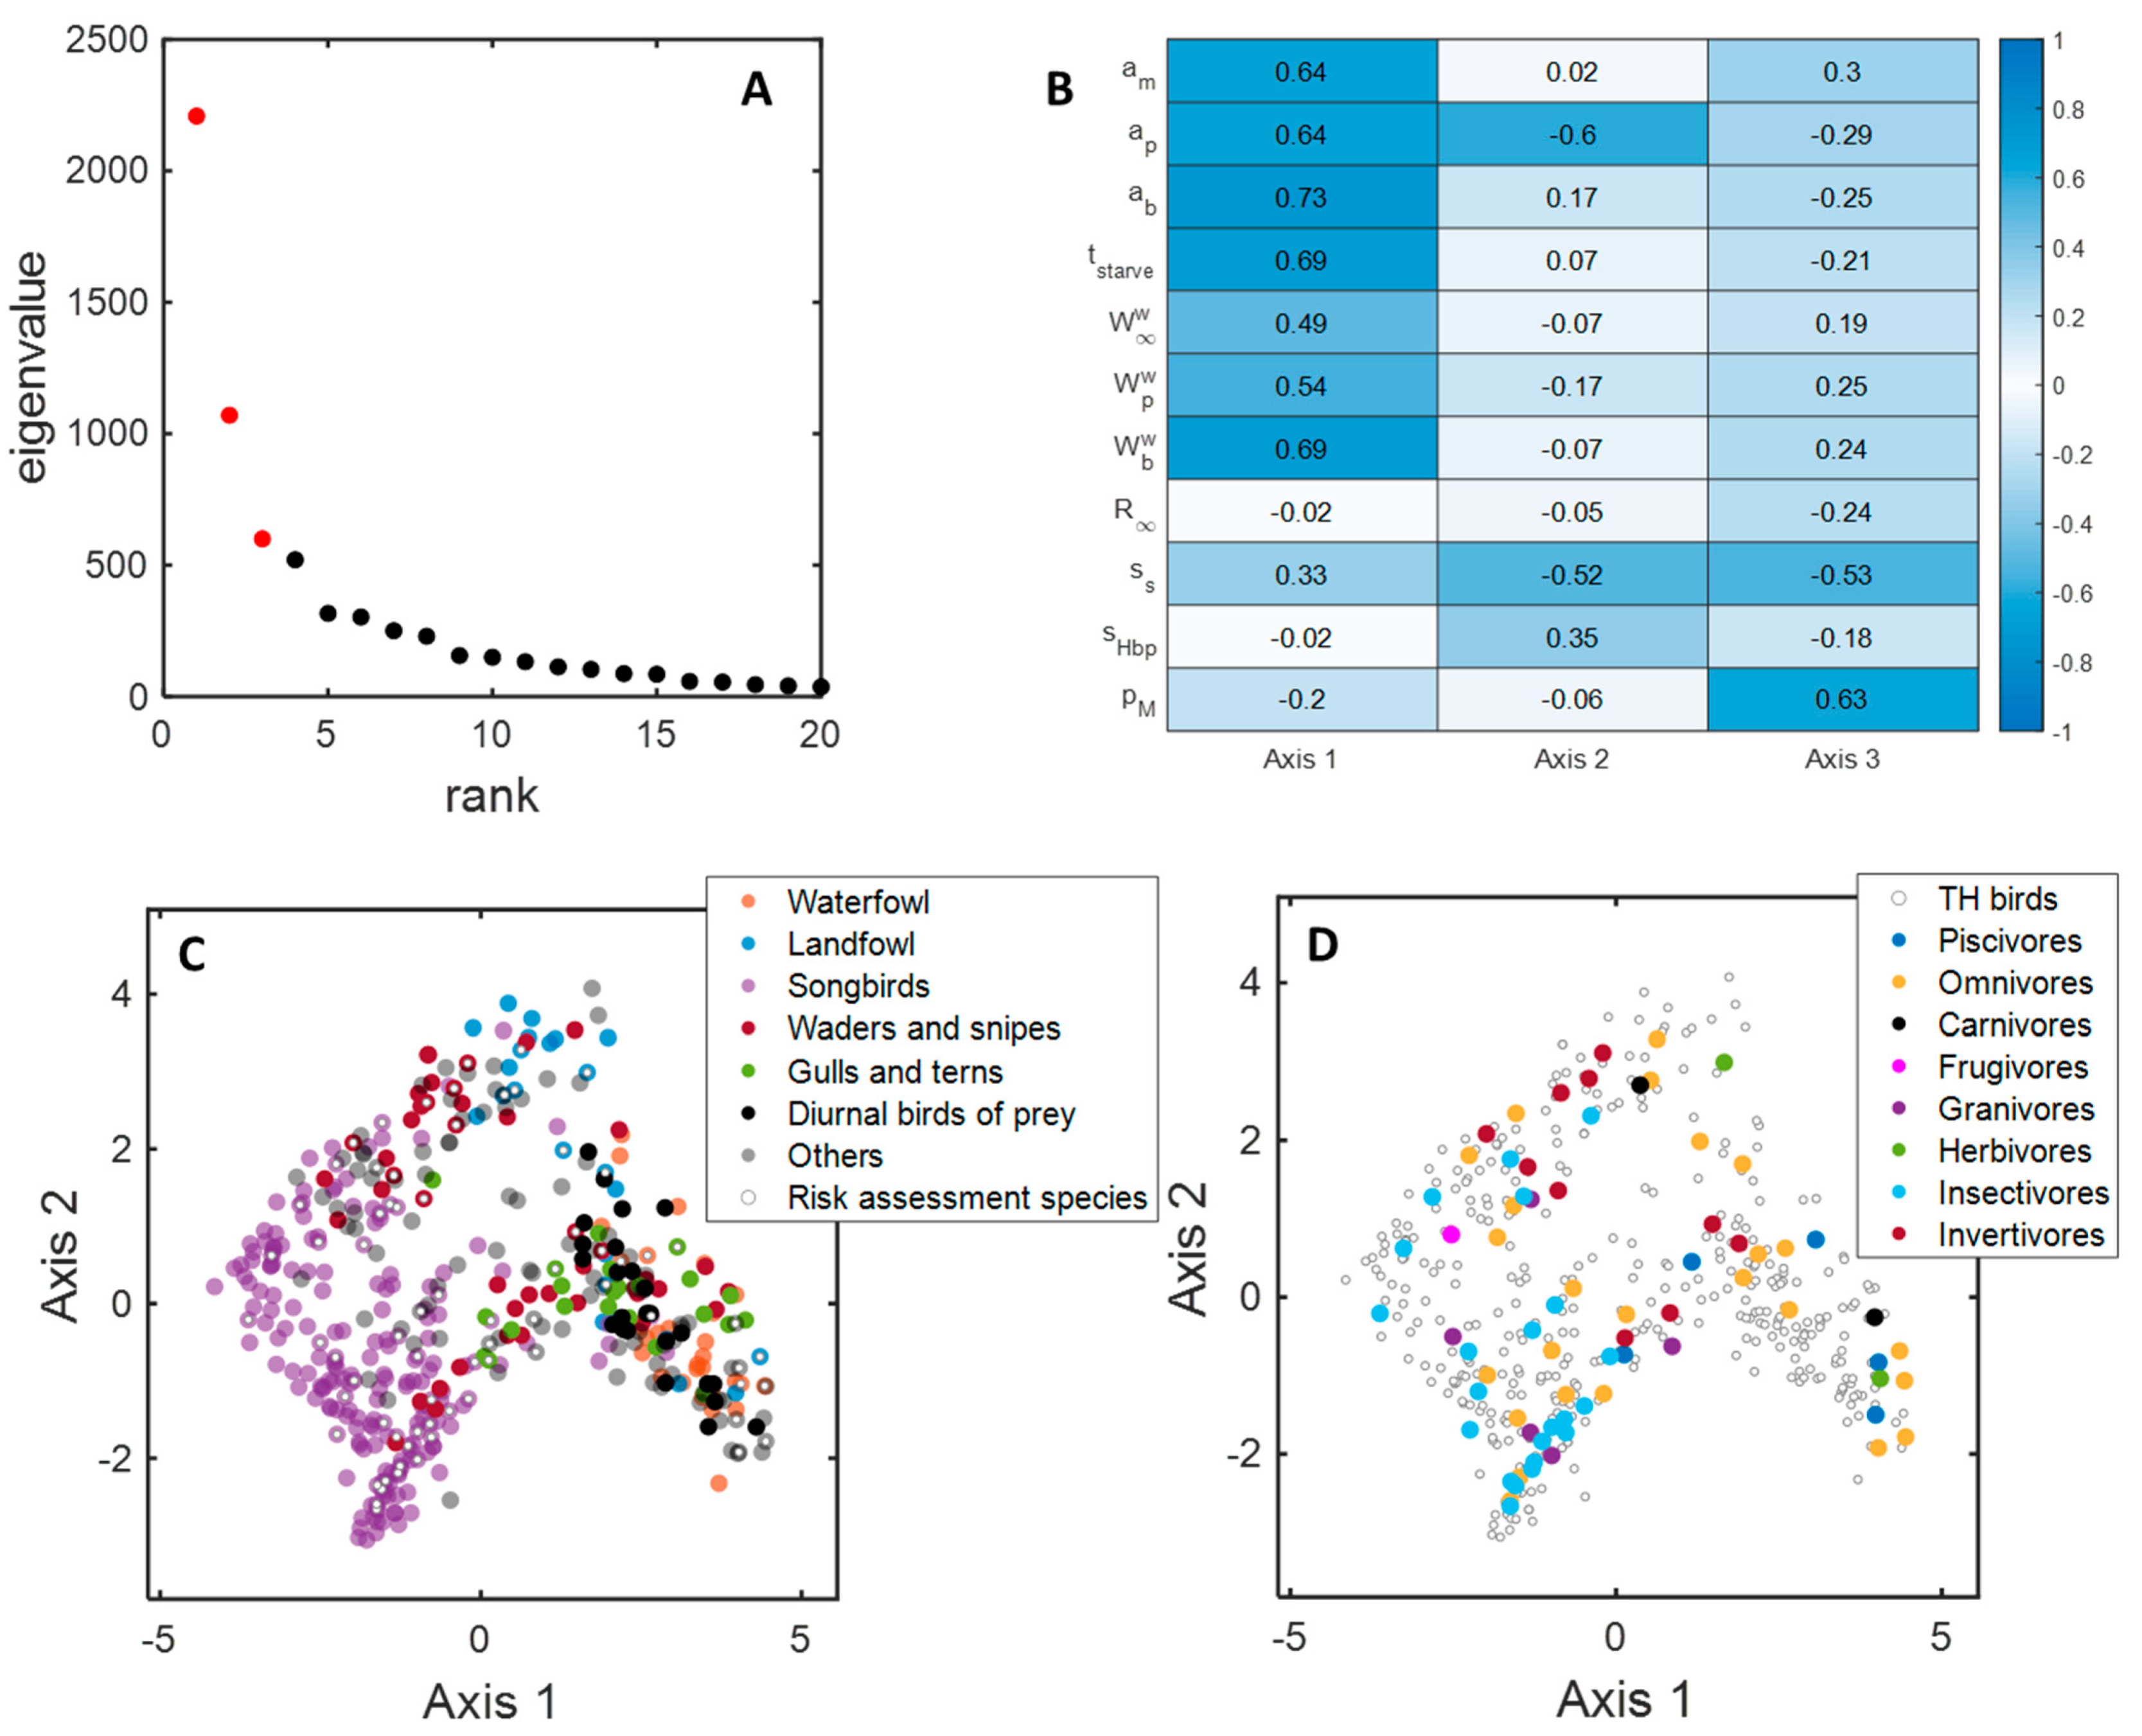
2.3. Multidimensional Scaling (MDS)

In the context of DEB theory, MDS is a method to position species on the basis of distances between their traits in a space of reduced dimensionality while preserving the distances between the species. A trait is defined as a parameter or a function of parameters quantifying an eco-physiological property of a species. The method is described in full in [14]. In short, the distance between two species i and j is defined as
d i j = k = 1 p θ i k θ j k 2 p θ i k 2 + θ j k 2
in which p is the number of traits considered and θ * k is the value of trait k of species i or j. Note that distances are scaled to be dimensionless so that they do not depend on the units of individual traits. The distance matrix is used to compute the square eigenmatrix in which the columns represent normalized eigenvectors with lengths equaling the number of species. The species included are terrestrial Holarctic birds and the laboratory species zebra finch (the laboratory species northern bobwhite and mallard are terrestrial Holarctic birds).
The AmP collection contains over 250 traits, from which we selected the 10 traits used by Kooijman et al. (2021). We added a trait we deemed especially relevant for ERA: the time it would take a well-fed adult bird to deplete its energy reserve for the purpose of somatic maintenance (tstarve). This trait indicates how sensitive a species would be to starvation due to food avoidance or decreased food intake due to chemical exposure. The correlation map of included traits is shown in Figure 1 (see Table 1 for explanation of symbols).

2.4. Software

Parameter and trait analyses and visualizations were conducted with AmPTool [30], a freely downloadable package for Matlab. The Matlab version used was 2023a.

3. Results and Discussion

3.1. Quality of AmP Entries

The relative quality of AmP collection entries is assessed with a level of completeness indicator and a relative error measure [15,27]. On a scale of 0 to 10, the level of completeness is a measure of the diversity of data types used in estimating parameters. The median level of completeness of all animals, TH birds, and RAS birds is 2.44, 2.45, and 2.28, respectively, indicating that the diversity of the data that were used in estimating the model parameters of all animals and TH birds is similar, whereas that of RAS birds is somewhat lower. The level of completeness of the standard laboratory species, mallard, northern bobwhite, and zebra finch is 2.5, 2.9, and 2.9, respectively, indicating that the variety of the data used to parameterize those species is somewhat larger than those of TH and RAS birds. The mean residual error is a goodness-of-fit measure quantifying the mean difference between the model predictions and the data that were used in the estimation of parameters [28]. The median mean residual error for all animals, TH birds, and RAS birds is 0.051, 0.042, and 0.038, respectively [15], indicating that on the whole, the model fits to the bird data are generally a little better relative to those of all animals. The mean residual error of fits to the data published in the AmP collection for the mallard, northern bobwhite, and zebra finch is 0.064, 0.14, and 0.041, respectively, indicating that the mean residual error for the northern bobwhite is relatively high. The distribution of the two quality measures is illustrated in Figure S1 of the Supplementary Information. In summary, the quality of TH and RAS bird entries in the AmP collection is in line with those of all animals.

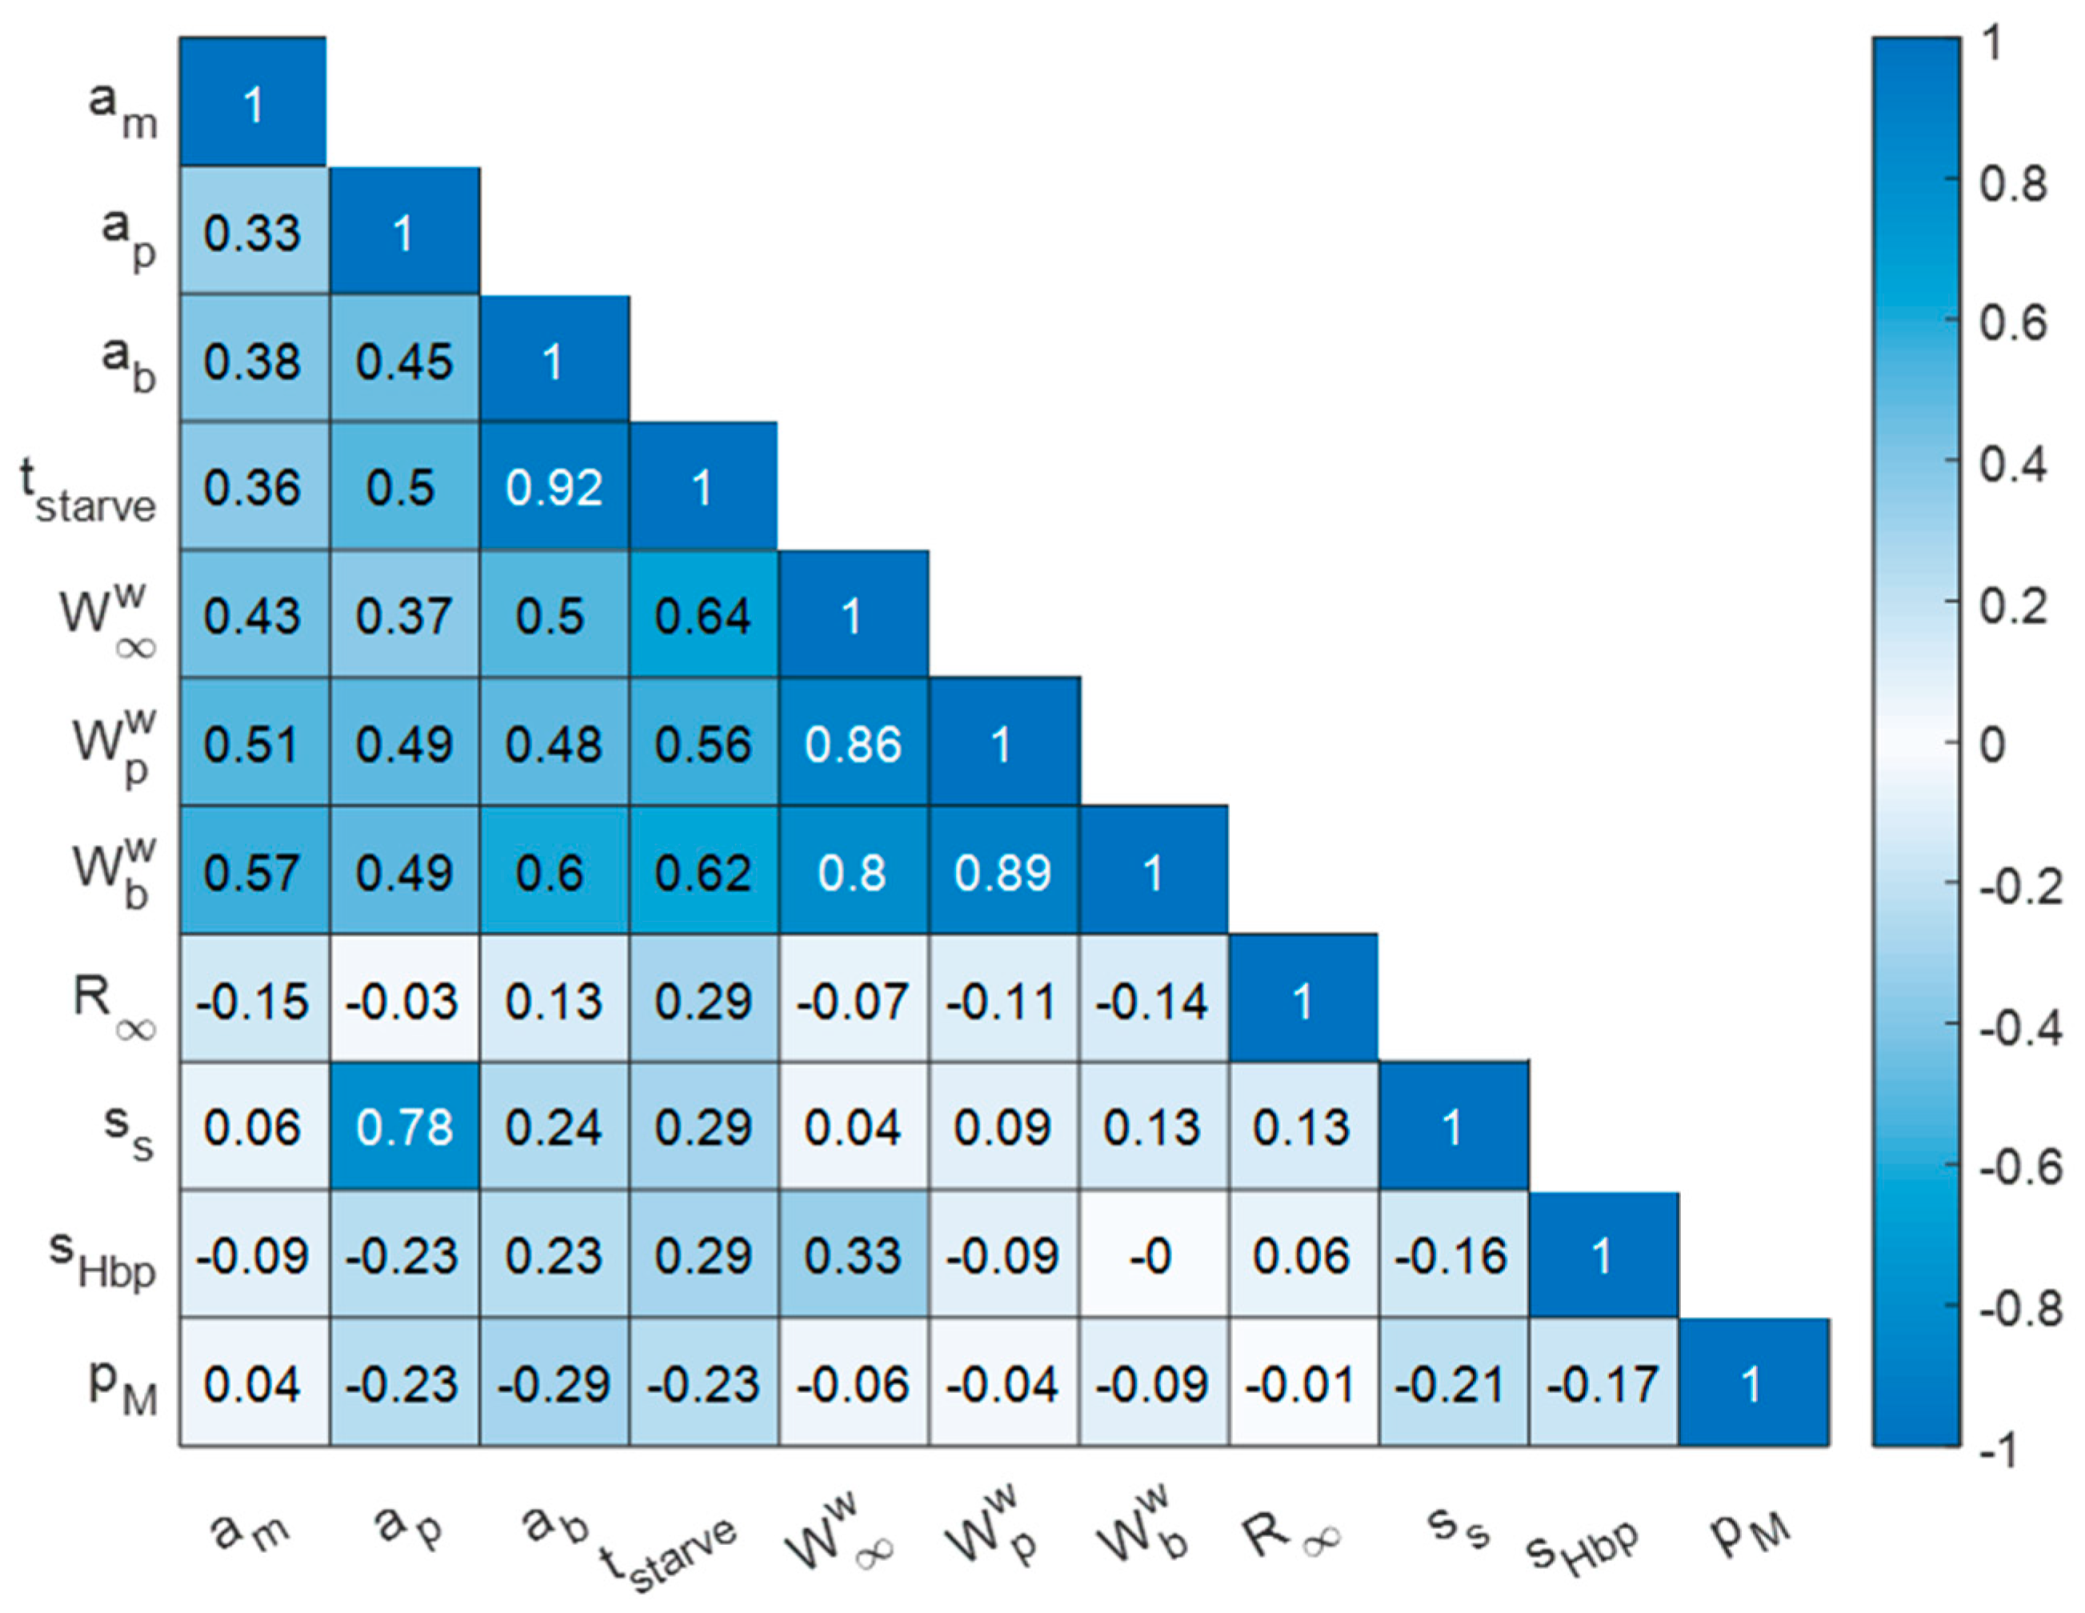
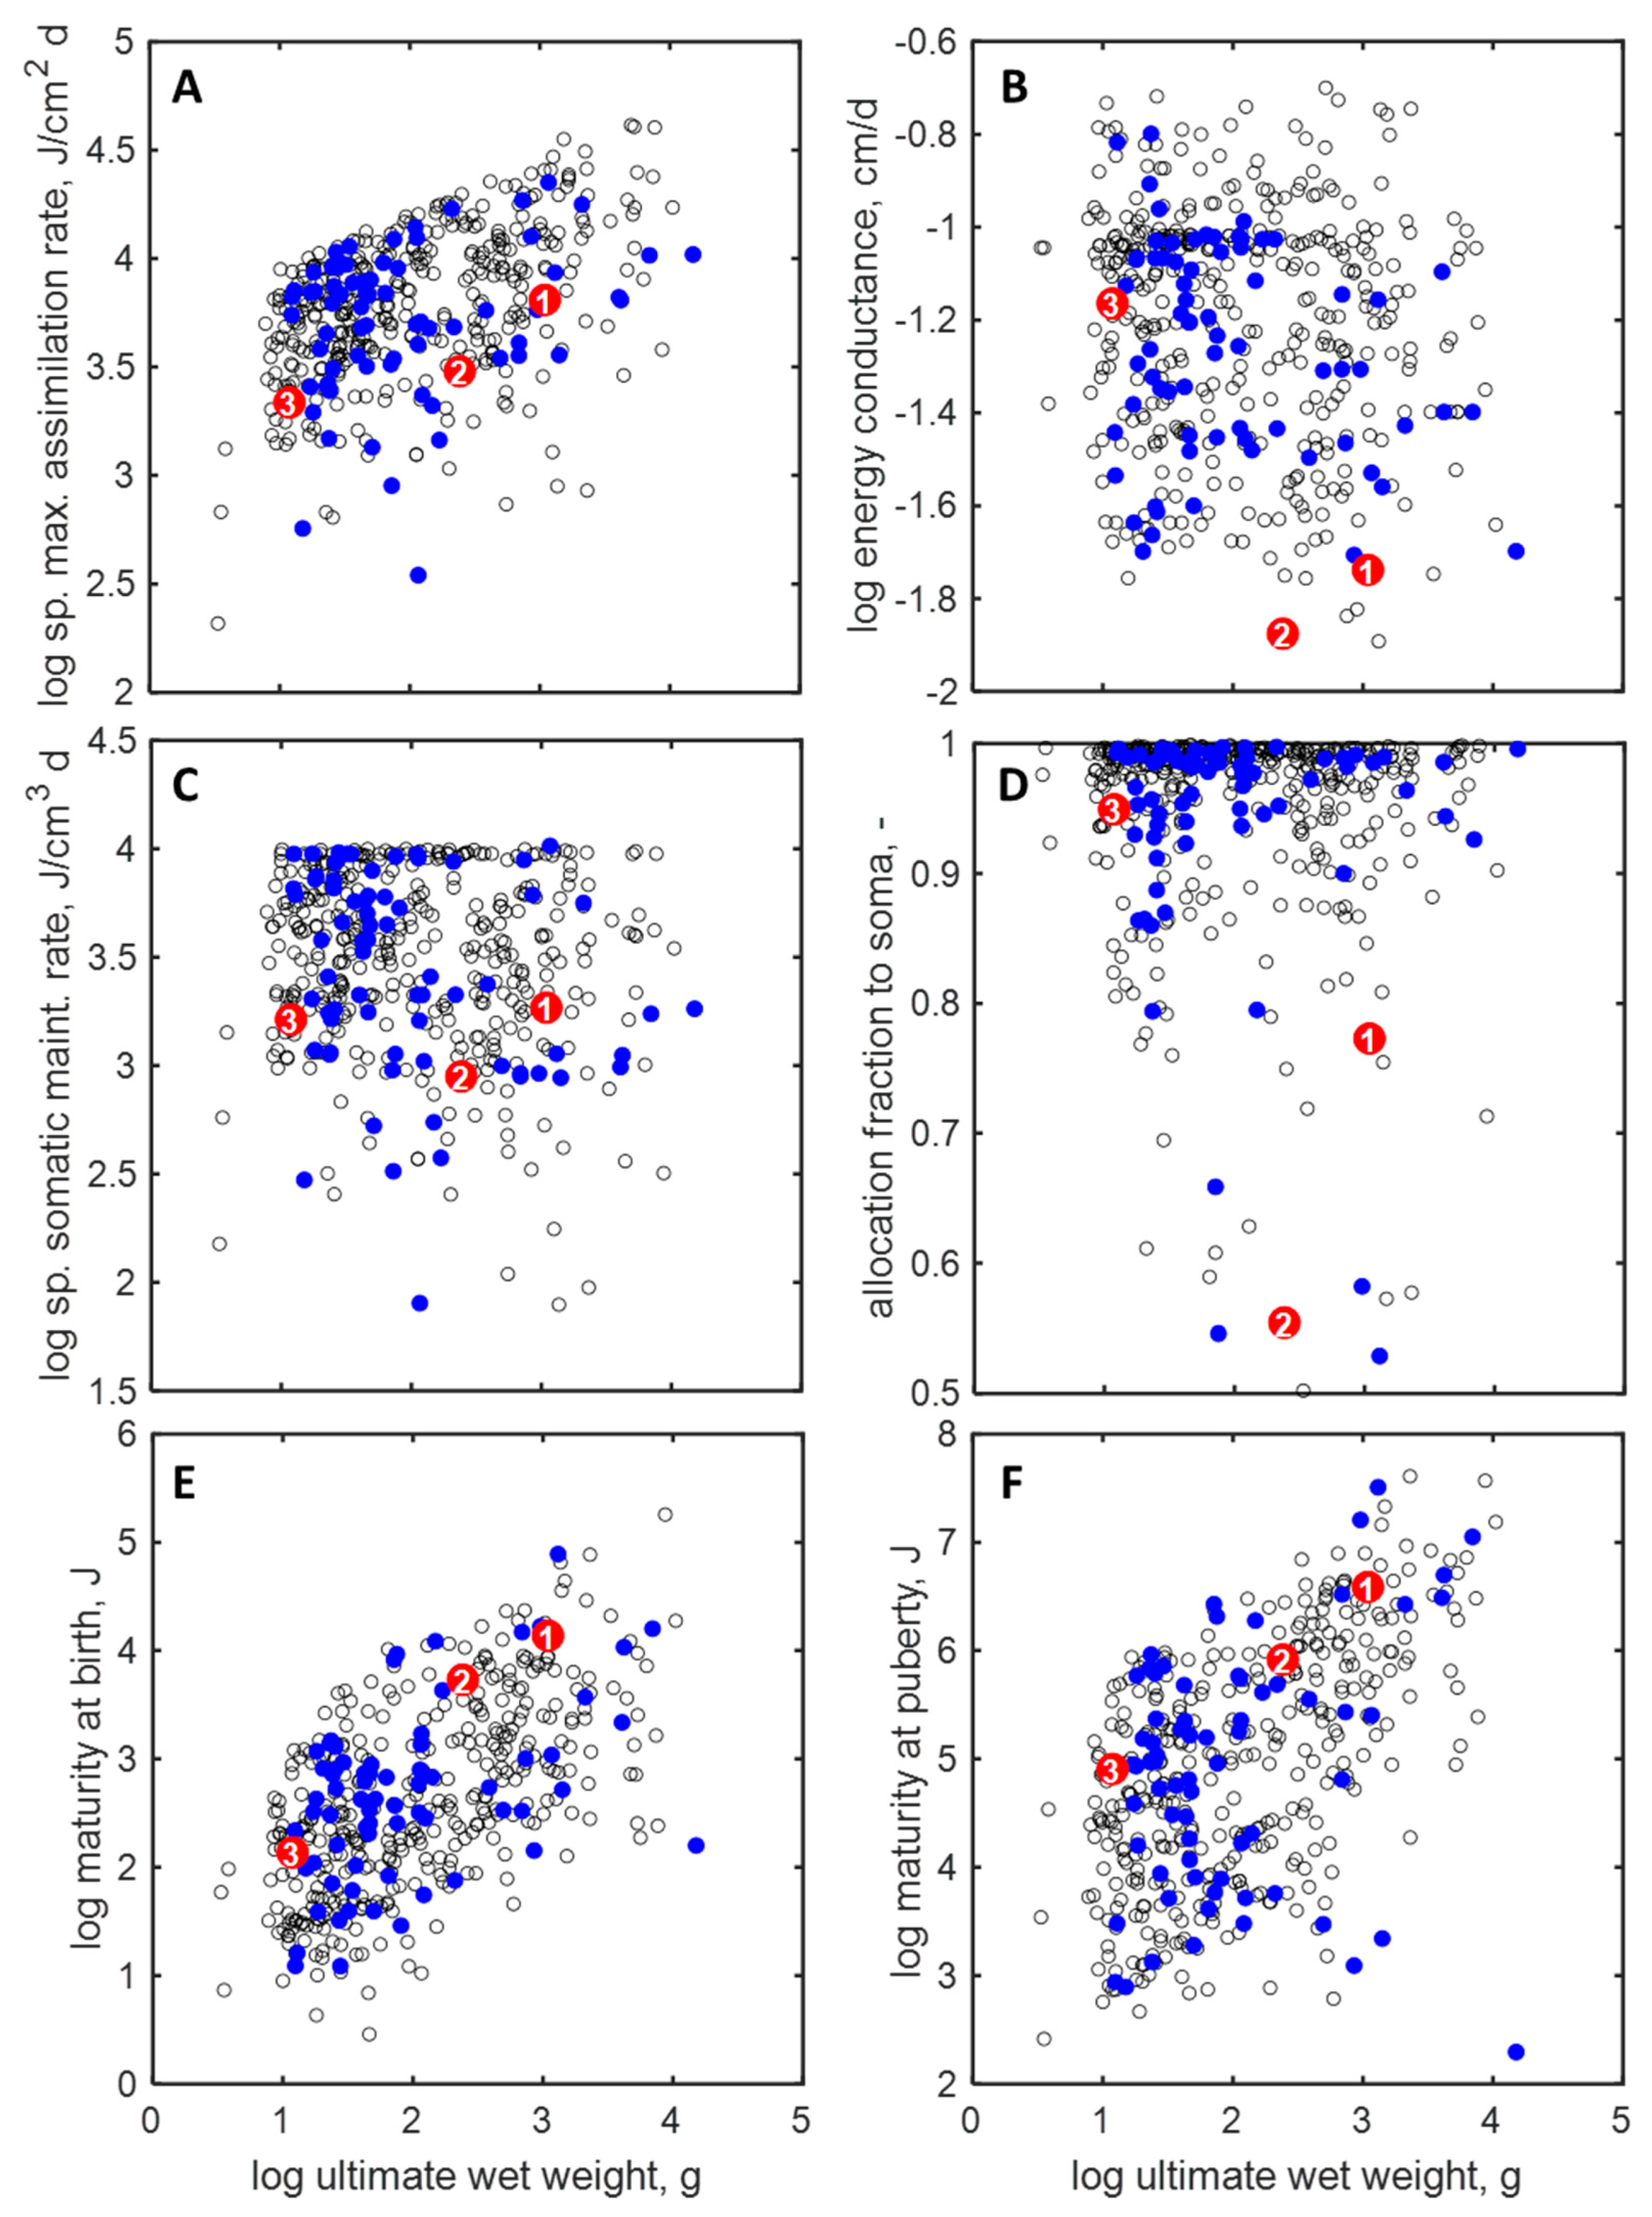
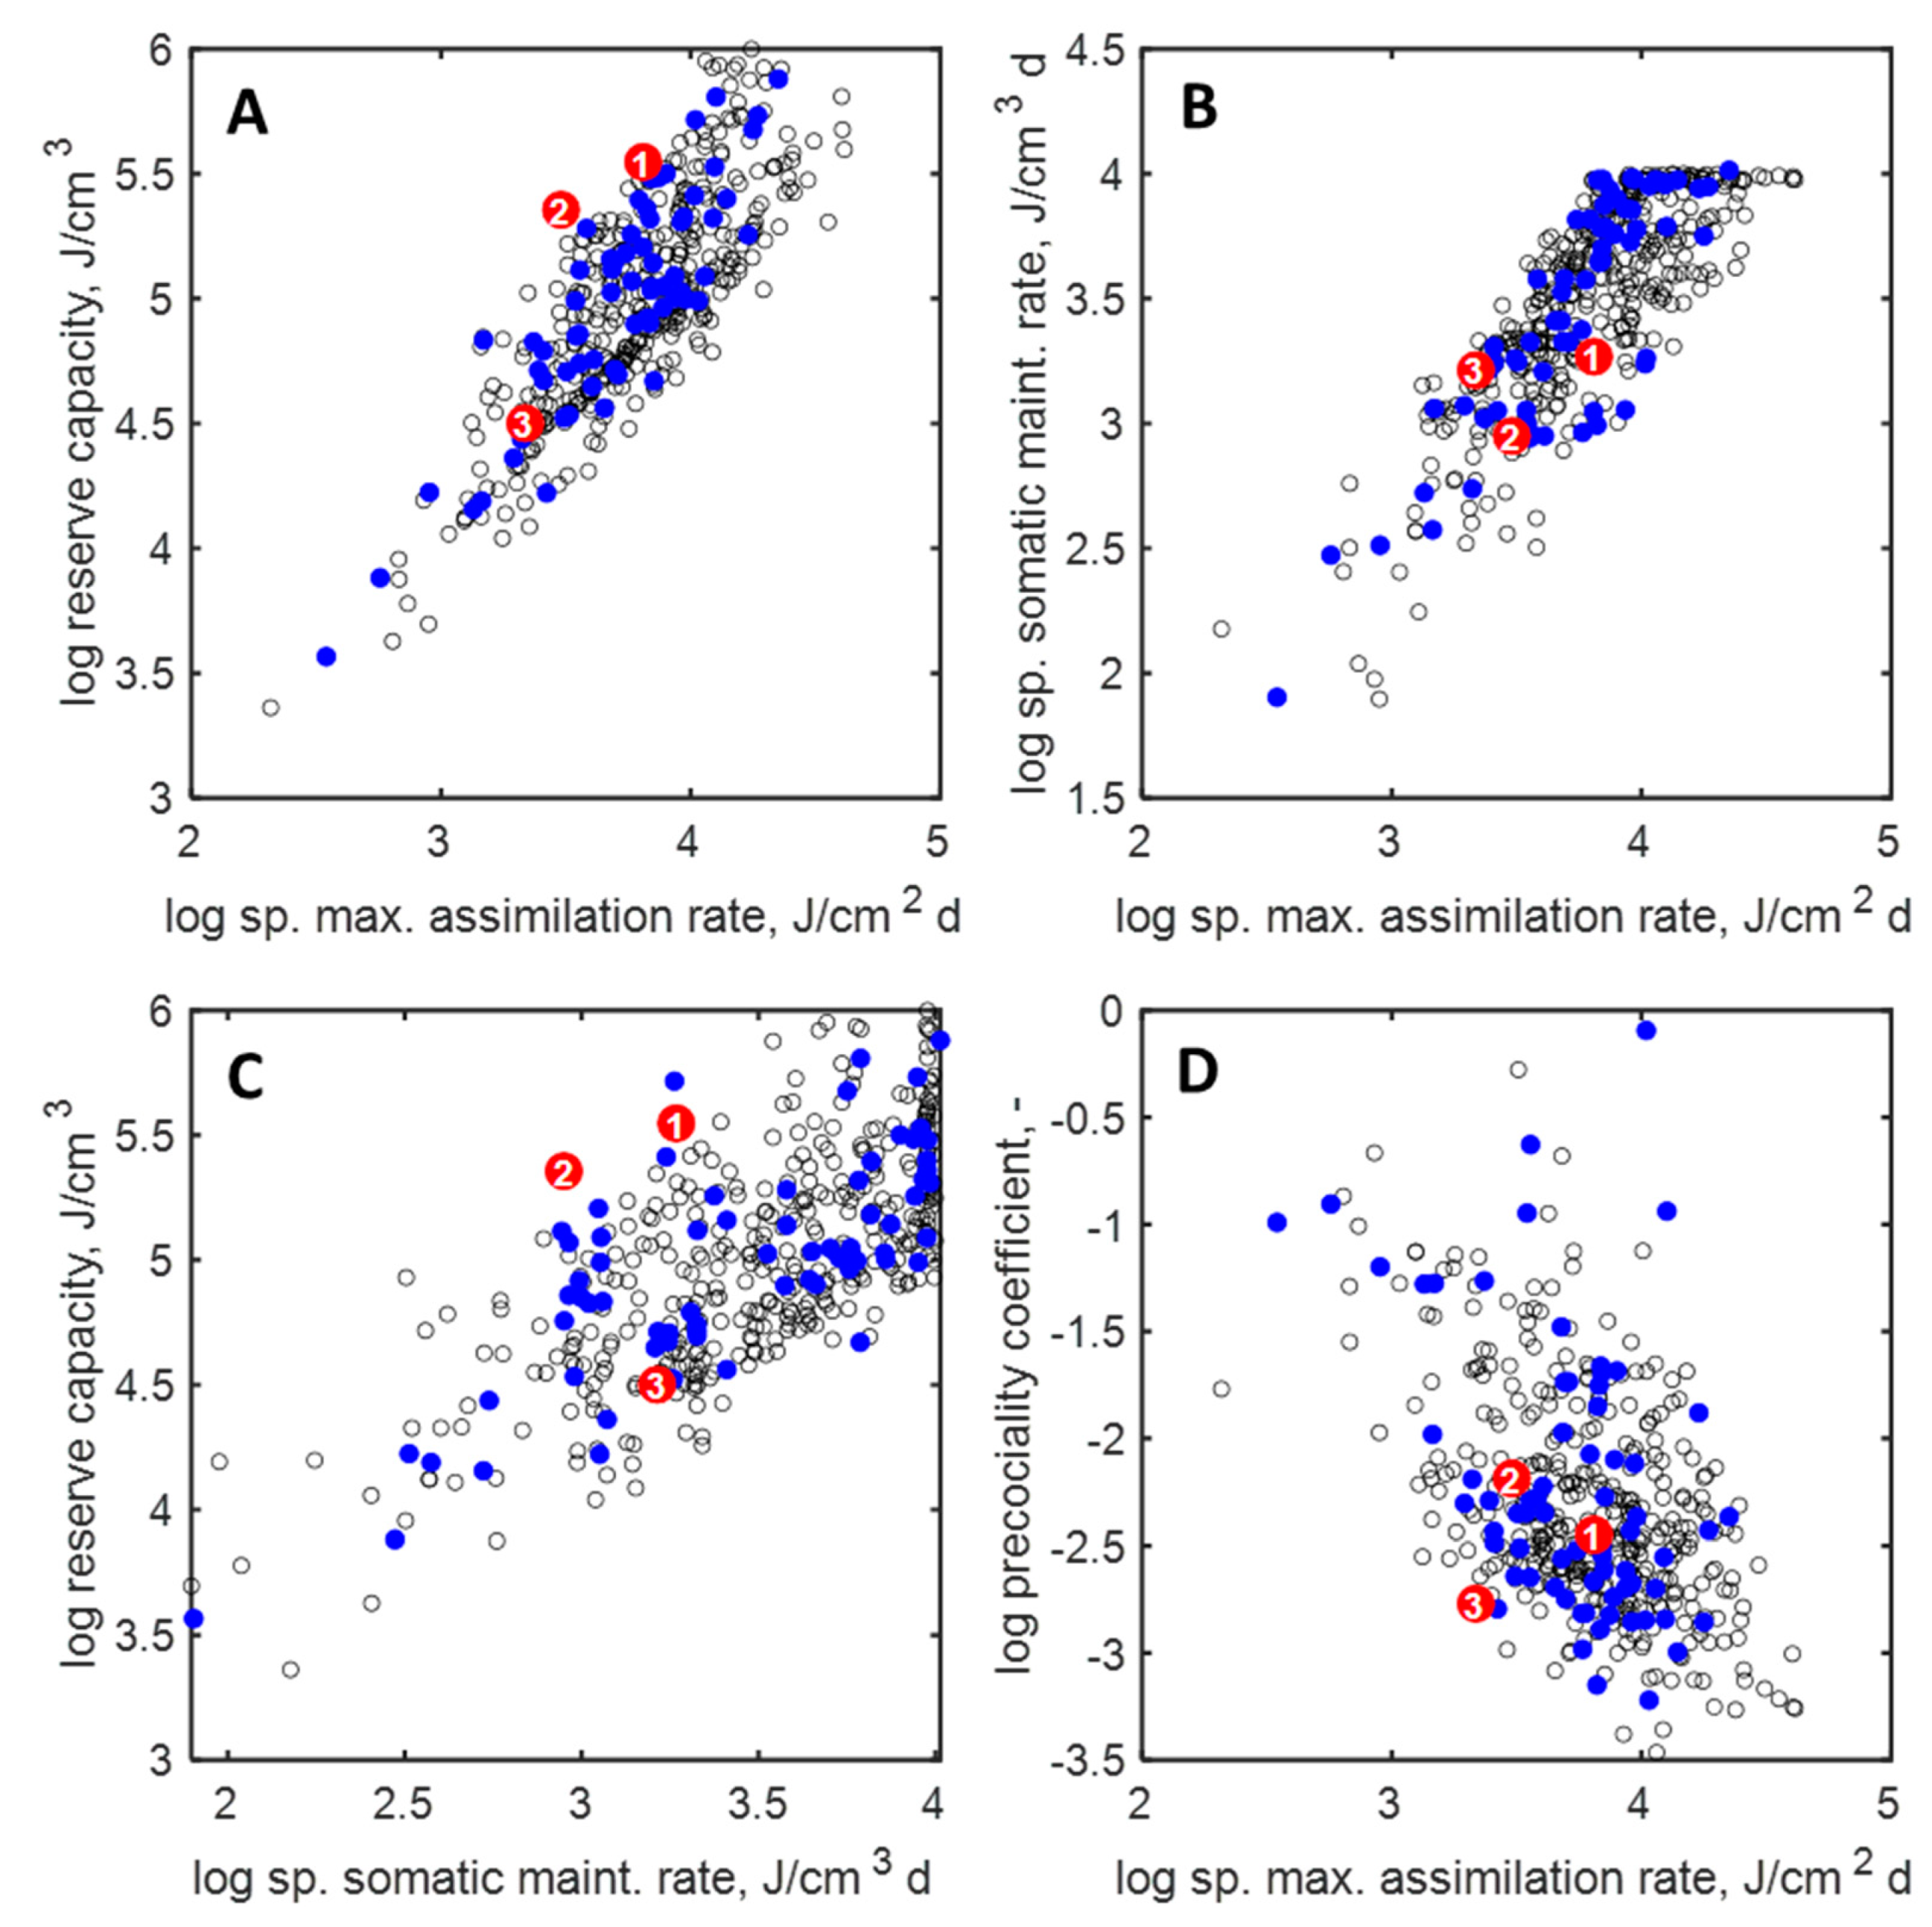
3.2. Parameters and Traits of Terrestrial Holarctic Birds

As judged visually, the values of several primary parameters, notably those quantifying the assimilation capacity and maturity thresholds for birth and puberty, tend to increase with the body size of full-grown TH birds, while others appear invariant, particularly the energy conductance, somatic maintenance, and allocation fraction to soma (see Figure 2). Those trends are in agreement with DEB theory, which predicts body-size-scaling relationships for those trend-prone parameters, as well as many other traits, on the basis of physical co-variation rules [9,13]. These rules state that some primary parameter values, and consequently those of various traits, depend on the maximum size of an animal, whereas others do not. Yet, there is a considerable amount of scatter, which, in addition to inevitable error, is due to differences in species-specific adaptations and strategies associated with climate, seasonal variation in food availability, diet, and behavior, among other factors [31].
Since secondary parameters and many traits are functions of primary parameters, several of them also tend to scale with ultimate size. For example, the von Bertalanffy growth rate clearly tends to decrease with increasing ultimate size of birds (see Figure 3A) This means that larger birds approach their adult size relatively slower than smaller species. The maximum starvation survival time is longer for larger species (see Figure 3B). According to the theory, the reserve capacity also increases with ultimate size, though this trend is less conspicuous than for the previous two traits (see Figure 3C). The ultimate reproduction rate, expressed as number of eggs, is invariant with size (see Figure 3D). The supply stress also appears invariant with size (see Figure 3E). The supply stress measures maintenance requirements relative to the assimilation capacity of a given species, and thereby indicates to what extent feeding behavior is demand- or supply-driven. The supply stress of birds (and mammals) is high relative to most other vertebrates and invertebrates [21], implying that their feeding behavior is driven in a relatively large part by demand. In the context of DEB, the precociality coefficient is defined as the level of maturity at birth relative to that of puberty. This coefficient tends to decrease with size (see Figure 3F), but variability is high, which may point to differences in life history strategies rather than in bioenergetics.
Both the maximum specific assimilation rate and reserve capacity scale with size according to the co-variation rules of DEB theory, though these trends appear rather weak in TH birds (see Figure 2A and Figure 3C). Interestingly, the reserve capacity and the somatic maintenance rate co-vary strongly with the maximum specific assimilation rate (see Figure 4A,B). The former trend confirms that the co-variation rules are in effect, whereas the latter points to another pattern observed in DEB parameters, namely the waste-to-hurry strategy, which was originally observed in smaller-bodied invertebrates that live in environments with a relatively short period of excess food availability [20]. This strategy combines an enhanced assimilation capacity with high maintenance demands, which leads to rapid growth under abundant food conditions [20]. In combination with the co-variation rules, the waste-to-hurry strategy also implies that the reserve capacity increases with somatic maintenance demands [16], as is confirmed in Figure 4C; this coupling would not be observed if this strategy were absent. In the present context, the waste-to-hurry strategy indicates that TH birds must be nearly full-grown at the time of fledging or at least by the end of the first season, regardless of their ultimate size.

3.3. Parameters and Traits of Species of ERA Interest and Laboratory Species

The trends in and values of primary and secondary parameters and traits of RAS birds are generally in line with those of similarly sized TH birds (see Figure 3 and Figure S2 in the Supplementary Information). RAS birds with a federal listing status tend to be larger than non-listed RAS birds, but parameter and trait values of both groups are comparable. RAS birds that are insectivores during the breeding season are relatively small (see Figure S3 in the Supplementary Information), indicating that many of them are passerine birds, whereas many omnivores are among the larger sized birds. There appears to be a slight indication that birds with an animal diet other than insectivores (invertivores, carnivores, and piscivores) have a relatively low assimilation capacity for their size, which may indicate that the food quality of those birds is relatively high. For yet unknown reasons, invertivores also tend to have relatively low maintenance requirements. It should be noted, though, that the amount of variability is high and that the number of birds in most feeding guilds is very low, so differences among these feeding guilds, if any, are bound to remain obscure. Feeding guild does not appear to be a determinant of the selected secondary parameter and trait values (see Figure S4 in the Supplementary Information). The precociality coefficient of many insectivores relatively low (i.e., they are relatively immature at birth), which is due to the relatively large number of passerines among RAS insectivores.
Among laboratory species, the parameter and trait values of the zebra finch are in line with those of other similarly sized birds (see Figure 2 and Figure 3). However, the energy conductance and allocation fraction to soma of the mallard and northern bobwhite are comparatively quite low, indicating that the transfer rate of resources in ingested food to growth, maintenance, development, and reproduction is relatively low in these species, and that these species commit a relatively large part of their resources to reproduction. The latter is confirmed by their relatively very high ultimate reproduction rates, especially that of the northern bobwhite (see Figure 3D). These species also have relatively high maximum starvation survival times, whereas their von Bertalanffy growth rates are comparatively low (see Figure 3A).
However, those diverging tendencies are not representative of other galloanserae (water and land fowl), which are evolutionarily most distant from the other bird taxa included in this analysis yet have primary parameter values that are mostly in line with other similarly sized TH birds (see Figure S5 in the Supplementary Information). Two reasons may account for the outlying parameter values of the mallard and northern bobwhite. First, the experimental data used to parameterize these species in AmP came for a large part from poultry studies and standard reproduction toxicity tests. That is, their prolific egg-laying abilities have been a primary driver in their election as species of interest, as well as in subsequent strain selection. It is unknown to what extent the parameter values of the wild type may differ from domesticated varieties. Second, in reproduction toxicity tests, eggs are regularly removed, which induces the birds to keep producing eggs at an artificially high rate.

3.4. MDS Analysis

Trait distances among terrestrial Holarctic birds and laboratory species (447 species total) were used to compute a similar number of eigenvectors or axes. However, only a few axes are relevant for adequately describing trait differences among species, as corresponding eigenvalues rapidly drop in value with increasing rank (see Figure 5A). Accordingly, the first three axes capture most of the scatter between species. As the new MDS axes do not have an immediate biological meaning, the correlation between them and the original traits is also computed. The first axis is mostly correlated to traits representing age and size as well as maximum starvation time (see Figure 5B). Age at puberty and supply stress relate strongly to the second axis, whereas somatic maintenance and supply stress correlate relatively strongly to the third.
Groups of larger taxonomic groups are clearly identifiable in three-dimensional eigenspace. For illustrative clarity, the results are split up in three two-dimensional plots: Figure 5C shows the space along the two major axes, whereas Figure S6 in the Supplementary Information shows the spaces along axis 1 and 3 and along axis 2 and 3. For example, the songbirds are grouped on the left on axis 1, illustrating that these birds tend to be relatively small and fast-aging birds. In addition, these species tend to be centered on axis 3, and are spread out along axis 2. In contrast, diurnal birds of prey are grouped on the right on axis 1 (indicating that they are relatively large and slowly aging) and tend to be centered on axes 2 and 3. Gulls and terns are relatively strongly centered on axis 2. Other groups of birds tend to be grouped in the eigenspace as well. Thus, the multidimensional scaling of DEB traits can reveal eco-physiological similarities within taxonomic groups of birds, as has been demonstrated before for ray-finned fishes [16], carnivorans and pangolins [17], crocodiles and turtles [18], and cephalopods [19]. However, it is not fully understood how the choice of traits included in the MDS analysis influences grouping, as a systematic investigation has yet to be conducted.
The question is now whether groups are identifiable in RAS birds if grouped according to their feeding guild membership during their breeding season. Insectivores are grouped on the left side of axis 1 (see Figure 5D) and tend to be centered on axis 3 (see Figure S6 in the Supplementary Information), which reflects that many of them are songbirds. There is a weak tendency among invertivores to be centered on axis 1 and on the right on axis 2. Omnivores are spread out along all axes. The number of birds in other feeding guilds is unfortunately too small to show any grouping.

4. Conclusions

This paper demonstrates the utility of trait-based analyses based on DEB theory and the AmP collection and associated software applications to address questions of ERA interest as well as some limitations. Trait-based analyses such as those conducted here are especially relevant for data-poor species and species with specific legal protections. Although our focus was on North American birds that are potentially affected by plant protection products, the approach is general and can thus be used for other taxa and/or other potential stressors. We identified 72 North American bird species present in the AmP collection that have a federal listing status or are otherwise of interest for the ERA of plant protection products (RAS birds). Their eco-physiological properties were compared to those of 446 terrestrial Holarctic and 1 neotropical bird species in the AmP collection (TH birds), as well as those of standard laboratory species, notably the mallard, northern bobwhite, and zebra finch. The traits of RAS birds were comparable to those of TH birds of similar size. The reproductive abilities of the mallard and northern bobwhite were high compared to other birds of similar size. These abilities were found to be outliers, as the traits of other land-based species and water fowl were typically in agreement with other birds of similar size. These discrepancies are most likely due to the protocols of the experiments to parameterize those species, as many of these protocols involve the stimulation of egg production via the continuous removal of eggs. Thus, reproductive output in laboratory settings and under laboratory-controlled conditions may not be reflective of the reproductive output of wild-type individuals. This finding highlights the need to carefully consider and understand the type and quality of data informing DEB models, especially when conducting comparative analyses across species. Otherwise, such analyses could result in erroneous conclusions, which would hamper their utility for risk assessment. Ultimately, we see that such eco-physiological comparisons could inform the extrapolation of the effects of toxicants across species. This would address the ongoing challenge of ensuring the accurate predictions of the effects of chemical exposure and the protection of non-target species, while simultaneously reducing the amount of vertebrate testing. The multidimensional scaling analysis of parameter and trait values of TH birds in the AmP collection showed a grouping of major taxonomic avian groups. The grouping of RAS birds grouped according to their feeding guild during breeding season appeared weak, with most of the grouping reflecting taxonomic identity rather than guild membership. However, it is possible that grouping would become more noticeable, if the number of birds included in each feeding guild, now ranging from 1 to 25, were increased. Thus, our results suggest that the selection of representative species for ERA should be based on taxon rather than feeding guild. In addition, other relevant traits need to be included, such as traits that affect exposure to chemicals, as well as traits more focused on reproductive cycle and habitat use. Such a comprehensive approach that includes all relevant traits will ensure that the most representative species become the focus for ERAs.

Supplementary Materials

The following supporting information can be downloaded at: https://www.mdpi.com/article/10.3390/ecologies5030022/s1, Figure S1. Quality measures of AmP collection entries of all animals (dotted curves), terrestrial holarctic birds (TH birds, solid black curves) and selected North American birds of RA interest (RAS birds, solid blue curves). Figure S2. Selected primary parameter values of terrestrial holarctic birds (open circles), federally listed birds (purple), other selected birds of RA interest (green), mallard (1), northern bobwhite (2) and zebra finch (3). Figure S3. Primary parameter values of RAS birds split up among feeding guild during breeding season. Figure S4. Secondary parameter values of RAS birds split up among feeding guild during breeding season. Figure S5. Selected primary and secondary parameter values of TH birds (open symbols) and galloanserae (water and land fowl) among them (blue), as well as labspecies mallard (1), northern bobwhite (2) and zebra finch (3). Figure S6. Axis 3 versus axis 1 and 2 in the multidimensional scaling analysis with TH birds grouped in major taxonomic units ((A) and (B)) and with RAS birds classified according to membership of breeding season feeding guild ((C) and (D)).

Author Contributions

Formulation of overarching research goals: N.G., R.B., J.D.M., B.G. and E.B.M. Code adjustment: C.R. Selection of species of ERA interest: J.D.M. Data analysis: E.B.M. and C.R. Preparation draft MS, N.G. and E.B.M. All authors have read and agreed to the published version of the manuscript.

Funding

This project was funded by Syngenta Crop Protection LLC.

Institutional Review Board Statement

Not applicable.

Informed Consent Statement

Not applicable.

Data Availability Statement

Bird species are listed in the Supplementary Information. Data used in the analysis are available from the AmP database [15] (accessed 31 January 2023) and can be extracted using functions of AmPTool [30]. The model code and files are available at GITHUB: https://github.com/ibacon-GmbH-Modelling/Bird_trait_patterns_ERA.

Acknowledgments

We are indebted to Maxime Vaugeois for critically reviewing the manuscript.

Conflicts of Interest

N.G., R.B. and J.D.M. are employed by Syngenta Crop Protection, which produces and sells agrochemicals. E.B.M., C.R. and B.G. are employed by ibacon GmbH, which conducts contract research for chemical industries.

References

  1. OECD. Test No. 206: Avian Reproduction Test; Organisation for Economic Co-Operation and Development: Paris, France, 1984; Available online: https://www.oecd-ilibrary.org/environment/test-no-206-avian-reproduction-test_9789264070028-en (accessed on 14 September 2022).
  2. US EPA. Ecological Effects Test Guidelines OCSPP 850.2300: Avian Reproduction Test; Guideline EPA-HQ-OPPT-2009-0154-0012; US EPA: Washington, DC, USA, 2012; pp. 1–27. [Google Scholar]
  3. EFSA; Aagaard, A.; Berny, P.; Chaton, P.-F.; Antia, A.L.; McVey, E.; Arena, M.; Fait, G.; Ippolito, A.; Linguadoca, A.; et al. Risk assessment for Birds and Mammals. EFSA J. 2023, 21, e07790. [Google Scholar] [CrossRef]
  4. Galic, N.; Forbes, V.E.; Grimm, V.; Schmolke, A.; Vaugeois, M.; Brain, R.A. Ecological risk assessment when species-specific data are scarce: How trait-based approaches and modeling can help. BioScience, in press.
  5. Moore, A.P.; Galic, N.; Brain, R.A.; Hornbach, D.J.; Forbes, V.E. Validation of freshwater mussel life-history strategies: A database and multivariate analysis of freshwater mussel life-history traits. Aquat. Conserv. 2021, 31, 3386–3402. [Google Scholar] [CrossRef]
  6. Schmolke, A.; Galic, N.; Feken, M.; Thompson, H.; Sgolastra, F.; Pitts-Singer, T.; Elston, C.; Pamminger, T.; Hinarejos, S. Assessment of the Vulnerability to Pesticide Exposures Across Bee Species. Environ Toxic Chem. 2021, 40, 2640–2651. [Google Scholar] [CrossRef] [PubMed]
  7. Etterson, M.A.; Bennett, R.S.; Kershner, E.L.; Walk, J.W. Markov chain estimation of avian seasonal fecundity. Ecol. Appl. 2009, 19, 622–630. [Google Scholar] [CrossRef] [PubMed]
  8. US EPA. Markov Chain Nest Productivity Model. 2017. Available online: https://www.epa.gov/chemical-research/markov-chain-nest-productivity-model (accessed on 1 June 2023).
  9. Nisbet, R.M.; Muller, E.B.; Lika, K.; Kooijman, S.A.L.M. From molecules to ecosystems through dynamic energy budget models. J. Anim. Ecol. 2000, 69, 913–926. [Google Scholar] [CrossRef]
  10. Kooijman, S.A.L.M. Dynamic Energy Budget Theory for Metabolic Organisation; Cambridge University Press: Cambridge, UK, 2010. [Google Scholar]
  11. Jusup, M.; Sousa, T.; Domingos, T.; Labinac, V.; Marn, N.; Wang, Z.; Klanjšček, T. Physics of metabolic organization. Phys. Life Rev. 2017, 20, 1–39. [Google Scholar] [CrossRef]
  12. Jager, T.; Goussen, B.; Gergs, A. Using the standard DEB animal model for toxicokinetic-toxicodynamic analysis. Ecol. Model. 2023, 475, 110187. [Google Scholar] [CrossRef]
  13. Kooijman, S.A.L.M. Energy budgets can explain body size relations. J. Theor. Biol. 1986, 121, 269–282. [Google Scholar] [CrossRef]
  14. Kooijman, S.A.L.M.; Lika, K.; Augustine, S.; Marn, N. Multidimensional scaling for animal traits in the context of dynamic energy budget theory. Conserv. Physiol. 2021, 9, coab086. [Google Scholar] [CrossRef]
  15. Add My Pet Portal. Available online: http://www.bio.vu.nl/thb/deb/deblab/add_my_pet/ (accessed on 24 October 2022).
  16. Lika, K.; Augustine, S.; Kooijman, S.A.L.M. The comparative energetics of the ray-finned fish in an evolutionary context. Conserv. Physiol. 2022, 10, coac039. [Google Scholar] [CrossRef]
  17. Kooijman, S.A.L.M.; Augustine, S. The comparative energetics of the carnivorans and pangolins. Conserv. Physiol. 2022, 10, coac052. [Google Scholar] [CrossRef]
  18. Marn, N.; Kooijman, S.A.L.M. The comparative energetics of the turtles and crocodiles. Ecol. Evol. 2022, 12, e8996. [Google Scholar] [CrossRef]
  19. Kooijman, S.A.L.M.; Augustine, S. The comparative energetics of the cephalopods: They neither grow nor reproduce fast. J. Sea Res. 2022, 184, 102205. [Google Scholar] [CrossRef]
  20. Kooijman, S.A.L.M. Waste to hurry: Dynamic energy budgets explain the need of wasting to fully exploit blooming resources. Oikos 2013, 122, 348–357. [Google Scholar] [CrossRef]
  21. Lika, K.; Augustine, S.; Pecquerie, L.; Kooijman, S.A.L.M. The bijection from data to parameter space with the standard DEB model quantifies the supply–demand spectrum. J. Theor. Biol. 2014, 354, 35–47. [Google Scholar] [CrossRef]
  22. Billerman, S.M.; Keeney, B.K.; Rodewald, P.G.; Schulenberg, T.S. Birds of the World. Available online: https://birdsoftheworld.org/bow/home (accessed on 24 October 2022).
  23. Bennett, R.S.; Etterson, M.A. Estimating Pesticide Effects on Fecundity Rates of Wild Birds Using Current Laboratory Reproduction Tests. Hum. Ecol. Risk Assess. Int. J. 2006, 12, 762–781. [Google Scholar] [CrossRef]
  24. Mineau, P. A Review and Analysis of Study Endpoints Relevant to the Assessment of “Long Term” Pesticide Toxicity in Avian and Mammalian Wildlife. Ecotoxicology 2005, 14, 775–799. [Google Scholar] [CrossRef] [PubMed]
  25. Bennett, R.S.; Etterson, M.A. Incorporating Results of Avian Toxicity Tests into a Model of Annual Reproductive Success. Integr. Environ. Assess. Manag. 2007, 3, 498. [Google Scholar] [CrossRef] [PubMed]
  26. Ehrlich, P.R.; Dobkin, D.S.; Wheye, D. The Birder’s Handbook: A Field Guide to the Natural History of North American Birds: Including All Species That Regularly Breed North of Mexico; Simon & Schuster: New York, NY, USA, 1988; ISBN 978-0-671-62133-9. [Google Scholar]
  27. Lika, K.; Kearney, M.R.; Freitas, V.; van der Veer, H.W.; van der Meer, J.; Wijsman, J.W.M.; Pecquerie, L.; Kooijman, S.A.L.M. The “covariation method” for estimating the parameters of the standard Dynamic Energy Budget model I: Philosophy and approach. J. Sea Res. 2011, 66, 270–277. [Google Scholar] [CrossRef]
  28. Marques, G.M.; Augustine, S.; Lika, K.; Pecquerie, L.; Domingos, T.; Kooijman, S.A.L.M. The AmP project: Comparing species on the basis of dynamic energy budget parameters. PLoS Comput. Biol. 2018, 14, e1006100. [Google Scholar] [CrossRef]
  29. Add My Pet Parameter Estimation. Available online: https://debportal.debtheory.org/docs/AmPestimation.html#Introduction (accessed on 12 June 2024).
  30. AmPTool. 2023. Available online: https://github.com/addmy-pet/AmPtool (accessed on 31 January 2023).
  31. Ducatez, S.; Field, D.J. Disentangling the avian altricial-precocial spectrum: Quantitative assessment of developmental mode, phylogenetic signal, and dimensionality. Evolution 2021, 75, 2717–2735. [Google Scholar] [CrossRef] [PubMed]
Figure 1. Correlation map of terrestrial Holarctic bird traits selected for MDS. Ages and sizes at life stage transitions relatively strongly correlate with ultimate size and lifespan, as does the maximum time it takes a well-fed adult bird to completely deplete its energy reserve for maintenance purposes. In addition, supply stress positively correlates with the age at puberty, implying that species that mature relatively late tend to be more demand-driven in their feeding behavior than earlier maturing species. Parameter and trait symbols are defined in Table 1.
Ecologies 05 00022 g001
Figure 2. Selected primary parameter values of Risk Assessment Species (RAS, blue) and non-RAS terrestrial Holarctic birds (TH, open circles), as well as the standard test species mallard (1), northern bobwhite (2), and zebra finch (3) as a function of their ultimate body weight. RAS species are representative of TH birds. Across TH and RAS birds, the specific maximum assimilation rate (A) and the maturity levels for birth (E) and puberty (F) tend to increase with body size, whereas the energy conductance (B), specific somatic maintenance rate (C), and the allocation fraction to soma (D) appear invariant with body size. These trends are as expected on the basis of DEB theory [9,13]. The primary parameter values of the zebra finch are typical for birds of comparable size, whereas those of the mallard and northern bobwhite appear more divergent, notably the energy conductance and allocation fraction to soma.
Ecologies 05 00022 g002
Figure 3. Selected secondary parameter values of Risk Assessment Species (RAS, blue) and non-RAS terrestrial Holarctic birds (TH, open circles) as well as the lab species mallard (1), northern bobwhite (2), and zebra finch (3) as a function of their ultimate body weight. RAS species are representative of TH birds. Across TH and RAS birds, the von Bertalanffy growth rate (A), maximum starvation survival time (B), and reserve capacity (C) tend to scale with body size, whereas the supply stress (E) and precociality coefficient (F) are invariant with body size. The ultimate reproduction rate (D) also appears independent of body size, but it should be noted that this quantity is expressed as number of eggs; since larger birds tend to lay larger eggs, the rate of total investment in reproduction increases with body size. These trends are as expected on the basis of DEB theory [9,13]. As for its primary parameters, secondary parameter values of the zebra finch are typical for birds of comparable size, whereas those of the mallard and northern bobwhite appear more divergent, notably the von Bertalanffy growth rate, maximum starvation survival time, and ultimate reproduction rate.
Ecologies 05 00022 g003
Figure 4. Reserve capacity increases with the maximum specific assimilation rate in terrestrial Holarctic birds (TH) and Risk Assessment Species (A), which demonstrates that these birds follow the physical co-variation rules that explain body-size-scaling relationships in DEB theory. The positive trends apparent in maximum assimilation versus somatic maintenance rates (B) and in somatic maintenance rates versus reserve capacity (C) are indicative of the so-called waste-to-hurry strategy, which in the present context indicates that TH birds must be nearly full-grown at the time of fledging or at least by the end of the first season, regardless of their ultimate size (D).
Ecologies 05 00022 g004
Figure 5. Multidimensional scaling of selected traits of terrestrial Holarctic birds plus zebra finch. Eigenvalues (dots) drop rapidly with increasing rank, implying that the first three eigenvectors (red dots) or axes are sufficient to capture most trait differences among species (A). Traits reflecting ages, sizes, and starvation survival times are largely decomposed on the first axis, as indicated by the relatively high (absolute) values of their corresponding correlation coefficients, while survival stress and age at puberty map relatively strongly on the second axis, and supply stress and somatic maintenance on the third axis (B). Grouping of major taxonomic groups of birds in two-dimensional eigenspace (C). Grouping of major taxonomic groups of TH birds in two-dimensional eigenspace; Risk Assessment Species (RAS) are identified with a small open circle within the marker identifying taxonomic groups (C). Grouping of feeding guild membership (during breeding season) of RAS birds (D).
Ecologies 05 00022 g005
Table 1. Symbols, units and definitions (with elaboration) of parameters and traits.
Primary DEB parameters 1
E H b JMaturity threshold of birth
E H p JMaturity threshold of puberty
{ p ˙ A m } J cm−2Surface-area-specific maximum assimilation rate (assimilation capacity)
p ˙ M J cm−3Volume-specific somatic maintenance rate
v ˙ cm day−1Energy conductance (measures how fast ingested food is made available for production, maintenance and maturation)
κ -Allocation fraction to soma (fraction of mobilized energy reserve allocated to growth and somatic maintenance)
Secondary parameters and traits 2
a b dayAge at birth (counted from time of egg fertilization)
a m dayMaximum age
a p dayAge at puberty 3
E m J cm−3Reserve capacity
r ˙ B day−1Von Bertalanffy growth rate
R # day−1Maximum reproduction rate
s H b p -Precociality coefficient (ratio of maturity thresholds of birth and puberty)
s s -Supply stress (measures maintenance requirements relative to assimilation capacity)
t s t a r v e dayMaximum starvation time (time to deplete energy reserve in well-fed, full grown bird if only used for somatic maintenance demands)
W b w gWet weight at birth
W p w gWet weight at puberty
W w gUltimate wet weight (weight of a full-grown, well-fed adult)
1 rates normalized to 20 °C; 2 values calculated assuming abundant food conditions; 3 age at which the bird has sufficiently matured to start reproduction; age at first egg laying may be substantially older.
Disclaimer/Publisher’s Note: The statements, opinions and data contained in all publications are solely those of the individual author(s) and contributor(s) and not of MDPI and/or the editor(s). MDPI and/or the editor(s) disclaim responsibility for any injury to people or property resulting from any ideas, methods, instructions or products referred to in the content.

