Article

On the Scalability of a Membrane Unit for Ultrapure Hydrogen Separation

ENEA, Nuclear Department, Via E. Fermi 45, 00044 Frascati, RM, Italy
*
Author to whom correspondence should be addressed.
Hydrogen 2024, 5(2), 149-162; https://doi.org/10.3390/hydrogen5020010
Submission received: 22 March 2024 / Revised: 12 April 2024 / Accepted: 15 April 2024 / Published: 17 April 2024

Abstract

:
Hydrogen permeation sparked a renewed interest in the second half of the 20th century due to the favorable features of this element as an energy factor. Furthermore, niche applications such as nuclear fusion gained attention for the highest selectivity ensured by self-supported dense metallic membranes, especially those consisting of Pd-based alloys. In this framework, the ENEA Frascati laboratories have decades of experience in the manufacturing, integration, and operation of Pd-Ag permeators. Most of the experimental investigations were performed on single-tube membranes, proving their performance under relevant operational conditions. Nowadays, once the applicability of this technology has been demonstrated, the scalability of the single-tube experience over medium- and large-scale units must be verified. To do this, ENEA Frascati laboratories have designed and constructed a multi-tube permeator, namely the Medium-Scaled Membrane Reactor (MeSMeR), focused on scalability assessment. In this work, the results obtained with the MeSMeR facility have been compared with previous experimental campaigns conducted on single-tube units, and the scalability of the permeation results has been proven. Moreover, post-test simulations have been performed based on single-tube finite element modeling, proving the scalability of the numerical outcomes and the possibility of using this tool for scale-up design procedures.

1. Introduction

In the 19th century, the capability of hydrogen to permeate through solid surfaces was discovered by Deville and Troost [1,2], and some years later, Graham observed the possibility of hydrogen sorption in the palladium lattice, assessing an amount close to a hundred times the metal’s volume [3]. Nevertheless, the technological application of this phenomenon was inhibited until the second half of the 20th century, when the scientific community started to face the issue of climate change [4]. In this framework, hydrogen, the most abundant element in the universe, presents favorable characteristics as an energy vector, making it one of the most desirable candidates for the transition from fossil fuels to renewable energy [5,6].
Nowadays, hydrogen production still relies on fossil fuels (e.g., methane and hydrocarbons [7,8,9,10]); thus, to accomplish the goals of the energy transition, an improvement in the efficiency of the production and purification processes is needed [11]. Compared with the most conventional technologies (i.e., pressure swing adsorption and cryogenic distillation), membranes are modular, compact, and relatively easy to operate [12,13], and they ensure considerable energy and cost savings [9,12,14]. Although environmental and climate challenges were the main R&D drivers for membranes, interest in this technology is growing in the nuclear fusion field due to the need to separate and recover tritium and deuterium from multiple gaseous streams and reuse them as fuel in the reactor [15,16]. As a matter of fact, membranes allow continuous separation, reducing the residence time of tritium and thus its inventory [17].
Membranes can be classified as organic (polymer or carbon) or inorganic (metallic or ceramic). Among these latter, dense metallic membranes exhibit the highest selectivity for hydrogen. Different metals can be used, such as niobium, vanadium, tantalum, and palladium, but the latter exhibits the highest selectivity and permeation rate of hydrogen [6]. Nevertheless, palladium has some drawbacks that can be overcome by alloying it with other metals, e.g., silver. In fact, the presence of hydrogen in the palladium lattice embrittles at temperatures lower than 300 °C, and if exposed to certain chemicals (e.g., H2S, HCl, and CO), it can be poisoned and the permeation inhibited [6]. Silver, in a percentage between 23 and 25 wt.%, reduces the embrittlement phenomenon and increases the resistance to sulfur poisoning [6,18,19].
Dense metal membranes can be ranked as unsupported or supported. In the first case, the membrane itself must guarantee the required mechanical stability and is thus characterized by a thickness greater than 50 µm. On the other hand, supported membranes consist of a thick metallic layer deposited onto a support, providing mechanical stability [20]. Looking at the Richardson equation (Equation (1), where Q stands for the hydrogen isotopes H, D, and T), the hydrogen permeation flux (JQ2) is proportional to the hydrogen permeability (Pe) through the membrane and the difference between the hydrogen partial pressure to the power of n between the retentate (ret) and the permeate (per) side, and decreases with the increase of the membrane thickness (th) [4,21]. Therefore, supported membranes allow higher hydrogen permeance than unsupported ones. Moreover, if expensive metal is used (e.g., palladium), the cost of unsupported membranes is higher, although the possibility to recover and recycle the material reduces the cost issue.
J Q 2 = P e t h p Q 2 , r e t n p Q 2 , p e r n
On the other hand, it is difficult to manufacture an ultrathin metallic layer without defects, affecting the selectivity of the membrane [4,11]. For this reason, in applications where ultrapure hydrogen (protium, deuterium, and tritium) must be ensured, e.g., nuclear fusion applications, unsupported membranes should be preferred [22].
Focusing on the fusion field, Pd-based membranes are the reference technologies for the separation of hydrogen isotopes from the gaseous stream, and they are also a promising solution to recover tritium from tritiated compounds [18]. As a matter of fact, the separation task can be integrated into a reactor, forming the so-called membrane reactor, where the conversion efficiency of the reaction is enhanced by the equilibrium shift due to the continuous removal of one of the products, i.e., the hydrogen isotope.
The possibility of exploiting Pd-based membranes for the aforementioned tasks was extensively investigated at the ENEA Frascati laboratories. Several experiments were conducted on a single-tube Pd-Ag permeator to test this technology for the purification of hydrogen streams [23,24] and the recovery of hydrogen isotopes from water through water gas shift and isotope swamping reactions [25,26]. The test section consists of the unsupported membrane, which is 500 mm long and characterized by a diameter of 10 mm and a thickness of around 100 µm. Once the process capability is verified and characterized, the step forward to an improved technological readiness level passes through the verification of the scalability of the permeation, i.e., through the test of a multi-tube module that can constitute the modular element for a complex system. This is the scope of this paper, presenting the experimental campaign carried out at ENEA Frascati laboratories with a multi-tube permeator consisting of ten Pd-Ag unstructured membranes. The tests are performed under conditions relevant for fusion applications, and experimental outcomes are compared with the results of previous campaigns and used for the verification of the scale-up procedure and for code validation.

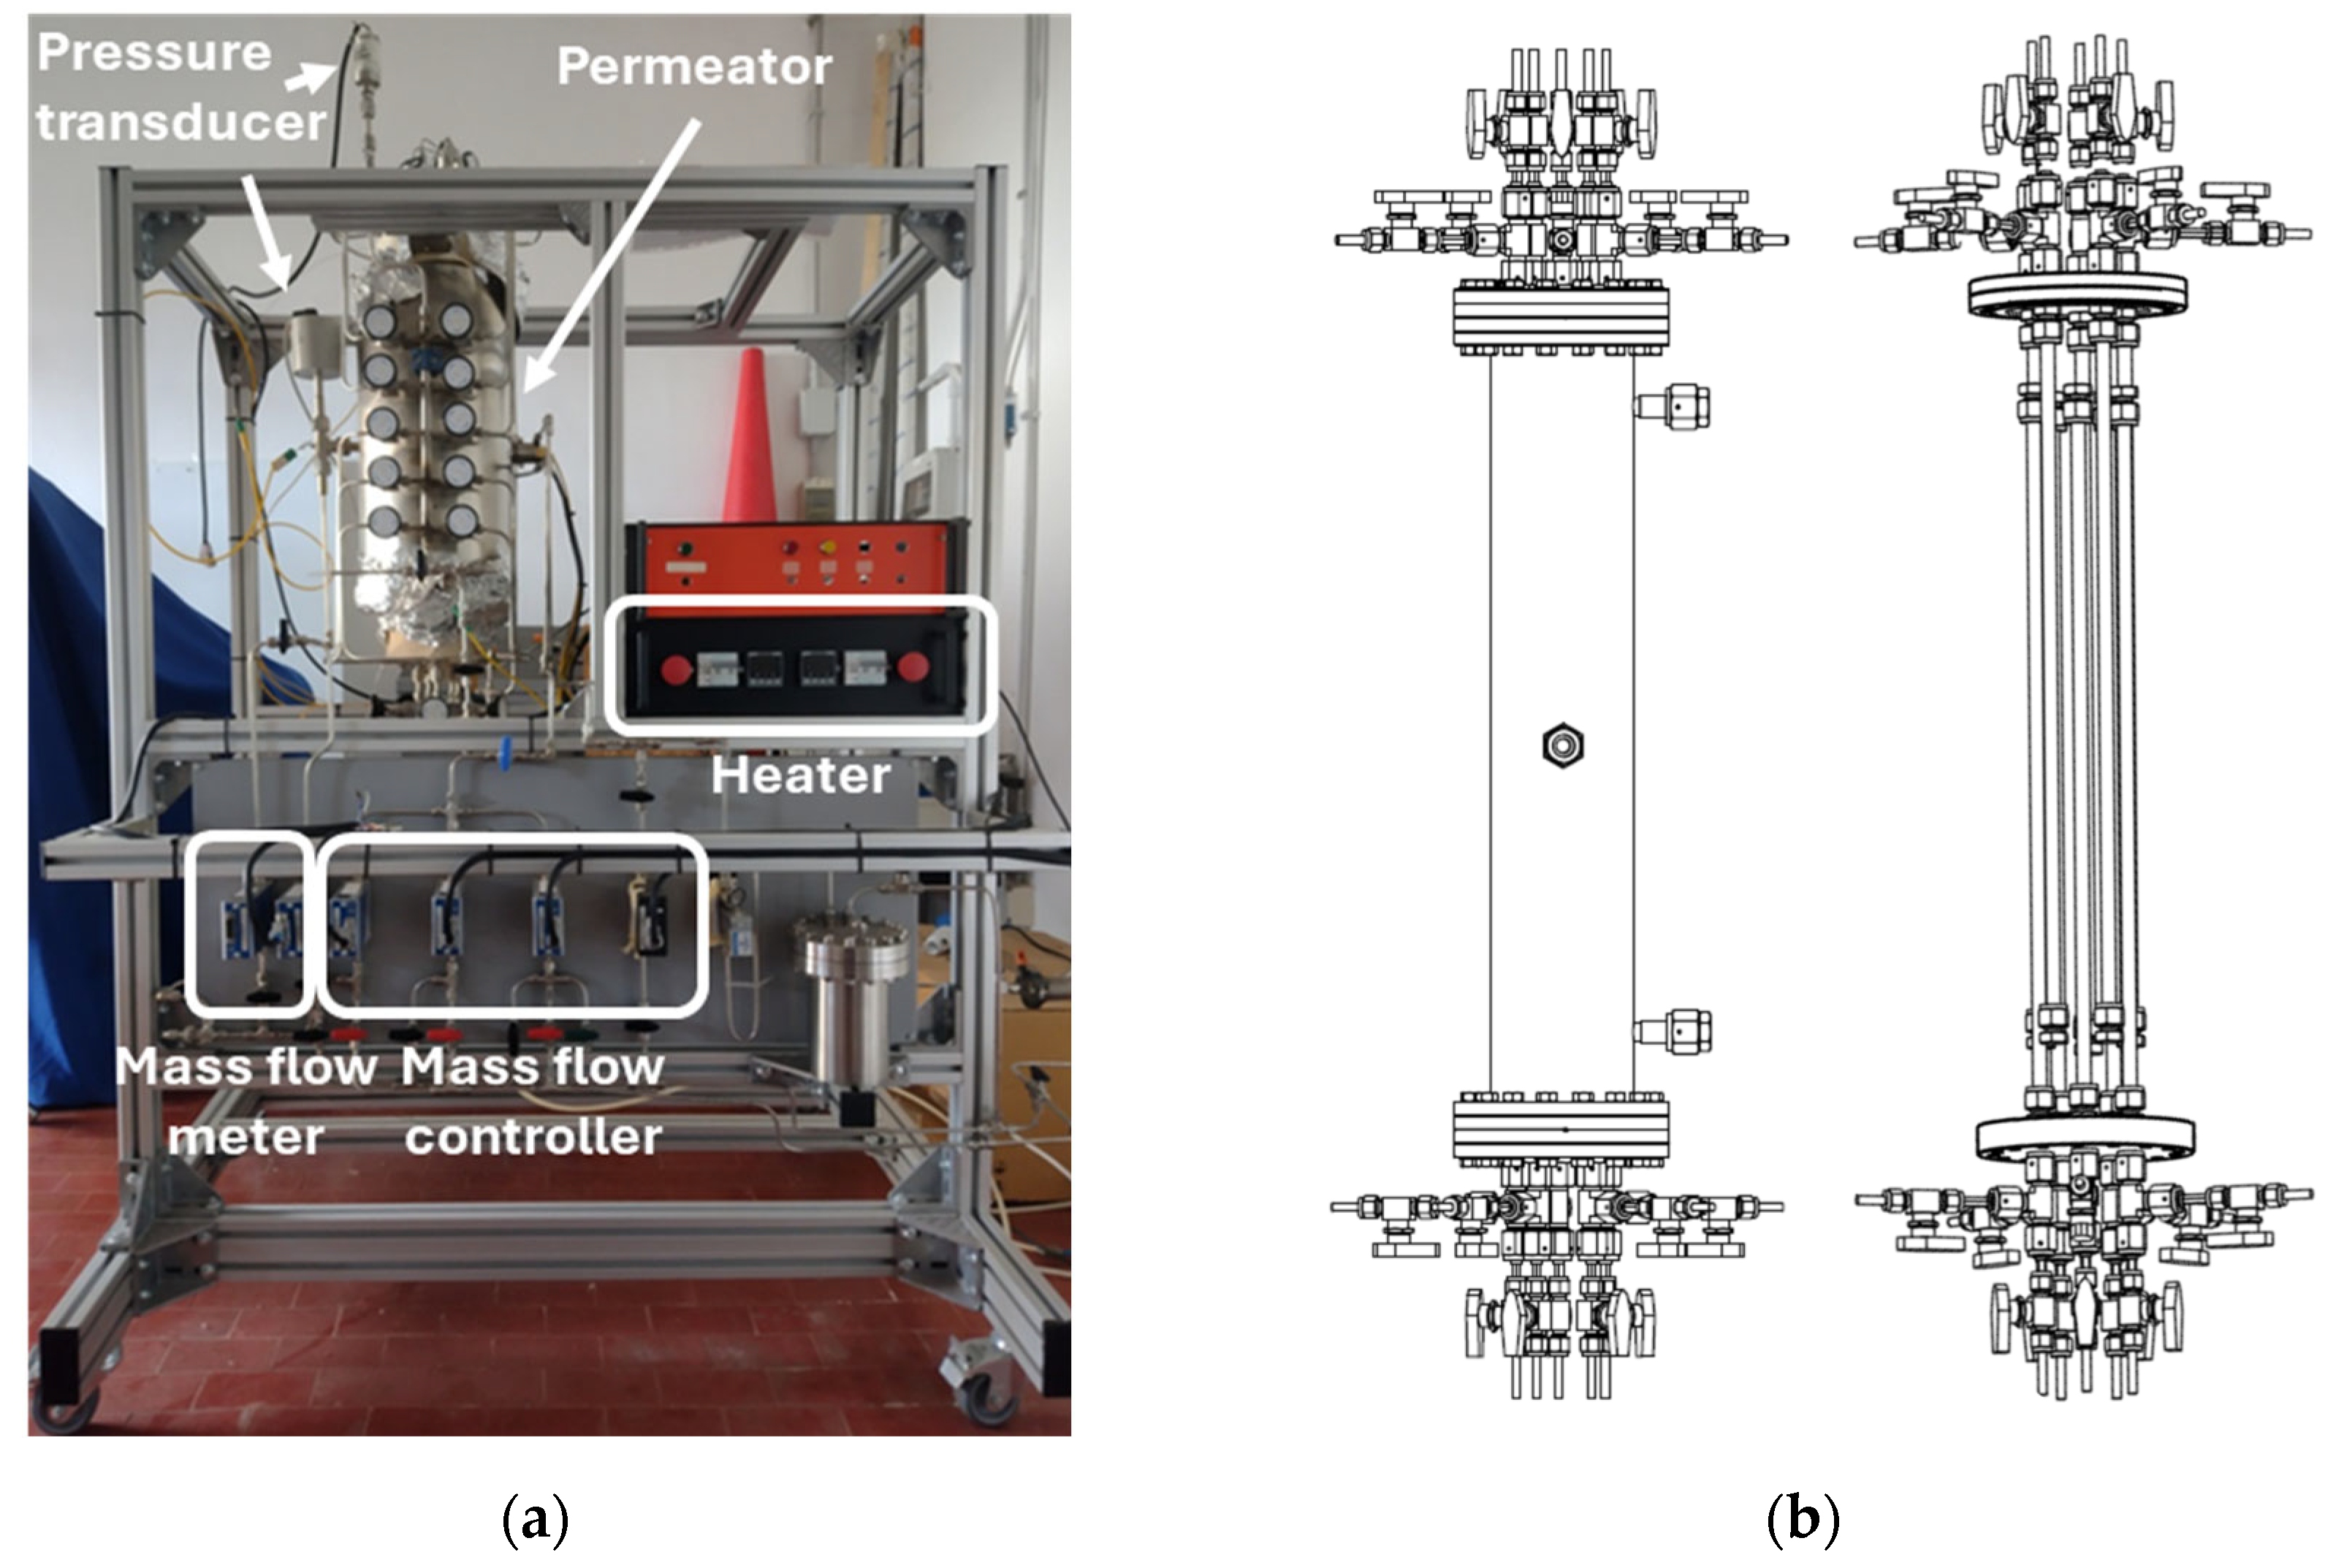
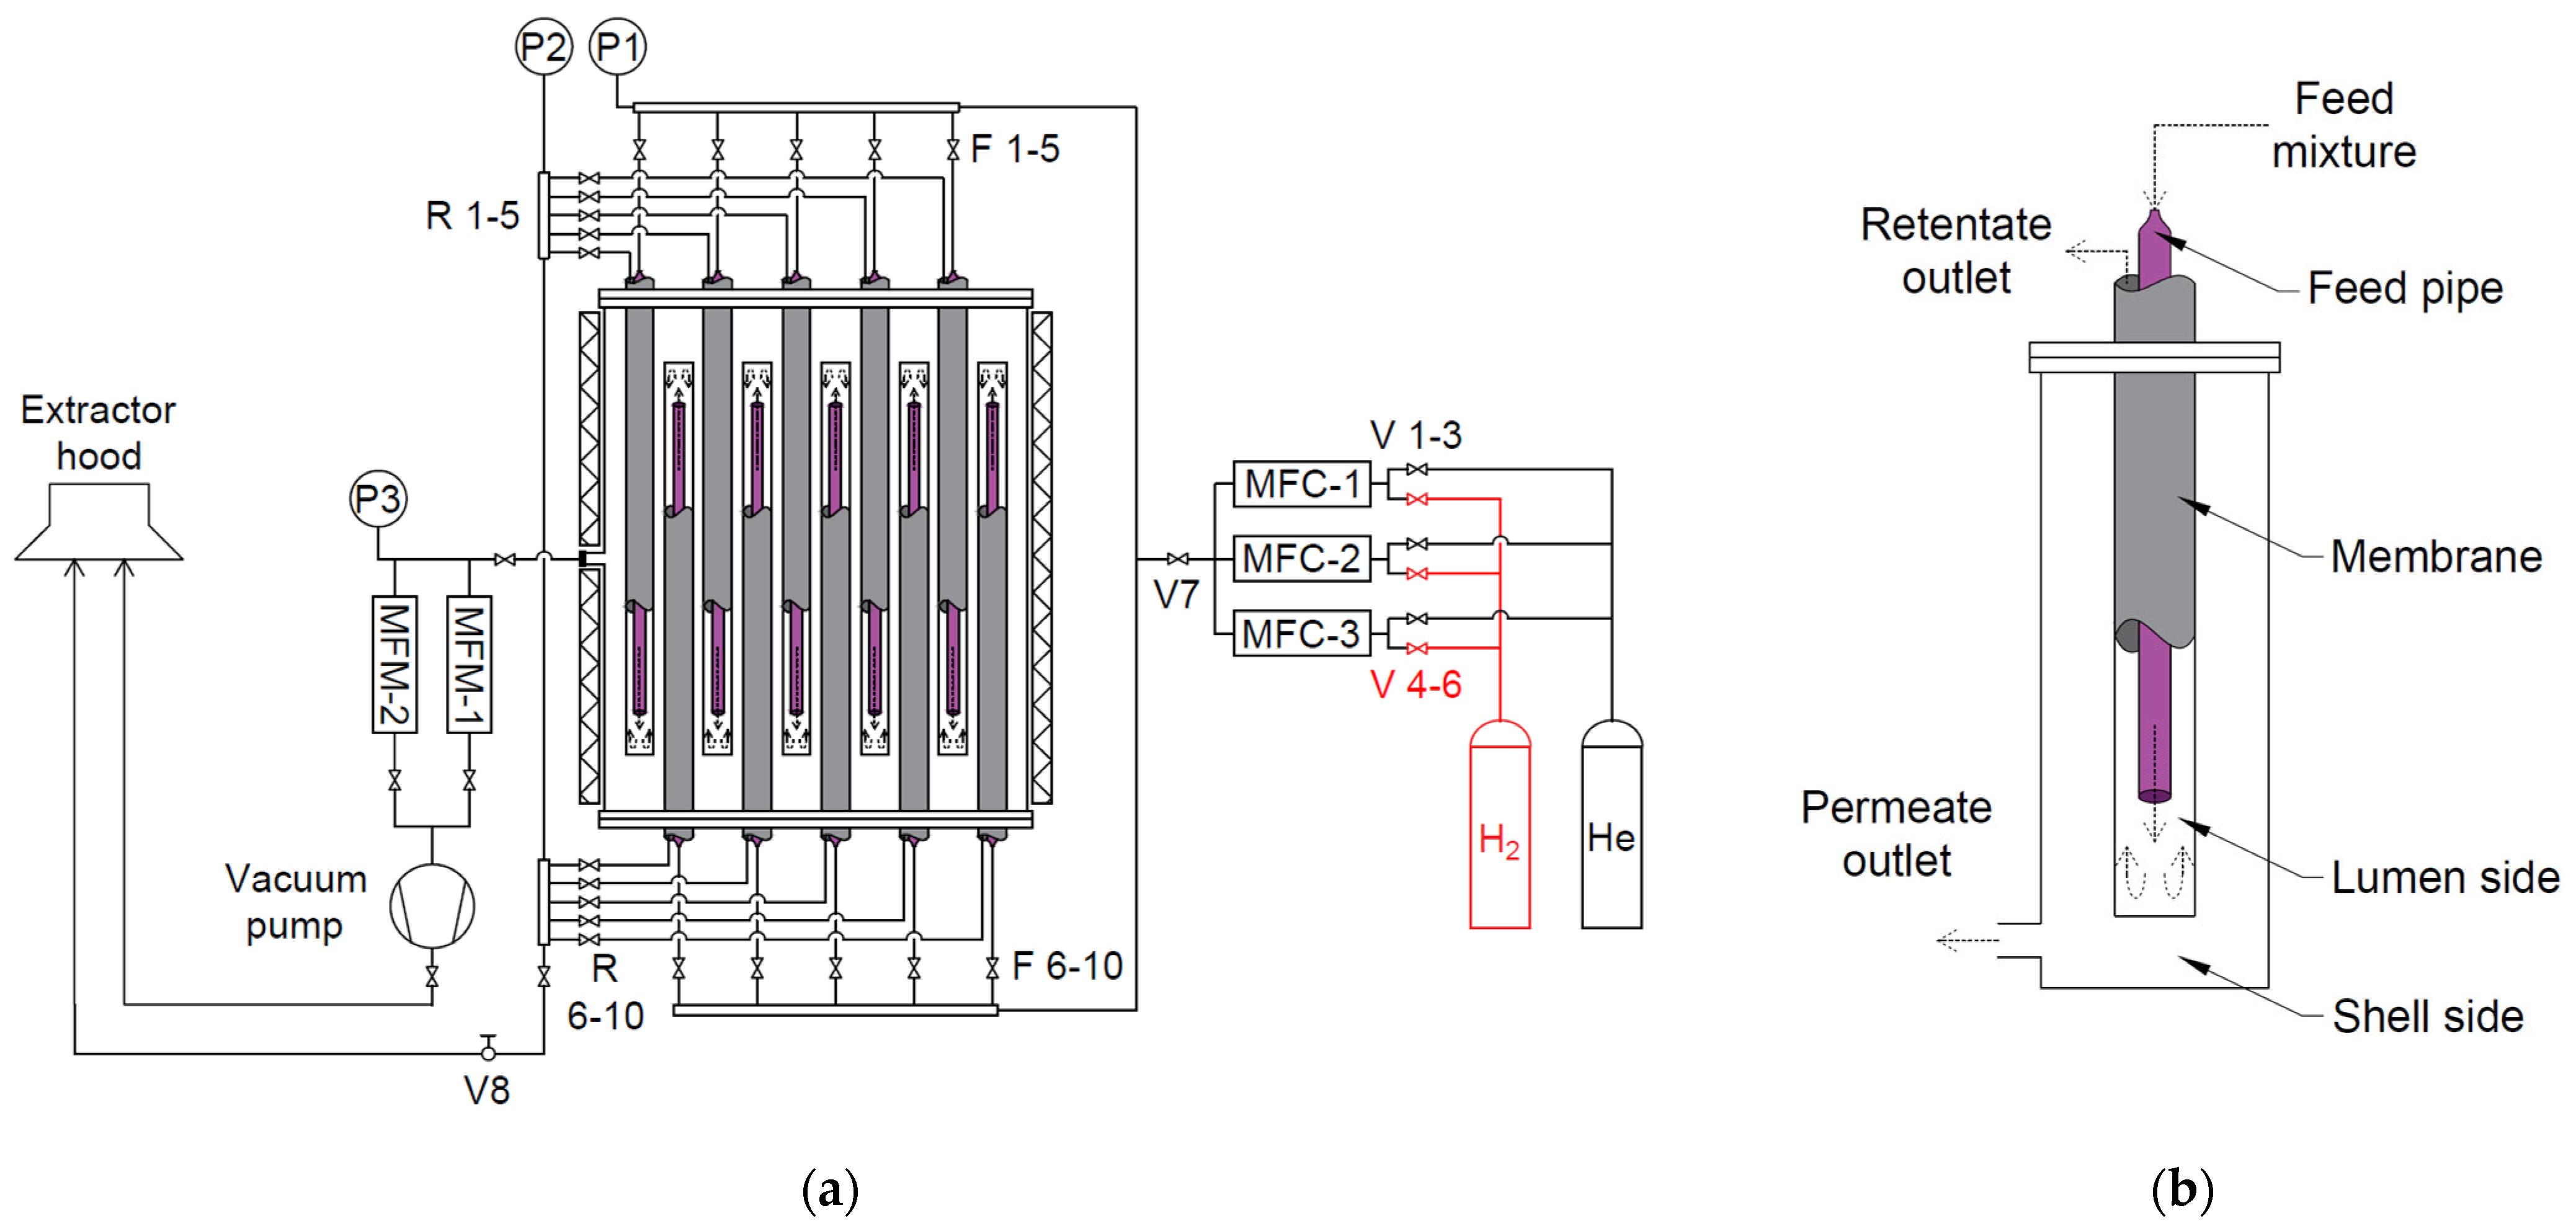
2. The Experimental Setup

The Medium-Scaled Membrane Reactor (MeSMeR) is depicted in Figure 1a [27]. It is a multipurpose facility where different test sections can be installed through two CF100 flanges. The core element is the permeator (see Figure 1b), consisting of a cylindrical electrically heated shell, 574 mm long with an internal diameter of 98 mm, vertically oriented. Test sections are installed through the flanges at the top and bottom of the shell. For the present activity, two modules are tested, each consisting of five Pd-Ag membranes arranged in a circular lattice (see Figure 1b), characterized by length and diameter approximately equal to 500 mm and 10 mm, respectively. The schematic flow path is presented in Figure 2, where the shell and the permeator arrangement are linearized for the sake of description. Each module is equipped with five valves in the feed line (F in Figure 2) and five valves in the retentate line (retentate stands for the gas throughput not permeated), allowing the facility to operate with a changeable number of membranes, from 1 to 10.
Feed throughput is elaborated with three mass flow controllers (MFCs), connected to the pure gas cylinders (see Figure 2a), through which the needed mixture composition is prepared. Figure 2b presents a schematic view, considering a single membrane for the sake of simplicity, of the coupling sections between the pipes and the permeator. Gas enters the unit through the feed pipes, depicted in purple in Figure 2a,b, and is released in the annular region between the feed pipe and the membrane (in grey in Figure 2a,b), i.e., the lumen side, where it is free to permeate while flowing towards the retentate outlet. The permeator can be operated in closed or open modes, the first one being adopted for permeability tests and the latter for permeation tests. In the first option, the retentate line is closed by means of valve V8. In this case, eventual impurities in the feed stream remain trapped in the lumen side of the membranes, leading to an increase in the total pressure depending on the impurity inlet flow rate. On the other hand, when operated in open mode, the facility is fed with a proper mixture consisting of hydrogen plus impurities (e.g., helium), and the desired total pressure on the lumen side is obtained by regulating the valve V8, whose opening rate depends on the desired total pressure and on the retentate throughput. Thus, the retentate gas, consisting of the impurities plus residual hydrogen not permeated, is continuously evacuated from the lumen side of the permeator. For both operational modes, the shell side pressure is fixed by the vacuum pump that continuously removes the permeated hydrogen.
In order to monitor the pressure of the facility, two pressure transducers are installed to collect lumen side total pressure at the feed and retentate lines of the permeator. The two pressure transducers are indicated as P1 and P2 in Figure 2, respectively. In closed mode, the two devices measure the same pressure, whereas under open operation, the difference between the two measurements is representative of the hydraulic pressure drops of the gas mixture flowing through the lumen side of the membranes. On the shell side, a compact capacitance gauge (P3 in Figure 2) monitors the pressure on the shell side. Thus, the permeation driving force is represented by the difference between the geometric mean calculated between P1 and P2 minus P3, considering the proper exponent as expressed in Equation (1).The permeated throughput is measured upstream of the vacuum pump by one of the two mass flow meters (MFMs) installed in the permeate line, depending on the expected throughput. Finally, both the permeate and retentate flow rates are vented through the extractor hood.
Permeation is a temperature-activated process; thus, the required temperature is reached by means of electrically heated cables applied to the outer surface of the shell that warm the membranes by thermal radiation. Heating cables are connected to a proportional, integral, and derivative control system, allowing them to reach and maintain the desired temperature.
A list of the instrumentation, along with the measurement range and the associated accuracy, is presented in Table 1. Moreover, several thermocouples (accuracy of ±1.5 °C) are installed to monitor shell side temperature in three relevant positions (i.e., at the bottom, middle, and top), to control the heating cables, and to monitor the surface temperature of the shell.

2.1. Rationale of the Scale-Up Tests

In the recent past, the performance of Pd-Ag membranes was extensively investigated at ENEA Frascati Laboratories using a single-tube permeator. The Hydrogen Frascati Membrane (HyFraMe) facility was conceived for deep characterization of the permeation, monitoring several parameters. The single-tube frame allows precise control of the feed and permeate flow rate, and three pressure transducers ensure pressure monitoring on the lumen and shell sides. The membrane is directly heated by the Joule effect, and its temperature is monitored at three points with thermocouples installed on the membrane’s outside wall, thus providing a detailed temperature profile (refer to the work of Narcisi et al. [23] for further details).
The HyFraMe provided information useful for exploiting such technology for stringent needs in nuclear fusion engineering. Nevertheless, the feasibility assessment of a large-scale system is out of its scope, and for this purpose, the MeSMeR facility has been designed and constructed. The scope of the activity is to reproduce relevant experiments performed on HyFraMe to assess the scalability of the results. To do this, the main differences in terms of operation and control between the two facilities are individuated and summarized in Table 2.
The heating mode is one of the main differences between the single-tube and multi-tube modules. In the first case, direct heating allows direct control of the membrane temperature. On the other hand, the radiative heating implemented in the MeSMeR facility can determine a non-homogeneous temperature distribution in the polar coordinates, leading to higher temperatures on the portion of the membrane facing the shell and lower temperatures on the opposite side. The need for radiative heating limits the dimensions of the module and defines the number of membranes along with their arrangement inside the shell, maximizing the radiation view factor (see the work of Incelli et al. [27] for further information on the MeSMeR design). Furthermore, the control and monitoring of operative parameters such as feed throughput and membrane temperature is another relevant difference. The HyFraMe facility allows precise control of the flow rate feeding the membrane, and its wall temperature is measured with thermocouples directly arranged on the wall, ensuring a detailed acquisition of the temperature profile. On the other hand, in the multi-tube module, the total flow rate is controlled, but its distribution through parallel membranes is not monitored. Regarding temperature acquisition, three thermocouples are employed to measure the value at the bulk rather than the wall temperature. Moreover, the disposition of the two membrane sections on the opposite flanges can affect the temperature profile inside the permeator. Finally, manufacturing uncertainties in terms of length, diameter, and thickness can affect the performance of each membrane, generating gradients inside the shell.
All the abovementioned differences can generate distortions in the scaling procedure. The aim of the present work is to evaluate the effect of such distortions.

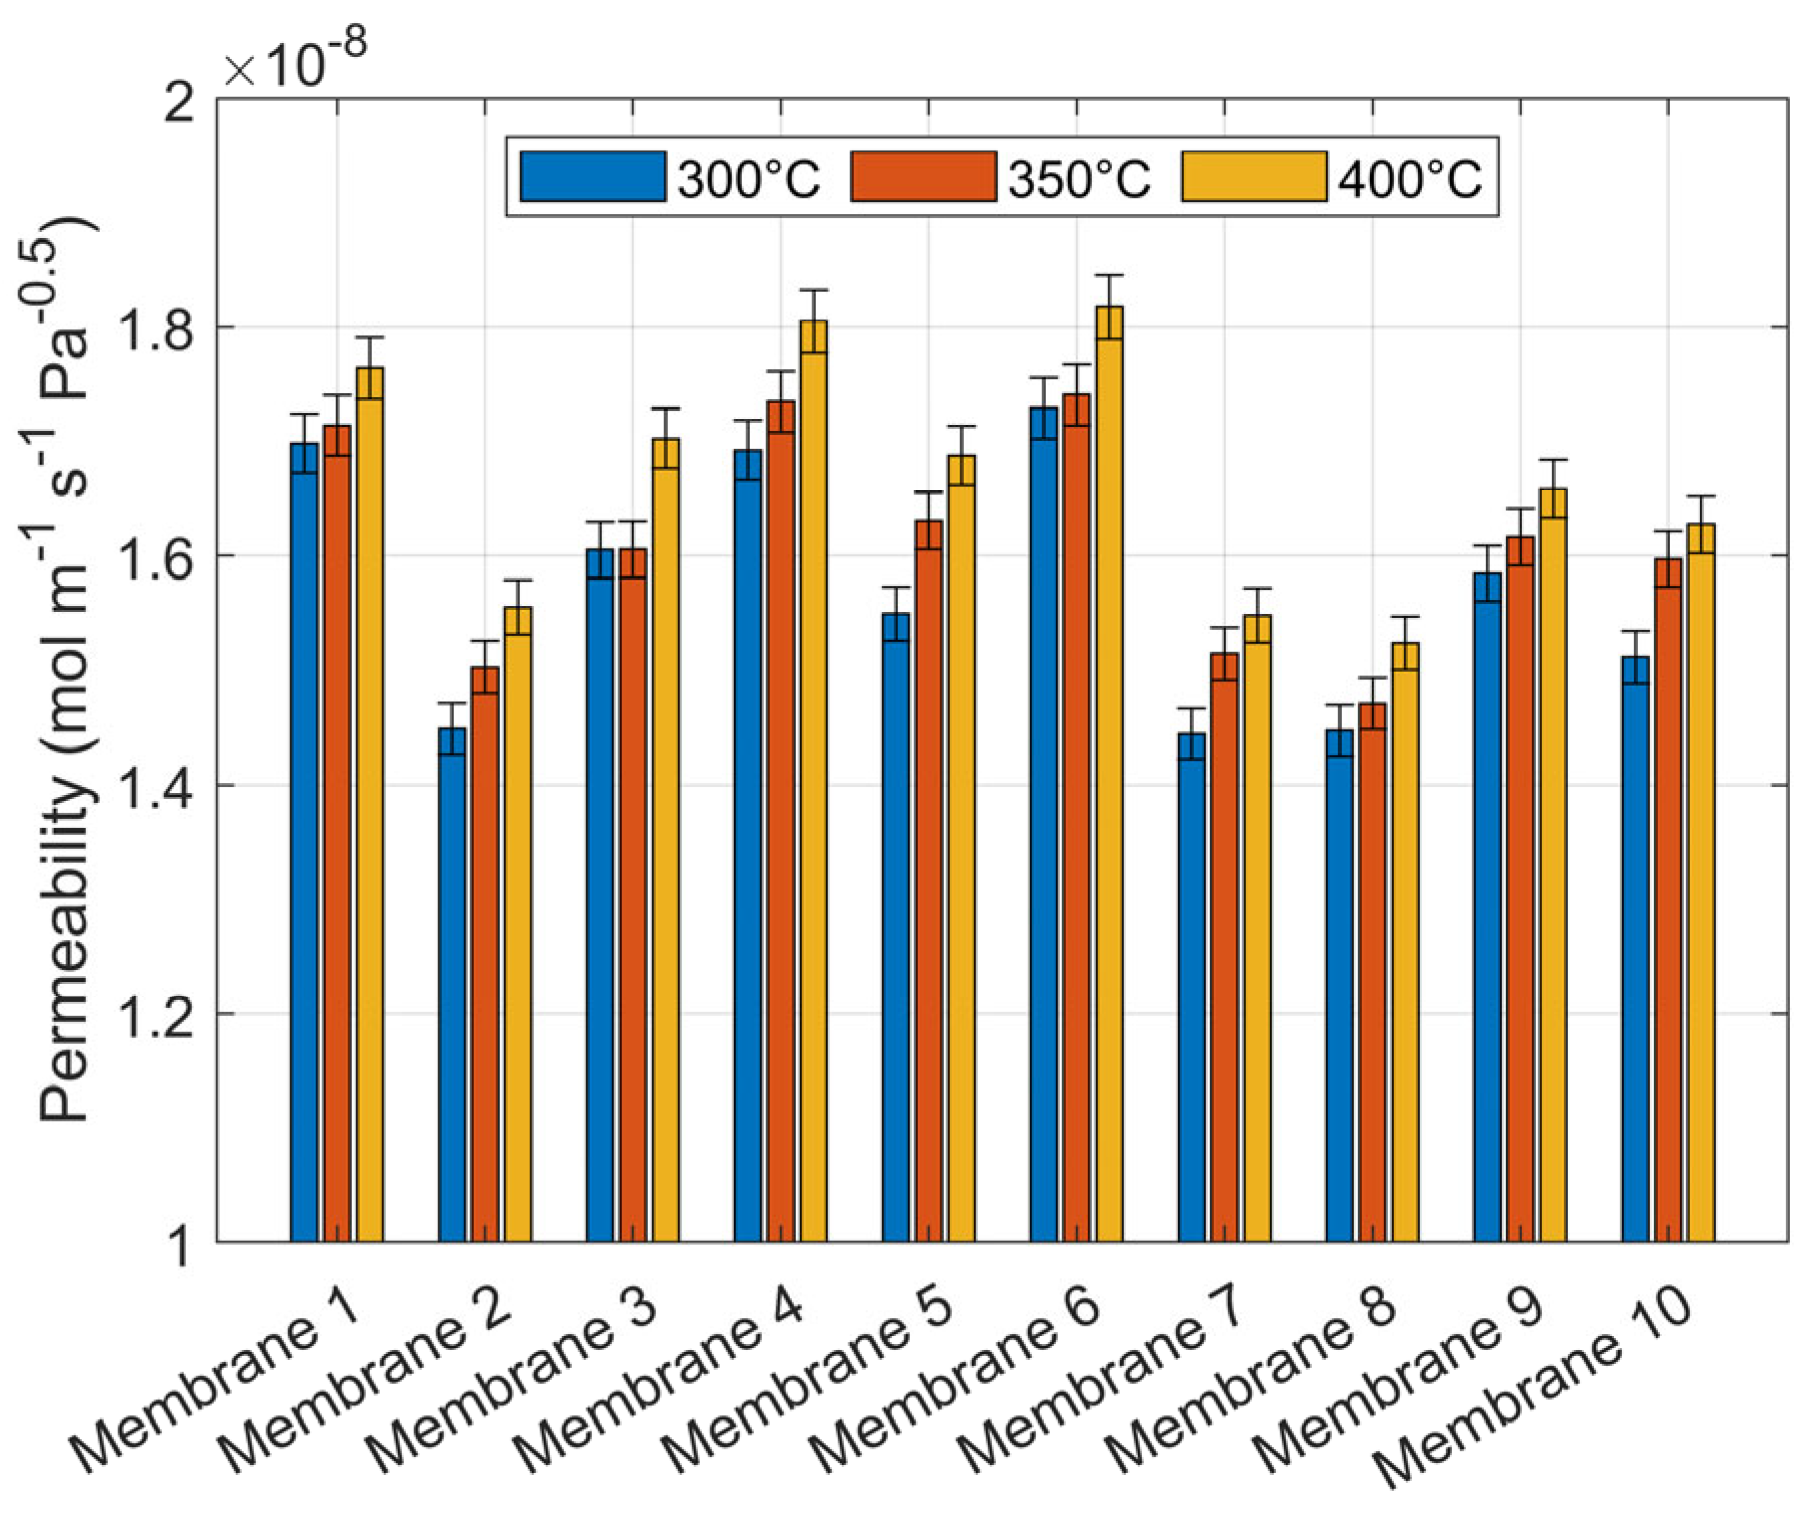
2.2. Characterization Tests

The multi-tube module consists of ten Pd-Ag (approximately 25 wt.% in Ag) membranes in a tubular shape, whose main geometrical features are collected in Table 3 [27]. A preliminary series of tests is performed to characterize the hydraulic and permeability features of the membranes composing the test section. From a hydraulic point of view, different hydraulic pressure drops through parallel membranes could lead to a distorted distribution of the feed flow rate and, thus, non-uniform operation of the membranes. On the other hand, uncertainties in the metal composition could lead to different permeability of the membranes and, thus, distortions in the operation of the multi-tube permeator. To assess such uncertainties, hydraulic tests and permeability tests are carried out.
Hydraulic tests aim at verifying the uniformity of the feed flow distribution through the parallel membranes due to different hydraulic pressure drops. It consists of measuring and characterizing such pressure drops through each membrane, changing the gas flow rate. Tests are conducted in open mode with a pure helium flow rate changing between 6.7 and 12.1 mol h−1. Such throughputs are selected according to the resolution of the pressure transducers P1 and P2. Tests are conducted at ambient temperature and at 400 °C. The main results for the hottest case are summarized in Figure 3, where data are collected for each membrane and flow rates are depicted with different colors (please refer to the online version of the paper for colored figures) and expressed in mol h−1 in the legend. As shown in the graph, pressure drops are well distributed through the different tubes. Membrane 7 presents the lowest pressure drops, but, taking it as a reference, the discrepancy settles between 20% and 35% for most of the cases, with a peak of 50% for membrane 5 at 10.8 mol h−1. It is worth emphasizing that the lower the pressure drops, the higher the flow rate through the membrane, which is penalized in terms of permeation since the residence time is reduced. The relative increase of the flow rate is proportional to the square root of the relative decrease of pressure drops, and, considering the outcomes of the permeation tests performed on the HyFraMe facility, the abovementioned differences in pressure drops lead to a relative decrease in the permeation efficiency for the worst membrane below 10%.
As presented in Equation (1), the hydrogen permeation flux is proportional to the permeability, which is a temperature-dependent property of the material. Therefore, the permeability of each membrane should be the same, assuming they are composed of the same material. Nevertheless, discrepancies in terms of composition could derive from manufacturing uncertainties, and thus, permeability tests are conducted to calculate the Pe of each membrane.
Permeability tests are performed per single membrane, keeping the retentate line closed. Once steady state conditions are reached, Pe can be calculated with Equation (1) using the geometrical data of the membranes and the measurements of pressures (difference between the lumen side pressure, i.e., P1 and P2, and the shell side pressure, i.e., P3) and throughputs. In the case of Pd-based membranes, permeation is limited by the diffusion in the bulk metal, and n takes the value of 0.5 [4]. The results are shown in Figure 4 where the permeability of each membrane is reported for temperatures of 300 °C, 350 °C, and 400 °C. The Pe ranges from the maximum value of 1.82 × 10⁻⁸ to the minimum of 1.44 × 10⁻⁸ mol m−1 s−1 Pa−0.5 for membrane 6 at 400 °C and membrane 7 at 300 °C, respectively. Referring to the average value at each temperature, the relative discrepancy varies from −8.8% to +10.0%, causing the same variation in the hydrogen permeation flux while maintaining the same pressure conditions. In particular, the best membranes are 1, 4, and 6, whereas the worst are membranes 2, 7, and 8. It is worth noting that membrane 7 results the worst in both the hydraulic and permeability characterizations.
The dependence of permeability over the membrane temperature can be expressed by an Arrhenius-type behavior, as shown in Equation (2):
P e = P e 0 × e E a R × T
where Pe0 and Ea are the pre-exponential factor (mol m−1 s−1 Pa−0.5) and the apparent activation energy (J mol−1) that can be derived from experimental data, and R and T are the gas constant (8.314 J mol−1 K−1) and the membrane temperature (K). The Pe0 and Ea of the membranes, along with their error bars (expressed with Δ) obtained from the propagation of measurement uncertainties, are derived and reported in Table 4. For the sake of comparison, data obtained in the literature for Pd-Ag membranes are collected in Table 5. It highlights a certain spread in the results that can be due to the wide range of measurement conditions. For example, in the present work, a temperature gradient occurs along the permeator due to the cold feed gas mixture (see Section 3.2), and the data are correlated with the temperature measured at the center of the unit.

3. The Experimental Activity

3.1. The Experimental Test Matrix

The experimental test matrix is derived from the outcomes of the TCS-series test performed in the HyFraMe facility, aimed at the assessment of the Pd-Ag permeator performance under relevant conditions for the EU-DEMO Tritium Conditioning System (TCS) [22]. The EU-DEMO will be the European demonstrator of a fusion power plant, and the TCS will be responsible for the recovery of tritium generated in the so-called Breeding Blanket (BB), an innovative component aimed at breeding tritium, delivering thermal power to the coolant system, and shielding various components from nuclear radiation [32,33,34,35]. Once generated, tritium is extracted from the BB by means of a helium purge flow rate, and, after preliminary processing, a mixture of tritium and helium (around 90–95 mol% in tritium) is obtained [36]. The recovery of a fuel-grade tritium stream is the scope of the TCS, whose performances are quantified in terms of permeation efficiency, expressed as:
η = Γ Q 2 ,   p e r m Γ Q 2 ,   f e e d × 100
In Equation (3), ΓQ2,perm and ΓQ2,feed are the feed flow rate and the permeated flow rate of hydrogen isotopes, respectively. According to the EU-DEMO specifications, the TCS must ensure a permeation efficiency of 85%, allowing a minimization of the tritium inventory of the plant. For this reason, such a parameter is considered a figure of merit for the present work. For more information about the EU-DEMO TCS, refer to the work of Narcisi et al. [22].
Thus, tests were performed with a mixture of H2 and He, fixing the target permeation efficiency (η) of the TCS to 85%. Operative conditions that respect the target permeation efficiency are obtained from the TCS-series [22], and the test matrix TCSm-series is derived and reported in Table 6. An overall number of 24 tests are conducted, repeating them at least two times to verify reproducibility. According to the TCS operative conditions, which involve a hydrogen-enriched throughput, two feed compositions are considered. Taking experience from the TCS-series, the membrane temperature is fixed at 400 °C and the lumen total pressure at 150 kPa. The specific feed flow rates reported in Table 6 are defined as the feed flow rate (mol h−1) per unit of membrane surface (m2), whereas the specific H2 feed flow rate considers only the hydrogen contribution. The values reported in Table 6 are derived from the TCS-series outcomes in order to ensure permeation efficiencies higher than 85%. The scope of the activity is to verify the scaling procedure; therefore, tests are performed with a changeable number of membranes, while maintaining the operative conditions in Table 6. Tests are carried out with three, five, seven, and ten membranes. In order to quantify the effect of manufacturing uncertainties on the permeation efficiency, tests with three membranes are repeated with three different triplets of membranes. According to the characterization tests, the set composed of membranes 1, 4, and 6 represents the best case in terms of permeation, the set of 2, 7, and 8 is the worst, and the set of 1, 2, and 3 is the average case.

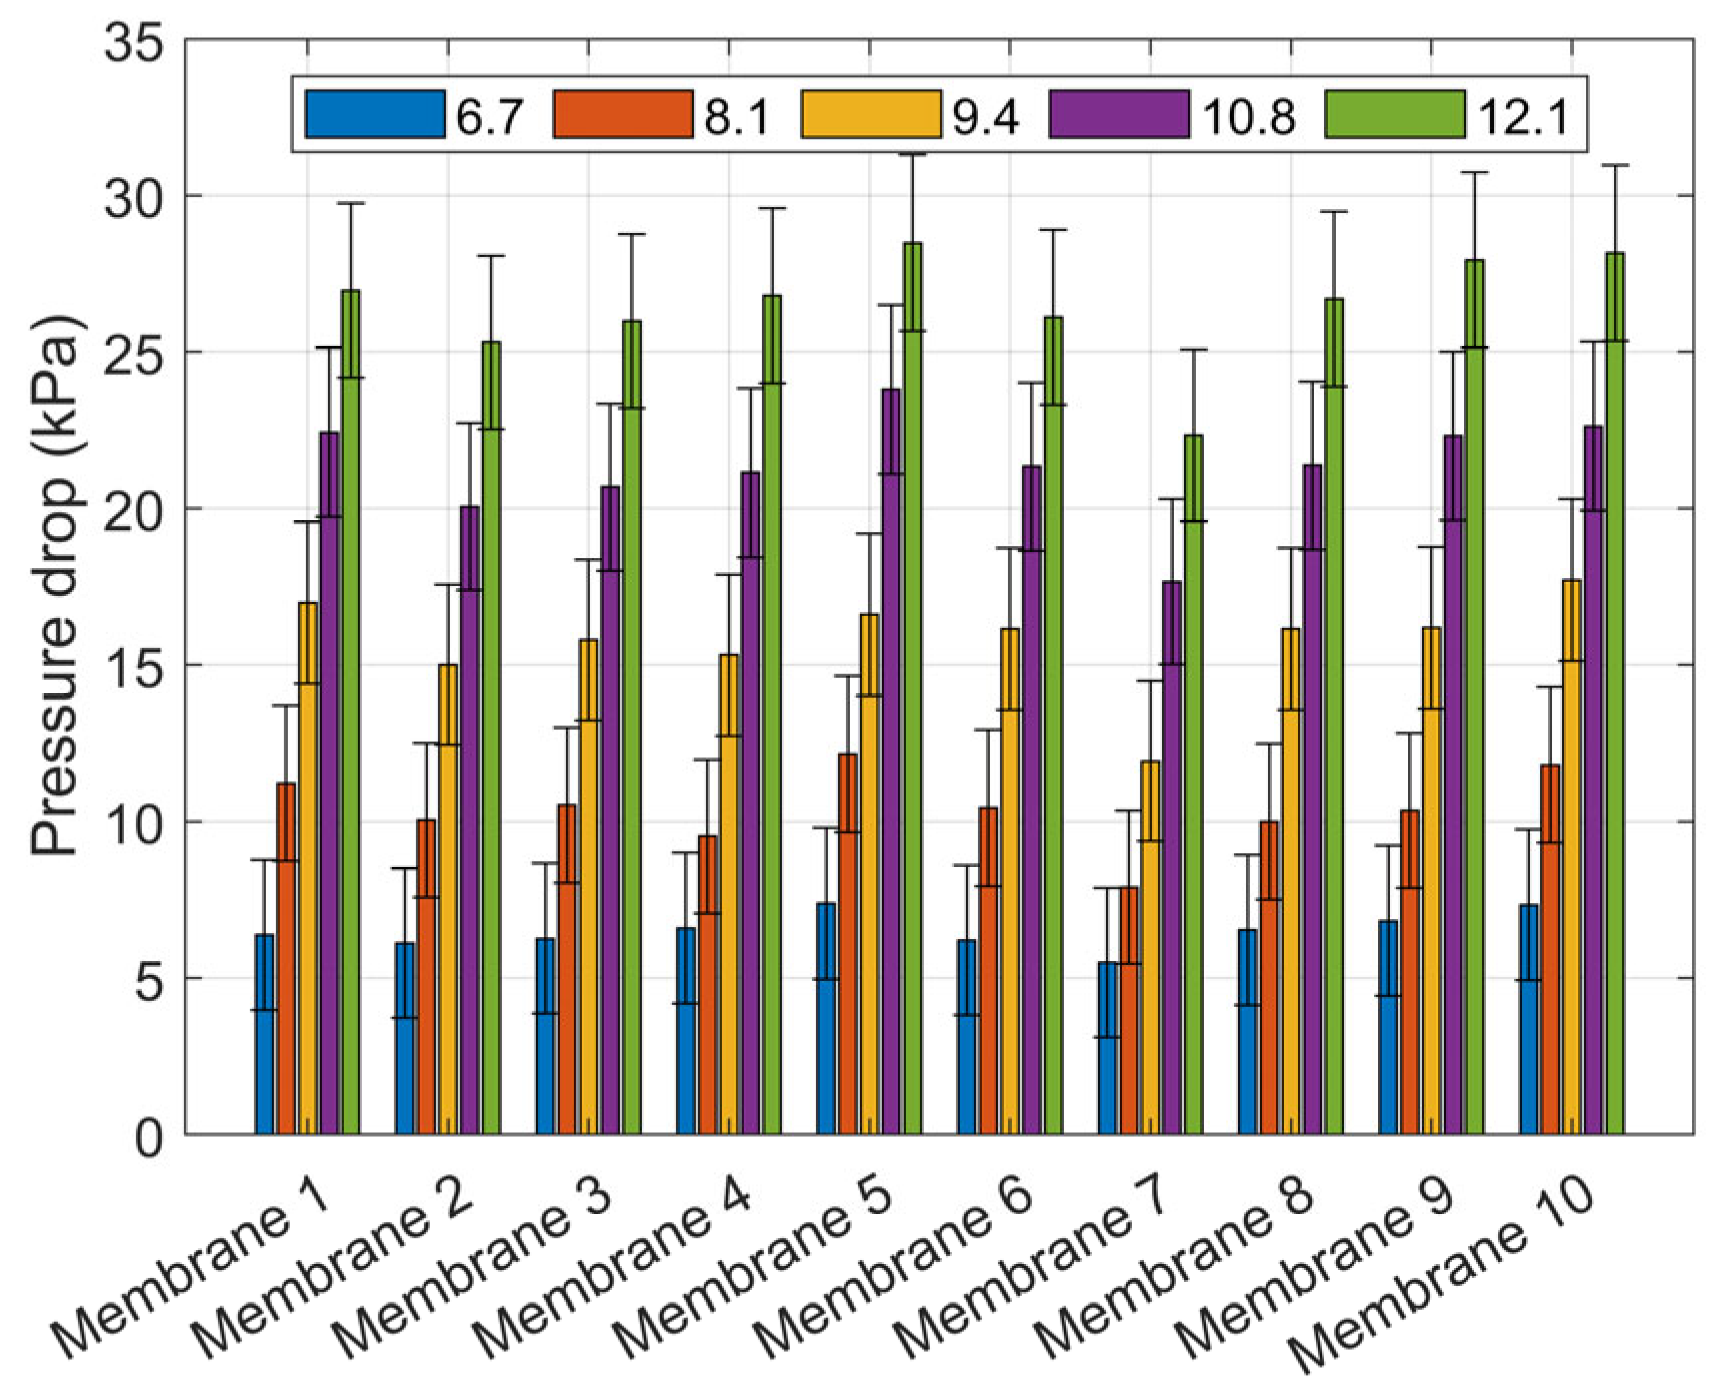
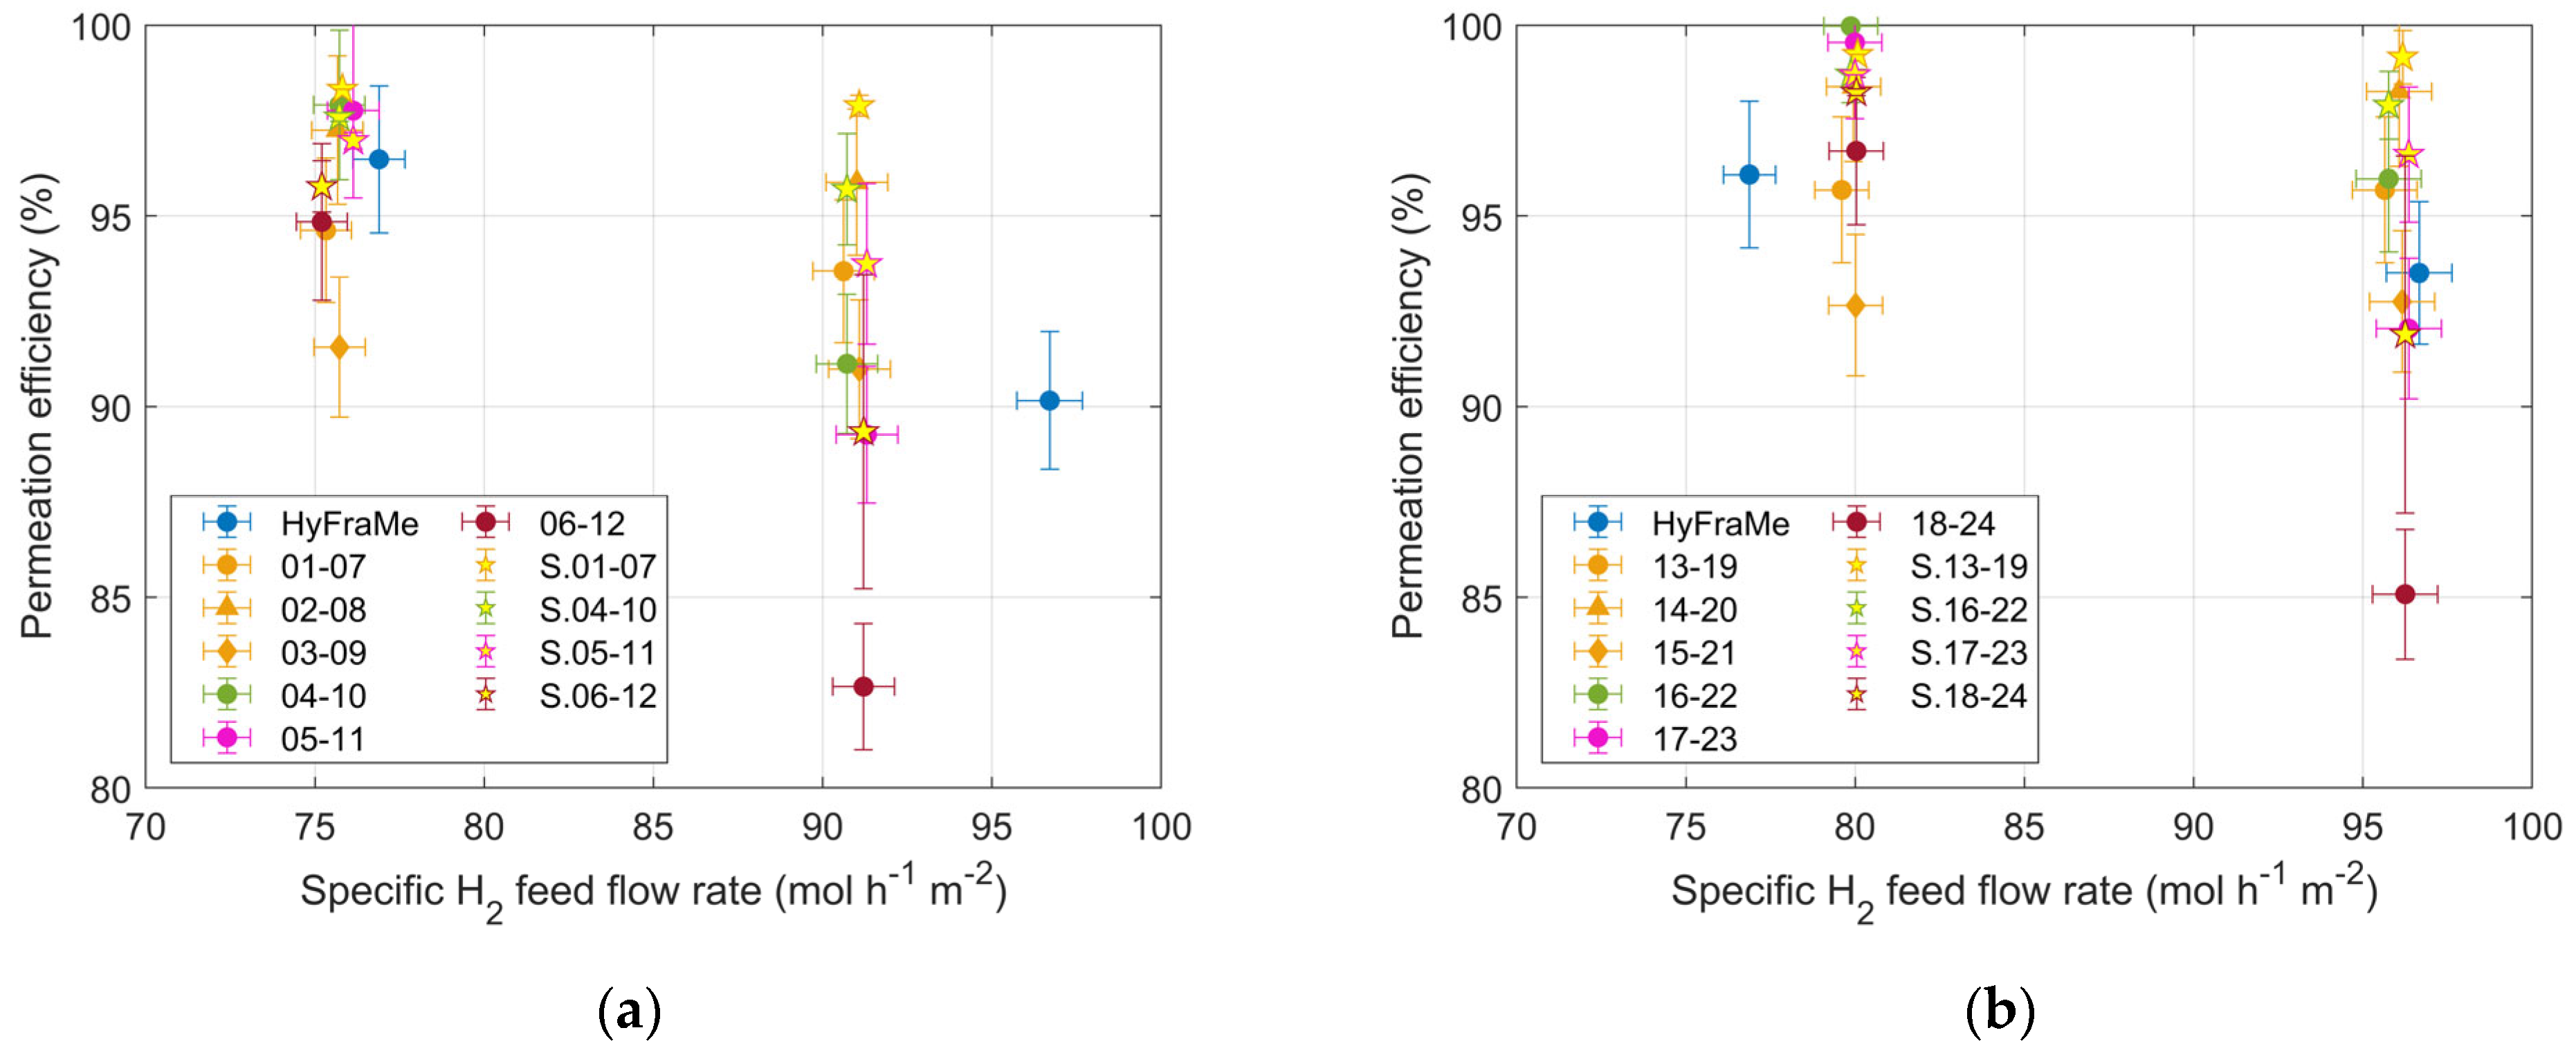
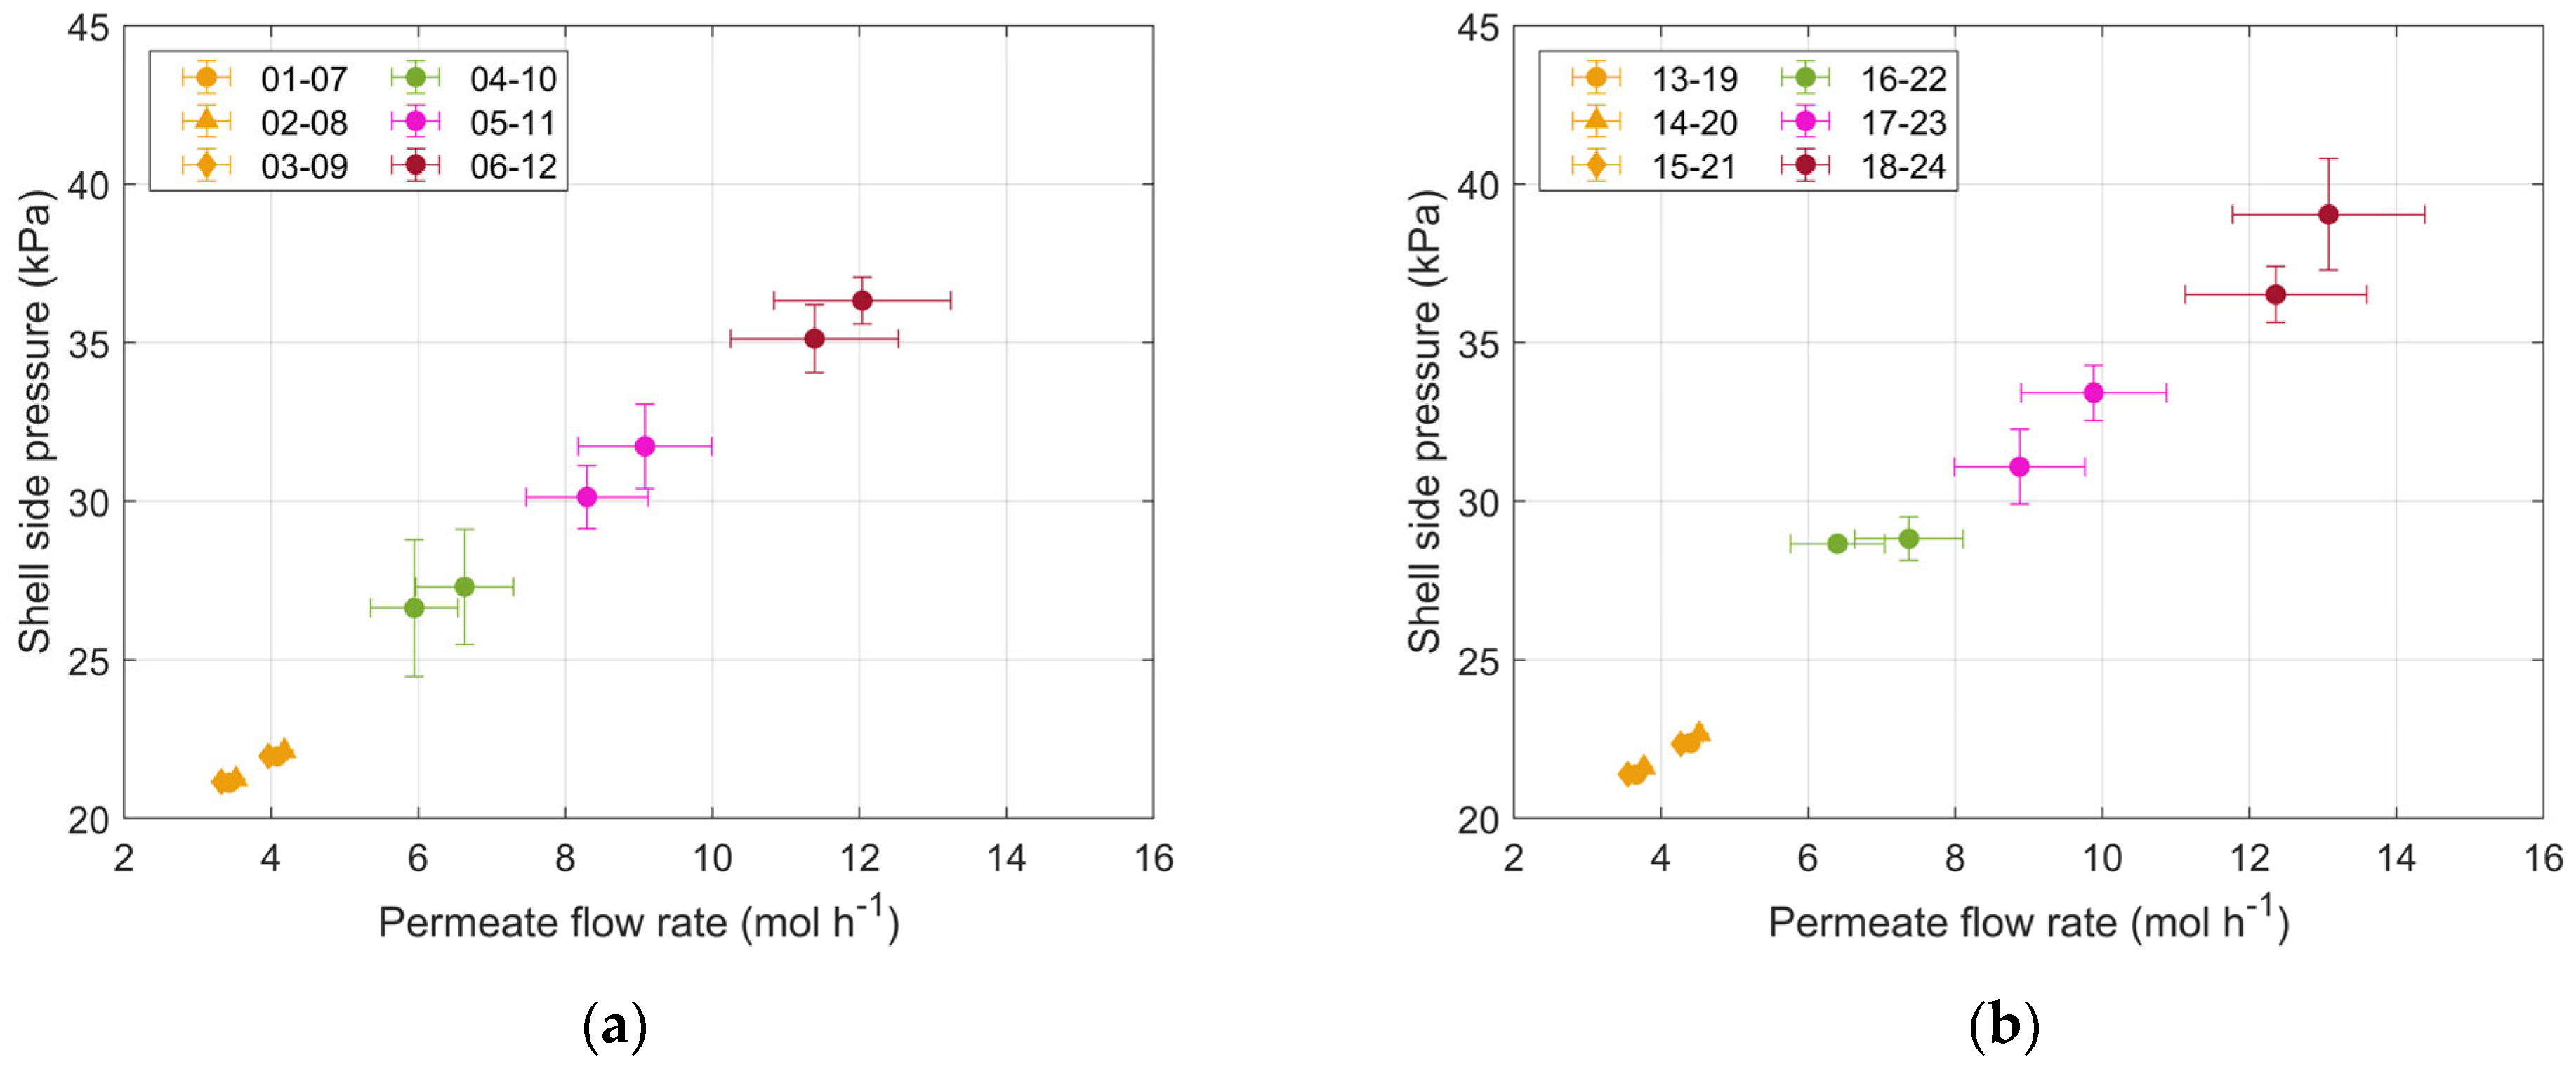
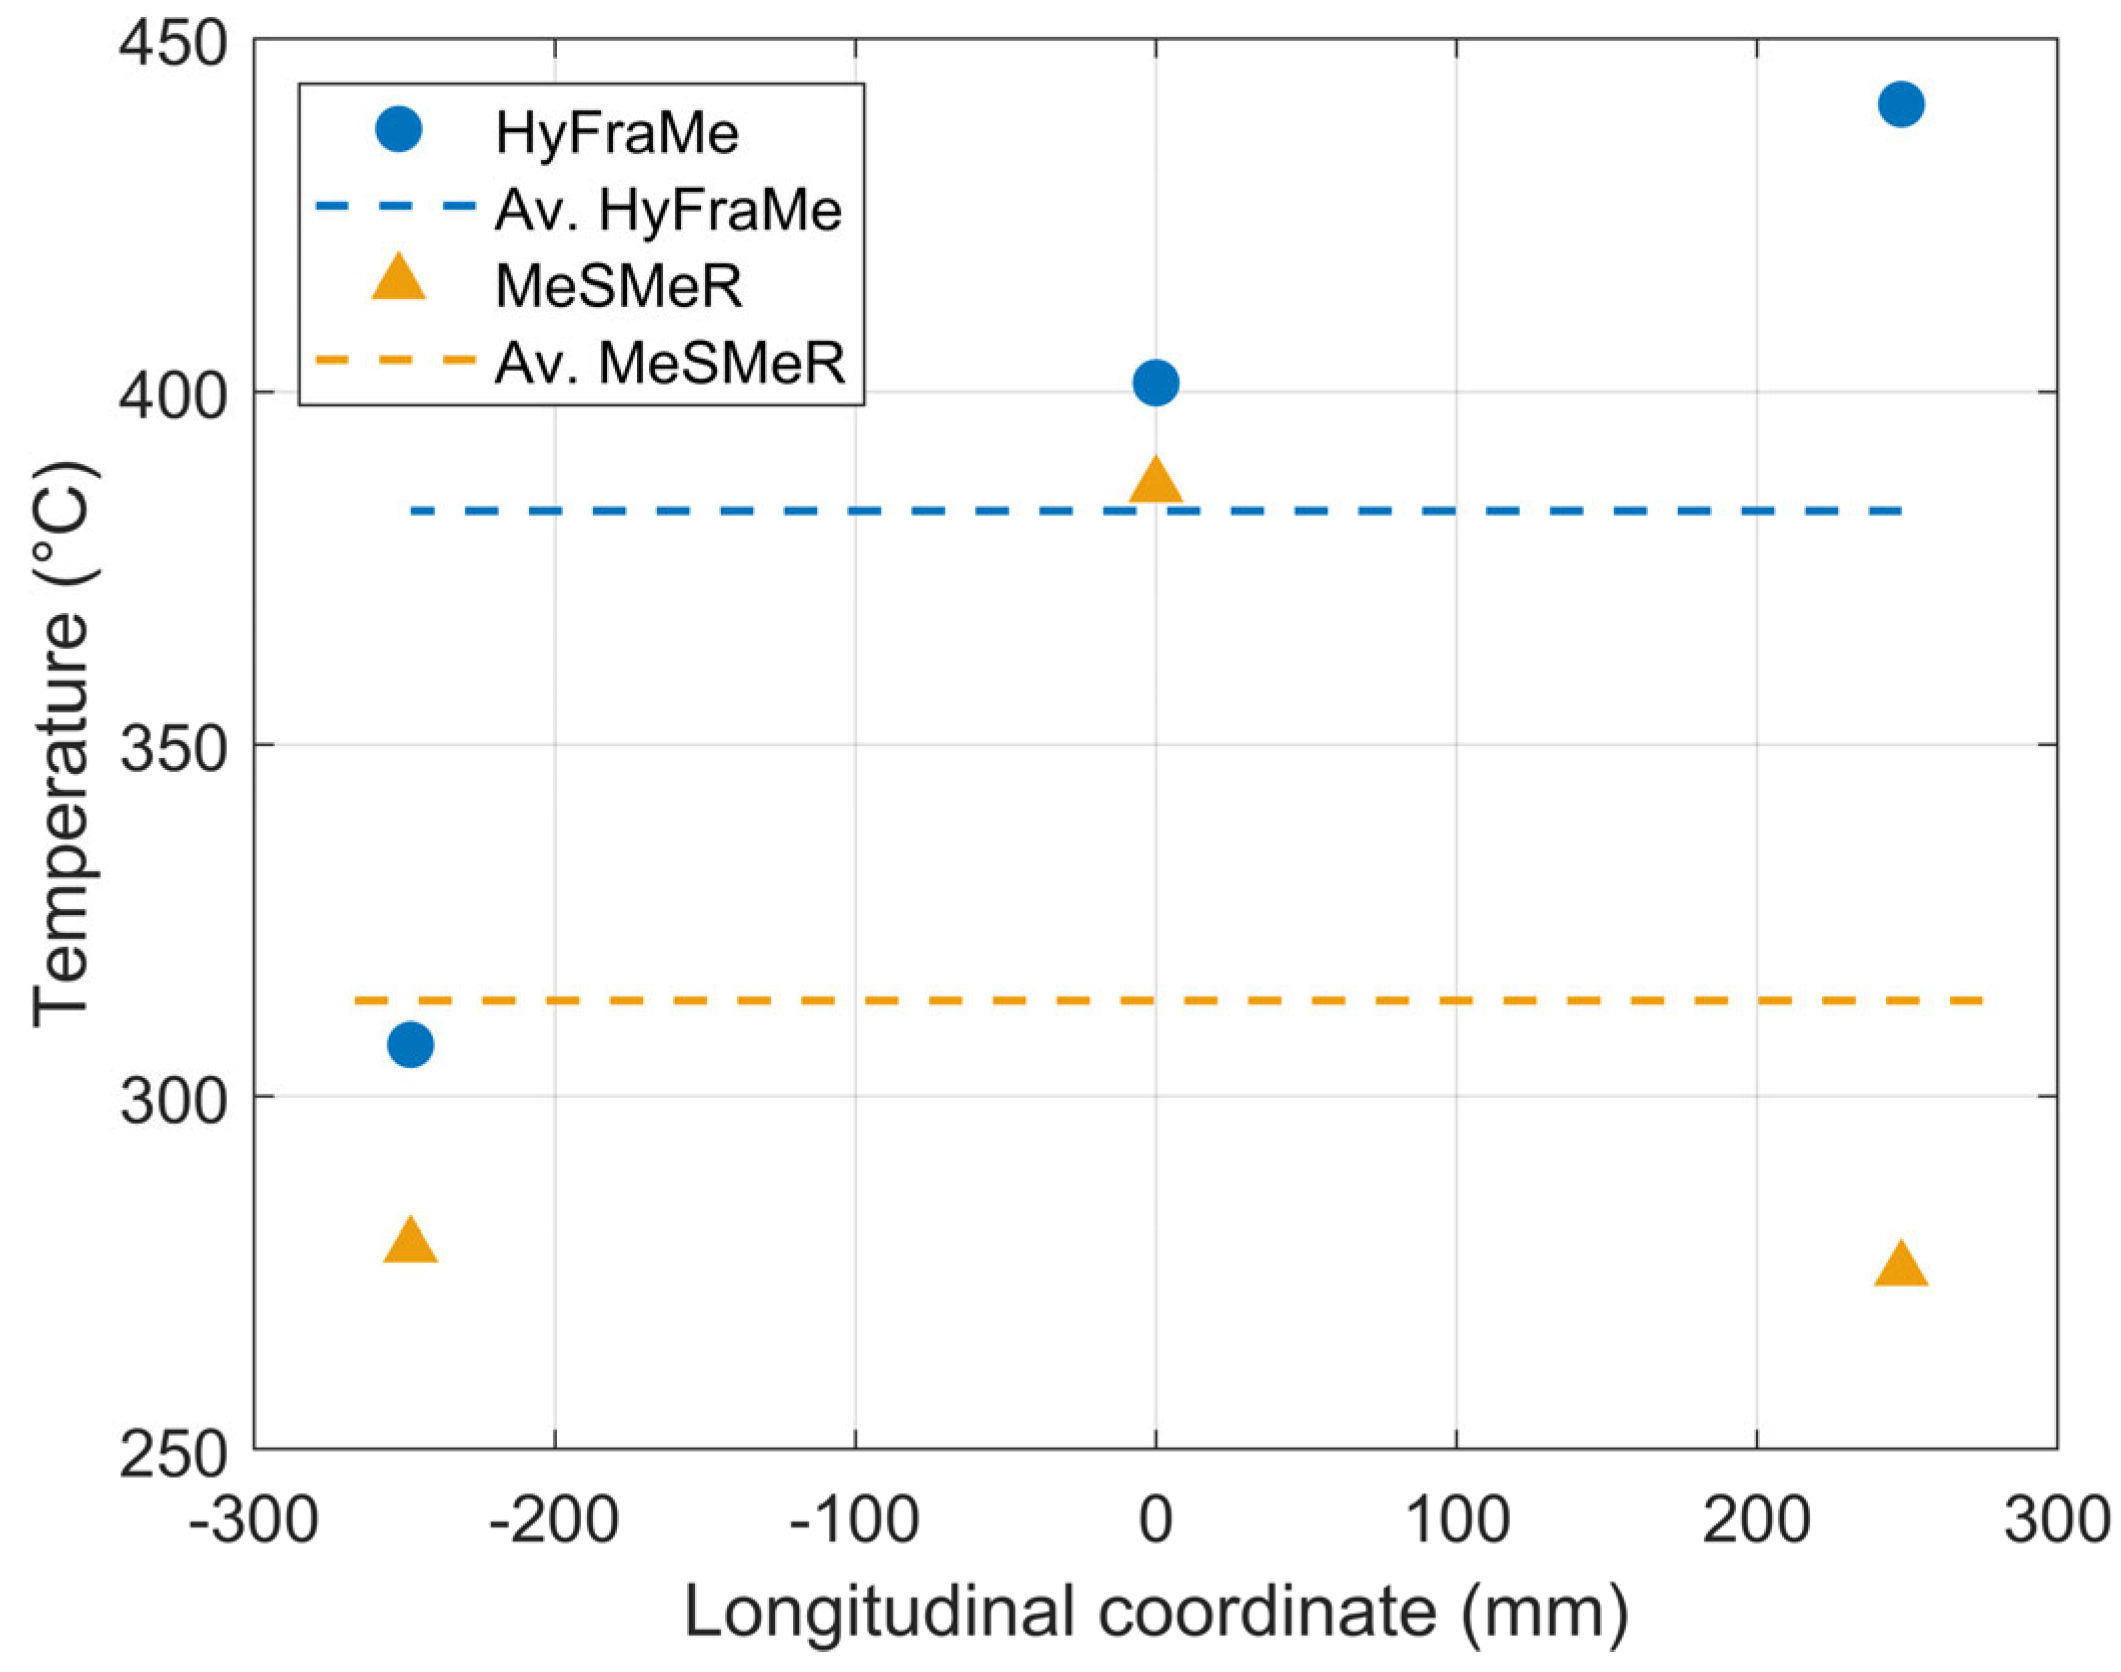
3.2. Analysis of the Results

The assessment of the scaling procedure is carried out referring to the permeation efficiency, defined in Equation (3). The experimental outcomes of the TCSm-series are reported in Figure 5 (the identification number of the tests is reported in the legend) and compared with the results of the TCS-series performed in the HyFraMe facility (HyFraMe in the legend). All the experiments have been repeated twice, showing negligible deviations among the results.
Furthermore, the performance of a numerical tool developed by Antunes et al. [24] has been assessed in the same plots. The model simulates a tubular membrane with a given length, diameter, thickness, and permeability (in terms of pre-exponential factor and apparent activation energy). The user defines feed conditions (i.e., throughput and composition) and operative parameters (i.e., temperature, pressure, and the eventual presence of sweep gas on the permeate side), and, relying on the finite element method, the numerical tool solves the permeation problem in each control volume composing the computational domain. More details on the solving scheme can be found in [24]. The simulation outcomes are presented in Figure 5 by pentagrams with yellow faces whose edge colors refer to the experimental test reproduced and are indicated in the legend with the acronym S. The plots report the permeation efficiency for two specific H2 feed flow rates and for the two compositions.
Ideally, after fixing the operative conditions (i.e., specific H2 feed flow rate, composition, temperature, and pressure), the permeation efficiency should be the same, regardless of the number of membranes. Nevertheless, some distortion in the scaling-up procedure (see Section 2) could lead to some discrepancies in the results. The effect of the manufacturing uncertainties is shown in the comparison of the tests involving three different sets of three membranes, depicted in orange with different markers in Figure 5. As expected, the set considering membranes number 1, 4, and 6 (TCSm-02-08 and TCSm-14-20) and 2, 7, and 8 (TCSm-03-09 and TCSm-15-21) shows the maximum and minimum permeation efficiency of the triplet, respectively, and the set of 1, 2, and 3 (TCSm-01-07 and TCSm-13-19) results in an average between them. The manufacturing uncertainties can affect the results by up to six percentage points in the permeation efficiency in all the operative conditions considered in the campaign.
Looking at the comparison between a different number of membranes involved in the process, the plots show a satisfactory agreement between the tests, especially for the lower specific H2 feed flow rate. In this case, all the results were gathered within eight percentage points. This spread is kept almost the same for the higher specific throughput, except for the tests conducted with ten membranes, which exhibit lower permeation efficiencies. Such behavior can be explained by the coupling between the permeator and the vacuum system. Figure 6 shows the pressure on the shell side of the permeator obtained for different permeate flow rates, i.e., for a different number of membranes. The particular configuration of the monitoring system (see Figure 2) determines a huge pressure drop through the MFM installed on the permeate line, and thus, the increase in the permeate throughput leads to an increase in the shell side pressure. Referring to Equation (1), it causes a decrease in the permeation driving force, and therefore, in the efficiency of the unit. Hence, the loss of efficiency can be attributed to the particular configuration adopted to monitor the permeate throughput and to the coupling between the permeator and the vacuum system, not to the membrane itself.
Referring to the HyFraMe data, the shell side pressure acquired during the TCS-series is comparable with the tests conducted in MeSMeR with five and seven membranes (green and magenta points in Figure 6), ranging between 30 kPa and 37 kPa. Although the slight discrepancy in the permeability (1.45 × 10⁻⁸ mol m−1 s−1 Pa−0.5 was experimentally evaluated in HyFraMe at 400 °C, slightly lower than the MeSMeR results presented in Figure 4), a good agreement is observed in the comparison between the permeation efficiency obtained in HyFraMe and MeSMeR facilities, referring to the cases of five and seven membranes for this latter. Such an agreement can be explained by the temperature profile obtained in the facilities. The representative trend along the longitudinal coordinate of the permeators is presented in Figure 7, where 0 on the x-axis represents the center of the permeator. The uncertainty of the measurement, not reported in the plot, can be considered equal to thermocouple’s accuracy, i.e., ±1.5 °C. HyFraMe shows an asymmetrical profile that is characteristic of a uniform power source (direct heating of the membrane through the Joule effect) and of heat removal by cold gas flowing along the membrane. The gaseous stream enters the unit at ambient temperature and, after a pre-heating occurs in the inner feed tube, flows in contact with the membrane from left to right, leading to the temperature increase shown in Figure 7. The derivative change along the membrane is due to the pre-heating of the gas flowing inside the feed pipe. On the other hand, MeSMeR is equipped with two identical test sections connected to the two opposite flanges of the shell (see Figure 2). Therefore, gas enters the unit from both extremities, determining the symmetrical temperature profile shown in Figure 7. The average temperature of the membranes is compared in Figure 7 by the dashed lines. As a consequence of the temperature profile, the membranes of MeSMeR are operated at a temperature around 50 °C lower than HyFraMe. Therefore, the discrepancy in terms of permeability is compensated by the difference in the operating temperature.
The last analysis pertains to the comparison between experimental data and simulation outcomes. For the study, membrane number 5 is considered a reference, being representative of the average of the MeSMeR unit (see Table 3 and Table 4). The boundary conditions are derived from the experimental acquisition, and, regarding the membrane temperature, the value measured at the center of the unit is considered a uniform boundary condition over the whole computational domain. The uncertainty range of the pre-exponential factor and the apparent activation energy are considered, which results in the error bars reported in Figure 7. A satisfactory agreement is observed between the experiments and the simulations, confirming the scalability of the numerical outcomes obtained for a single-tube unit to a multi-tube permeator. At low specific feed flow rates, the permeation efficiency spreads over a limited range for both the analyzed feed compositions, whereas, as observed in the experimental data, the range enlarges for the higher specific feed flow rate. This is the effect of the driving force decrease, following the increase in the shell side pressure, that is well predicted by the code, except for cases 12 and 24 (ten membranes), for which the largest discrepancy is observed. This outcome suggests further investigation is needed for these experimental points. The possibility to simplify the permeated line and thus homogenize the shell side pressure over the tests can quantify the effect of the decrease in permeation efficiency due to the decrease in the driving force.

4. Conclusions

The requirement of the highest selectivity for hydrogen promoted a renewed interest in dense metal membranes in applications where ultrapure isotopes are needed, e.g., nuclear fusion. Among the materials investigated in the past, palladium offers the highest selectivity and permeation rate, and its drawbacks of embrittlement can be reduced by alloying this metal with silver.
The possibility of exploiting such technology for hydrogen purification tasks was extensively investigated at the ENEA Frascati laboratories, assessing the manufacturing procedures, the integration of the membrane in a process, and its performance. Tests were conducted on a single-tube unit, namely the HyFraMe facility, where the capabilities of the technology were analyzed. Once the feasibility and operability are established, the unit’s scalability must be assessed; this is the present activity’s scope. To do this, a multi-tube permeator, called MeSMeR, has been designed and constructed at ENEA Frascati laboratories. The test section used for experiments consists of ten tubular-shaped membranes connected in parallel, allowing the possibility of operating the unit with a changeable number of membranes.
The unit has been preliminary characterized via hydraulic and permeability tests, and then the scalability assessment has been performed under conditions relevant for the EU-DEMO TCS. Experimental outcomes have been compared with the results obtained from previous tests carried out in the HyFraMe facility, highlighting a satisfactory agreement in the permeation efficiency while keeping the same specific feed flow rate. Although some discrepancies have been identified, mostly related to the highest feed flow, the scalability of the technology has been proven. In fact, those discrepancies are mainly due to the coupling between the permeator and the vacuum system and to the vacuum grade reachable on the shell side of the permeator. Furthermore, a relevant outcome of the activity has been the verification of the scalability of the simulation results obtained with single-tube modeling. Tests have been reproduced with actual boundary conditions (keeping the feed flow rate per unit of membrane surface), and the simulation results have been in good agreement with the experimental outcomes. This proves the possibility of adopting this tool for scale-up design procedures.
The experimental results have been of great interest not only for the scalability analysis but also in testing the operability of a modular unit to be employed in large systems such as the EU-DEMO TCS. Some open issues have been identified, mainly related to the vacuum grade to be ensured on the shell side and to the need to homogenize the temperature profile over the permeator. Future design and experimental activities will be focused on these open aspects.

Author Contributions

Conceptualization, V.N., L.F. and A.S.; methodology, V.N., L.F. and A.S.; software, A.S.; validation, V.N. and L.F.; formal analysis, L.F.; investigation, V.N.; resources, A.S.; data curation, L.F.; writing—original draft preparation, V.N.; writing—review and editing, L.F. and A.S.; visualization, V.N. and L.F.; supervision, A.S.; project administration, L.F. and A.S.; funding acquisition, A.S. All authors have read and agreed to the published version of the manuscript.

Funding

This work has been carried out within the framework of the EUROfusion Consortium, funded by the European Union via the Euratom Research and Training Programme (Grant Agreement No 101052200—EUROfusion). Views and opinions expressed are However, those of the author(s) only and do not necessarily reflect those of the European Union or the European Commission. Neither the European Union nor the European Commission can be held responsible for them.

Data Availability Statement

The data presented in this study are available on request from the corresponding author. The data are not publicly available due to restrictions from the funding institution.

Acknowledgments

The authors wish to thank Marco Incelli, Fabrizio Marini and Mirko Sansovini for their precious work in the design, construction and maintenance of the facility, and Silvano Tosti as head of the laboratory.

Conflicts of Interest

The authors declare no conflicts of interest.

References

  1. Deville, H.; Troost, L. Sur la permeabilitè du fer a haute temperature. Comptes Rend. 1863, 57, 965–967. [Google Scholar]
  2. Deville, H. Note sur le passage des gaz au travers des corps solides homogènes. Comptes Rend. 1864, 59, 102. [Google Scholar]
  3. Graham, T. On the adsorption and dialytic separation of gases by colloid septa. Philos. Trans. R. Soc. 1866, 156, 399–439. [Google Scholar] [CrossRef]
  4. Alique, D.; Martinez-Diaz, D.; Sanz, R.; Calles, J.A. Review of Supported Pd-Based Membranes Preparation by Electroless Plating for Ultra-Pure Hydrogen Production. Membranes 2018, 8, 5. [Google Scholar] [CrossRef] [PubMed]
  5. Martino, M.; Ruocco, C.; Meloni, E.; Pullumbi, P.; Palma, V. Main Hydrogen Production Processes: An Overview. Catalysts 2021, 11, 547. [Google Scholar] [CrossRef]
  6. Jokar, S.M.; Farokhnia, A.; Tavakolian, M.; Pejman, M.; Parvasi, P.; Javanmardi, J.; Zare, F.; Gonçalves, M.C.; Basile, A. The recent areas of applicability of palladium based membrane technologies for hydrogen production from methane and natural gas: A review. Int. J. Hydrogen Energy 2023, 48, 6451–6476. [Google Scholar] [CrossRef]
  7. Adams, B.D.; Chen, A. The role of palladium in a hydrogen economy. Mater. Today 2011, 14, 282–289. [Google Scholar] [CrossRef]
  8. Boyano, A.; Blanco-Marigorta, A.M.; Morosuk, T.; Tsatsaronis, G. Exergoenvironmental analysis of a steam methane reforming process for hydrogen production. Energy 2011, 36, 2202–2214. [Google Scholar] [CrossRef]
  9. Ockwig, N.W.; Nenoff, T.M. Membranes for hydrogen separation. Chem. Rev. 2007, 107, 4078–4110. [Google Scholar] [CrossRef]
  10. Soltani, R.; Rosen, M.A.; Dincer, I. Assessment of CO2 capture options from various points in steam methane reforming for hydrogen production. Int. J. Hydrogen Energy 2014, 39, 20266–20275. [Google Scholar] [CrossRef]
  11. Yuan, M.; Lee, K.; Van Campen, D.G.; Liguori, S.; Tnoey, M.F.; Wilcox, J. Hydrogen Purification in Palladium-Based Membranes: An Operando X-ray Diffraction Study. Ind. Eng. Chem. Res. 2019, 58, 926–934. [Google Scholar] [CrossRef]
  12. Shirasaki, Y.; Tsuneki, T.; Ota, Y.; Yasuda, I.; Tachibana, S.; Nakajima, H.; Kobayashi, K. Development of membrane reformer system for highly efficient hydrogen production from natural gas. Int. J. Hydrogen Energy 2009, 34, 4482–4487. [Google Scholar] [CrossRef]
  13. Khalilpour, R.; Mumford, K.; Zhai, H.; Abbas, A.; Stevens, G.; Rubin, E.S. Membrane-based carbon capture from flue gas: A review. J. Clean. Prod. 2015, 103, 286–300. [Google Scholar] [CrossRef]
  14. Adhikari, S.; Fernando, S. Hydrogen membrane separation techniques. Ind. Eng. Chem. Res. 2006, 45, 775–881. [Google Scholar] [CrossRef]
  15. Wilson, J.; Becnel, J.; Demange, D.; Rogers, B. The ITER Tokamak Exhaust Processing System Design and Substantiation. Fusion Sci. Technol. 2019, 75, 794–801. [Google Scholar] [CrossRef]
  16. Day, C.; Butler, B.; Giegerich, T.; Ploeckl, B.; Varaoutis, S. A smart three-loop fuel cycle architecture for DEMO. Fusion Eng. Des. 2019, 146, 2462–2468. [Google Scholar] [CrossRef]
  17. Helmi, A.; Fernandez, E.; Melendez, J.; Tanaka, D.A.P.; Gallucci, F.; Annaland, M.V. Fluidized Bed Membrane Reactors for Ultra Pure H2 Production-A Step forward towards Commercialization. Molecules 2016, 21, 376. [Google Scholar] [CrossRef] [PubMed]
  18. Santucci, A.; Tosti, S. Membrane technology for tritium recovery in fusion power plants. In Current Trends and Future Developments on (Bio-) Membranes: Advances on Membrane Engineering; Basile, A., Lipnizki, F., Rahimpour, M.R., Piemonte, V., Eds.; Elsevier: Amsterdam, The Netherlands, 2024; pp. 445–470. [Google Scholar]
  19. Craft, A. A Case Study Approach: Summary of Some Results on the Effects of Hydrogen Exposure on the Mechanical Properties of Palladium and the Alloy Systems Pd1−xMx, M = Ag, Cu, Mn; x = 5 − 0.25. Hydrogen 2023, 4, 237–256. [Google Scholar] [CrossRef]
  20. Fernandez, E.; Gallucci, F.; Pacheco Tanaka, D.A. Palladium-Based Membrane (Palladium Alloy Membrane). In Encyclopedia of Membranes; Drioli, E., Giorno, L., Eds.; Springer: Berlin/Heidelberg, Germany, 2015; pp. 1–4. [Google Scholar]
  21. Livshits, A.I. The hydrogen transport through the metal alloy membranes with a spatial variation of the alloy composition: Potential diffusion and enhanced permeation. Int. J. Hydrogen Energy 2017, 42, 13111–13119. [Google Scholar] [CrossRef]
  22. Plazaola, A.A.; Pacheco Tanaka, D.A.; Van Sint Annaland, M.; Gallucci, F. Recent Advances in Pd-Based Membranes for Membrane Reactors. Molecules 2017, 22, 51. [Google Scholar] [CrossRef] [PubMed]
  23. Narcisi, V.; Tamborrini, L.; Farina, L.; Cortese, G.; Romanelli, F.; Santucci, A. Experimental and Numerical Analysis of a Pd–Ag Membrane Unit for Hydrogen Isotope Recovery in a Solid Blanket. Membranes 2023, 13, 578. [Google Scholar] [CrossRef] [PubMed]
  24. Antunes, R.; Frances, L.; Incelli, M.; Santucci, A. Numerical study and experimental verification of protium permeation through Pd/Ag membranes for fusion applications. Fusion Eng. Des. 2019, 146, 1286–1290. [Google Scholar] [CrossRef]
  25. Barbiere, G.; Brunetti, A.; Tricoli, G.; Drioli, E. An innovative configuration of a Pd-based membrane reactor for the production of pure hydrogen: Experimental analysis of water gas shift. J. Power Sources 2008, 182, 160–167. [Google Scholar] [CrossRef]
  26. Incelli, M.; Santucci, A.; Tosti, S.; Sansovini, M.; Carlini, M. Heavy water decontamination tests through a Pd-Ag membrane reactor: Water Gas Shift and Isotopic Swamping performances. Fusion Eng. Des. 2017, 124, 692–695. [Google Scholar] [CrossRef]
  27. Incelli, M.; Santucci, A.; Tosti, S.; Mallozzi, F.; Sansovini, M.; Marini, F. Design and first experimental results of a new multi-tube Pd-Ag membrane module. Fusion Eng. Des. 2019, 146, 2729–2733. [Google Scholar] [CrossRef]
  28. Boeltken, T.; Belimov, M.; Pfeifer, P.; Peters, T.A.; Bredesen, R.; Dittmeyer, R. Fabrication and testing of a planar microstructured concept module with integrated palladium membranes. Chem. Eng. Process. 2013, 67, 136–147. [Google Scholar] [CrossRef]
  29. Chabot, J.; Lecomte, J.; Grumet, C.; Sannier, J. Fuel clean-up system: Poisoning of palladium-silver membranes by gaseous impurities. Fusion Technol. 1988, 14, 614–618. [Google Scholar] [CrossRef]
  30. Serra, E.; Kemali, M.; Perujo, A.; Ross, D.K. Hydrogen and Deuterium in Pd-25 Pct Ag alloy: Permeation, diffusion, solubilization, and surface reaction. Metall. Mater. Trans. A 1998, 29, 1023–1028. [Google Scholar] [CrossRef]
  31. Scura, F.; Barbieri, G.; Drioli, E. H2 for PEM-FC: Effect of CO in the purification by means of Pd-based membranes. Desalination 2006, 200, 239–241. [Google Scholar] [CrossRef]
  32. Federici, G. Testing needs for the development and qualification of a breeding blanket for DEMO. Nucl. Fusion 2023, 63, 125002. [Google Scholar] [CrossRef]
  33. Hernández, F.A.; Pereslavtsev, P.; Zhou, G.; Kanga, Q.; D’Amico, S.; Neubergera, H.; Boccaccini, L.V.; Kiss, B.; Nádasic, G.; Maqueda, L.; et al. Consolidated design of the HCPB Breeding Blanket for the pre-Conceptual Design Phase of the EU DEMO and harmonization with the ITER HCPB TBM program. Fus. Eng. Des. 2020, 157, 111614. [Google Scholar] [CrossRef]
  34. Palermo, I.; Hernández, F.A.; Pereslavtsev, P.; Rapisarda, D.; Zhou, G. Shielding Design Optimization of the Helium-Cooled Pebble Bed Breeding Blanket for the EU DEMO Fusion Reactor. Energies 2022, 15, 5734. [Google Scholar] [CrossRef]
  35. Qi, Q.; Zhao, M.; Sun, F.; Zhang, Y.; Gu, S.; Ji, B.; Zhou, H.S.; Oya, Y.; Liu, S.; Luo, G.N. Investigation on effects of tritium release behavior in Li4SiO4 pebbles. Nucl. Mater. Energy 2021, 28, 101036. [Google Scholar] [CrossRef]
  36. Cristescu, I.; Draghia, M. Developments on the tritium extraction and recovery system for HCPB. Fusion Eng. Des. 2020, 158, 111558. [Google Scholar] [CrossRef]
Figure 1. The MeSMeR test facility: (a) picture of the setup, and (b) details of the system consisting of the cylindrical shell and the two test sections.
Hydrogen 05 00010 g001
Figure 2. Process flow diagram: (a) MeSMeR facility, and (b) schematic representation of the coupling section of the permeator. Red lines represent the pure hydrogen.
Hydrogen 05 00010 g002
Figure 3. Hydraulic characterization of the membranes: pressure drops as a function of the gas flow rate (mol h−1) per each membrane.
Hydrogen 05 00010 g003
Figure 4. Permeability of the membranes as a function of temperature.
Hydrogen 05 00010 g004
Figure 5. Comparison of the permeation efficiency obtained in the HyFraMe facility within the TCS-series, in the MeSMeR facility within the TCSm-series, and with the simulation tool. The permeation efficiency is expressed as a function of the specific H2 feed flow rate and feed composition: (a) 90% H2 and 10% He, and (b) 95% H2 and 5% He. All tests are performed by fixing the lumen side pressure at 150 kPa and ranging the shell side pressure between 20 kPa and 40 kPa.
Hydrogen 05 00010 g005
Figure 6. Shell side pressure (P3) as a function of the permeate flow rate for the two compositions of the feed mixture: (a) 90% H2 and 10% He, and (b) 95% H2 and 5% He.
Hydrogen 05 00010 g006
Figure 7. Comparison of the representative temperature profiles along the membranes of HyFraMe and MeSMeR.
Hydrogen 05 00010 g007
Table 1. Instrumentation: model, measurement range, and accuracy.
ItemModelRangeAccuracy
MFC-1MKS, GE50A series0–5000 sccm±1% of reading between 20% and 100% of full scale;
±0.2% of full scale between 2% and 20% of full scale
MFC-20–5000 sccm
MFC-30–1000 sccm
MFM-10–5000 sccm
MFM-20–10,000 sccm
P1MKS, Baratron® Type 722B105–106 Pa±0.5% of reading
P2
P3PFEIFFER, CMR 271101–1.1 × 10⁵±0.15% of reading
Table 2. Differences between HyFraMe and MeSMeR in terms of design and operation.
ParameterHyFraMeMeSMeR
Heating modeDirect heating via the Joule effectThermal radiation through shell walls
Temperature monitoringThree thermocouples installed on the outside surface of the membraneThree thermocouples measuring bulk temperature on the shell side
Flow distribution and distortionNo distortionTotal flow rate elaborated through MFCs; possible distortion in the flow distribution through parallel membranes
Manufacture distortionNo distortionDistortion due to manufacturing discrepancies in membranes
Table 3. Geometrical features of the membranes installed in the MeSMeR test facility [27].
MembraneLength
(mm)
Inner Diameter
(mm)
Thickness
(µm)
15109.99120
250710.13110
350710.01110
450910.00120
551210.05113
65089.95115
75059.97105
85089.95115
951010.10118
1051310.06130
Table 4. Pre-exponential factor and apparent activation energy of the membranes.
MembranePe0
(mol m−1 s−1 Pa−0.5)
ΔPe0
(mol m−1 s−1 Pa−0.5)
Ea
(J mol−1)
ΔEa
(J mol−1)
12.21 × 10⁻⁸±1.74 × 10−91278.69±409.10
22.41 × 10⁻⁸±2.06 × 10−112442.65±4.42
32.41 × 10⁻⁸±5.61 × 10−92015.31±1201.80
42.67 × 10⁻⁸±1.71 × 10−92205.70±331.55
52.87 × 10⁻⁸±1.55 × 10−92961.45±278.66
62.45 × 10⁻⁸±3.58 × 10−91709.36±756.41
72.38 × 10⁻⁸±2.12 × 10−92395.26±459.23
82.08 × 10⁻⁸±1.75 × 10−91769.22±434.02
92.20 × 10⁻⁸±6.05 × 10−101587.14±142.23
102.58 × 10⁻⁸±3.38 × 10−92557.39±677.50
Table 5. Collection of literature data on pre-exponential factor and apparent activation energy for the hydrogen permeability expression of unsupported Pd-Ag membranes.
Thickness
(µm)
Pe0
(mol m−1 s−1 Pa−0.5)
Ea
(J mol−1)
Reference
2504.95 × 10−85900.00[28,29]
198–7825.58 × 10−86300.00[28,30]
609.7 × 10−725,800.00[28,31]
842.95 × 10−82531.49[24]
1505.63 × 10−85456.06[24]
113(2.58 ± 0.35) × 10−84013.90 ± 640.30[24]
Table 6. TCSm-series experimental test matrix: feed flow rate and mixture composition.
Test IDFeed Composition
H2–He (%)
Specific Feed Flow Rate
(mol h−1 m−2)
Specific H2 Feed Flow Rate
(mol h−1 m−2)
Membranes
TCSm-0190–1084.275.81–3
TCSm-021; 4; 6
TCSm-032; 7; 8
TCSm-041–5
TCSm-051–7
TCSm-061–10
TCSm-07101.391.21–3
TCSm-081; 4; 6
TCSm-092; 7; 8
TCSm-101–5
TCSm-111–7
TCSm-121–10
TCSm-1395–584.280.01–3
TCSm-141; 4; 6
TCSm-152; 7; 8
TCSm-161–5
TCSm-171–7
TCSm-181–10
TCSm-19101.396.21–3
TCSm-201; 4; 6
TCSm-212; 7; 8
TCSm-221–5
TCSm-131–7
TCSm-141–10
Disclaimer/Publisher’s Note: The statements, opinions and data contained in all publications are solely those of the individual author(s) and contributor(s) and not of MDPI and/or the editor(s). MDPI and/or the editor(s) disclaim responsibility for any injury to people or property resulting from any ideas, methods, instructions or products referred to in the content.

