Abstract
Proton-exchange membrane fuel cells (PEMFCs) are highly regarded as a promising technology for renewable energy generation; however, the environmental burden in their life cycle is a subject of concern. This study aimed to assess the environmental impact of producing a 1 kW PEMFC by a well-detailed cradle-to-gate evaluation, using mid-point and end-point impact assessment methods. The environmental impacts are related to the extraction of raw materials, consumption of energy, and transportation processes. Mid-point analysis shows that raw materials extraction and processing have a significant share in some impacts, including freshwater eutrophication, human carcinogenic toxicity, and terrestrial acidification. On the other hand, the energy consumed in fuel cell production plays a significant role in the impact categories of fossil resource depletion and global warming. The highest impact is attributed to the human health end-point analysis (0.000866 DALY), followed by the damage to ecosystems (1.04 × 10⁻⁶ species/yr) and resources (USD2013 6.16844). Normalization results further strengthen the importance of human health impacts and the necessity to solve problems regarding toxicity. The results of this work can provide directions toward enhancing the environmental sustainability of PEMFC technology and present a case for adopting a holistic approach to sustainability by looking across the life cycle of the technology.
1. Introduction
Climate change, which describes the long-term changes in weather patterns and global temperature, is one of the biggest threats to modern civilization [1]. While some schools of thought have argued that climate change is natural, scientific evidence has also shown that since the 1800s, human actions have been a significant precipitator of climate change due to the increased use of conventional fuels like gas, oil, and coal, which causes greenhouse gas (GHG) emissions [2]. When fossil fuels are burnt for energy production, they produce greenhouse gases, which act as a blanket, absorbing heat from the sun and causing global temperatures to rise [3,4]. The major constituents of GHG are carbon dioxide (CO2) and Methane (CH4), most of which come from the burning of gasoline used for powering the transportation sector and the burning of coal and gas for electricity generation and heating [5]. Deforestation is also a major source that releases CO2 into the Earth’s atmosphere while using gas, oil, and agricultural activities (especially poultry) are identified as the primary source of Methane [6]. As such, the release of GHGs can be attributed to land use, farming activities, building, transportation, and the energy sector.
The consequences of climate change are not distant threats but harsh realities the world is already grappling with. These include extreme weather conditions, flooding, drought, and severe air, land, and water pollution [3]. The impacts extend to famine, hunger, malnutrition, mental health issues, forced displacements, and increased sickness and disease. A 2023 World Health Organization (WHO) report estimates that 3.6 billion people occupy regions highly susceptible to climate change, and the world could see 250,000 additional deaths between 2030 and 2050 [7]. These figures are not mere statistics but a stark reminder of the urgent need to mitigate climate change.
Various initiatives have been taken to reduce climate change, including adopting climate education, climate-friendly policies, forest protection [8], recycling and reuse [9], green transportation [10], sustainable agriculture [11], energy efficiency [12], and the transition to green energy [13]. The transition to green energy, primarily through adopting renewable energy, holds significant promise in mitigating climate change. Many countries have pledged to adopt renewable energy on various global platforms; this has thus increased the adoption of green energy in various sectors of the economy. The adoption of renewable energy has also gained momentum recently due to increased efficiency (especially biomass, wind, and solar photovoltaics), improved modularity, and technological breakthroughs in materials engineering—all photovoltaic (PV)—which have resulted in cost competitiveness [14,15]. Data published by The International Renewable Energy Agency (IRENA) between 2010 and 2022 indicate that both wind and solar were cost-competitive with conventional energy sources, even without subsidies [16]. More specifically, it was noted that the global weighted average cost of electricity from solar PV fell to USD 0.049/kWh (89% decrease), almost 33.33% less than the cheapest conventional fuel globally.
Despite the negative effect of COVID-19 on the global renewable energy supply chain, it has been reported that between 2021 and 2022, solar PV has been responsible for more than 50% of new power plant installations globally [17]. In 2022 alone, solar PV capacity increased by 25%, making it the fastest-growing generation technology. Furthermore, global PV power production increased from 3.6% in 2021 to 4.5% in 2022 [17]. Solar PV and wind power have been the main drivers of the new addition of renewable energy to the power-plant mix, accounting for nearly 75% of the capacity increase between 2021 and 2022. Although the contribution of both wind and PV to the generation mix in the last three years is impressive, there are also various challenges associated with them.
Solar radiation and wind are intermittent in nature and are thus unreliable without backup [18]. To make solar PV and wind electricity generation more reliable, it is common to integrate them with conventional sources of energy generation or energy storage systems like battery and hydrogen storage [19]. Of these two storage technologies, battery storage has gained more attention. However, more research endeavors are currently being dedicated to hydrogen energy storage. The hydrogen energy storage consists of the electrolyzer, hydrogen tank, power conditioning units, control and monitoring system, and fuel cell (FC) [20]. Like the operation of the battery, the FC uses an electrochemical reaction with oxygen to convert the chemical energy of the hydrogen to electricity. This makes the FC an essential component of the hydrogen storage system [21,22]. As FC technologies become more efficient and economical, they find applications in various carbon-intensive sectors, including telecommunications, aerospace, industrial applications, portable power supply, backup power, and transportation (electric vehicles, ships, rail) [21]. Proton-exchange membrane (PEM) and solid oxide fuel cells (SOFC) are the most prevalent forms of FC for hydrogen energy storage systems.
Hydrogen energy storage is a clean energy source that only releases water as the primary byproduct during its operational life span [21,23]. While the FC does not release emissions during its operations, it consists of membranes, catalysts (e.g., platinum), and bipolar plates [24]. The materials used for these components pass through the extraction and production stages, which are resource and energy-intensive and may have an environmental impact. It is, therefore, essential to consider the FC’s life cycle assessment (LCA) to quantify its overall ecological impact. Various articles have considered the LCA of FCs [25,26,27]. Gulotta et al. [28] presented a state-of-the-art systematic review of the various aspects of life cycle costing (LCC) and the LCA for Unitized Regenerative FCs using PEM devices. The authors selected and reviewed scientific articles from ScienceDirect, Scopus, and Web of Science (WoS) databases. The results indicate a gap in knowledge on the LCA and LCC of URFC, with only one article on the LCA of the PEM-URFC system and none on the LCC. This means more studies are needed in this domain to give insights into the technology’s environmental impact and damage categories. Furthermore, Pehnt’s [25] study was dedicated to analyzing the LCA of FC stacks, emphasizing the environmental impact of its production process. Also, using LCA, Evangelisti et al. [26] compared the environmental impact of a proton-exchange membrane fuel cell (PEMFC) for passenger automobiles with conventional fossil-powered internal combustion engines. Staffell et al. [27] investigated the energy and carbon payback timeframes for SOFC-based home combined heat and power systems. However, research studies that extensively combine mid- and end-point methodologies within PEMFC systems are sparse. By conducting a comprehensive LCA of a 1 kW PEMFC system using both mid-point and end-point methods, this paper attempts to bridge this gap.
Therefore, this paper aims to implement a comprehensive LCA for a kW PEMFC system to identify the significant environmental impacts. The study uses mid- and end-point approaches to evaluate the environmental effects of producing the 1 kW PEMFC system. The rest of this article is arranged as follows: the relevant literature on the subject is presented in Section 2, the materials and methods are presented in Section 3, and Section 4 covers the results of the mid-point and end-point assessment. The work is concluded in Section 5, where significant contributions, limitations, and future research areas are highlighted.
2. The Literature Review
This section discusses the relevant papers that have been dedicated to the environmental assessment of FC. Pehnt’s study used an LCA to compare the environmental impact of PEFC stack generation to vehicle utilization [25]. It highlighted platinum group metals as the principal contributors to ecological damage and advocated for their recycling to offset the consequences. Despite stack production emissions, FC automobiles have near-zero local emissions, which is critical for metropolitan settings. Considering recycling and better energy sources, according to the study, stack production emits 10% of automobile emissions for hydrogen and methanol, implying significant environmental advantages over gasoline vehicles. In another study, Dhanushkodi et al. [29] reviewed studies related to the life cycle analysis of FC technology. The study identified various tools researchers have deployed in conducting LCAs of FCs; these include GREET and Simapro. The review covers studies related to fuel cycle stages and vehicle cycle of FC technology. The result shows that material extraction used to produce FCs leads to environmental impact. Although the study emphasized the significance of recycling, it did not consider the comprehensive LCA of FC technology. Similarly, using LCA, Usai et al. [30] assessed the environmental impact of an FC-powered light-duty electric vehicle. The study results show that 5-ton CO2-eq is released to the environment when an FC with a net power output of 80 kW is manufactured. Furthermore, the study identified that the production of the FC auxiliaries, together with the catalyst and tanks, performed below expectations regarding environmental impact across all impact categories considered. The study also noted that the transition to renewable energy technology, the use of secondary platinum, and technical improvements would yield between 25% and 70% reduction in carbon footprint across the impact categories. Baratto and Diwekar [31] evaluated and compared the environmental impact of FC-based auxiliary power units (APUs) with that of idling diesel engines. The analysis shows that the quantity of emissions related to the use of APUs is considerably less than that of the idling of diesel engines; furthermore, the authors concluded that SOFC shows superiority to other FC technologies concerning environmental impacts and human health with a short payback period of approximately two years.
Yang et al. [32] conducted a state-of-the-art and in-depth LCA to compare the environmental impact of internal combustion vehicles, electric vehicles, and FC-powered vehicles using China as a case study. The study compared these transport alternatives based on the hydrogen production approach and driving mileage to ascertain their sustainability. The study concluded that based on the vehicle life cycle, GHG emissions and energy consumption attributed to electric vehicles are considerably higher than that of the other two vehicles. The higher GHG emissions and energy consumption values are due to the high energy used during battery production. The results of the entire life cycle of the vehicles show that as they approach 75,000 km, fuel-cell vehicles powered by hydrogen—obtained by electrolysis using coke oven gas—and the abandoned hydropower provided the best performance compared to other scenarios. Granovskii, Dincer, and Rosen [33] examined the environmental impact of using FCs (hydrogen as fuel) and internal combustion engines (gasoline as fuel) vehicles, comparing their fuel production and utilization. The study also compared the efficiencies of the FC and the internal combustion engines and their environmental impacts. Specifically, the authors considered the efficiencies and quantity of emissions from natural gas and crude oil transportation, a distillation of crude oil, reformation of natural gas, solar, and wind electricity production, hydrogen production through water electrolysis, and gasoline and hydrogen distribution and utilization. Based on the study’s findings, for the FC vehicle employing hydrogen to be competitive regarding GHG emission and energy consumption, its efficiency must be higher than gasoline by 25–30%. In another study, Evtimov et al. [34] used an LCA to evaluate fuel-cell electric vehicle (FCEV) efficiency using various hydrogen production technologies. The study compared the fuel consumption and GHG emissions over the entire life of conventional gasoline vehicles and FCEVs. The impact of the energy generation mix and hydrogen production technology on the energy consumed and emissions shows that the most effective option for producing hydrogen in countries with CO2 emissions over 447 g per 1 kWh of energy is by using natural gas as fuel.
Ally and Pryor [35] present a discourse on a Western Australian government initiative on a Sustainable Transport Energy Programme that explores replacing natural gas and diesel public transit infrastructure in Perth with hydrogen FC alternatives. The study conducted an LCA for the hydrogen infrastructure implementation, bus production, operation, and end-of-life disposal of the FC bus to estimate the total energy demand and its associated environmental footprint. The results reveal that the FC bus alternative is competitive with the diesel and natural gas bus systems regarding eutrophication and global warming potential; furthermore, it was reported that the emissions attributed to photochemical and acidification ozone are higher in FC buses. Hwang et al. [36] used MATLAB/Simulink and the GREET model to examine the FC vehicle’s life cycle performance. They compared greenhouse gas (GHG) emissions and energy usage for three hydrogen generation pathways: steam reforming of natural gas, grid electricity electrolysis, and PV electricity electrolysis. FCV system efficiency was highest at 25% of maximum net power, with PV electrolysis hydrogen reducing energy usage and GHG emissions the most compared to conventional gasoline vehicles. Grid-electrolysis FCVs showed higher lifespan energy consumption and GHG emissions than GVs but reforming hydrogen FCVs had fewer impacts than grid-based BEVs.
Evangelisti et al. [26] reported the outcome of a detailed LCA of an FC vehicle with an emphasis on its production phase. The authors also compared the results from the manufacturing FCV with that of conventional internal combustion engine vehicles (ICEVs) and battery electric vehicles (BEVs). The study implemented a sensitivity analysis on the hydrogen tank and balance-of-plant to account for uncertainties in the input variables (inventory models and materials). The results indicate that the FC vehicle’s manufacturing phase displays a higher environmental impact than the BEV and the ICEV, which can be traced to the FC stack and hydrogen tank. Further analysis revealed that it is possible to achieve a 25% reduction in the climate change impact category for the FCV compared to a baseline FCV scenario. Further analysis shows that ICEVs generally have the highest global warming potential (GWP), mainly because of the release of fossil carbon emissions during their operation. Minimizing the ecological footprint in the production of FCVs continues to be a significant obstacle. Bareiß et al. [37] conducted a life cycle evaluation to examine the environmental impact of proton-exchange membrane water electrolysis and steam methane reforming. The findings indicate that proton-exchange membrane water electrolysis is a highly promising technology for mitigating CO2 emissions in the hydrogen industry. This technology has the potential to reduce emissions by up to 75% when the electrolysis system operates only on electricity derived from renewable energy sources. Jiangyi et al. [38] proposed a PEMFC-based distributed energy system that includes input energy, a PEMFC-based combined cooling, heating, and power system, and building loads. The proposed system’s energy, environmental, and economic performance is examined through an LCA of various hydrogen–electricity contribution rates (), hydrogen production methods, and hydrogen gas prices. The findings indicate that the hydrogen production method has a more significant effect on greenhouse gas emissions and primary energy consumption.
Krishnan et al. [39] conducted an LCA to examine the environmental effects of alkaline electrolyzer (AE) and proton-exchange membrane (PEM) electrolyzer systems to produce green hydrogen, with a specific emphasis on the stack components’ baseline and near-future advanced designs, taking into consideration the cycle from the extraction to the operating phase. The primary sources of electricity, along with the emissions from the stacks, are recognized as significant factors that contribute to environmental impact. The study was not able to establish the preferred method between AE and PEM with regard to environmental impact. Through a comparative life cycle assessment between a stand-alone gas condensing boiler and electricity sourced from a grid mix, Slotyuk et al. [40] examined the emission-reduction potential of a PEMFC whose application is in housing with a standard system. The findings indicate that, while the operational stage of the PEMFC had notable benefits in most of the environmental impact categories over the existing energy supply system, the manufacturing phase of the FC had drawbacks. Xu et al. [41] designed an integrated system that combines coalbed methane recovery with a PEMFC. The sustainability of the proposed system was analyzed using an LCA and an emergy analysis model. A parametric analysis was conducted to evaluate the impact of the reforming temperature, steam carbon ratio, and current density on the emergy performance. According to the LCA results, the production phase has the highest impact on system sustainability, representing 51.65%.
In summary, the research examined in this section offers important perspectives on the LCA and other approaches for evaluating the environmental effect and sustainability of PEMFCs and associated systems. Emphasizing the significance of the production phase and the possibility for emissions reduction, Evangelisti et al. [26] and Slotyuk et al. [40] examined the environmental impact of PEMFCs in transportation and residential applications, respectively. In their studies on the impact of hydrogen production techniques on PEMFC environmental performance, Bareiß et al. [37] and Jiangyi et al. [38] highlighted the need for renewable energy sources. To produce green hydrogen, Krishnan et al. [39] analyzed the environmental impacts of alkaline and PEM electrolyzers, while Xu et al. [41] evaluated the sustainability of an integrated system that included coalbed methane recovery and a PEMFC. The current work contributes significantly to the LCA of FC systems by extensively examining the life cycle of a 1 kW PEMFC system utilizing both mid-point and end-point techniques from cradle to gate.
Contribution of the Present Study
The present work provides a unique way for evaluating the environmental effect of PEMFCs by integrating end-point and mid-point LCA techniques in a comprehensive cradle-to-gate analysis of a 1 kW PEMFC system. This method offers an in-depth overview of the long-term effects on human health, ecosystems, and resources as well as the immediate impacts on certain impact categories related to PEMFC manufacturing. This work differs from other studies in focusing on a 1 kW PEMFC system and comprehensively examining the upstream processes that contribute to the total environmental effect. This study analyzes the environmental impact of a 1 kW PEMFC system because it is widely used in small-scale PEMFC applications like backup power, portable power, and small stationary systems [42,43]. Additionally, studying the effects of a 1 kW system allows for extrapolation to larger multi-kW systems that combine multiple 1 kW stacks, as the 1 kW size forms a modular building block. This work fills a vacuum in the literature by illuminating environmental hotspots and possible areas for improvement and offers insightful information on the environmental performance of PEMFC technology. The findings complement previous research while offering new perspectives on optimizing the environmental sustainability of PEMFCs, making a significant contribution to the field. A comparison of various studies on the LCA of FCs and this present study is given in Table 1.

Table 1.
Contribution of the present study in comparison to the existing literature.
3. Materials and Methods
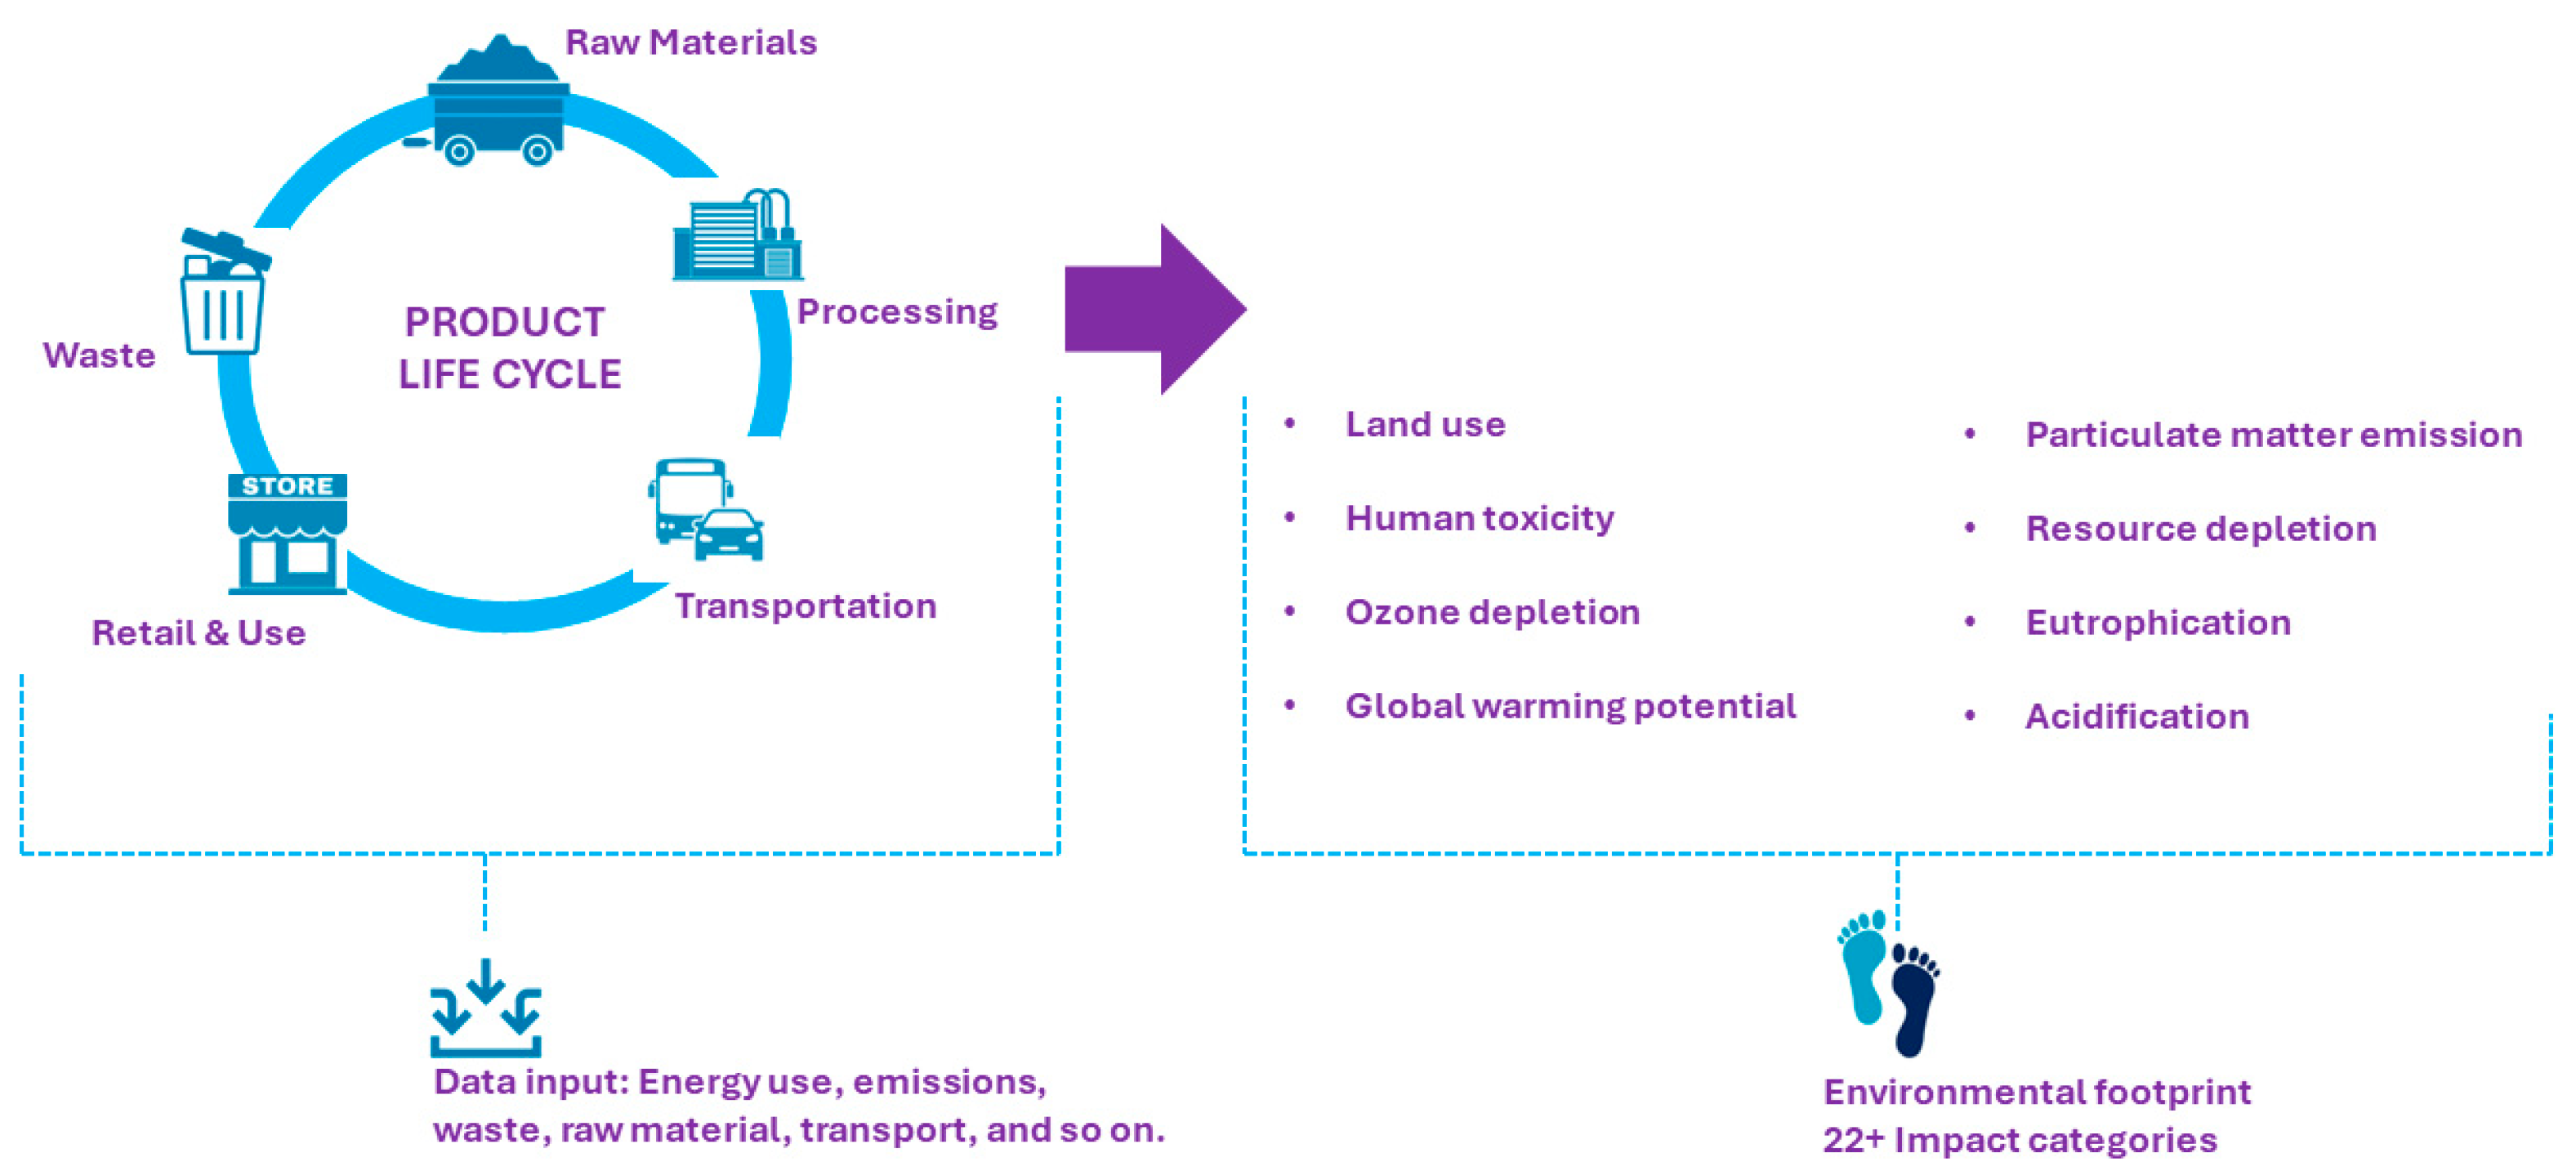
This section describes the methodology used in this study, the operating principle of FCs, and the LCA stages used to implement this research. A product life cycle assessment (Figure 1) involves estimating the environmental footprint of various impact categories across processes such as raw materials mining, production, transportation operations, and waste disposal or reuse [44]. This study considered more than 22 impact categories for the LCA.

Figure 1.
An illustration of the product life cycle is used in this study.
3.1. Effects of PEMFC Materials on the Environment
PEMFCs have become one of the most popular FC types on the market today and are being considered as a future clean energy technology for transportation and stationary power because of their high efficiency, low emissions, and multi-applicability; however, regardless of how efficient or how low-emission a PEMFC is, it is essential to understand the materials and chemicals involved in the manufacturing and operation of the PEMFC stacks to evaluate the PEMFC’s overall impact on the environment. This section discusses the operational principle, the composition and structure of PEMFC materials, and their potential environmental concerns.
3.2. Operational Principle of PEMFCs
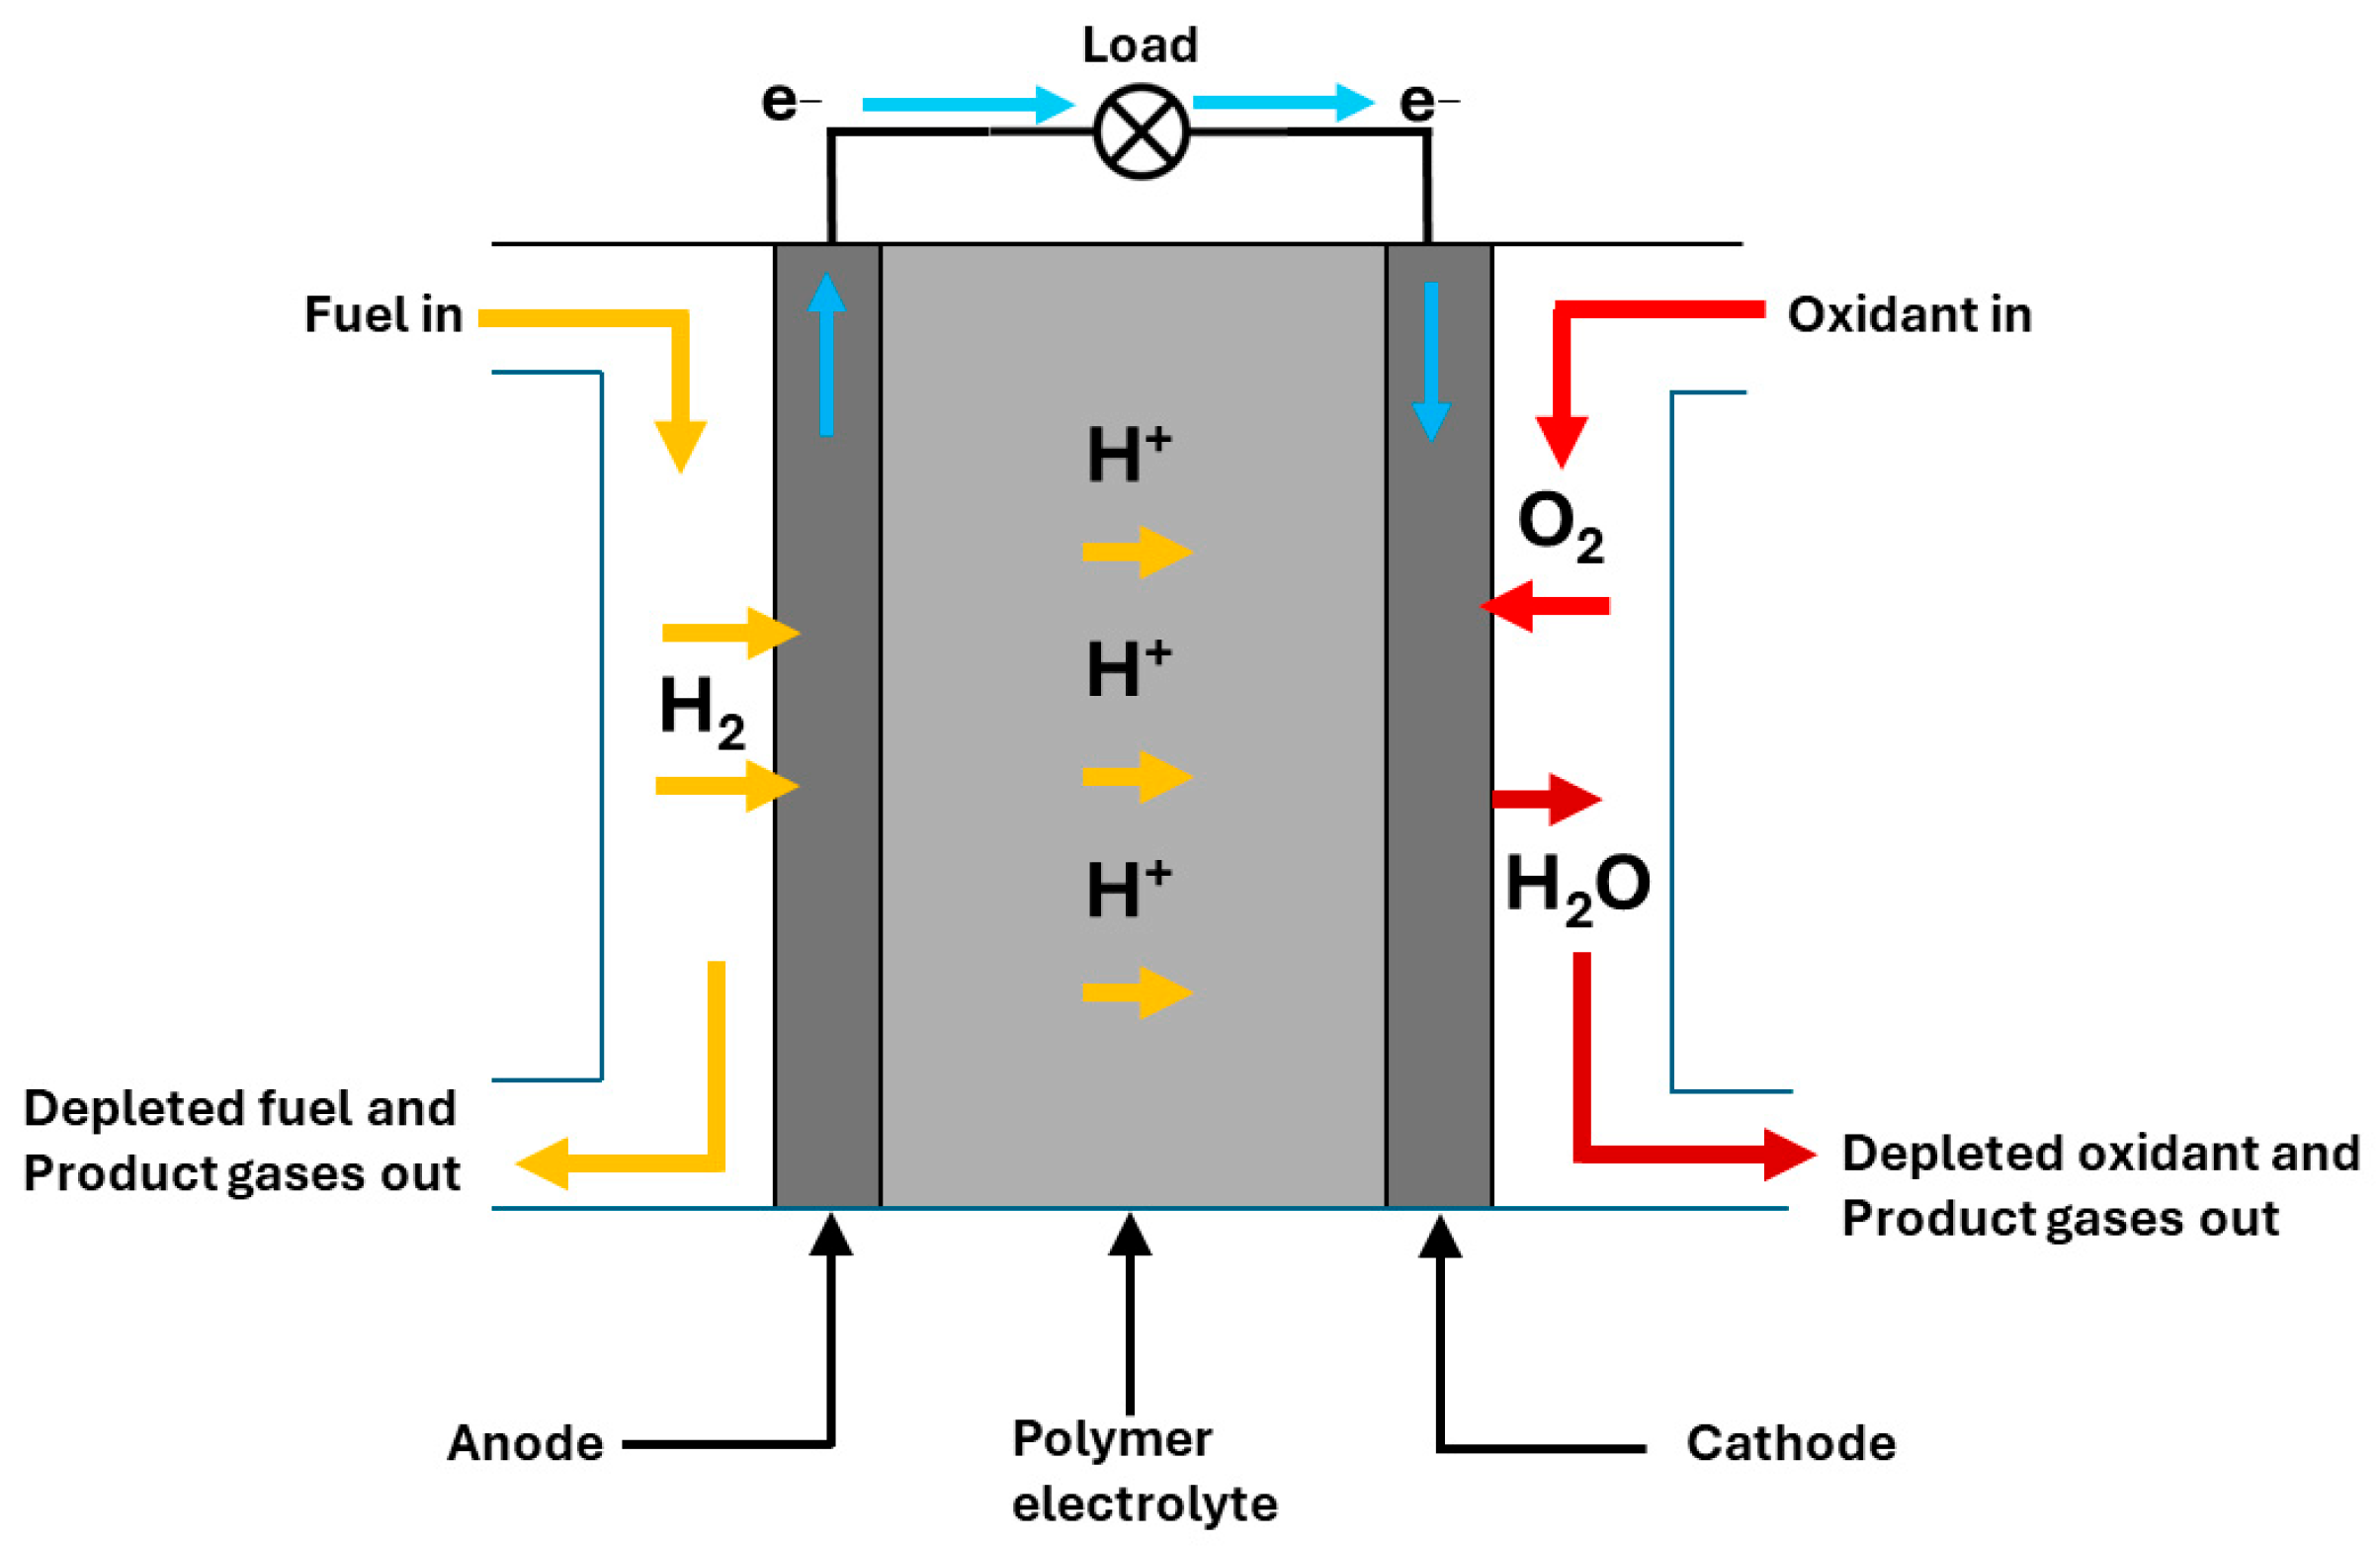
The PEMFC is an electrochemical device that comprises diffusion media, a membrane, an anode, and a cathode (catalyst layer of platinum) used to convert the chemical energy stored in hydrogen to electricity using the process of electrolysis [21]. PEMFC, compared to other FC technologies, operates at low temperatures of about 80 °C with reduced preparation time [45]. This FC technology utilizes a thin, permeable, polymetric membrane as a solid electrolyte. The conversion process of hydrogen to electricity yields water and heat as its byproducts. To ensure continuous energy generation of electricity, there must be a constant supply of fuel and oxidants. The protons pass through the electrolyte from the anode to the cathode through the proton-exchange membrane (Figure 2). Hydrogen is introduced to the anode, and with the help of a platinum catalyst, the hydrogen gas undergoes an oxidation reaction to split into electrons and protons [46]. At the same time, the oxygen is reduced to oxides, and water is formed at the cathode. The Equations for these reactions are given in Equations (1)–(3) [21]. DC electricity is produced when the electrons are passed through the external circuit since it cannot pass through the PEM. The exothermic reaction that occurs at the interface with the cathode produces water and heat as the byproducts. The water is ejected from the system through the gas diffusion layer on the cathode side of the FC, while the heat and excess hydrogen are dissipated through the gas diffusion layer at the anode side of the FC. The excess hydrogen can be fed back into the system, combusted, vented, or purged. The critical material used in the production of FCs is given in Table 2.
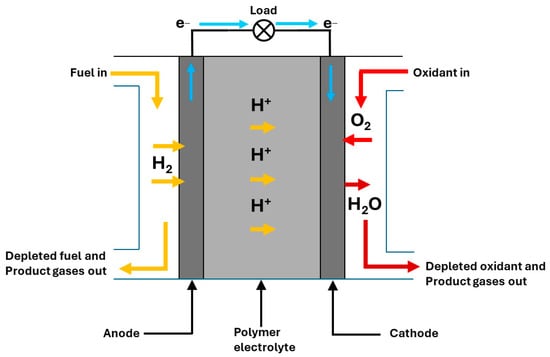
Figure 2.
Working principle of PEMFCs (adapted from [47]).
Table 2.
Critical materials in the production of PEMFC [21,24].
Environmental Impact of PEMFC Materials
The manufacturing, handling, and disposal of PEMFC materials can lead to a variety of environmental concerns. PFSA membranes, like Nafion, are manufactured via a multi-step process based on the polymerization of perfluorinated monomers [48]. The monomers required for the membrane synthesis comprise environmentally persistent chemicals, including perfluorooctanoic acid (PFOA), a compound that poses potential health risks and ecological issues [49]. PFSA membranes are also difficult to dispose of in an environmentally friendly manner, as the materials are not readily biodegradable [49]. The extraction and refining of platinum for use in PEMFC catalysts have significant environmental impacts [50]. Platinum mining is often energy-intensive, produces greenhouse gas emissions, and can harm ecosystems [51]. The fact that only a limited amount of platinum is available worldwide also raises concerns about using this valuable resource and the long-term viability of PEMFC technologies that depend heavily on it [52].
There are also environmental concerns related to the carbon supports used in catalyst layers and gas diffusion layers. Any material produced from hydrocarbons (organic compounds containing hydrogen and carbon) by an incomplete combustion process will leave behind greenhouse gases and potentially air pollutants as byproducts during the manufacturing process [53]. An example of such a material is carbon black, which is widely used in gas diffusion layers [53]. In addition, the disposal of carbon-based materials at the end of life (e.g., spent GDLs and CLs) may pose an environmental burden if they are not managed appropriately [54].
3.3. Life Cycle Assessment
As various countries pledge to cut down on GHGs to reduce emissions to tackle climate change, businesses and organizations are beginning to prioritize environmental impact assessments on their agenda. This involves navigating the uncertainties and complexities of understanding, measuring, and benchmarking the environmental impact of their daily activities. This study adopted the LCA framework for estimating the environmental impact of producing 1 kW of FCs [55]. The LCA can be categorized into cradle-to-cradle [56,57], cradle-to-grave [57], and cradle-to-gate [58]. The cradle-to-cradle considers the environmental impact of a product from the material extraction process to when the product is recycled or reused. The cradle-to-grave LCA assesses the environmental impact from sourcing the raw materials for the product to the end of its life or when it is disposed of. In this approach, the evaluation covers the product’s operation, maintenance, and disposal stages. The cradle-to-gate LCA, being the most straightforward and most cost-effective, considers the impact of the product from the extraction of the raw materials to the manufacturer’s gate. In this study, we adopted the cradle-to-gate LCA approach to evaluate the environmental impact of producing 1 kW of FCs due to the available data.
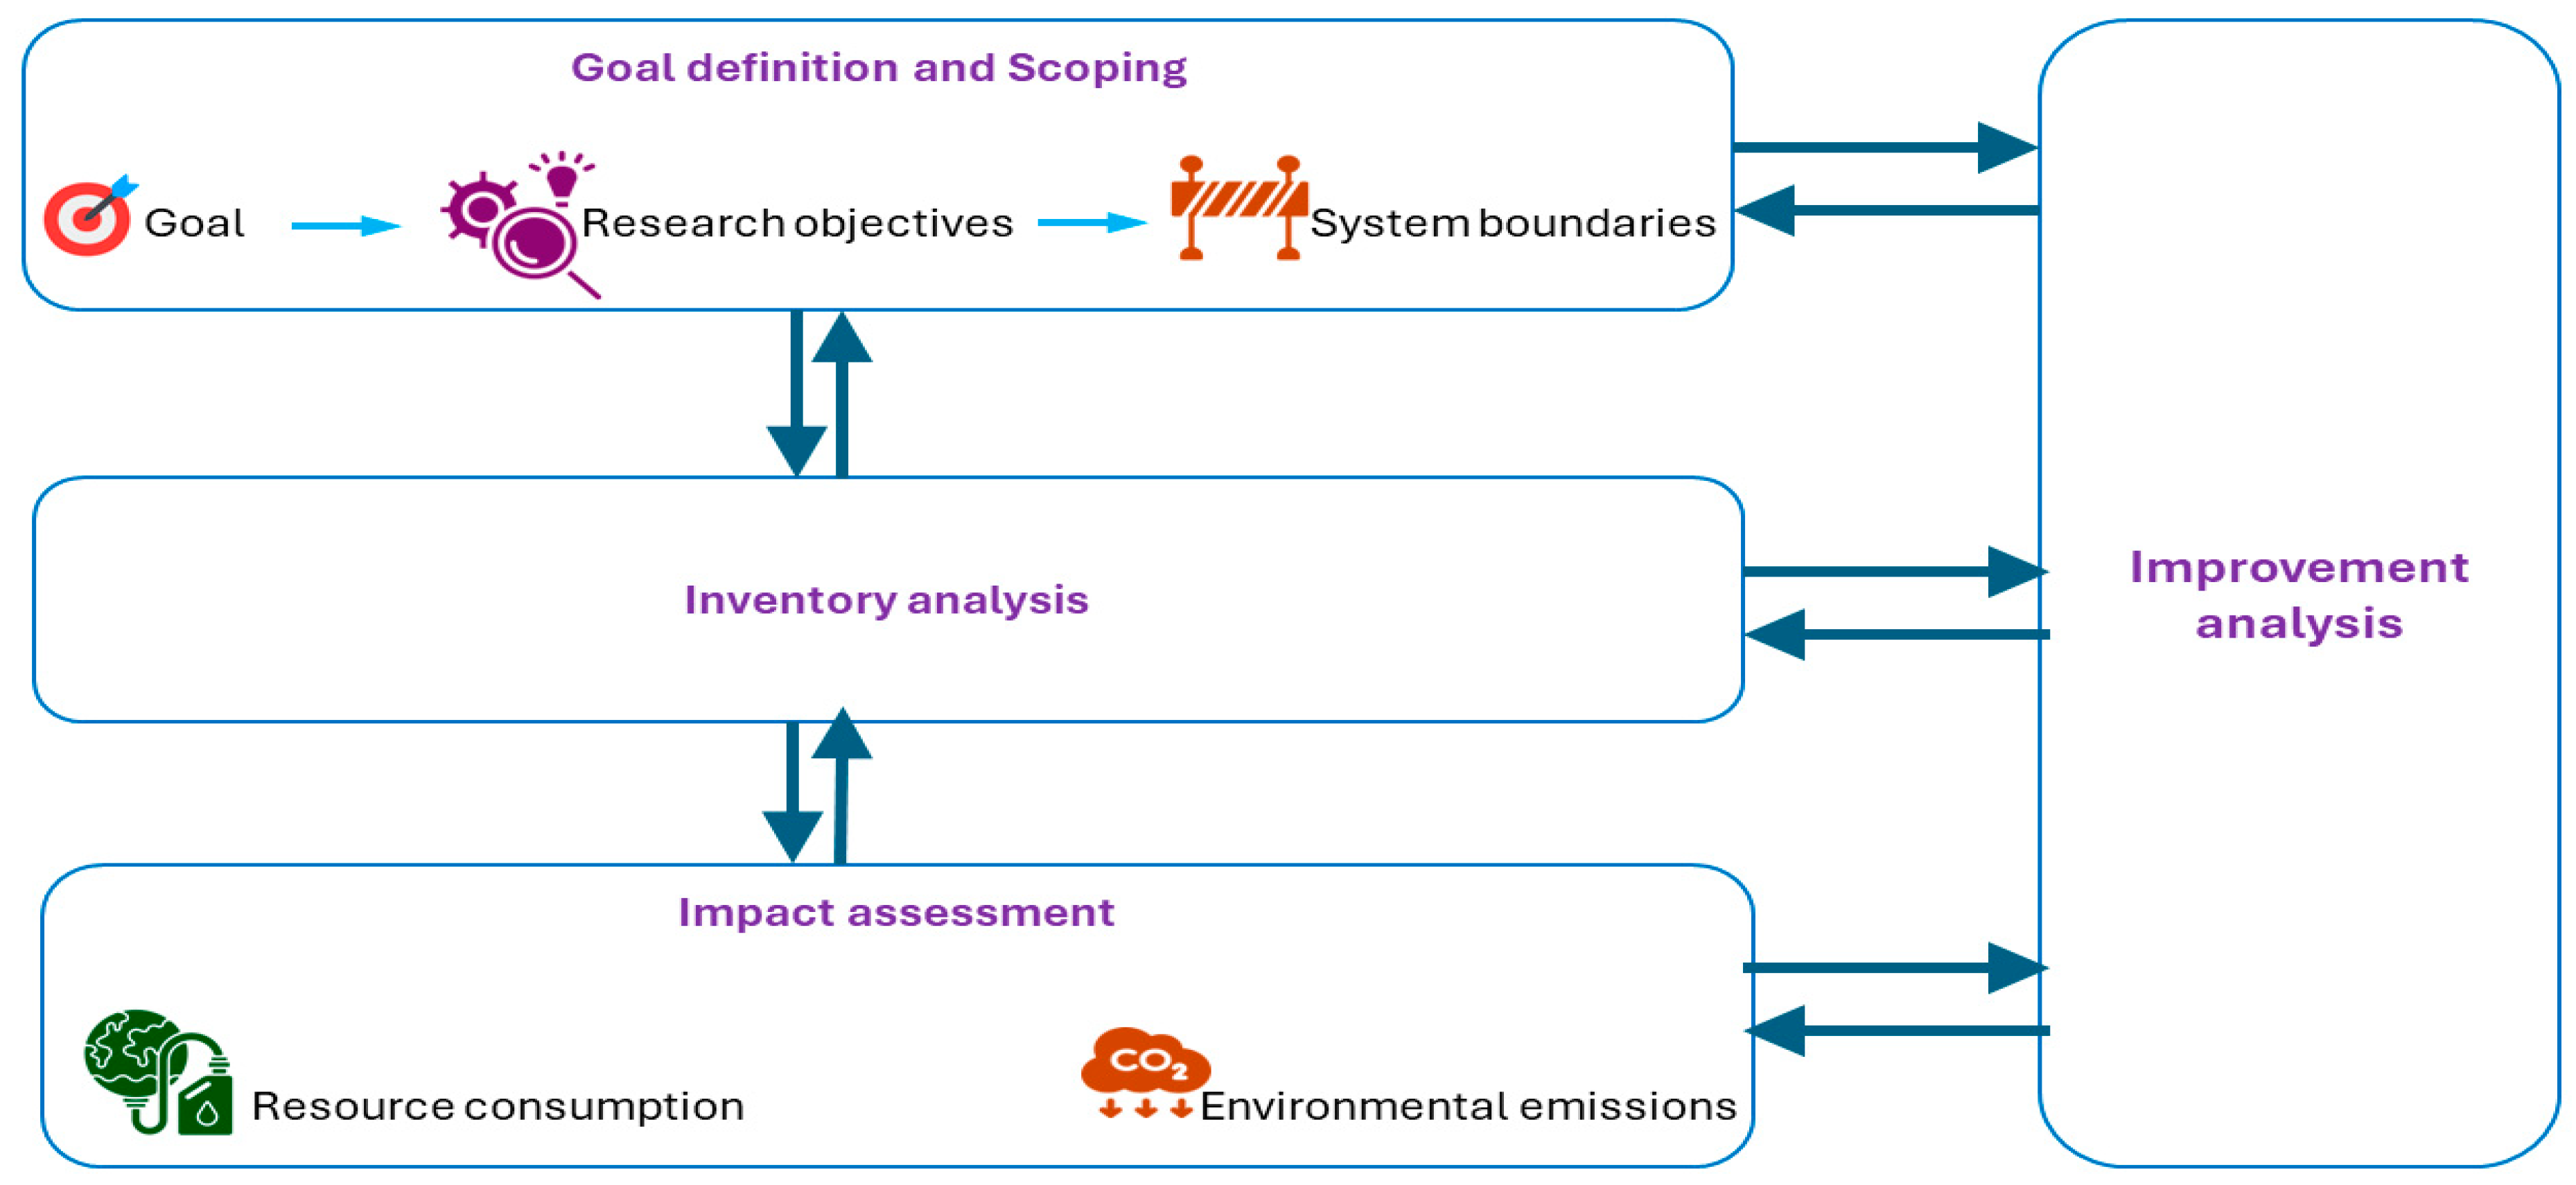
The International Standards Organization (ISO) established four broad stages for life cycle evaluation: The first stage defines the goal and scope of the LCA, and the second stage inventories both the inputs and outputs of the product (Figure 3). The third and fourth stages of the LCA involve evaluating the impact assessment of the input and output of the system and the interpretation of the results, respectively [59].
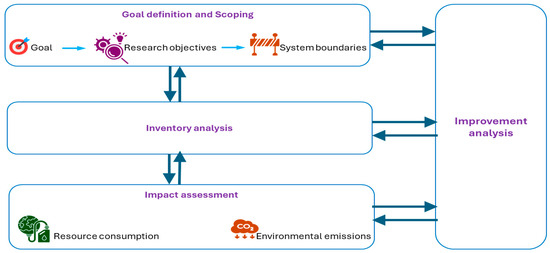
Figure 3.
Stages in LCA adopted for the environmental impact of manufacturing a l kW FC using the cradle-to-gate approach.
3.4. Goal Definition and Scoping
The goal and scoping stage define the purpose of the LCA that is being carried out. In this case, the goal was to evaluate and assess the environmental impact of manufacturing a l kW FC using the cradle-to-gate LCA. In this stage, the system boundaries for the analysis are defined. The scope definition involves setting boundaries for the processes involved in FC production. The environmental impact analysis of the 1 kW FC involves the raw material extraction phase, transportation, production of the FC components, and the energy consumed during these processes up to the manufacturer’s gate. The raw material extraction phase consists of the mining and refining materials such as carbon, polymers, platinum, and other materials needed to produce the 1 kW FC. The manufacturing phase is dedicated to the production of the stack, the balance of plant components, and other accessory essentials for the FC operation. Transportation involves the process of transporting the raw materials and the distribution of the product. All these stages use up one form of energy or the other, which must be considered in the LCA. The functional unit for the LCA is in kW, and this is the basis on which the impact categories are accessed. The PEMFC is expected to have 32,000 operating hours during its lifetime (6 years if continuously operated). SimaPro 9.2 software was used to carry out this assessment.
3.5. Life Cycle Inventory (LCI) Analysis
In this second stage of an LCA, all essential inputs and outputs related to the FC over its lifespan were gathered and quantified according to the goals and scope defined in the first stage [60]. At this phase of the LCA, a comprehensive inventory of the emissions, energy consumption, waste, and other environmental outputs is carried out. The inventory developed at this stage is the basis for other analyses under the Life Cycle Impact Assessment (LCIA) phase. For the LCI of the 1 kW FC, the input and output data used for the evaluation were from the Ecoinvent v3.7.1 dataset and available in Table S1 in the Supplementary Materials. The raw materials inventory included quantifying polymers, carbon, platinum, and other components used to manufacture the 1 kW FC. The energy (fuel and electricity) and water associated with the stages were also quantified at this stage. The output considered for this study included the energy needed, the impact categories, emissions, and other byproducts.
3.6. Life Cycle Impact Assessment (LCIA)
The life cycle impact assessment involves the in-depth estimation of the various environmental impact categories that the production of the 1 kW FC may cause to water bodies, the atmosphere, and humans. These calculations are based on the information provided in the LCI. The effects of impact categories related to acidification, eutrophication, and global warming were calculated at this stage. This study used mid- and end-point impact assessments to estimate the environmental impact. The mid-point indicators gave insight into the instantaneous environmental impacts, resource consumption, and emissions. In contrast, the end-point metrics offered an all-inclusive understanding of long-term impacts, such as biodiversity loss and human health impacts. Mid-point and end-point assessments comprehensively understand all the impact categories of FC production. The life cycle impact assessment method used in this study was ReCiPe 2016 [55].
3.7. Interpretation
In the interpretation phase, the results of the environmental impact assessment were analyzed and discussed. This phase examines the overall impact of the results and where improvements can help reduce damage to human health and the environment. During interpretation, researchers and other stakeholders can gain insight into the social, economic, and environmental aspects of how emissions affect society [61]. This can help in making informed decisions on areas of improvement.
4. Results
4.1. Mid-Point Analysis (Process-Oriented Approach)
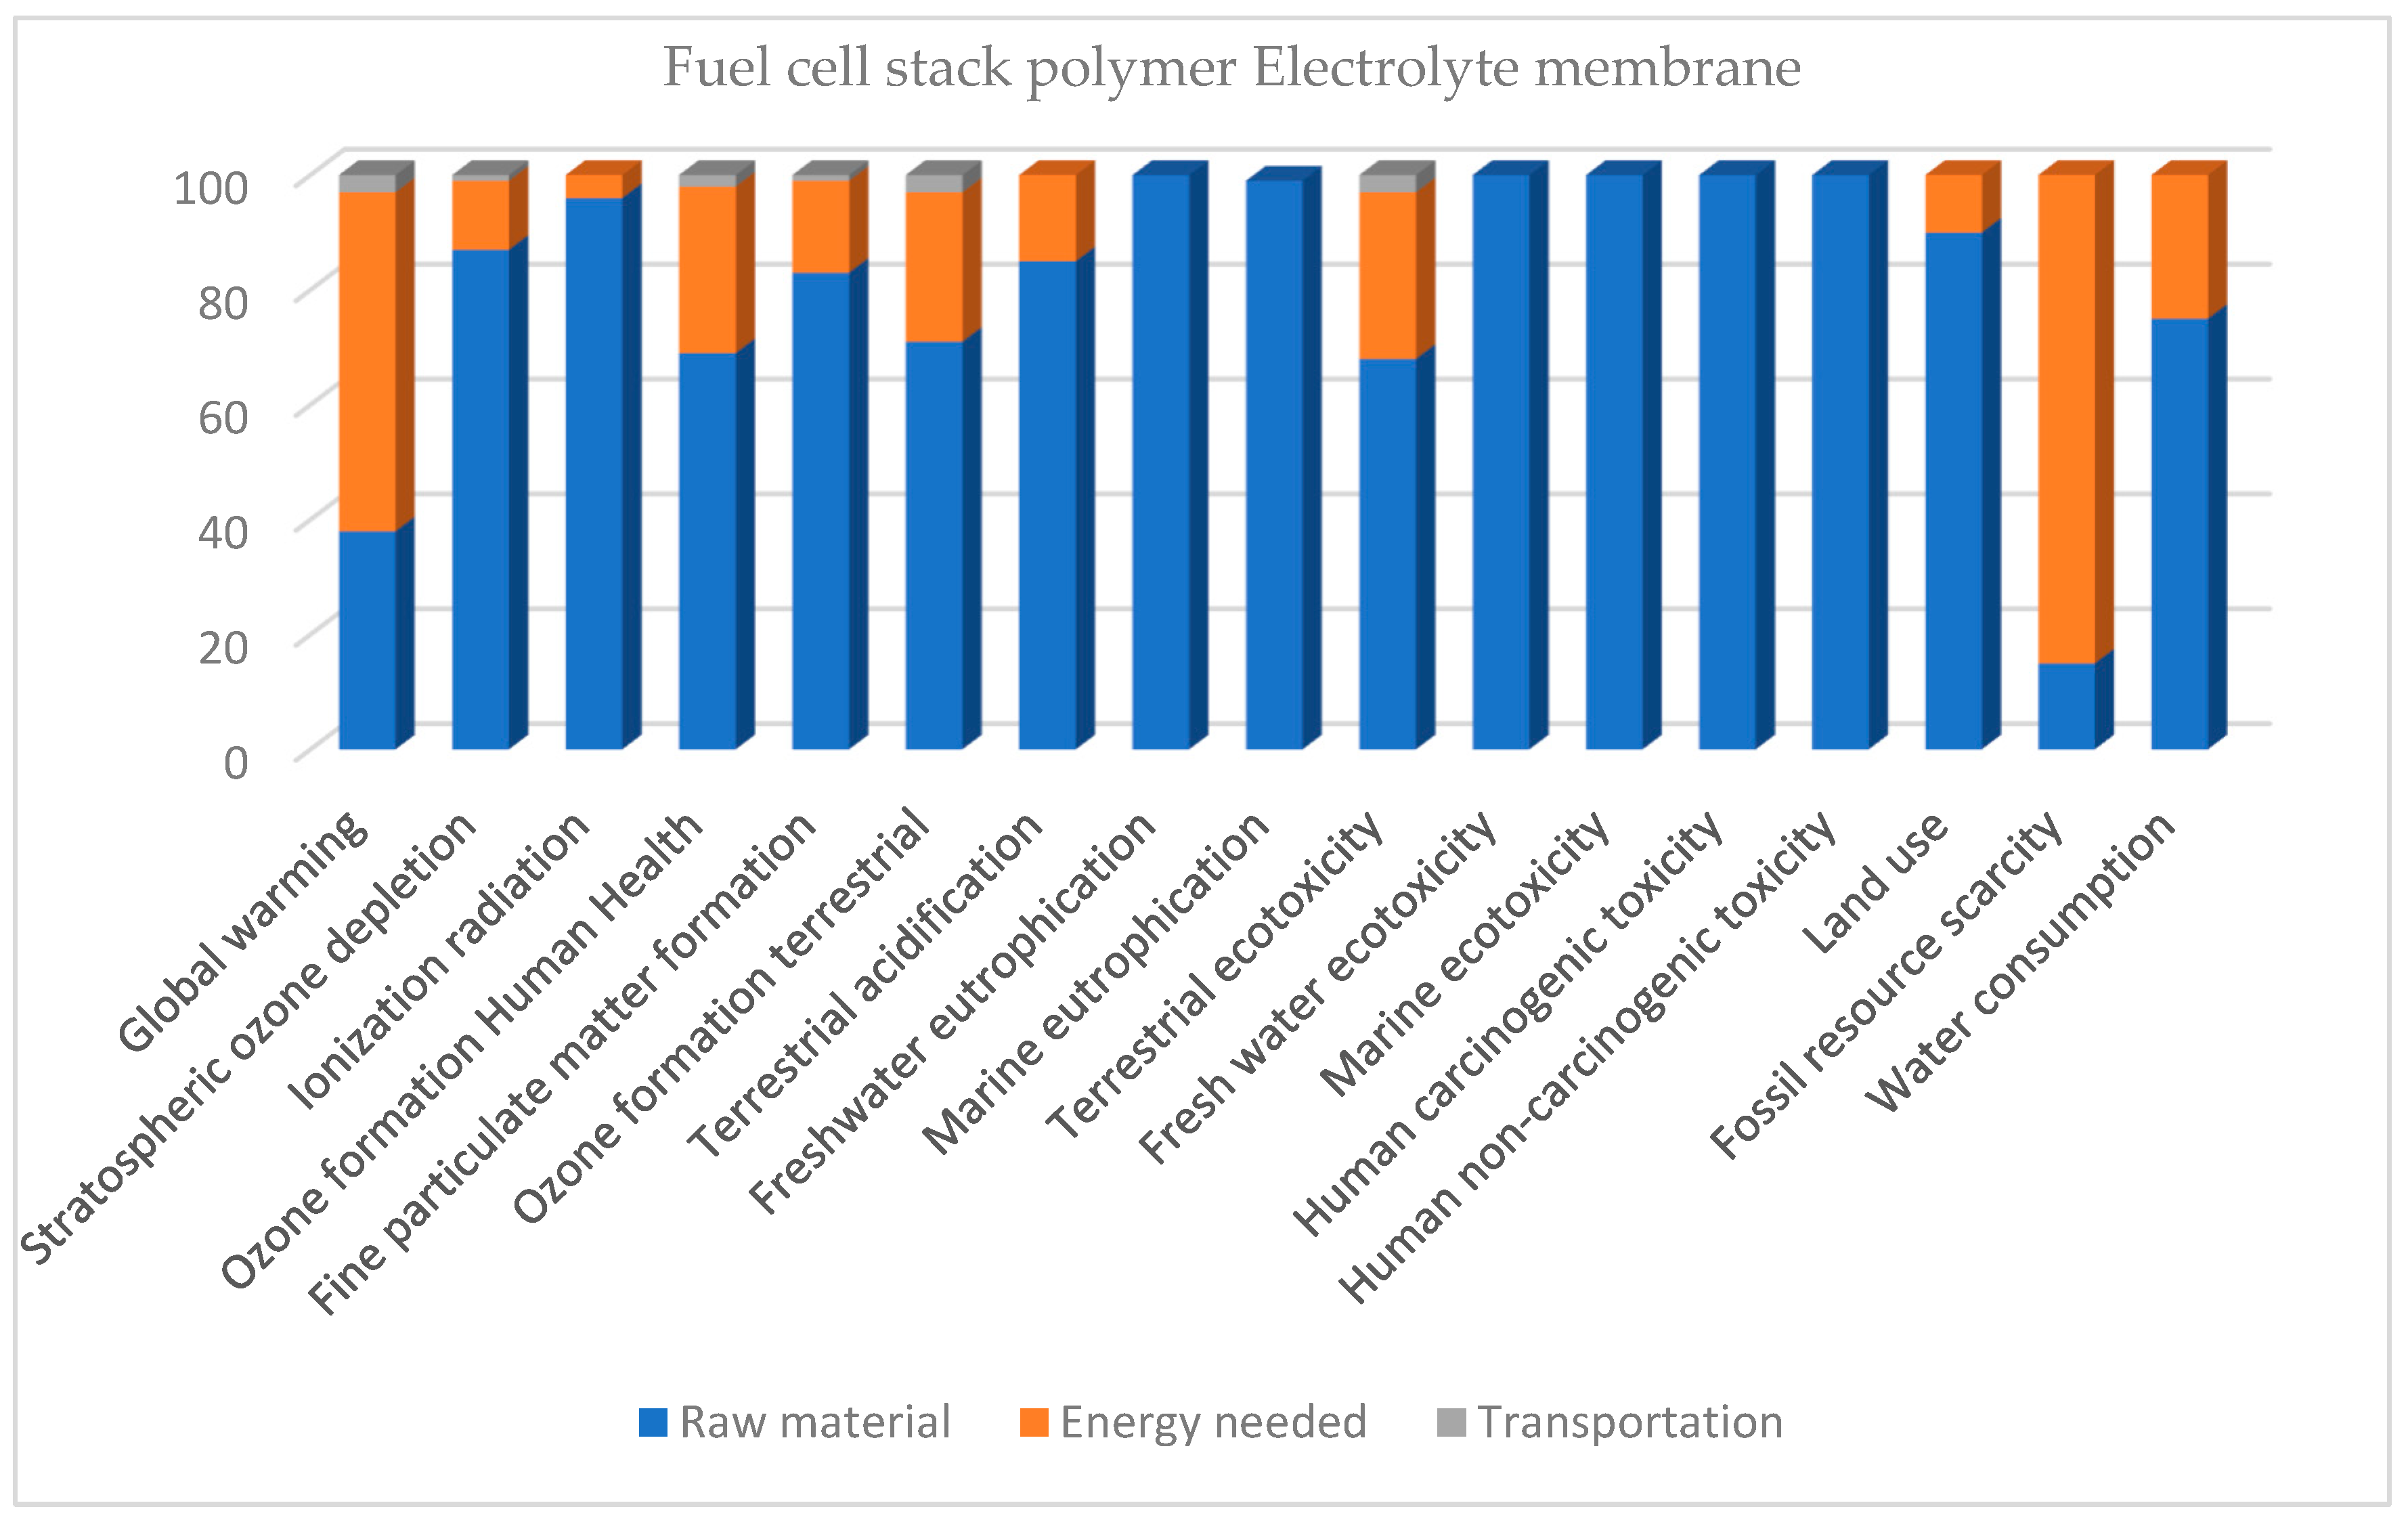
When designing and implementing energy systems like FCs, it is essential to consider how the production processes will affect the environment. Finding ways to improve and making decisions that reduce adverse ecological impacts can be aided by understanding the influence of each stage on different impact categories. This section presents the characterization results of the 1 kW FC system and discusses how the three production processes of the 1 kW FC system—raw material, the energy needed, and transportation—contribute to the environmental impact categories. The characterization results are shown in Table 3, with 18 impact categories and their values. A further analysis with respect to the production stages is presented in Figure 4.
Table 3.
Mid-point characterization results of the environmental impacts of 1 kW FC.
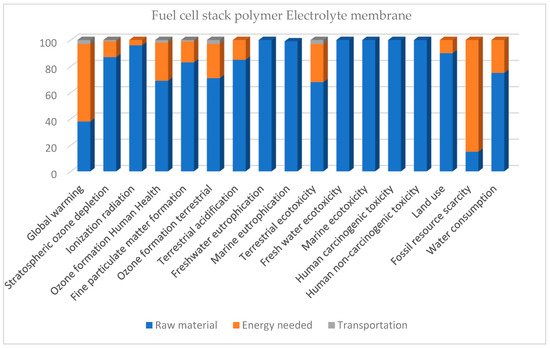
Figure 4.
Contribution of three production processes to impact categories (mid-point).
4.2. Raw Material Process
For the 1 kW FC system, the raw material process has the most influence on several environmental impact categories. Its contribution to freshwater eutrophication, marine eutrophication, human carcinogenic toxicity, marine ecotoxicity, and human non-carcinogenic toxicity is the highest (100%). Furthermore, it contributes substantially to the production of fine particulate matter (83%), ionization radiation (96%), land use (90%), stratospheric ozone depletion (87%), and terrestrial acidification (85%). Based on these findings, it can be deduced that the extraction and processing of raw materials for the FC system have a significant influence on the environment in a variety of different areas.
4.3. Energy Needed
The energy associated with the production of the 1 kW FC system is a major factor in the depletion of fossil resources (85%) and the acceleration of global warming (59%). It has significant impacts on ozone formation—human health (29%), ozone formation—terrestrial ecosystems (26%), fine particulate matter formation (16%), and terrestrial acidification (15%). These findings indicate that the energy usage during FC system manufacturing has a notable effect on the depletion of fossil resources and the release of greenhouse gases, in addition to its contribution to other environmental impact categories.
4.4. Transportation
The transportation process has relatively lower environmental impacts than the raw material and the energy-intensive processes of producing the 1 kW FC. Its most notable impacts are on terrestrial ecotoxicity, global warming, and ozone formation on land. These findings suggest that transporting materials and components for the 1 kW FC system has a significantly lower environmental footprint than the other two procedures. Various strategies can be implemented to reduce the environmental impact of transportation. These include optimizing logistics and transportation routes to minimize distance and trips and adopting eco-friendly transportation methods. Some examples of these approaches include deploying electric or hybrid vehicles with low-emission fuels, enforcing strict emission control measures, regularly maintaining vehicles to minimize pollutant release, and promoting local suppliers and materials to reduce the need for long-distance transportation.
Human non-carcinogenic toxicity, terrestrial ecotoxicity, freshwater toxicity, human carcinogenic toxicity, and marine ecotoxicity were grouped and captioned ‘toxicity’. Toxicity, alongside the two top environmental impacts, global warming and fossil resource scarcity, was further analyzed to understand the exact substance contributing to these impact categories.
4.5. Toxicity
The toxicity impact values indicate the potential environmental and human health risks associated with the 1 kW FC energy system, underlining the significance of an in-depth understanding and suitable risk mitigation techniques. These categories cover marine ecotoxicity, freshwater toxicity, terrestrial ecotoxicity, human carcinogenic toxicity, and human non-carcinogenic toxicity. Toxicants, either carcinogenic or non-carcinogenic, can be highly hazardous to humans.
The characterization results of the 1 kW FC system are shown in Table 3. The toxicity results correspond to the levels of harm caused to marine ecosystems (44.82992 kg 1,4-DCB eq), freshwater ecosystems (35.13203 kg 1,4-DCB eq), terrestrial ecosystems (129.5218 kg 1,4-DCB eq), and the human cancer-causing potential (10.88584 kg 1,4-DCB eq) and human non-cancer-causing potential (1109.935 kg 1,4-DCB eq). This indicates that approximately 1330.305 kg of 1,4-DCB eq is generated for every 1 kW of power generated by the FC system. These figures illustrate the potentially hazardous impacts of the 1 kW FC energy system on various environmental sectors and human health. Toxic substances released during the life cycle of an FC system can harm marine organisms and disrupt aquatic ecosystems, negatively impact aquatic life and water quality in freshwater bodies, contaminate soil and harm terrestrial flora and fauna, and endanger human health, including the development of cancers and other adverse health effects such as respiratory issues, neurological disorders, and organ toxicity.
It is critical to identify the specific substances contributing to each toxicity category and devise strategies to reduce their release, such as utilizing alternative materials, enhancing production processes, and ensuring appropriate disposal and recycling procedures to mitigate these toxic effects. In addition, performing site-specific risk assessments can assist in quantifying the actual toxicity effects based on the specific environmental conditions and population exposure.
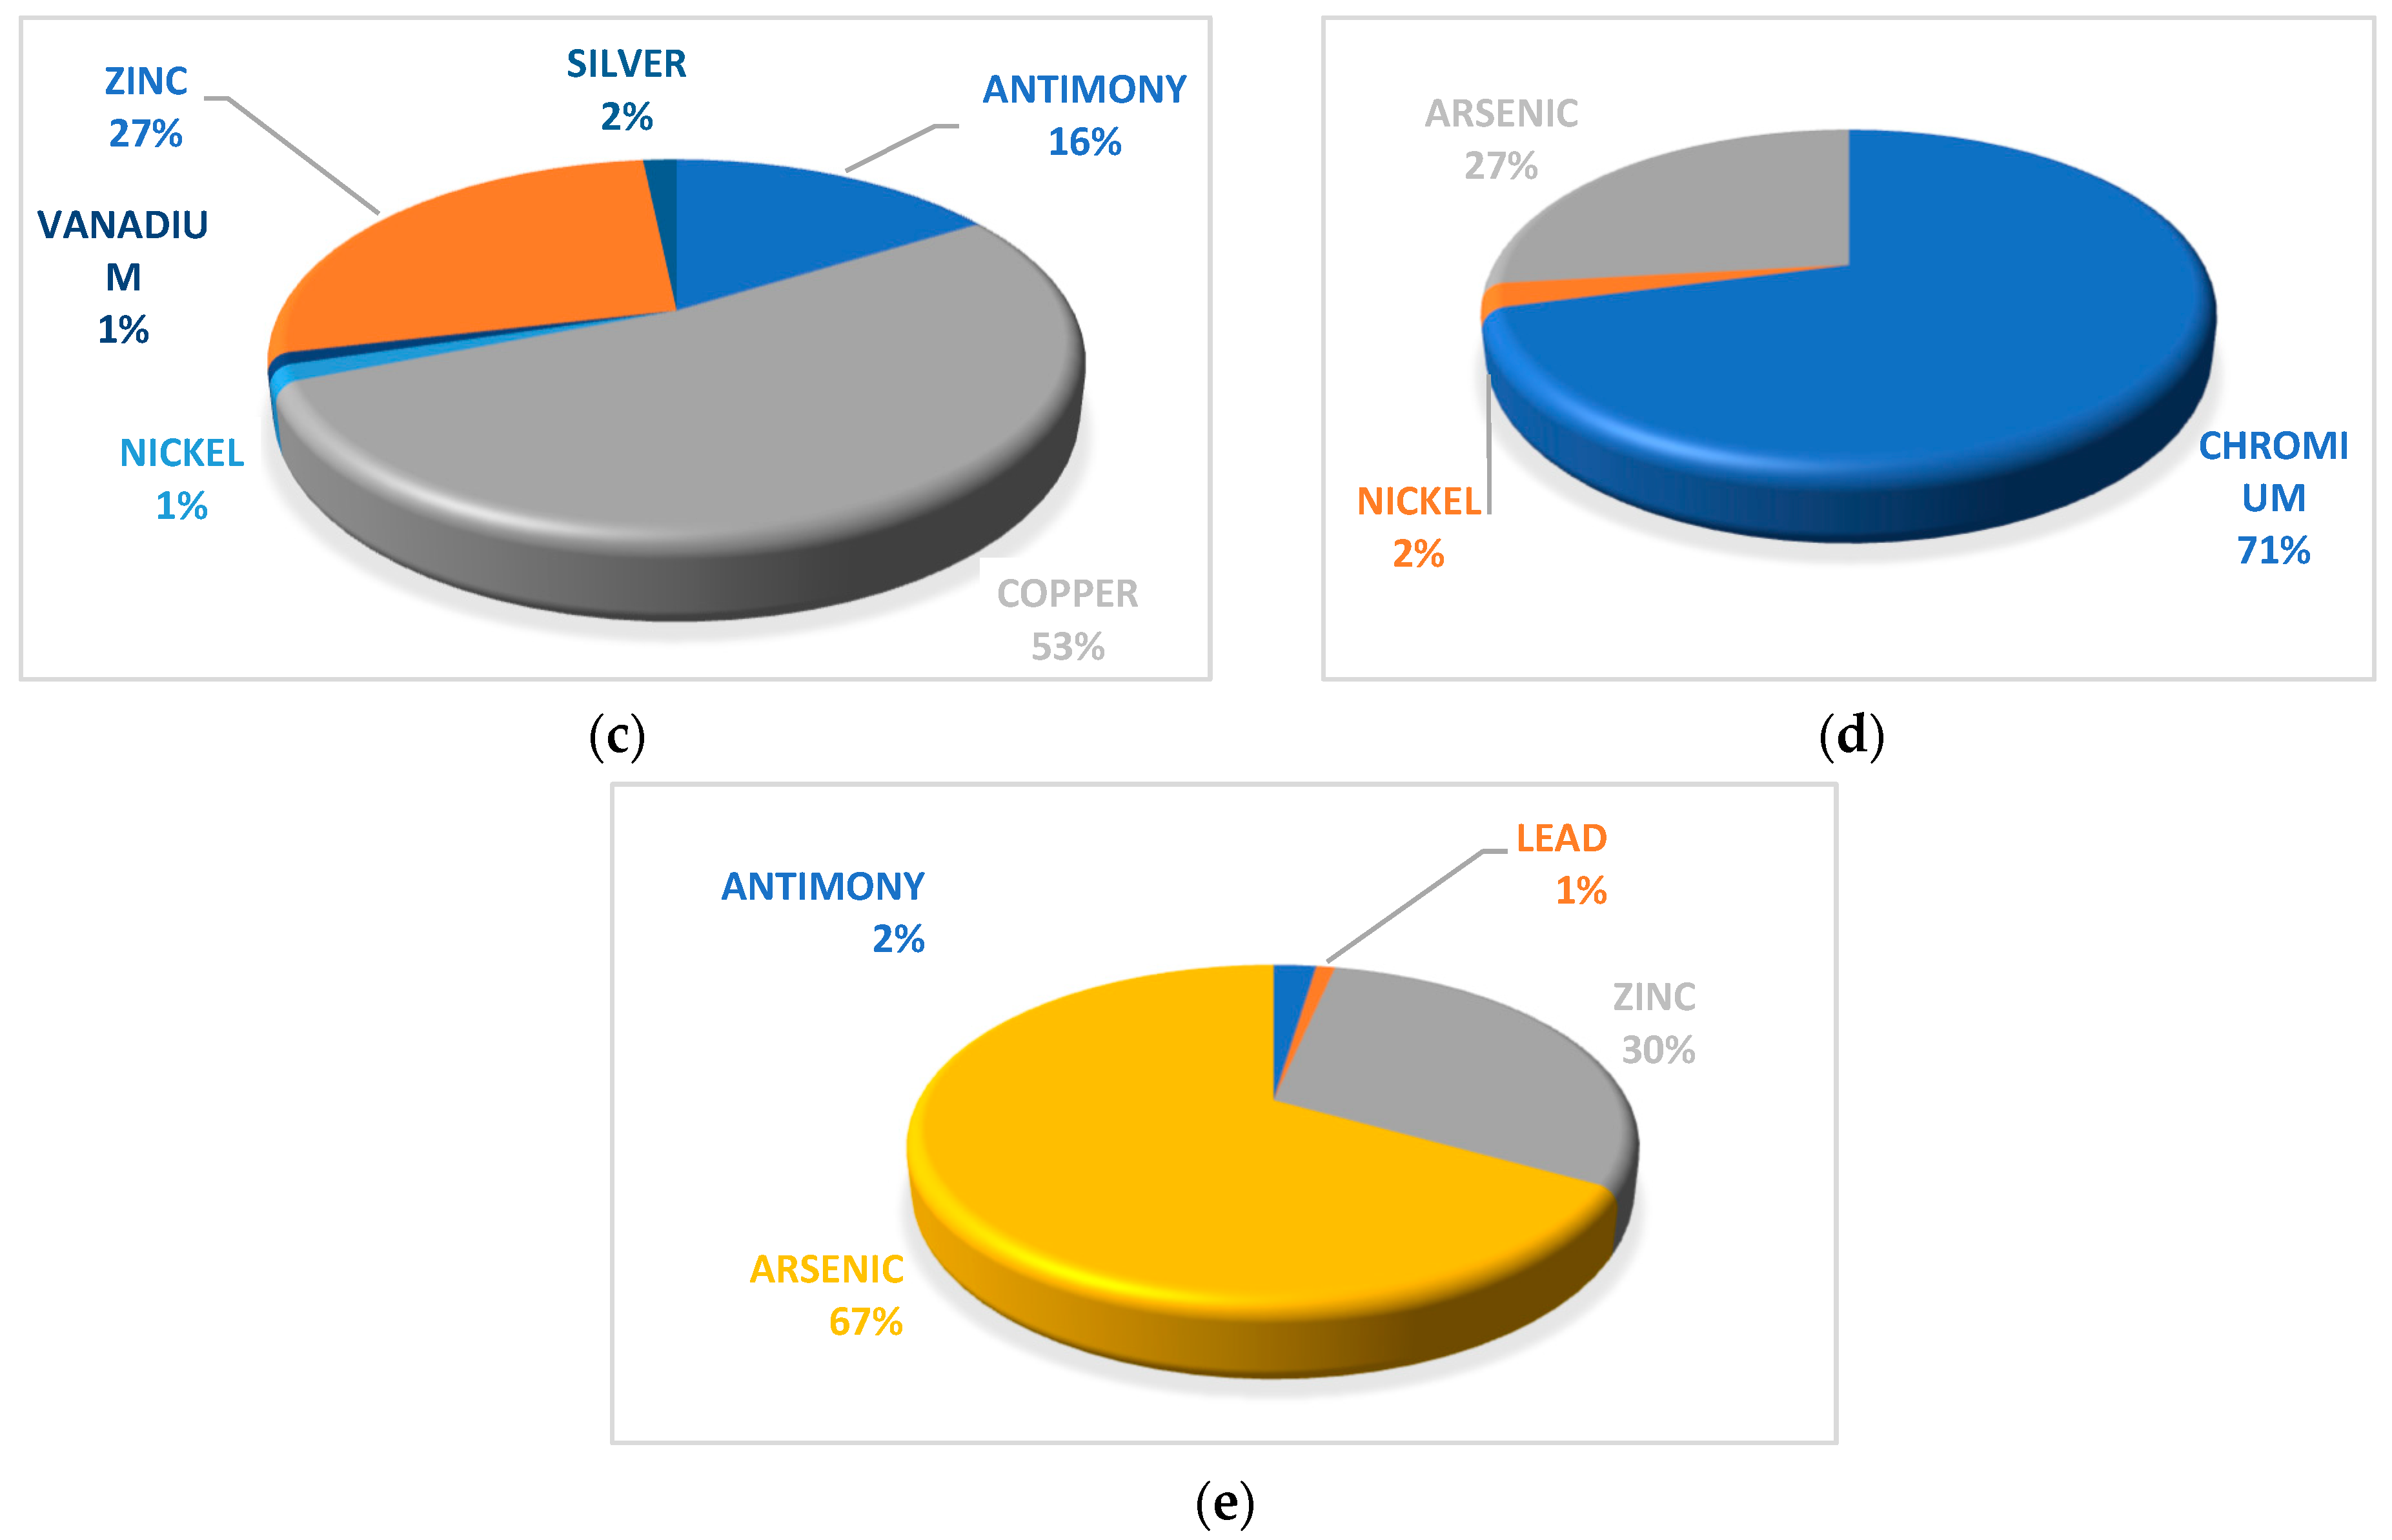
Further analysis of the elemental contribution of the FC to terrestrial ecotoxicity is depicted in Figure 5. The results show that copper contributed the most (53.7%) to terrestrial ecotoxicity, followed by Zinc (12.5%), Nickel (7.4%), Mercury (6%), Chromium (5.6%), Antimony (5.4%), Vanadium (5.3%), Lead (2%), and Arsenic (1%). An analysis of the toxicity caused to the freshwater bodies shows that the element with the greatest impact on the freshwater is also Copper with 55.6%, followed by Zinc (24%), and Antimony (14.8%). Silver, Nickel, Arsenic, and Vanadium also contributed 1.89%, 1.5%, 1%, and 1%, respectively, to freshwater contamination. With regard to marine water contamination, Copper had the highest concentration (51.8%), while Vanadium contributed the least at 1%. Other elements that contributed to marine water contamination include Zinc (26.5%), Antimony (15.8%), Silver (1.6%), and Nickel (1%).
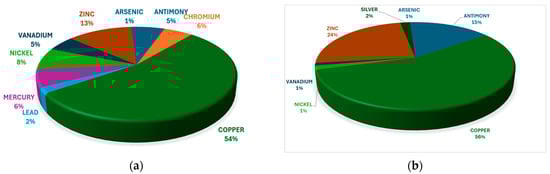

Figure 5.
Substances contributing to toxicity: (a) terrestrial ecotoxicity (emissions in air); (b) freshwater ecotoxicity (emissions in air); (c) marine ecotoxicity (emissions in water); (d) human non-carcinogenic toxicity (emissions in water); (e) human non-carcinogenic toxicity (emissions in water).
4.6. Global Warming
The concept of global warming and its relationship to climatic changes has received global attention, which is the result of human activities such as burning fossil fuels, deforestation, and industrial processes. Gases in the atmosphere, like carbon dioxide (CO2), methane (CH4), water vapor, and others, trap heat from the sun and keep it from going back into space. The Earth’s surface stays warm enough for life as we know it because of this process.
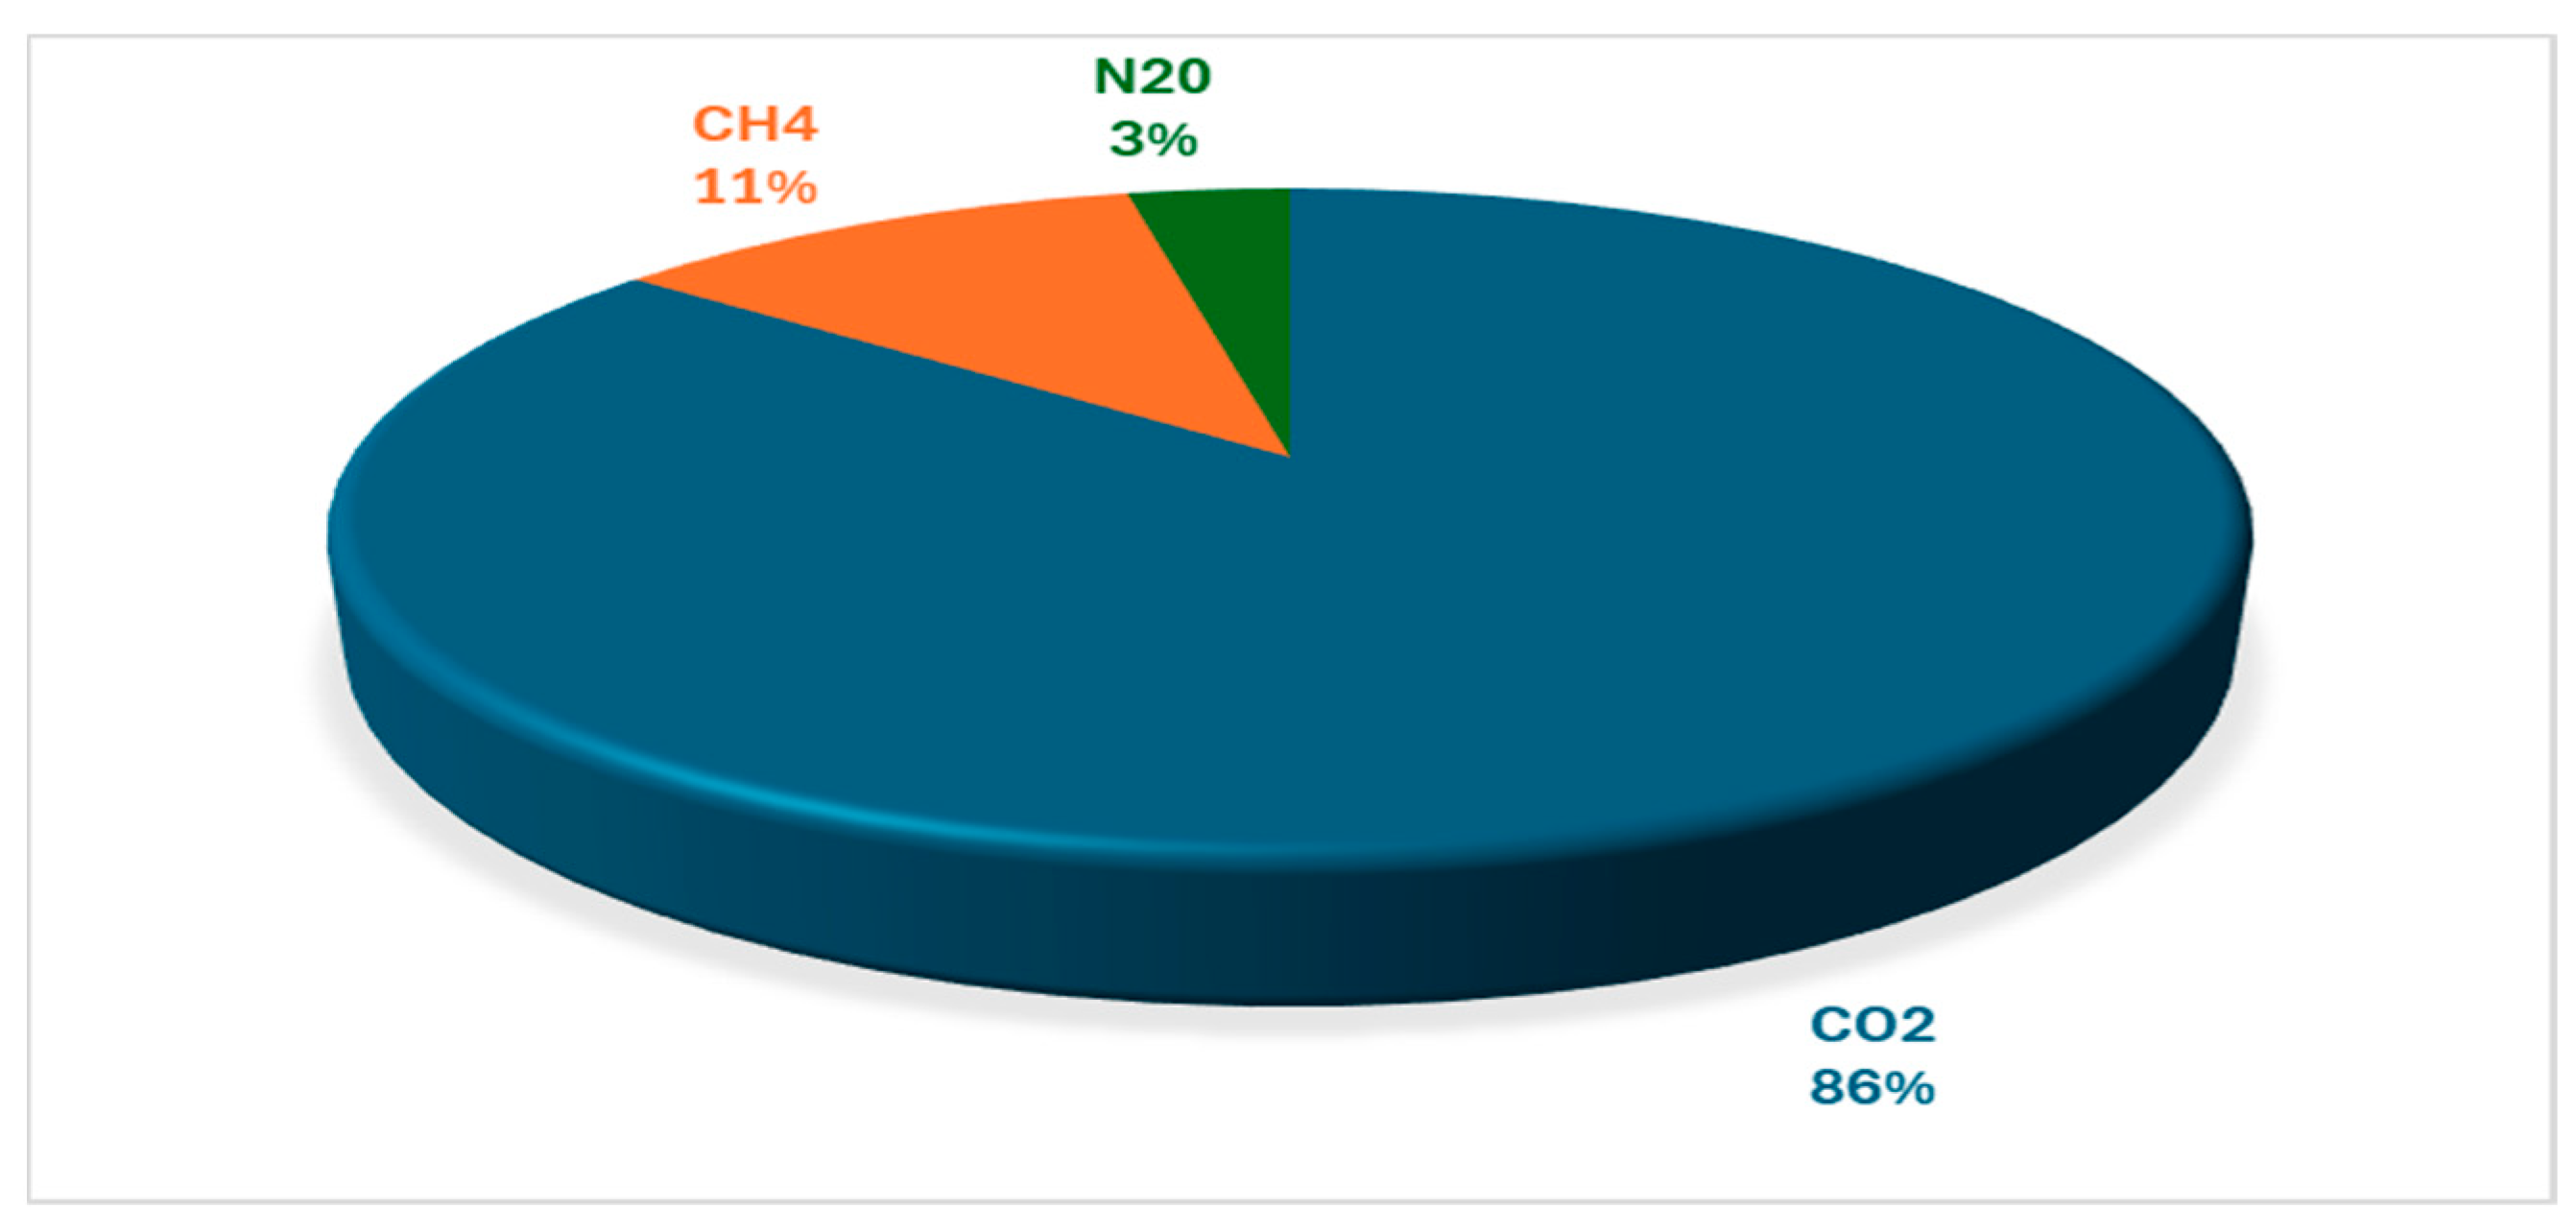
According to the characterization results presented in Table 3, it is apparent that for every 1 kW of energy produced by the FC energy system, about 193.16 kg of carbon dioxide equivalent (CO2 eq) emissions are discharged into the environment. This signifies a substantial ecological impact linked to the functioning of FC technology. Further analysis reveals that CO2 is responsible for a significant portion of the total CO2 equivalent emissions. Specifically, CO2 contributes 82.77 kg, which represents 85.7% of the total emissions (Figure 6). In addition, CH4 and nitrous oxide (NO2) account for 11% and 3.3% of the total emissions, respectively. These findings highlight the need to understand the composition of greenhouse gas emissions originating from the FC system, with a particular emphasis on the substantial contribution of CO2. These insights are essential for developing successful methods to reduce the impact and improve the environmental sustainability of FC energy systems.
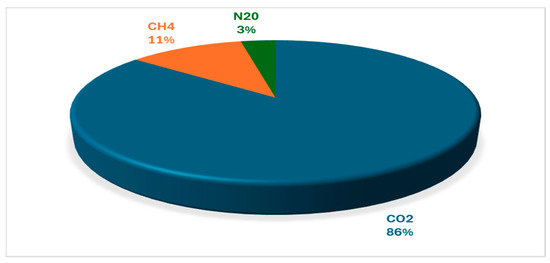
Figure 6.
Substances contributing to global warming.
4.7. Fossil Resource Scarcity
The fossil fuel resources for a 1 kW FC energy system, as provided, are significantly reliant on non-renewable sources, with coal, natural gas, and crude oil accounting for 100% of the fuel mix; this mix raises serious questions about the system’s environmental impact and long-term viability. Coal, accounting for the majority of the fuel mix at 62.2%, as seen in Figure 7, is renowned for its significant environmental impact. Coal combustion emits significant quantities of greenhouse gases, including carbon dioxide, which contribute to the phenomenon of climate change. Furthermore, coal mining operations frequently result in the destruction of habitats, polluting of water sources, and worsening of air quality. The use of coal in this FC device worsens these environmental concerns. Moreover, coal is a finite resource with limited availability. With the increasing global energy demands, the depletion of coal supplies is becoming an urgent concern. The significant reliance on coal in this FC system raises concerns over its long-term sustainability and the possibility of future supply disruptions.
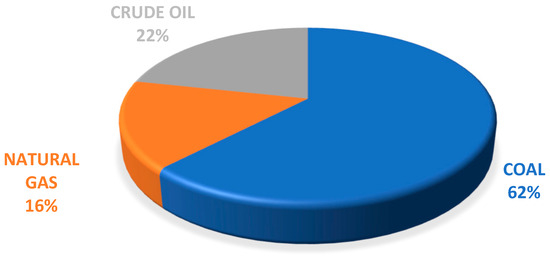
Figure 7.
Substances contributing to fossil resource scarcity.
Natural gas and crude oil, which make up 16.2% and 21.6% of the fuel mix, respectively, provide comparatively cleaner options in comparison to coal. Specifically, natural gas exhibits higher combustion efficiency and generates lower quantities of greenhouse gas emissions. Nevertheless, these fossil fuels remain non-renewable and prone to depletion. The production and transportation of natural gas and crude oil precipitates environmental hazards, including methane emissions and oil spills, which can have significant ecological implications.
The finite nature of these fossil fuel resources emphasizes the necessity for a shift towards renewable energy sources. Renewable alternatives, such as solar, wind, and hydropower, provide a more sustainable and eco-friendly energy generation method. To reduce the environmental impact of the FC system and tackle the issues of limited fossil resources, it is necessary to vary the fuel mix and increase the proportion of renewable energy sources. Furthermore, investment in renewable energy technology can spur innovation, generate new economic possibilities, and help to build a more resilient and sustainable energy infrastructure. Governments, corporations, and individuals must prioritize the transition to cleaner energy sources to address climate change and assure a sustainable future.
4.8. End-point Analysis (Damage-Oriented Approach)
The environmental impact characterization results for a 1 kW FC stack offer useful insights into the various impact categories impacted by its production. The findings (Table 4)—presented in various units such as DALY for human health impacts, species per year for ecosystem impacts, and US dollars for resource scarcity—indicate the most pressing areas of concern.
Table 4.
End-point characterization results of the environmental impacts of the 1 kW FC stack.
The effects of acidification and climate change on freshwater ecosystems are less severe than those on terrestrial ecosystems. An examination of resource scarcity indicates a greater dependence on fossil resources in comparison to mineral resources. Other impact categories, such as ozone formation, affect both human health and terrestrial ecosystems to varying degrees. Reducing emissions that cause human toxicity, particulate matter formation, and terrestrial acidification should be the primary focus of efforts to mitigate these environmental impacts. Improvements in energy efficiency and increased use of renewable energy sources should also be prioritized. Optimizing resources and reducing the overall environmental imprint should be the top priorities of ongoing FC technology research and development.
4.9. Damage Assessment
Table 5 displays the results of the overall environmental effects resulting from the manufacturing of a 1 kW FC stack. The assessment is divided into three main categories: human health, ecosystems, and resources. The overall impact on human health is 0.000866 DALY, which designates it as the most affected area. This discovery implies that the manufacturing procedure leads to a substantial decrease in the duration of disease-free years due to factors such as the formation of particulate matter, global warming, and non-carcinogenic toxicity.
Table 5.
Damage assessment result.
The damage to environments is measured by the number of species that die each year, which adds up to 1.04 × 10⁻⁶ species/yr. This shows that, in comparison to the effect on human health, the production of FC stacks has a negligible impact on ecosystem degradation and biodiversity loss. The impact related to the depletion of resources is measured in terms of United States dollars (2013) and amounts to USD2013 6.16844. This is an indication of the economic cost that is linked with the consumption of both mineral and fossil resources during the production process. To reduce these negative impacts, manufacturers should prioritize more environmentally friendly production processes, improve the efficiency of resource usage, and encourage the adoption of renewable resources. To decrease the overall environmental impact of the FC stack, it is important to focus on minimizing toxic emissions and mitigating the potential for global warming. Furthermore, the implementation of green practices and the use of circular economy principles can effectively mitigate the strain on ecosystems and limited resources.
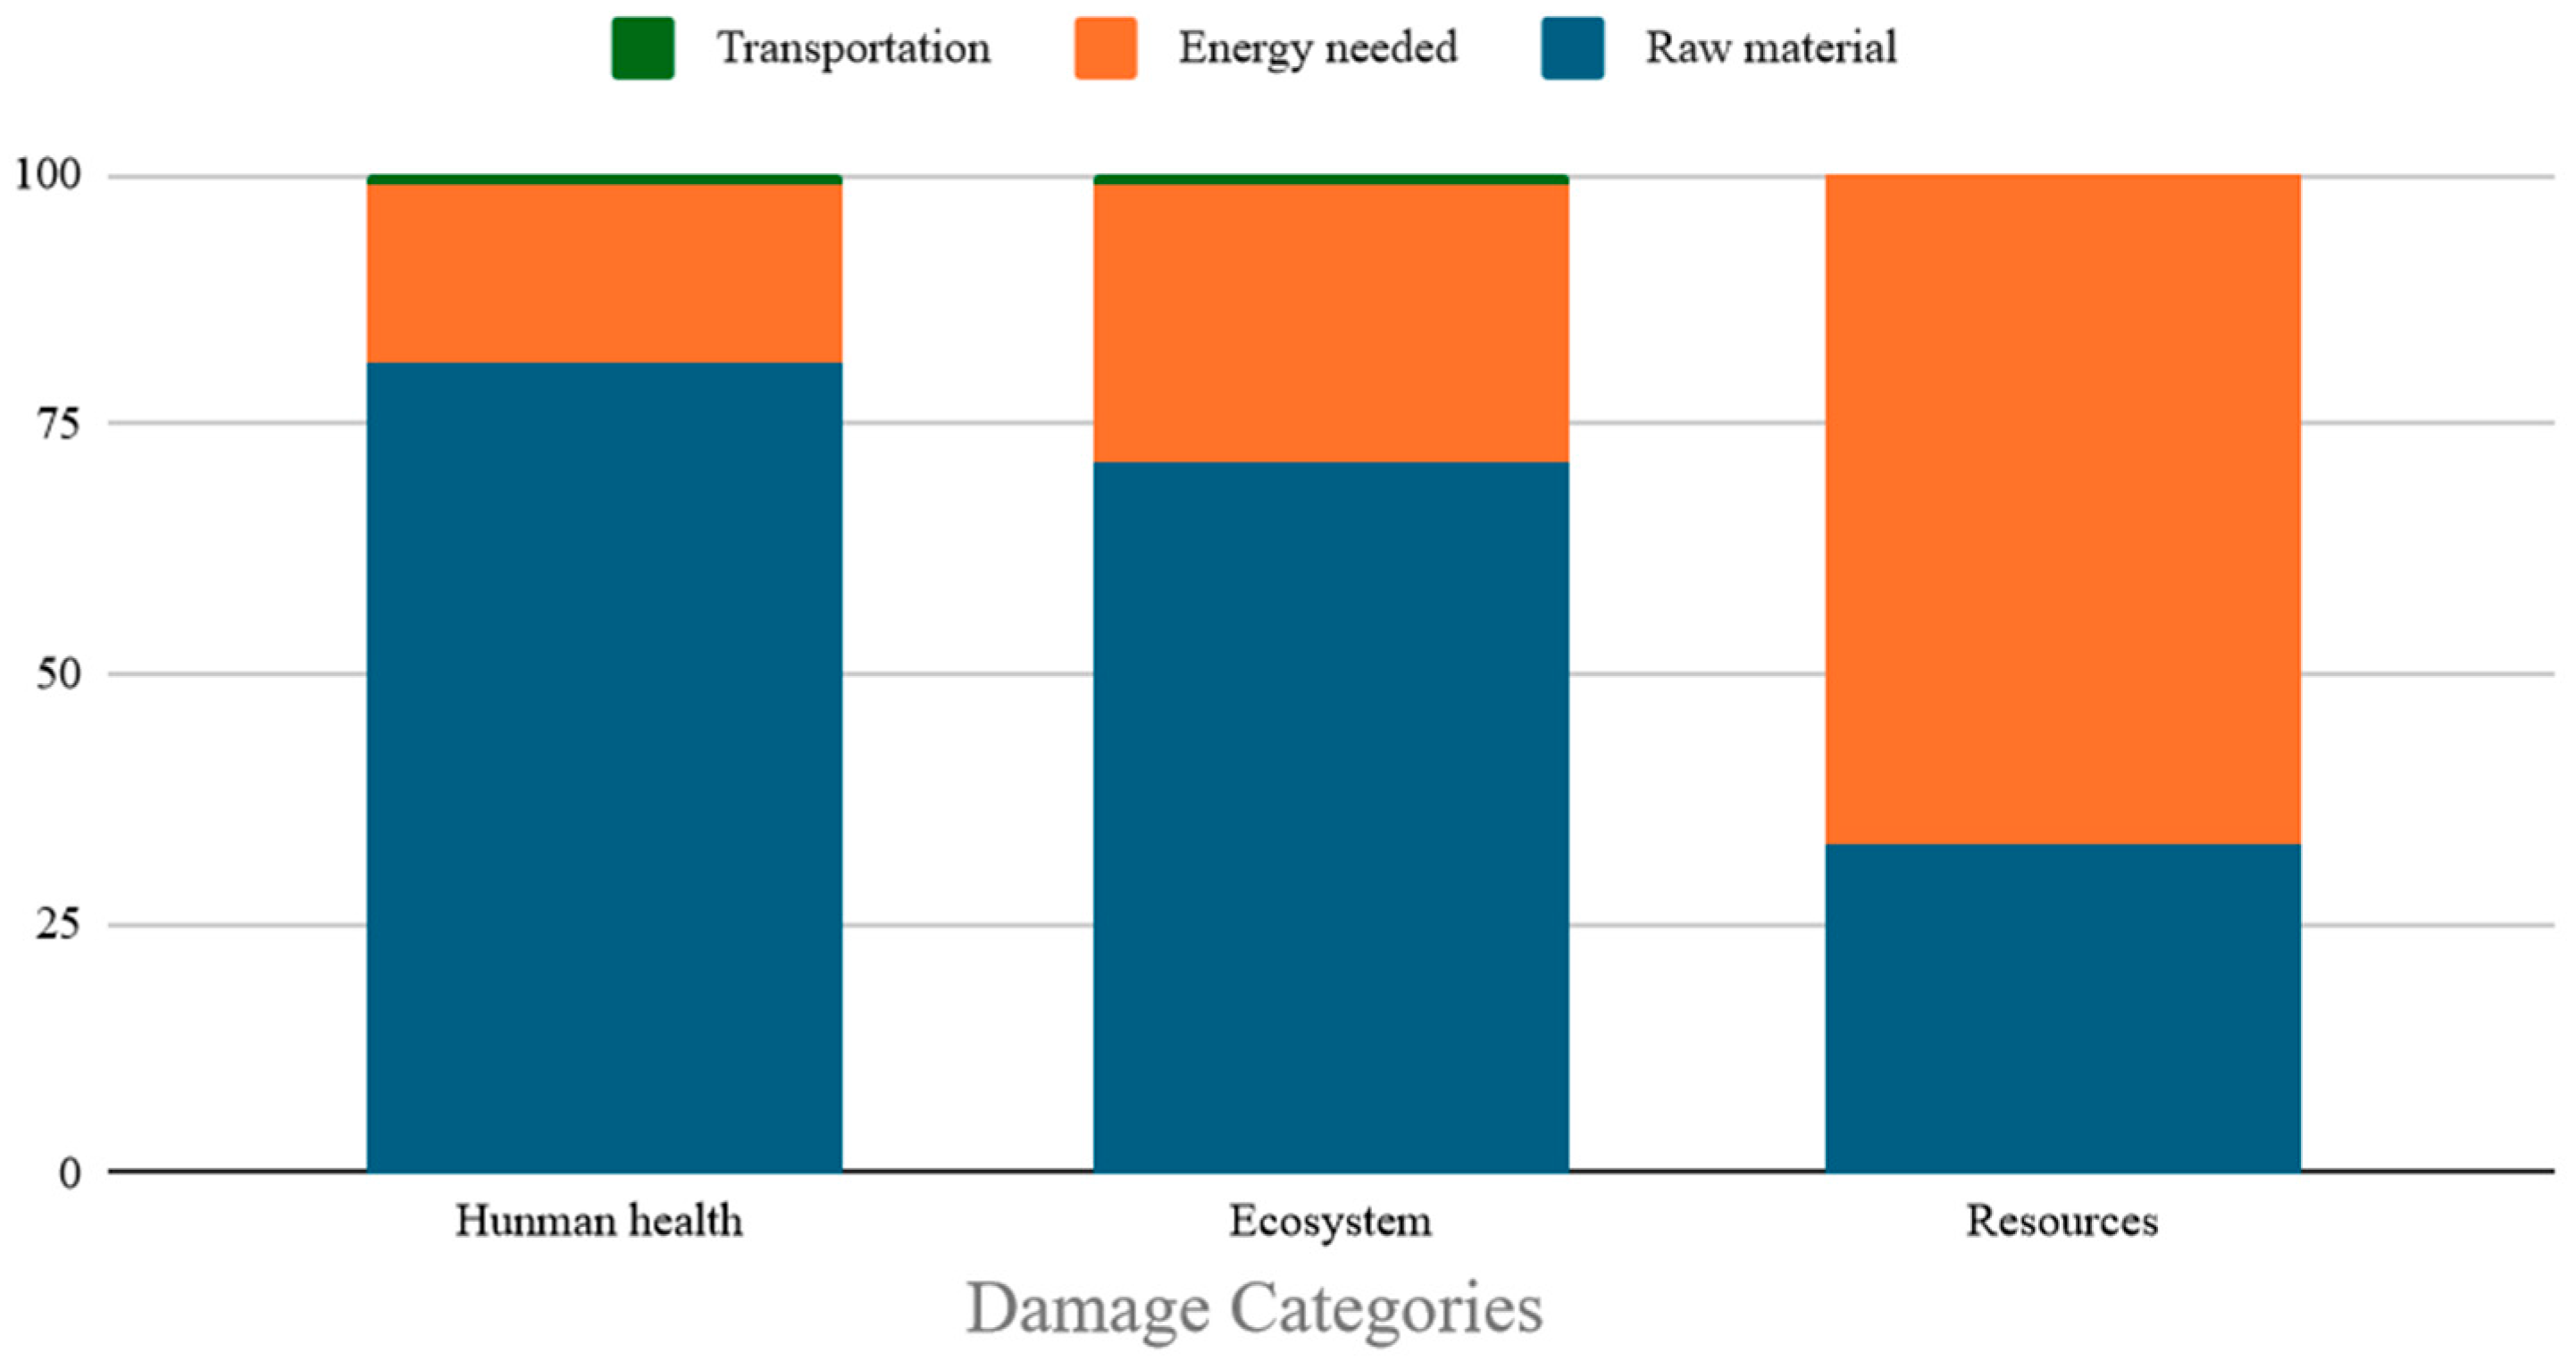
Figure 8 illustrates the corresponding impact of various stages of the 1 kW FC stack production on three primary categories of damage: human health, ecosystems, and resources. The raw material extraction and processing phase is the leading cause of human health damage (81%), damage to ecosystems (71%), and damage to resources (33%). The energy required to produce FC stacks is the second-largest contributor to the human health damage category (18%), the primary driver of resource depletion (67%), and accounts for 28% of ecosystem damage. Transportation contributes very little to all three categories of damage, accounting for 1% of the total impact on human health and environmental damage and making no contribution to resource depletion. To lower the overall environmental impact of 1 kW FC stack production, efforts should be directed at optimizing the raw material stage and increasing energy efficiency throughout the manufacturing process.

Figure 8.
Contribution of three production processes to damage categories.
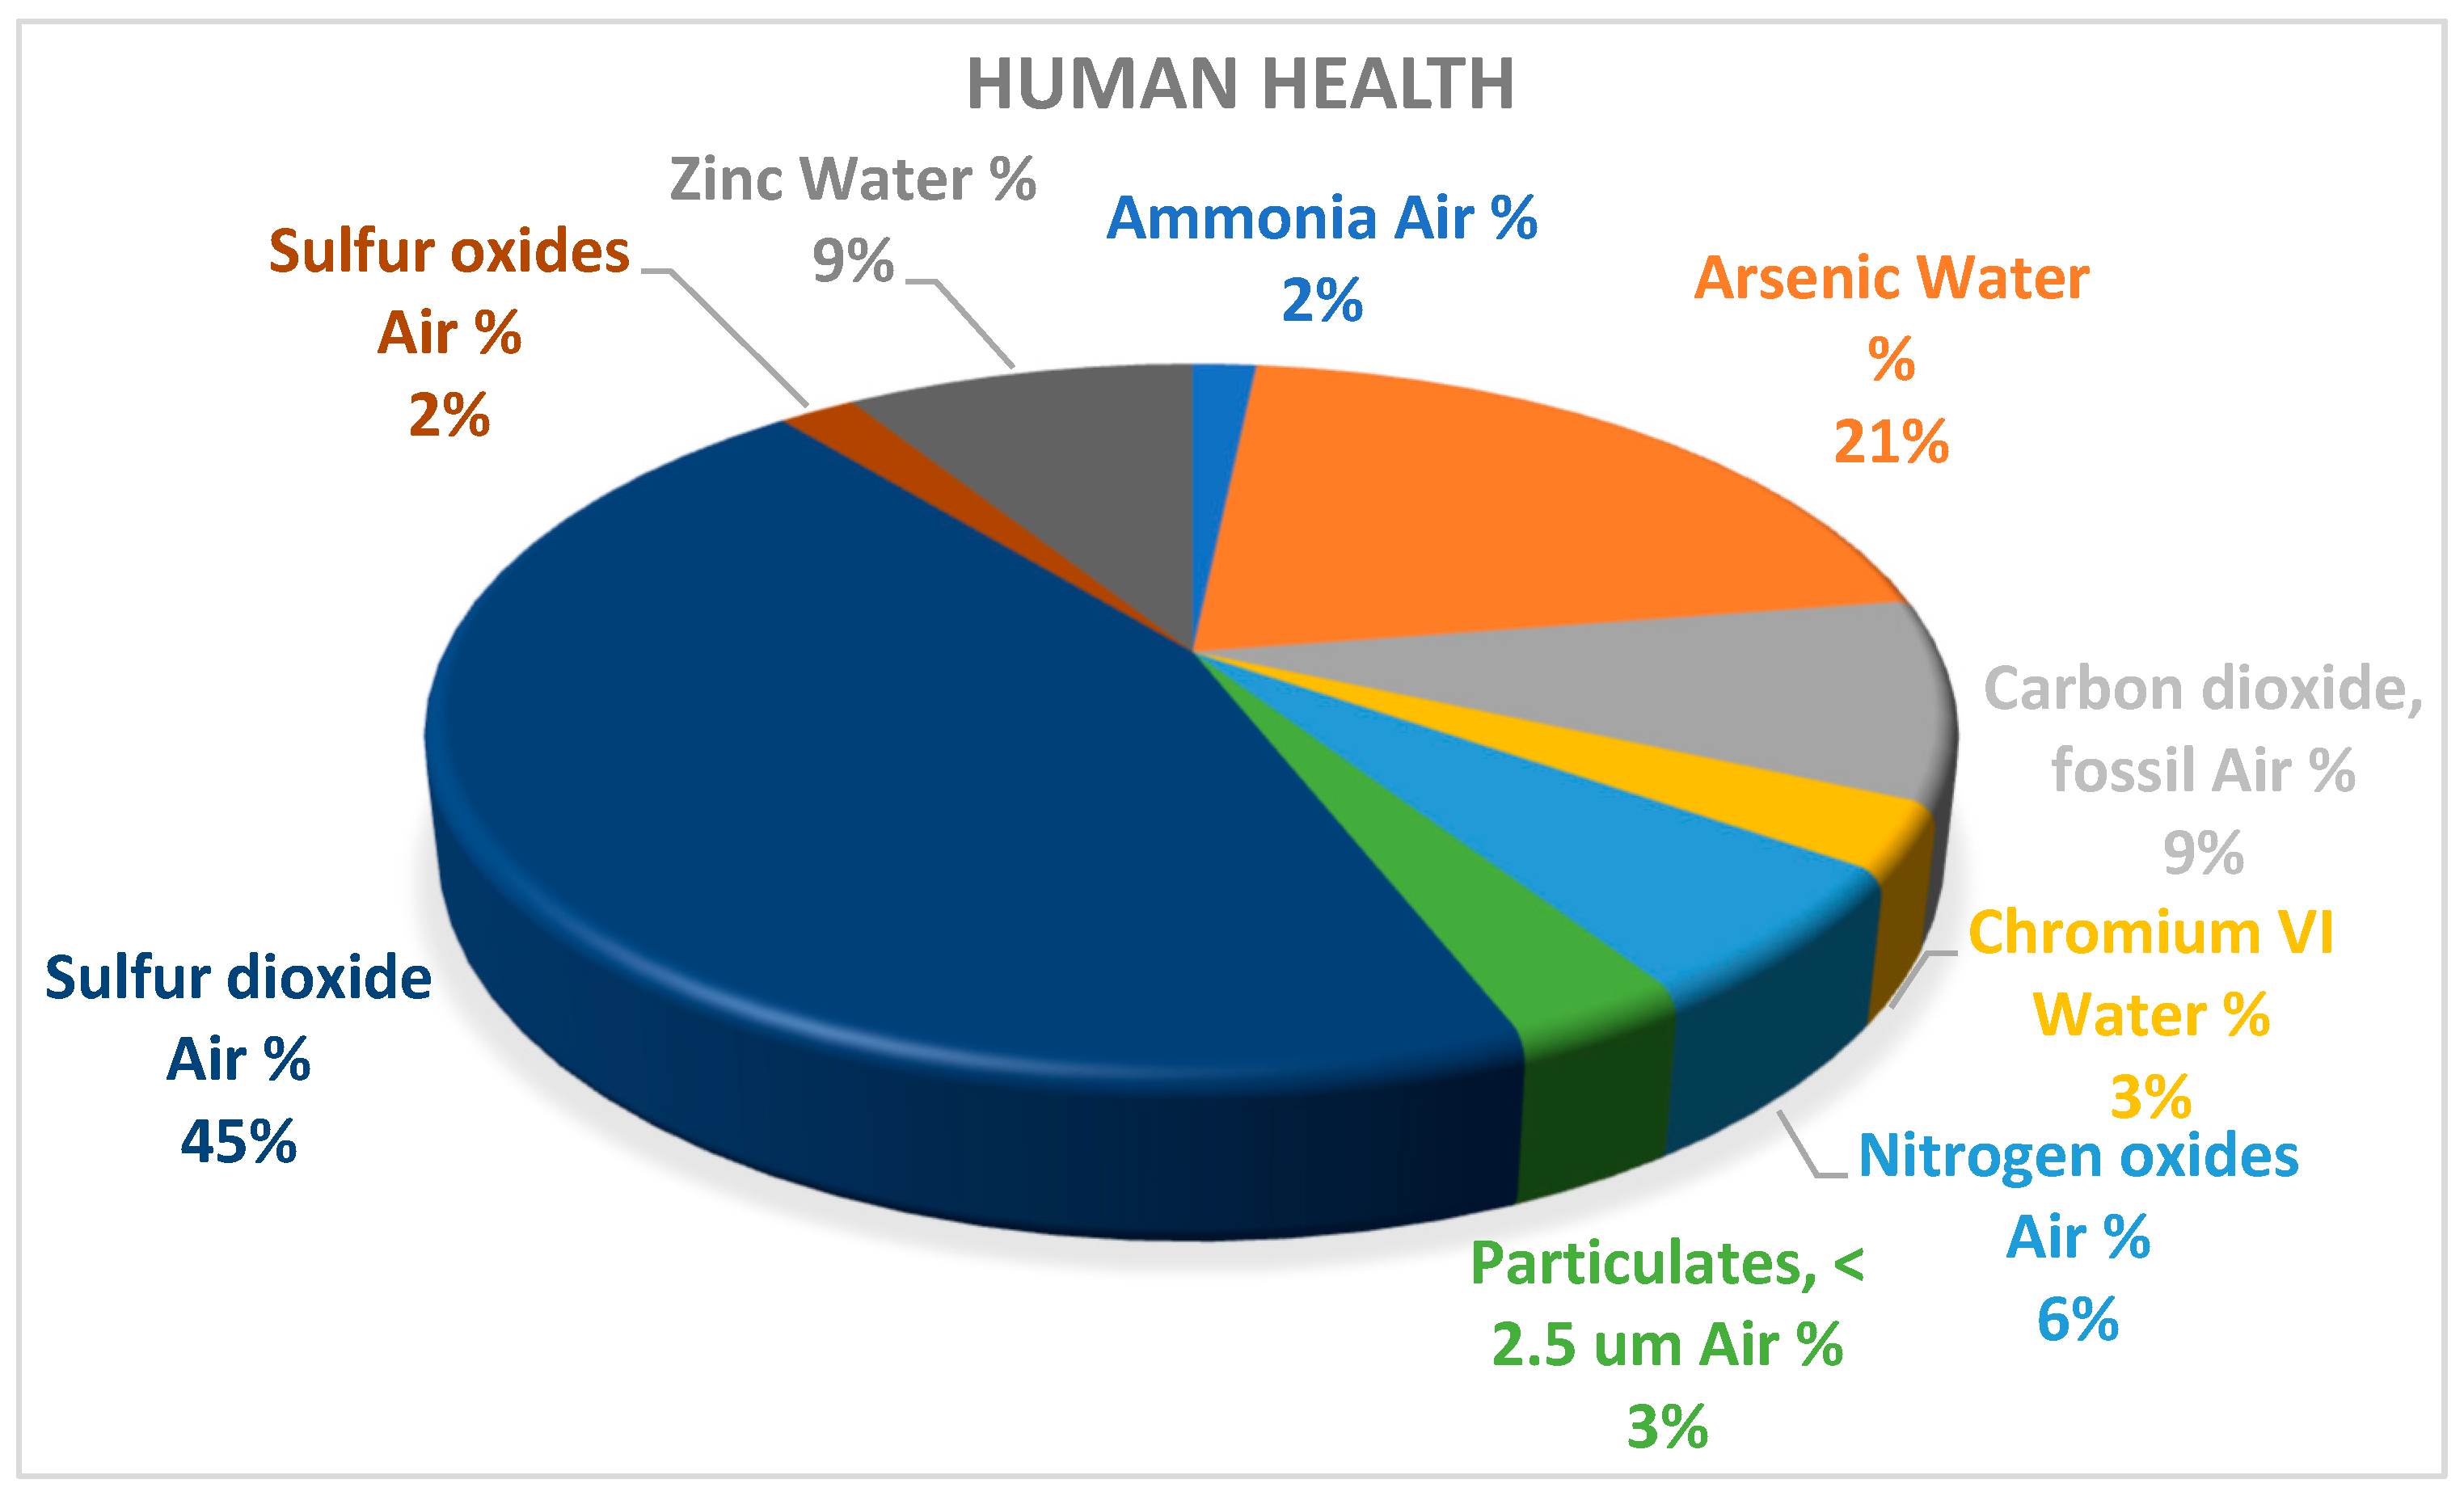
Figure 9 represents further analysis carried out on the human health damage category of substances that cause these damages and the mediums in which they were expressed. The results showed that 45% of Sulphur dioxide, 2% of Sulphur oxides, 2% of ammonia, 6% of Nitrogen oxides, less than 2.5 μm of particulate matter, and, 9% of Carbon dioxide were emitted into the air, while 21% of arsenic, 7% of zinc, and 3% of chromium IV were emitted into water bodies. The consequence of all these emissions, as explained earlier in the mid-point assessment, is damage to human health.
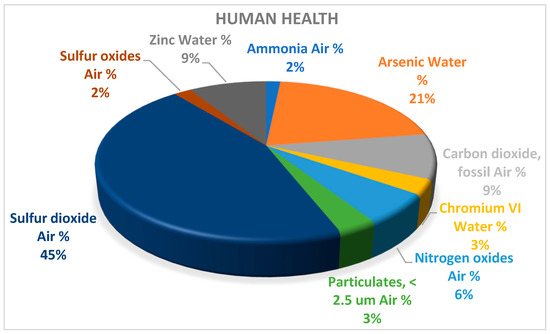
Figure 9.
Contribution to damage, category—human health.
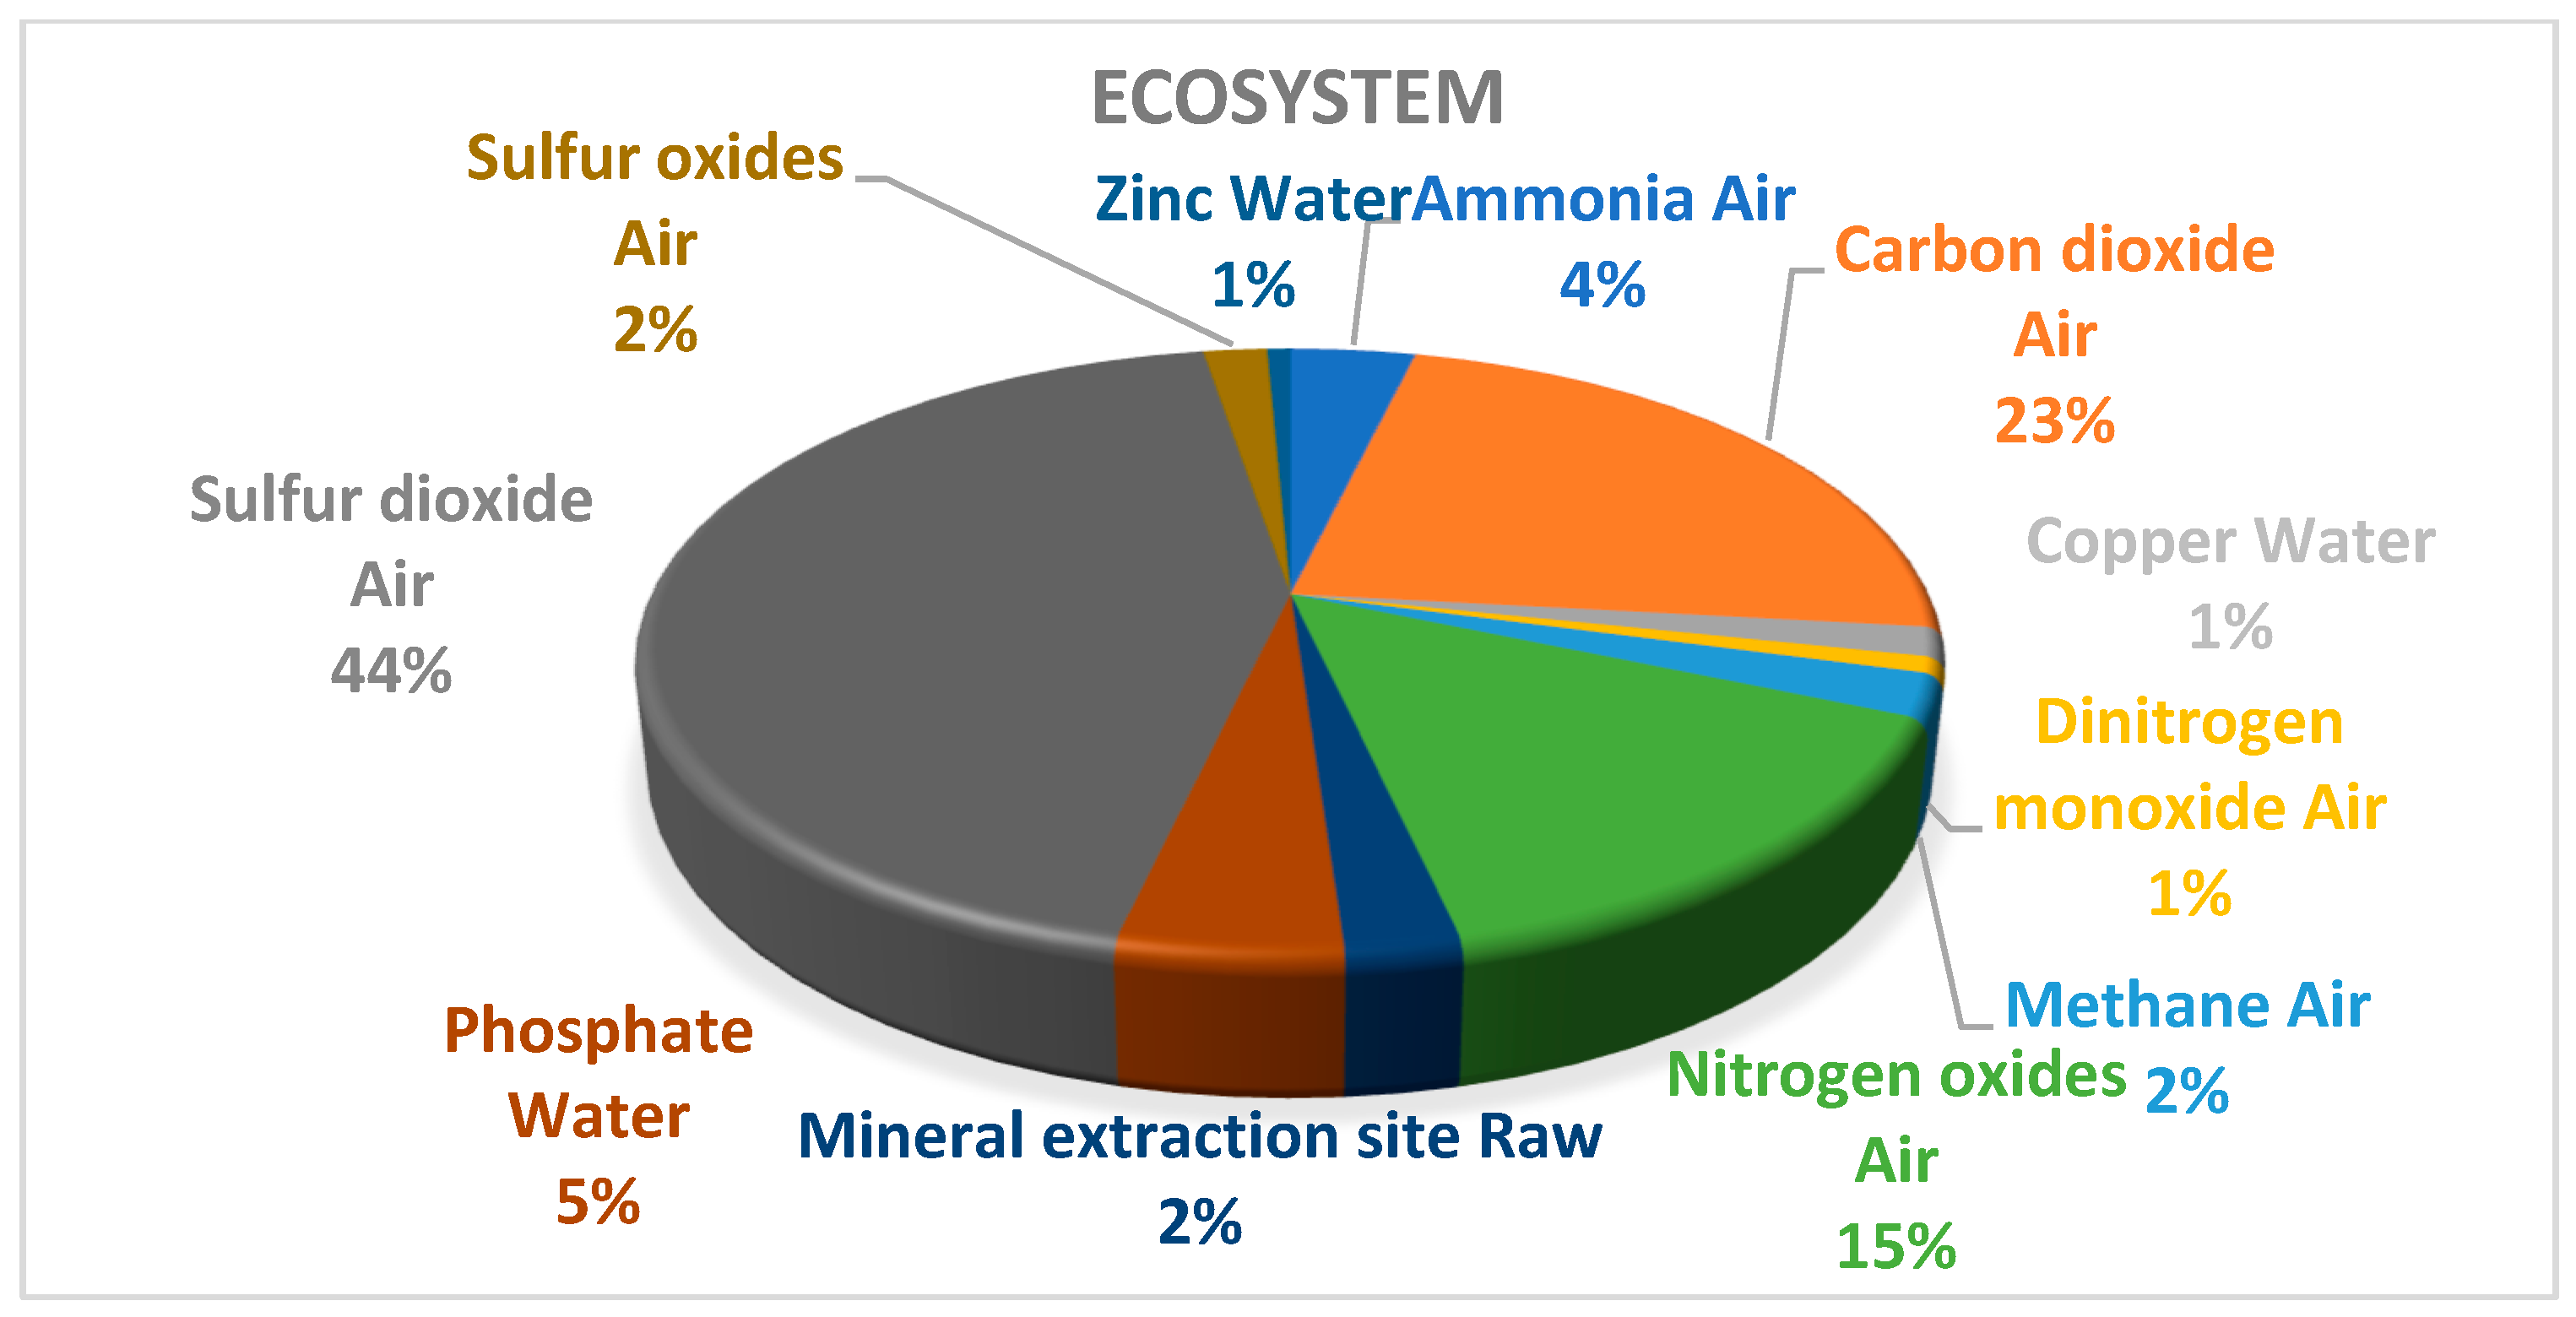
Figure 10 depicts a more detailed analysis conducted on the damage to ecosystems, focusing on the substances responsible for this damage and the channels through which it is manifested. The findings indicated that 44% of Sulphur dioxide, 2% of Sulphur oxides, 15% of Nitrogen oxides, 1% dinitrogen monoxide, 23% of CO2, 4% of ammonia, and 1% of methane were emitted into the air, while 5% of phosphate, 1% of zinc, and 1% or copper were discharged into water bodies, and 2% of minerals extracted from the soil also contributed to the impact on ecosystems. The emissions, discussed previously in the midpoint analysis, have a detrimental impact on the ecosystem.

Figure 10.
Contribution to damage, category— ecosystems.
Figure 11 depicts an additional study conducted on the category of resource degradation. The analysis revealed that 37% of the resources in question were from crude oil, 22% were from natural gas, 18% were from hard coal, 14% from vanadium, 2% from nickel, and 1% from both Rhodium and copper.
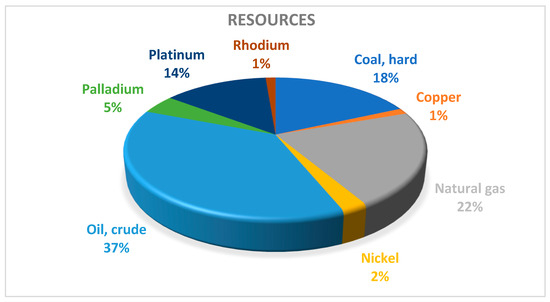
Figure 11.
Contribution to damage, category—resources.
4.10. Normalization Results
The normalization results from the mid-point assessment are presented in Table 6. The major impact categories were observed to be freshwater ecotoxicity, marine toxicity, and human carcinogenic toxicity. Table 7 represents the normalization results from the damage assessment showing that human health experiences the most significant damage during the production of a 1 kW FC stack.
Table 6.
Normalization results of a 1 kW FC stack for mid-point characterization analysis.
Table 7.
Normalization results of 1 kW FC stack for damage assessment.
4.11. Uncertainty Analysis
Uncertainty analysis is a systematic procedure that quantifies the uncertainty introduced in the results of a life cycle inventory analysis caused by model imprecision, input uncertainty, and data variability. The Monte Carlo simulation, which is very prevalent, is a stochastic model that has been incorporated into commercial LCA software (version 9.2). The uncertainty analysis was conducted using 1000 iterations and a 95% confidence interval on the SimaPro software. The results are available in the Supplementary Materials, where Tables S2–S4 represent the uncertainty analysis of the mid-point analysis, end-point analysis, and damage assessment. Considering the coefficient of variation (CV) in both approaches, the degree of uncertainty is high for water consumption, human non-carcinogenic toxicity, human carcinogenic toxicity, ionizing radiation, and freshwater eutrophication. On the other hand, freshwater ecotoxicity, marine eutrophication, marine ecotoxicity, land use, and terrestrial ecotoxicity have a relatively high degree of uncertainty. The impacts in all other categories in the approaches were comparatively minimal; additionally, the damage categories have a low degree of uncertainty.
5. Conclusions, Recommendations, and Future Studies
5.1. Conclusions
The current study used mid-point and end-point methods to perform a cradle-to-gate life cycle assessment for a 1 kW PEMFC. This analysis considers the environmental impacts of extracting raw materials, energy consumption, and transportation. The mid-point analysis shows that the raw material extraction and processing contributed the most to the environmental impact categories, including freshwater eutrophication, human carcinogenic toxicity, and terrestrial acidification. The relative contributions to fossil resource depletion and global warming are primarily due to the energy consumed in FC production. At the same time, the environmental impact of transportation is low relative to the other two processes. Contribution analysis from the end-point results shows that the most contributive category is human health damage, followed by ecosystem and resource damage. The dominant contributions within all damage categories are attributed to the raw material extraction and processing. Normalization further stresses the dominating impacts on human health and, therefore, the need to address toxicity-related problems.
5.2. Recommendations
Based on the findings of this research, several recommendations are put forward that can assist in reducing the overall environmental impact of PEMFC production. Optimization of the raw material extraction and its processing phase will be possible through finding alternative materials with a lesser environmental footprint, optimization of cleaner production technologies, and promoting the use of recycled materials. The second would be to enhance the whole manufacturing process regarding energy efficiency; such initiatives should be achieved by adopting energy-saving technologies, using renewable sources, and developing an energy management system. The third area would be to develop and execute a strict measure in managing emissions, especially toxic substances, to cause fewer effects on human health and the ecosystem. The fourth area would need local suppliers and local material promotion to reduce the impact on the environment that results from transportation. Finally, cooperation in such activities between researchers, manufacturers, policymakers, and end-users should be stimulated to encourage these sustainable practices and advancements in PEMFC technology.
5.3. Future Studies
This study further opens the way for other research in several aspects: First, a more comprehensive LCA—which would consider the use and end-of-life phases of PEMFC to provide a holistic understanding of the environmental impacts of PEMFC throughout the life cycle. Also, further research can study the potential recycling and reusing of PEMFC components for minimum waste generation and virgin material demand. Understanding the environmental impacts of different designs and configurations of PEMFCs will help develop the best options for sustainability. The economic and social implications of PEMFC production and deployment should also be considered to gain a more robust insight into the subject. This would be possible by developing more accurate and reliable models and databases for LCA studies that are of PEMFC technology specifically, which would reduce the inherent uncertainties found in most previous studies. Finally, the potential synergies between PEMFC and other renewable energy technologies, such as solar and wind power, would lead to an optimum environmental performance of these technologies and facilitate the transition towards a low-carbon economy.
Supplementary Materials
The following supporting information can be downloaded at: https://www.mdpi.com/article/10.3390/hydrogen5020020/s1, Table S1: Ecoinvent 3.7.1 dataset documentation f fuel cell production, stack polymer electrolyte membrane, 1kW; Table S2: Uncertainty results for mid-point analysis of 1kW fuel cell stack; Table S3: Uncertainty results for end-point analysis of 1kW fuel cell stack; Table S4: Uncertainty results for Damage assessment of 1kW fuel cell stack.
Author Contributions
Conceptualization, O.M.B. and B.D.A.; methodology, O.M.B.; software, B.D.A.; validation, O.M.B., B.D.A., M.U.E. and O.A.O.; formal analysis, B.D.A.; investigation, O.M.B.; resources, B.D.A.; data curation, O.A.O.; writing—original draft preparation, O.M.B., B.D.A., M.U.E. and O.A.O.; writing—review and editing, O.A.O.; supervision, O.A.O. All authors have read and agreed to the published version of the manuscript.
Funding
This research received no external funding.
Data Availability Statement
The data used in this study are available in the Supplementary Materials.
Conflicts of Interest
The authors declare no conflicts of interest.
References
- Subramanian, A.; Nagarajan, A.M.; Vinod, S.; Chakraborty, S.; Sivagami, K.; Theodore, T.; Sathyanarayanan, S.S.; Tamizhdurai, P.; Mangesh, V.L. Long-term impacts of climate change on coastal and transitional eco-systems in India: An overview of its current status, future projections, solutions, and policies. RSC Adv. 2023, 13, 12204–12228. [Google Scholar] [CrossRef] [PubMed]
- Arshad, K.; Hussain, N.; Ashraf, M.H.; Saleem, M.Z. Air pollution and climate change as grand challenges to sustainability. Sci. Total. Environ. 2024, 928, 172370. [Google Scholar] [CrossRef] [PubMed]
- John, A.A.; Damilola, E.B.; Olubayo, M.B. A multicriteria framework for selecting information communication technology alternatives for climate change adaptation. Cogent Eng. 2022, 9, 2119537. [Google Scholar] [CrossRef]
- Ozturk, M.; Dincer, I. Comparative environmental impact assessment of various fuels and solar heat for a combined cycle. Int. J. Hydrogen Energy 2019, 44, 5043–5053. [Google Scholar] [CrossRef]
- Yoro, K.O.; Daramola, M.O. CO2 Emission Sources, Greenhouse Gases, and the Global Warming Effect. Adv. Carbon Capture 2020, 3–28. [Google Scholar] [CrossRef]
- Sejian, V.; Hyder, I.; Ezeji, T.; Lakritz, J.; Bhatta, R.; Ravindra, J.P.; Prasad, C.S.; Lal, R. Global Warming: Role of Livestock. In Change Impact on Livestock: Adaptation and Mitigation; Springer: Berlin/Heidelberg, Germany, 2015; pp. 141–169. [Google Scholar] [CrossRef]
- World Health Organization (WHO). Climate Change. Available online: https://www.who.int/news-room/fact-sheets/detail/climate-change-and-health (accessed on 23 March 2024).
- Colombo, S.J.; Chen, J.; Ter-Mikaelian, M.T.; McKechnie, J.; Elkie, P.C.; MacLean, H.L.; Heath, L.S. Forest protection and forest harvest as strategies for ecological sustainability and climate change mitigation. For. Ecol. Manag. 2012, 281, 140–151. [Google Scholar] [CrossRef]
- Gallego-Schmid, A.; Chen, H.-M.; Sharmina, M.; Mendoza, J.M.F. Links between circular economy and climate change mitigation in the built environment. J. Clean. Prod. 2020, 260, 121115. [Google Scholar] [CrossRef]
- Din, A.U.; Rahman, I.U.; Vega-Muñoz, A.; Elahi, E.; Salazar-Sepúlveda, G.; Contreras-Barraza, N.; Alhrahsheh, R.R. How Sustainable Transportation Can Utilize Climate Change Technologies to Mitigate Climate Change. Sustainability 2023, 15, 9710. [Google Scholar] [CrossRef]
- Niles, M. Sustainable Soils: Reducing, Mitigating, and Adapting to Climate Change with Organic Agriculture. Sustain. Dev. Law Policy 2008, 9, 19. Available online: https://heinonline.org/HOL/Page?handle=hein.journals/sdlp9&id=20&div=&collection= (accessed on 22 April 2024). [CrossRef]
- Babatunde, D.E.; Babatunde, O.M.; Akinbulire, T.O.; Oluseyi, P.O. Hybrid Energy Systems Model with the Inclusion of Energy Efficiency Measures: A Rural Application Perspective. Int. J. Energy Econ. Policy 2018, 8, 310–323. [Google Scholar]
- Babatunde, M.; Munda, J.L.; Hamam, Y. Decarbonisation of Electricity Generation: Efforts and Challenges. In Carbon Footprints; Springer: Berlin/Heidelberg, Germany, 2019; pp. 47–77. [Google Scholar]
- Babatunde, O.M.; Munda, J.L.; Hamam, Y. A Comprehensive state-of-the-art survey on hybrid renewable energy system operations and planning. IEEE Access 2020, 8, 75313–75346. [Google Scholar] [CrossRef]
- Şahin, M.E. A photovoltaic powered electrolysis converter system with maximum power point tracking control. Int. J. Hydrogen Energy 2020, 45, 9293–9304. [Google Scholar] [CrossRef]
- International Renewable Energy Agency (IRENA). Renewables Competitiveness Accelerates, Despite Cost Inflation. Available online: https://www.irena.org/News/pressreleases/2023/Aug/Renewables-Competitiveness-Accelerates-Despite-Cost-Inflation (accessed on 10 April 2024).
- Haegel, N.M.; Kurtz, S.R. Global Progress Toward Renewable Electricity: Tracking the Role of Solar (Version 3). IEEE J. Photovolt. 2023, 13, 768–776. [Google Scholar] [CrossRef]
- Babatunde, O.M.; Munda, J.L.; Hamam, Y. A comprehensive state-of-the-art survey on power generation expansion planning with intermittent renewable energy source and energy storage. Int. J. Energy Res. 2019, 43, 6078–6107. [Google Scholar] [CrossRef]
- Akinyele, D.O.; Rayudu, R.K. Review of energy storage technologies for sustainable power networks. Sustain. Energy Technol. Assess. 2014, 8, 74–91. [Google Scholar] [CrossRef]
- Adebisi, J.A.; Denwigwe, I.H.; Babatunde, O.M. Hydrogen storage for micro-grid application: A framework for ranking fuel cell technologies based on technical parameters. Int. J. Electr. Comput. Eng. (IJECE) 2023, 13, 1221–1230. [Google Scholar] [CrossRef]
- Daniel, A.; Elijah, O.; Abraham, A. Review of Fuel Cell Technologies and Applications for Sustainable Microgrid Systems. Inventions 2020, 5, 42. [Google Scholar] [CrossRef]
- Babatunde, O.; Munda, J.; Hamam, Y. Off-grid hybrid photovoltaic—Micro wind turbine renewable energy system with hydrogen and battery storage: Effects of sun tracking technologies. Energy Convers. Manag. 2022, 255, 115335. [Google Scholar] [CrossRef]
- Omid, M.A.; Şahin, M.E.; Cora, N. Challenges and Future Perspectives on Production, Storage Technologies, and Transportation of Hydrogen: A Review. Energy Technol. 2024, 12, 102–122. [Google Scholar] [CrossRef]
- Pedicini, R.; Romagnoli, M.; Santangelo, P.E. A Critical Review of Polymer Electrolyte Membrane Fuel Cell Systems for Automotive Applications: Components, Materials, and Comparative Assessment. Energies 2023, 16, 3111. [Google Scholar] [CrossRef]
- Pehnt, M. Life-cycle assessment of fuel cell stacks. Int. J. Hydrogen Energy 2001, 26, 91–101. [Google Scholar] [CrossRef]
- Evangelisti, S.; Tagliaferri, C.; Brett, D.J.; Lettieri, P. Life cycle assessment of a polymer electrolyte membrane fuel cell system for passenger vehicles. J. Clean. Prod. 2017, 142, 4339–4355. [Google Scholar] [CrossRef]
- Staffell, I.; Ingram, A.; Kendall, K. Energy and carbon payback times for solid oxide fuel cell based domestic CHP. Int. J. Hydrogen Energy 2012, 37, 2509–2523. [Google Scholar] [CrossRef]
- Gulotta, T.M.; Salomone, R.; Lanuzza, F.; Saija, G.; Mondello, G.; Ioppolo, G. Life Cycle Assessment and Life Cycle Costing of unitized regenerative fuel cell: A systematic review. Environ. Impact Assess. Rev. 2022, 92, 106698. [Google Scholar] [CrossRef]
- Dhanushkodi, S.R. Life Cycle Analysis of Fuel Cell Technology. J. Environ. Inform. 2008, 11, 36–44. [Google Scholar] [CrossRef]
- Usai, L.; Hung, C.R.; Vásquez, F.; Windsheimer, M.; Burheim, O.S.; Strømman, A.H. Life cycle assessment of fuel cell systems for light duty vehicles, current state-of-the-art and future impacts. J. Clean. Prod. 2021, 280, 125086. [Google Scholar] [CrossRef]
- Baratto, F.; Diwekar, U.M. Life cycle assessment of fuel cell-based APUs. J. Power Sources 2005, 139, 188–196. [Google Scholar] [CrossRef]
- Yang, Z.; Wang, B.; Jiao, K. Life cycle assessment of fuel cell, electric and internal combustion engine vehicles under different fuel scenarios and driving mileages in China. Energy 2020, 198, 117365. [Google Scholar] [CrossRef]
- Granovskii, M.; Dincer, I.; Rosen, M.; A Rosen, M. Life cycle assessment of hydrogen fuel cell and gasoline vehicles. Int. J. Hydrogen Energy 2006, 31, 337–352. [Google Scholar] [CrossRef]
- Evtimov, I.; Ivanov, R.; Stanchev, H.; Kadikyanov, G.; Staneva, G. Life cycle assessment of fuel cells electric vehicles. Transp. Probl. 2020, 15, 153–166. [Google Scholar] [CrossRef]
- Ally, J.; Pryor, T. Life-cycle assessment of diesel, natural gas and hydrogen fuel cell bus transportation systems. J. Power Sources 2007, 170, 401–411. [Google Scholar] [CrossRef]
- Hwang, J.-J.; Kuo, J.-K.; Wu, W.; Chang, W.-R.; Lin, C.-H.; Wang, S.-E. Lifecycle performance assessment of fuel cell/battery electric vehicles. Int. J. Hydrogen Energy 2013, 38, 3433–3446. [Google Scholar] [CrossRef]
- Bareiß, K.; de la Rua, C.; Möckl, M.; Hamacher, T. Life cycle assessment of hydrogen from proton exchange membrane water electrolysis in future energy systems. Appl. Energy 2019, 237, 862–872. [Google Scholar] [CrossRef]
- Guo, Q.; Sethuraman, V.A.; White, R.E.; Jiangyi, M.; Yi, X.; Zhenxi, M. Life cycle assessment of a PEMFC-based distributed energy system for hotel application. IOP Conf. Ser. Earth Environ. Sci. 2023, 1152, 012006. [Google Scholar] [CrossRef]
- Krishnan, S.; Corona, B.; Kramer, G.J.; Junginger, M.; Koning, V. Prospective LCA of alkaline and PEM electrolyser systems. Int. J. Hydrogen Energy 2024, 55, 26–41. [Google Scholar] [CrossRef]
- Slotyuk, L.; Part, F.; Schlegel, M.-C.; Akkerman, F. Life Cycle Assessment of the Domestic Micro Heat and Power Generation Proton Exchange Membrane Fuel Cell in Comparison with the Gas Condensing Boiler Plus Electricity from the Grid. Sustainability 2024, 16, 2348. [Google Scholar] [CrossRef]
- Xu, A.; Yang, L.; Liu, Z.; Xiong, Y.; Xiao, X.; Deng, C.; Yang, S. Sustainability evaluation of a PEMFC system for coalbed methane recovery based on life cycle assessment and emergy analysis. J. Clean. Prod. 2024, 434, 140344. [Google Scholar] [CrossRef]
- Staffell, I.; Scamman, D.; Velazquez Abad, A.; Balcombe, P.; Dodds, P.E.; Ekins, P.; Shah, N.; Ward, K.R. The role of hydrogen and fuel cells in the global energy system. Energy Environ. Sci. 2019, 12, 463–491. [Google Scholar] [CrossRef]
- Elmer, T.; Worall, M.; Wu, S.; Riffat, S.B. Fuel cell technology for domestic built environment applications: State of-the-art review. Renew. Sustain. Energy Rev. 2015, 42, 913–931. [Google Scholar] [CrossRef]
- Akintayo, B.D.; Babatunde, O.M.; Olanrewaju, O.A. Comparative Analysis of Cement Production Methods Using a Life Cycle Assessment and a Multicriteria Decision-Making Approach. Sustainability 2024, 16, 484. [Google Scholar] [CrossRef]
- Agyekum, E.B.; Ampah, J.D.; Wilberforce, T.; Afrane, S.; Nutakor, C. Research Progress, Trends, and Current State of Development on PEMFC-New Insights from a Bibliometric Analysis and Characteristics of Two Decades of Research Output. Membranes 2022, 12, 1103. [Google Scholar] [CrossRef] [PubMed]
- Bawab, A.; Giurgea, S.; Depernet, D.; Hissel, D. An Innovative PEMFC Magnetic Field Emulator to Validate the Ability of a Magnetic Field Analyzer to Detect 3D Faults. Hydrogen 2023, 4, 22–41. [Google Scholar] [CrossRef]
- Li, C.; Liu, Y.; Xu, B.; Ma, Z. Finite Time Thermodynamic Optimization of an Irreversible Proton Exchange Membrane Fuel Cell for Vehicle Use. Processes 2019, 7, 419. [Google Scholar] [CrossRef]
- Danilczuk, M.; Coms, F.D.; Schlick, S. Visualizing Chemical Reactions and Crossover Processes in a Fuel Cell Inserted in the ESR Resonator: Detection by Spin Trapping of Oxygen Radicals, Nafion-Derived Fragments, and Hydrogen and Deuterium Atoms. J. Phys. Chem. B 2009, 113, 8031–8042. [Google Scholar] [CrossRef] [PubMed]
- Li, Y.; Liu, Y.; Shi, G.; Liu, C.; Hao, Q.; Wu, L. Occurrence and Risk Assessment of Perfluorooctanoate (PFOA) and Perfluorooctane Sulfonate (PFOS) in Surface Water, Groundwater and Sediments of the Jin River Basin, Southeastern China. Bull. Environ. Contam. Toxicol. 2022, 108, 1026–1032. [Google Scholar] [CrossRef] [PubMed]
- Abdelkareem, M.A.; Elsaid, K.; Wilberforce, T.; Kamil, M.; Sayed, E.T.; Olabi, A. Environmental aspects of fuel cells: A review. Sci. Total. Environ. 2021, 752, 141803. [Google Scholar] [CrossRef] [PubMed]
- International Platinum Group Metals Association. The Life Cycle Assessment of Platinum Group Metals (PGMs); International Platinum Group Metals Association: München, Germany, 2013. [Google Scholar]
- Duclos, L.; Lupsea, M.; Mandil, G.; Svecova, L.; Thivel, P.-X.; Laforest, V. Environmental assessment of proton exchange membrane fuel cell platinum catalyst recycling. J. Clean. Prod. 2017, 142, 2618–2628. [Google Scholar] [CrossRef]
- Janssen, N.A.; Gerlofs-Nijland, M.E.; Lanki, T.; Salonen, R.O.; Cassee, F.; Hoek, G.; Fischer, P.; Brunekreef, B.; Krzyzanowski, M. Health Effects of Black Carbon. 2012. World Health Organization. Regional Office for Europe. Available online: https://iris.who.int/handle/10665/352615 (accessed on 24 May 2024).
- Ahad, T.; Bhuiyan, M.H.; Sakib, A.N.; Corral, A.B.; Siddique, Z. An Overview of Challenges for the Future of Hydrogen. Materials 2023, 16, 6680. [Google Scholar] [CrossRef]
- Huijbregts, M.A.J.; Steinmann, Z.J.N.; Elshout, P.M.F.; Stam, G.; Verones, F.; Vieira, M.; Zijp, M.; Hollander, A.; van Zelm, R. ReCiPe2016: A harmonised life cycle impact assessment method at midpoint and endpoint level. Int. J. Life Cycle Assess. 2017, 22, 138–147. [Google Scholar] [CrossRef]
- Zhang, X.; Liu, X.; Zhang, Y.; Xu, X.; Xiao, J.; Luh, D.-B. Assessing the Feasibility of Practical Cradle to Cradle in Sustainable Conceptual Product Design. Sustainability 2023, 15, 6755. [Google Scholar] [CrossRef]
- Bhatt, A.; Bradford, A.; Abbassi, B.E. Cradle-to-grave life cycle assessment (LCA) of low-impact-development (LID) technologies in southern Ontario. J. Environ. Manag. 2019, 231, 98–109. [Google Scholar] [CrossRef] [PubMed]
- Russell-Smith, S.V.; Lepech, M.D. Cradle-to-gate sustainable target value design: Integrating life cycle assessment and construction management for buildings. J. Clean. Prod. 2015, 100, 107–115. [Google Scholar] [CrossRef]
- Finkbeiner, M.; Inaba, A.; Tan, R.; Christiansen, K.; Klüppel, H.-J. The New International Standards for Life Cycle Assessment: ISO 14040 and ISO 14044. Int. J. Life Cycle Assess. 2006, 11, 80–85. [Google Scholar] [CrossRef]
- Marinković, S.; Dragaš, J.; Ignjatović, I.; Tošić, N. Environmental assessment of green concretes for structural use. J. Clean. Prod. 2017, 154, 633–649. [Google Scholar] [CrossRef]
- Young, S.B.; Turnbull, S.; Russell, A. Toward a Sustainable Cement Industry Substudy 6: What LCA Can Tell Us about the Cement Industry. 2011. Available online: https://www.researchgate.net/publication/242516732 (accessed on 23 May 2024).


Disclaimer/Publisher’s Note: The statements, opinions and data contained in all publications are solely those of the individual author(s) and contributor(s) and not of MDPI and/or the editor(s). MDPI and/or the editor(s) disclaim responsibility for any injury to people or property resulting from any ideas, methods, instructions or products referred to in the content. |
© 2024 by the authors. Licensee MDPI, Basel, Switzerland. This article is an open access article distributed under the terms and conditions of the Creative Commons Attribution (CC BY) license (https://creativecommons.org/licenses/by/4.0/).