Article

Is Food Outlet Accessibility a Significant Factor of Fruit and Vegetable Intake? Evidence from a Cross-Sectional Province-Wide Study in Quebec, Canada

by
Alex-Ane Mathieu
1,
Éric Robitaille
2,3 and
Marie-Claude Paquette
2,4,*
1
Faculté de Médecine, Université de Montréal, Montréal, QC H3C 3J7, Canada
2
Institut National de Santé Publique du Québec, Montréal, QC H2P 1E2, Canada
3
École de Santé Publique, Département de Médecine Sociale et Préventive, Centre de Recherche en Santé Publique, Université de Montréal, Montréal, QC H3N 1X9, Canada
4
Département de Nutrition, Université de Montréal, Montréal, QC H3T 1A8, Canada
*
Author to whom correspondence should be addressed.
Obesities 2022, 2(1), 35-50; https://doi.org/10.3390/obesities2010004
Submission received: 19 May 2021 / Revised: 4 January 2022 / Accepted: 17 January 2022 / Published: 25 January 2022

Abstract

:
Unhealthy eating habits can compromise one’s health and generate significant individual, social, and health services costs. The adoption of healthy eating habits depends on individual and environmental determinants related to the characteristics of the physical, economic, political, and socio-cultural environments. The objective of this cross-sectional study was to assess the effect of the physical environment, more precisely the effect of food outlet accessibility, on diet. A subsample of the CARTaGENE survey, composed of 7783 adults aged 40 to 70 years old residing in four cities in Quebec (Canada), was used. Measures of proximity as well as absolute and relative measures of the density of retail food outlets, fast-food outlets, and convenience stores near participants’ residences were used to analyze fruit and vegetable (F&V) intake. Univariate logistic regression showed that the minimal recommended portions of F&V intake (5 or more portions) were significantly associated with all seven measures of the retail food environment (OR between 0.76 and 1.27). However, these relations were mostly non-significant when confounding variables were considered in the analysis except and counterintuitively for proximity to the nearest convenience store and density of convenience stores. Variables most significantly correlated to F&V intake were individual-level confounding variables of sex, income, and education. These results show that more research is needed to understand factors explaining F&V intake in this population.

1. Introduction

Obesity is a widespread phenomenon worldwide and in Canada [1]. A quarter (26.8%) of all Canadians are considered obese [2]. It is estimated that the direct and indirect costs associated with obesity are more than $4.5 billion in Canada [3]. Reducing energy intake and improving diet quality in the population are required to prevent obesity and chronic diseases. A healthy diet is comprised of vegetables, fruits, grain products, fish, dairy products, and low-fat meats and minimizes the intake of foods high in sugar, salt, and saturated fat [4].
An adequate intake of fruits and vegetables (F&V) can prevent nutritional deficiencies as well as several chronic diseases such as cardiovascular disease, diabetes, and certain cancers [5]. The WHO recommends a minimum consumption of 400 g of F&V per day for adults, or about 5 servings of 80 g [6]. It is estimated that inadequate F&V consumption is responsible for the death of 1.7 million people worldwide and the loss of 16 million DALYs (Disability-adjusted life years) each year [7]. In the province of Quebec, Canada, less than half of the population (46.3%) meets the WHO recommendation for F&V intake [8].
Many individual and environmental factors can influence the ability to obtain and consume healthy foods. At the individual level, socio-demographic characteristics such as income and education, as well as cooking skills, food beliefs, and perceptions of the food environment, can influence diet quality [9,10]. As for population-level factors, the food environment is considered a significant determinant of diet [4,11,12,13]. It includes the number, type, location, and accessibility of food outlets (referred to as the community food environment) as well as the variety, availability, freshness, and price of food [9,10]. Moreover, the Chief Public Health Officer of Canada recommends developing and strengthening the food environment to facilitate the adoption and maintenance of healthy eating [4].
The effect of geographic accessibility of food shops on diet has been well studied [11,13,14,15,16,17,18,19,20,21,22]. Indeed, it is a topic of great importance as neighborhoods offer unequal access to different types of food-selling shops such as supermarkets or grocery stores. According to the most recent provincial report, 45.5% of Quebec’s population live in an area with poor access to food shops [13]. Understanding the influence of accessibility to food and food shops on eating habits is crucial to propose strategies to improve the quality of the population’s diet and reduce social and health inequalities.
An overall assessment of the literature indicates that there is generally a moderate positive relationship between the accessibility to food shops and health measures such as diet quality or healthy weight [11,12,13]. However, not all researchers agree, as some consider the evidence for this relationship to be insufficient [16,18].
A major limit to the current body of research is the great variety of environmental accessibility indicators used in studies [14,17]. Indeed, indicators can be separated into three types. Proximity is measured in the distance to the nearest food shop. Absolute density is usually measured as the count of total food shops within a certain area around the individual’s residence (sometimes standardized by population or area size). Lastly, relative density compares the density of two different types of food shops. For example, one can compare the density of “unhealthy” food shops, which have a higher availability of unhealthy foods, to “healthy” or to total food shop density. This wide diversity of indicators makes comparing the results of different studies difficult.
However, some research has shown that relative density measures may be more strongly associated with health than other accessibility indicators [23,24,25,26,27]. Furthermore, indicators that consider accessibility to “unhealthy” food shops, typically fast-food restaurants and convenience stores, may be more strongly associated with health [11,17]. This association may be even more significant in the Canadian context [15]. Because most studies on the relationship between the community food environment and health were carried out in the United States, only a limited number of Canadian studies have been identified [14,15,17]. However, some data points to the fact that contextual differences between the two countries may exist [28,29,30]. Indeed, areas of low access to “healthy” food shops have been found to be less common in low socioeconomic status neighborhoods in Canada, where high accessibility to “unhealthy” food shops seems to be more prominent [29]. As such, the association between indicators of accessibility to “unhealthy” food shops and health may be even more significant in the Canadian context.
The objective of this study was to evaluate the link between the geographic accessibility of food shops and the consumption of F&V in Quebec adults.

2. Materials and Methods

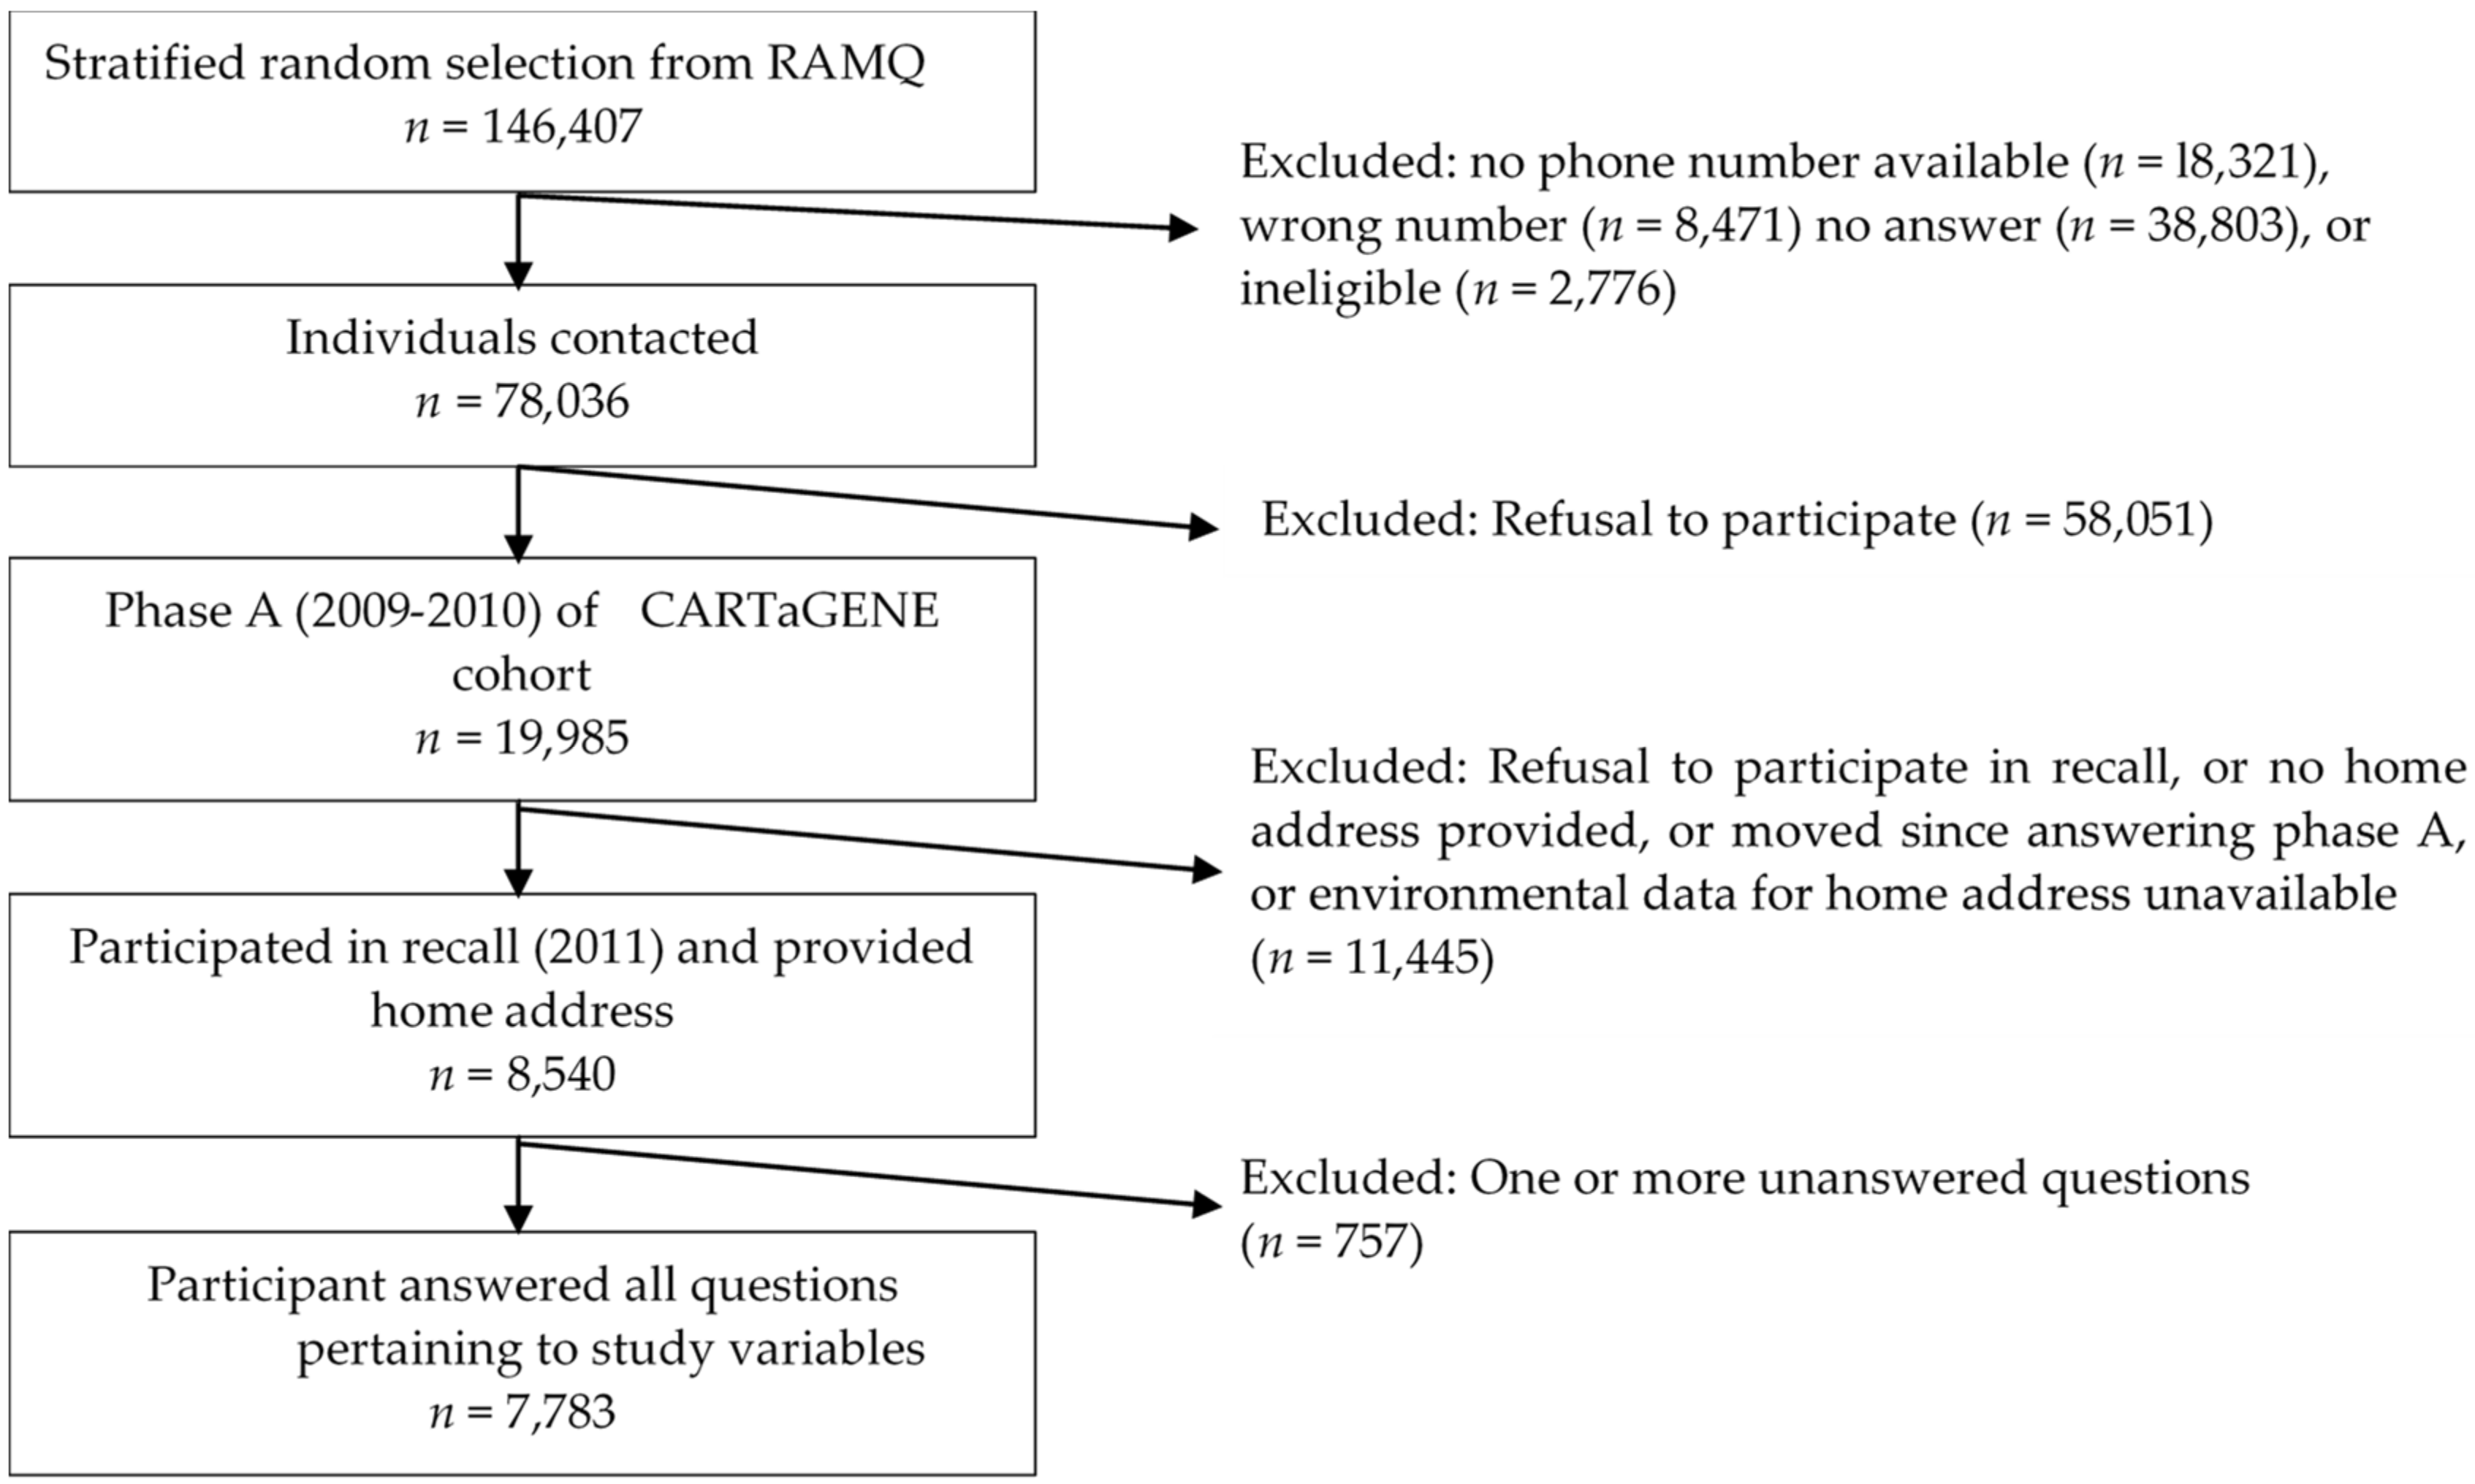
2.1. Research Design

A cross-sectional quantitative study was carried out at the individual level. Cross-sectional data from the CARTaGENE cohort study was used. The sampling method has been previously described [31] and is summarized below. CARTaGENE is an ongoing cohort of participants aged 40 to 69 years old residing in urban centers of Quebec, Canada. Participants were selected through stratified random sampling based on population density, sex, age, and forward sortation area of residence (3-digit postal code). Selection was made from registries of the province’s free health insurance (Régie de l’assurance maladie du Québec (RAMQ)). Participants lived in the metropolitan areas of Montreal, Quebec City, Sherbrooke, and Saguenay, with populations of 4,098,927, 800,296, 111,176, and 160,980, respectively [32]. Participants were excluded if they lived in First Nation reserves, long-term health care facilities, or were in prison. The CARTaGENE sample has been previously shown to be similar to the Quebec population, except for the level of education, which was generally higher amongst CARTaGENE participants [31]. Data pertaining to this study were collected between 2009 and 2011. Participants were contacted by telephone and invited to take part in the study. Financial compensation of 45$ CAD was offered in 2009. Participation involved answering a self-administered sociodemographic and lifestyle questionnaire at one of the assessment sites. Participants were also contacted in 2011 to fill an online survey that included their full home postal code. For this study, individual-level data from CARTaGENE was matched with food environment data generated from a governmental food retailer registry.

2.2. Dependant Variable: Food Consumption Measure

Fruit and vegetable intake was measured by two questions in the CARTaGENE survey in 2009 or 2010. They inquired about the average number of portions of vegetables eaten per day and the average number of fruit portions eaten per day, excluding fruit or vegetable juice intake. Information concerning portion size was also given in the question, where a portion was defined as ½ cup or 125 mL. The F&V intake was calculated as the summation of both answers of each participant. Any participant who failed to answer one or both questions was excluded from the analysis. This measure was analyzed as a categorical variable; participants were separated by whether they met the WHO minimal fruit and vegetable intake recommendation of 5 portions per day. Participants who ate 5 or more portions per day were coded as “1”, while those who ate less than 5 portions were coded as “0”.

2.3. Independent Variables: Retail Food Access Measure

The independent variables were a group of seven indicators quantifying different aspects of the geographic access to food retail stores near the participant’s home.
In Quebec, the law requires that every food retail store obtain a food selling permit from the Ministère de l’agriculture, des pêcheries et de l’alimentation du Québec (MAPAQ) (Ministry of Agriculture, Fisheries and Food of Quebec). We obtained information pertaining to the type and location of retail food stores from the MAPAQ registry. Data from 2009 were used as it corresponded roughly to the period when participants’ food intake was surveyed.
This study used three types of food outlets in the MAPAQ database: (1) Retail food outlets, which included supermarkets, grocery stores, fruit and vegetable shops, and farmers’ markets, (2) Fast food outlets, and (3) Convenience stores. Food outlet extraction from the MAPAQ database has been described previously [33] but is summarized here. Each of the four types of retail food outlets is represented by a different MAPAQ food permit type which was searched in the database. Fast food restaurants are defined as “establishments where light meals, whether or not consumed on-site, are prepared and served”, “whose main activity is the preparation and sale of food to be taken away or delivered” or “with counter service and occasionally at the table, whose main activity is characterized by the preparation of specialized menus: hamburgers, chickens, hotdogs, etc. (…)” [34]. A search for these 3 types of fast food outlet permits was conducted and yielded 4826 results. Convenience stores can be found under many different permit categories, so an automated search for keywords was complemented by a manual search and yielded 4330 results. Examples of keywords include “depanneur”, “accommodation”, and some convenience store chain company names (e.g., “Couche-Tard™”, “Boni-Soir™”, etc.).
The seven food environment indicators used included measures of proximity, absolute density, and relative density of food shops near the participant’s residence. These measures were chosen as per the recommendation of the Association of Public Health Epidemiologists in Ontario’s (APHEO) Core Indicators Development Group. Their Built Environment Subgroup is a multidisciplinary expert group that defined indicators for accurately and reproducibly measuring the retail food environment in a standardized manner throughout Canada [35]. The proximity and absolute density measures were calculated for each of the three categories of food stores (retail food outlets, fast food outlets, and convenience stores) using Geographical Information Systems (GIS). The measure of proximity represents the population-weighted average network distance between the center of each dissemination block (DB) and the nearest food store of a given category for every DB within the dissemination area (DA) where the participant lives. A DA is an area defined for the Canadian census with a population between 400 and 700. It is composed of one or more DB [36]. These measures can be used even without participants’ exact addresses, which were unavailable due to confidentiality considerations. The formula used for calculating the proximity was the following:
Proximity   to   food   outlet =   All   DBs   in   DA   DB   population ×   distance   in   meters   from   the   DB   centroid   to   nearest   food   outlet   of   a   given   category Total   population   of   DA
The measure of absolute density represents the population-weighted average number of food outlets of a given category within 1000 m of the DB centroids in a participant’s DA. It was calculated as follows:
The   density   of   food   outlets   =   All   DBs   in   a   DA   DB   population ×   #   of   food   outlets   of   a   given   category   within   1000   m   of   the   DB   centroid Total   population   of   DA
where the 1000 m were measured as a road network distance rather than a straight line or Euclidean distance.
Lastly, the measure of relative density is known as the Modified Retail Food Environment Index (mRFEI) [37] and is a proportion of the number of unhealthy food stores to the number of both healthy and unhealthy food stores within 1000 m of the DB centroids of the participant’s DA of residence. It serves as a measure of the variety of different types of outlets in the area. It was calculated as follows:
m R F E I =   A l l   D B s   i n   a   D A   #   l e s s   h e a l t h y   f o o d   r e t a i l e r s   w i t h i n   1000   m   o f   D B   c e n t r o i d   #   o f   h e a l t h y + #   o f   l e s s   h e a l t h y   f o o d   r e t a i l e r s   w i t h i n   1000   m   o f   D B   c e n t r o i d   × 100 ,
where convenience stores and fast food outlets were considered unhealthy and retail food outlets were considered healthy. A distance of 1000 m was used for all indicators, as per APHEO recommendations. This distance, which roughly represents a 15-min walk, was deemed appropriate for our mostly urban households.
Participants’ self-reported address of residence in 2011 was used to calculate the environmental indicators. Each environment measure was analyzed as a categorical variable where categories correspond to quintiles of all 19,985 participants’ values. This was done to resemble quintiles that would have been created for all Quebec residents, as was the case for population density and deprivation index.

2.4. Confounding Variables: Individual and Environmental Measures

Two population-level confounding variables were also included. The population density of the DA of residence and the INSPQ material deprivation index of the DA were both separated into quintiles, where the values for all DAs in Quebec are used to separate the quintiles (categorical variables). The material deprivation index is based on standardized indicators of income, education, and employment and is described elsewhere [38]. Population data for these variables were obtained from the 2011 National Household Survey.
The confounding variables pertaining to participants’ individual data were obtained from the CARTaGENE questionnaire. Self-reported sex (categorical variable), age (categorical variable: quintiles), the highest level of education obtained (categorical), annual household income (categorical), employment status (categorical), and marital status (categorical) were used. Due to the large number of categories initially used, some were combined to simplify the analysis, but only when it was logical to do so. For example, participants that worked were separated from non-workers (unemployed, unable to work, retired, or caregiver) as it was thought that going to work may limit their exposure to the food environment surrounding their residence. Similarly, those who were married or living with a partner were analyzed separately from those who were thought generally less likely to have food consumption patterns affected by the presence of a significant other in the household (divorced, separated, widowed or single) [39,40].

2.5. Analysis

SPSS version 25 (IBM Corp., Armonk, NY, USA) was used for data analysis [41]. Participants with missing data were excluded from the study (n = 757). Study population characteristics were described and compared with those of excluded participants. Their F&V intake was described, as well as whether they met the recommended F&V intake.
Logistic regression was used for univariate analysis. Separate models were built for each of the study’s seven independent variables of interest, consisting only of that variable and the outcome (intake equal or higher to recommended F&V consumption)
Lastly, multiple logistic regression was carried out in a sequential manner. Only variables that were found to be significant in univariate analyses were included in the regression. A first model was created with individual-level characteristics only (model A). A second model included individual-level and general environment variables (model B). Then, models which included all variables from model B were created for each food environment variable (Table 3).

3. Results

CARTaGENE participants (n = 146,407) were initially selected from the RAMQ (Figure 1). Approximately one out of seven individuals selected (14%) and one out of four individuals contacted (26%) agreed to take part in the study [31]. As such, there were 19,985 respondents in the first phase CARTaGENE survey. All participants were contacted a second time in 2011, and 8540 participants provided their full address of residence. Amongst those, 7783 participants provided all the information needed for our analyses.

3.1. Descriptive Analyses

Table 1 shows the characteristics of all respondents of Phase A. Only participants with complete data (n = 7783) were included in further analyses. These participants were compared to phase A participants who had incomplete data as a way of evaluating attrition bias. The sample of participants with complete data was 51.7% female and 54.7 years of age on average. More than two-thirds (67.5%) were married or living with a partner, and 67.1% were working. Less than half (46.1%) had obtained a university certificate or university degree. Only 8.7% had an annual household income below 25,000$.
Amongst participants without any missing data (7783 participants), the median fruit and vegetable intake was 5 portions per day. The distribution had a mean of 5.05 with a standard deviation of 2.61, skewness of 1.10, and kurtosis of 3.61. The proportion of participants who ate 5 or more portions of fruit and vegetable per day was 53.9%.
The different food environment variables measured were analyzed as quintiles to simplify analysis and because they were not normally distributed. The range of each quintile is presented in Table 2.

3.2. Univariate Analyses

Whether participants consumed the minimal amount of F&V was analyzed while considering their characteristics and their environment. Participants who ate 5 or more portions of F&V were 2.88 times more likely to be female and were also more likely to have a higher annual household income or higher educational level than participants who did not eat the minimal number of portions (Table 2). These participants were also less likely to live in highly deprived neighborhoods.
Participants who consumed the minimal recommended amount of F&V were more likely to live in areas of high accessibility to all three types of food outlets, meaning they were more likely to live near outlets and in areas of high outlet density. For example, participants who consumed the minimal recommended amount of F&V were more likely to live in the highest quintile of the density of retail food outlets (OR = 1.22 (95% CI: 1.05–1.40) for Q5 compared to Q1), of convenience stores (OR = 1.27 (95% CI: 1.11–1.47) for Q5 compared to Q1), and of fast food outlets (OR = 1.24 (95% CI: 1.07–1.43) for Q5 compared to Q1). They were also more likely to live further from all three types of outlets, even from retail food outlets (OR = 0.85 (95% CI: 0.74–0.98) for Q4 compared to Q1).
In analyzing the relation between the relative density of less healthy outlets and F&V consumption, data showed that participants living in areas with a higher relative density of “unhealthy” outlets were less likely to eat 5 or more portions of F&V.

3.3. Multivariate Analysis

A sequential multiple logistic regression was carried out (Table 2) using only the variables that showed significant differences in univariate analyses. Model A included the least number of confounding variables and explained 11.7% of the variance. Nonetheless, it was found that when controlling for multiple variables, as per model B, participants who ate the minimal recommended amount of F&V were 3.13 (95% CI: 2.85–3.44) times more likely to be women, 1.57 (95% CI: 1.25–1.96) times more likely to earn a household income above 150,000$ when compared to less than 25,000$ and 2.16 (95% CI: 1.82–2.57) times more likely to have undertaken graduate studies when compared to high school graduates.
Each food environment variable was analyzed in a separate model due to the collinearity between the variables (Table 3). Food environment variables that were significantly different in univariate analyses were found to be non-significant when controlling for confounding variables. However, the density and the proximity of convenience stores were still significant. The odds of eating 5 or more portions of F&V were 1.35 (95% CI: 1.12–1.62) for those who lived in areas with a high density of convenience stores (Q5 compared to Q1). The odds of eating 5 or more portions of F&V were 0.76 (95% CI: 0,63–0,91) for those who lived the farthest from a convenience store (Q5 compared to Q1). These results are contrary to the expected relations and will be further explored in the discussion.

4. Discussion

We analyzed the individual characteristics of our sample of 7783 participants in the CARTaGENE database, as well as their fruit and vegetable consumption habits. We then compared this consumption with the geographical accessibility of different types of food stores around their homes. We found that participants who had better accessibility to all types of food stores, healthy and unhealthy, were more likely to consume the recommended minimum number of F&V. This relationship was indeed expected for accessibility to “healthy” food shops, but not for access to “unhealthy” shops such as fast-food restaurants and convenience stores. However, it is possible that this is a land-use mix and density effect where locations with greater accessibility to “unhealthy” shops also simultaneously have greater access to “healthy” shops due to a greater presence of commercial establishments of all types. Furthermore, other studies have found similar results where a higher density of fast food or higher land use mix are related to lower rates of obesity [42,43].
However, when confounding variables were added to the analysis, the observed relationship between indicators of accessibility of food stores and F&V intake disappeared for the most part except and counterintuitively for proximity to the nearest convenience store, density of convenience stores. This indicates that the observed relationship was likely due to other characteristics, including the individual characteristics of participants. Non-significant associations are fairly common in research on geographic accessibility to food commerce [15,22]; a previous review found null associations in 76% of cases [17].
According to our data, gender was the most important determinant of F&V intake. In general, individual-level characteristics were also more strongly related to F&V consumption than characteristics of the food environment. The relationship between dietary habits and individual characteristics was in the expected direction; women and individuals with higher income and educational attainment were more likely to comply with F&V minimal consumption recommendations, as commonly found in the literature [8,44,45].
With respect to the multivariable logistic regression, even with environmental variables considered, a maximum of 12.4% or one-eighth (1/8) of the variance in F&V consumption was explained. Part of the unexplained variance could be due to interactions between some of the variables in our study, such as the food environment and income variables. Indeed, a study of 50,000 participants in London, UK, found an additive interaction of the effects of low income and high exposure to fast food restaurants on diet and obesity [46]. However, this type of interaction has not yet been extensively studied in the literature and was not included in our study.
Some of the results from the food environment variables analysis are counterintuitive. The data showing that living in an area of high density of convenience stores is associated with higher odds of eating 5 or more F&V could be explained by the fact that a higher density of convenience stores is associated with a higher density of food stores in general, thus increasing exposure to fruits and vegetables. Another possibility is that some of these convenience stores were misclassified and actually offer healthy foods such as fruits and vegetables. Another counterintuitive result is that distance to a convenience store is associated with lower odds of eating 5 or more portions of F&V. This could be explained by the fact that participants were, in effect, all relatively close to convenience stores. When looking at the quintiles of proximity to convenience stores, even the farthest stores are relatively close to participants’ residences; 1065 m to 6786 m.
Another reason possibly accounting for the low explained percentage of the total variance could be that some important variables which affect F&V intake are not considered in our study. Referring to a conceptual framework of the food environment published by Glanz et al. [9,10], we note that such variables could include aspects of the consumer food environment or individual characteristics. Consumer environment variables that could help explain individuals’ F&V consumption patterns include a variety of choices, freshness, promotion, placement, and price of food inside the stores [9,10,20]. In addition, unstudied individual characteristics could also explain some of the remaining variances. These could include race or ethnicity [14,47], genetic factors [48,49], knowledge and skills in relation to food (17, 18), the individual’s perception of his or her accessibility to different foods (55), or social support (75), to name a few.

Limits and Strengths

This study had certain limitations relating to the type of study design, participants, and food and environmental measurements. Some of the limitations arose from the choice of the dataset, which was subject to time, availability, and resource constraints. First, the observational cross-sectional design does not allow for causal inference, and there is a risk of reverse causality [50]. However, this is a widespread limitation as the majority of studies in this field are cross-sectional [17,22].
The sample of CARTaGENE participants used in this study was older and slightly more educated than the average Quebec population [31]. Coupled with the additional attrition of the sample following recall to obtain home addresses, it is likely that a level of selection bias occurred. However, we quantified the exact magnitude of differences between our sample and the CARTaGENE sample. We found that retained participants were more likely to have higher levels of education and higher incomes, as is observed in many studies [51,52]. We also found that our sample was slightly more likely to consume 5 or more portions of fruit and vegetable per day than the general population of Quebec (53.9% of individuals in our sample consumed 5 or more portions of F&V compared to 46.3% in Quebec [8]).
Another feature of the sample in this study was its age composition. The study was designed to recruit only adults between 40 and 69 years. We did not find in our study that F&V use varied with age, but it is possible that there may be differences among younger adults or even children [19]. Indeed, one review showed that associations between exposure to fast-food restaurants or convenience stores and weight were more likely to be in the expected direction in children of low socioeconomic status than in adults [17]. Thus, caution should be exercised in inferring results to the general population
Another limitation of our study was the quality of the dietary measurement used. Questions about the usual frequency of consumption, as used in this study, are susceptible to recall bias. They are also prone to error due to the complex cognitive process involved in calculating portion sizes and average daily intake [53]. In addition, only F&V consumption was questioned. A measure of junk food consumption or a more comprehensive measure of diet quality might have yielded different results, especially when compared to environmental measures of accessibility to stores with predominantly “unhealthy” foods. Measures reflecting dietary quality allow for a more comprehensive description of an individual’s eating habits. They could more easily capture the association with certain characteristics of the food environment, such as convenience stores or fast-food restaurants, than F&V measures alone [53]. The restricted measure of F&V consumption was an important limitation of our study. Initially, we had hoped to use a food quality measure, the Canadian Healthy Eating Index (C-HEI). Unfortunately, upon closer inspection, many outlying data had been included, for example, sodium intake in the order of 13,000 mg per day or intakes of sugar of over 700 g per day. Additionally, the treatment for a large number of missing data was not clear. We thus opted not to use the C-HEI. The F&V measure used instead could not represent participants’ diets with as many nuances as a more comprehensive questionnaire and could have contributed to the predominantly non-significant results. Additionally, since the F&V consumption measure did not follow a normal distribution, we opted to analyze it as a binary variable. This could have contributed to the lack of significant relationships between food consumption and most food environment measures in our data.
Another limitation came from studying the food environment only at the place of residence. Indeed, for an individual who works or spends a significant amount of time outside his or her home, the impact of exposure to the environment in these activity spaces is not considered. Therefore, it may be more difficult to identify the real impact of the environment on diet [54,55]. Considering the average time spent at home as a confounding variable could limit the impact of only studying the residential food environment [56]. We used the employment situation as a proxy for the time spent at home. Although this variable has limitations (i.e., it may not be representative of the time spent at home in all situations, such as among people who volunteer), it is an element that is not often considered by most studies on food outlet accessibility [22].
Lastly, the characterization of food businesses as “healthy” or “unhealthy”, though a common practice, is simplistic, and several studies show that the consumer’s food environment is much more complex than the presence of “healthy” or “unhealthy” foods [20,57]. A study of the nutritional environment of consumers in 17 supermarkets in Montreal found considerable disparities, including in price and variety of fruits and vegetables as well as in the marketing of highly processed foods [58]. It is well known that the consumer’s environment influences food purchasing and eating habits [20,57]. Incorporating measures of the consumer environment to more accurately represent accessibility to foods, rather than to stores, would allow for a more precise analysis of the link between food environment and diet.
Despite these limitations, many of which were inherent to the type of data commonly and pragmatically available, our study makes a significant contribution to the existing literature. One of its strengths was its large sample size of 7783 participants, which was significantly larger than the median 3786 participants for similar studies, according to a systematic review of 113 studies [17]. This study is one of the first studies to evaluate the relation between the community food environment and eating habits on a large scale in Quebec. Indeed, studying this relation locally is important, as evidence suggests that it could vary between countries [15,28,29,30].
The use of standardized environmental indicators without threshold values, as proposed by APHEO, has allowed for a more precise and objective analysis of the environment while facilitating inter-study comparisons [35]. This will facilitate future reviews of the literature, as many reviews have noted the difficulty in synthesizing knowledge due to the large methodological variation surrounding the operationalization of food environment measures [14,17].
Another strength of our study was the use of seven different indicators to characterize the food environment in a more comprehensive way. Three types of food outlets and three types of geographical accessibility measures were studied and compared. In addition, most of the covariates commonly used in the literature were considered [22]. Thus, this study, though subject to some of the common limitations in this field of research, presents a complete picture of the possible associations between accessibility to food outlets and F&V consumption in an adult population.

5. Conclusions

Obesity and unhealthy eating habits represent a heavy burden in Canada and worldwide. The effect of accessibility to food outlets on diet was evaluated in this cross-sectional study of 7783 Quebec adults aged 40 to 70 years. We found that the relationship between accessibility to food outlets and diet was weaker than expected. Individual factors of gender, education, and income were strongly associated with diet but a large portion of the factors affecting diet remained unexplained by our data. Further research is needed to identify such factors, which may include other variables or interactions between studied variables. These results reinforce the importance of implementing multidimensional interventions to improve the population’s diet in all cases. Indeed, rather than focusing on a single element such as geographic accessibility to food outlets, programs and initiatives aimed at improving diet and reducing obesity should propose an approach at different levels. These should involve changes not only to the physical environment but also the political, socio-cultural, and economic environment aimed at supporting healthy food choices.

Author Contributions

Conceptualization, A.-A.M., M.-C.P. and É.R.; methodology, A.-A.M. and É.R.; validation, A.-A.M., M.-C.P. and É.R.; formal analysis, A.-A.M.; writing—original draft preparation, A.-A.M.; writing—review and editing, A.-A.M., M.-C.P. and É.R. All authors have read and agreed to the published version of the manuscript.

Funding

This work was supported by the Ministère de la Santé et des Services sociaux du Québec and the Institut national de santé publique du Québec.

Institutional Review Board Statement

Ethics approval for this project was obtained from Université de Montréal (ethic # CERSES-19-063-D) and from the ethic review committee of CARTaGENE (ethic # 549966).

Informed Consent Statement

Informed consent was obtained from all subjects involved in the study.

Data Availability Statement

Restrictions apply to the availability of these data. Data was obtained from CARTaGENE, CHU Ste-Justine and data requests should be directed to them (https://www.cartagene.qc.ca, accessed on 4 January 2022).

Acknowledgments

The authors would like to acknowledge Marianne Dubé from INSPQ for CARTaGENE data collection and analyses and Nathalie Vandal from INSPQ for statistical support.

Conflicts of Interest

The author certifies that no conflict of interest exists regarding this manuscript, and there is no connection, financial or otherwise, that might imply or introduce bias in any aspect of my work in the review of the manuscript. This manuscript has not been considered for publication elsewhere. No similar works have been submitted elsewhere.

References

  1. World Health Organization. Obesity: Preventing and Managing the Global Epidemic: Report of a WHO Consultation; WHO: Geneva, Switzerland, 2000. [Google Scholar]
  2. Statistics Canada. Health Fact Sheets; Overweight and Obese Adults, 2018. 2019. Available online: https://www150.statcan.gc.ca/n1/en/pub/82-625-x/2019001/article/00005-eng.pdf?st=jwpIv0wd (accessed on 15 November 2020).
  3. Government of Canada. Obesity in Canada—Health and Economic Implications 2011. Available online: https://www.canada.ca/en/public-health/services/health-promotion/healthy-living/obesity-canada/health-economic-implications.html (accessed on 15 November 2020).
  4. Public Health Agency of Canada. The Chief Public Health Officer’s Report on the State of Public Health in Canada 2017—Designing Healthy Living; Public Health Agency of Canada: Ottawa, ON, Canada, 2017.
  5. World Health Organization. Diet, Nutrition and the Prevention of Chronic Diseases; Report of a Joint WHO/FAO Expert Consultation; WHO: Geneva, Switzerland, 2003. [Google Scholar]
  6. Food and Agriculture Organization of the United NATIONS. What is a Serving? 2003. Available online: http://www.fao.org/english/newsroom/focus/2003/fruitveg2.htm (accessed on 15 November 2020).
  7. World Health Organization. Global Strategy on Diet, Physical Activity and Health; Promoting Fruit and Vegetable Consumption around the World (Information Sheet). Available online: https://www.who.int/dietphysicalactivity/fruit/en/index2.html (accessed on 15 November 2020).
  8. Statistics Canada. Table 13-10-0451-01, Health Indicators, Annual Estimates, 2003–2014. 2014. Available online: https://www150.statcan.gc.ca/t1/tbl1/en/tv.action?pid=1310045101&pickMembers%5B0%5D=1.37&pickMembers%5B1%5D=2.1&pickMembers%5B2%5D=3.1&cubeTimeFrame.startYear=2010&cubeTimeFrame.endYear=2014&referencePeriods=20100101%2C20140101&request_locale=en (accessed on 15 November 2020).
  9. Glanz, K.; Sallis, J.F.; Saelens, B.E.; Frank, L.D. Healthy nutrition environments: Concepts and measures. Am. J. Health Promot. 2005, 19, 330–333. [Google Scholar] [CrossRef]
  10. Glanz, K. Measuring food environments: A historical perspective. Am. J. Prev. Med. 2009, 36, S93–S98. [Google Scholar] [CrossRef]
  11. Gamba, R.J.; Schuchter, J.; Rutt, C.; Seto, E.Y.W. Measuring the food environment and its effects on obesity in the United States: A Systematic review of methods and results. J. Community Health 2015, 40, 464–475. [Google Scholar] [CrossRef]
  12. Fox, A.M.; Horowitz, C.R. Best practices in policy approaches to obesity prevention. J. Health Care Poor Underserv. 2013, 24, 168–192. [Google Scholar] [CrossRef]
  13. Robitaille, É.; Bergeron, P. Accessibilité Géographique aux Commerces Alimentaires au Québec: Analyse de Situation et Perspectives D’interventions; Institut National de Santé Publique du Québec: Québec, QC, Canada, 2013. [Google Scholar]
  14. Rahmanian Elham, E.; Gasevic, D.; Vukmirovich, I.; Lear, S.A. The association between the built environment and dietary intake—A systematic review. Asia Pac. J. Clin. Nutr. 2014, 23, 183–196. [Google Scholar]
  15. Minaker, L.M.; Shuh, A.; Olstad, D.L.; Engler-Stringer, R.; Black, J.L.; Mah, C.L. Retail food environments research in Canada: A scoping review. Can. J. Public Health 2016, 107, ES4–ES13. [Google Scholar] [CrossRef]
  16. Abeykoon Am Hasanthi, A.H.; Engler-Stringer, R.; Muhajarine, N. Health-related outcomes of new grocery store interventions: A systematic review. Public Health Nutr. 2017, 20, 2236–2248. [Google Scholar]
  17. Wilkins, E.; Radley, D.; Morris, M.; Hobbs, M.; Christensen, A.; Marwa, W.L.; Morrin, A.; Griffiths, C. A systematic review employing the GeoFERN framework to examine methods, reporting quality and associations between the retail food environment and obesity. Health Place 2019, 57, 186–199. [Google Scholar]
  18. Cobb, L.K.; Appel, L.J.; Franco, M.; Jones-Smith, J.C.; Nur, A.; Anderson, C.A. The relationship of the local food environment with obesity: A systematic review of methods, study quality, and results. Obesity 2015, 23, 1331–1344, Erratum in Obesity 2015, 23, 2517–2519. [Google Scholar] [CrossRef]
  19. Engler-Stringer, R.; Le, H.; Gerrard, A.; Muhajarine, N. The community and consumer food environment and children’s diet: A systematic review. BMC Public Health 2014, 14, 522. [Google Scholar] [CrossRef] [Green Version]
  20. Mah, C.L.; Luongo, G.; Hasdell, R.; Taylor, N.G.A.; Lo, B.K. A systematic review of the effect of retail food environment interventions on diet and health with a focus on the enabling role of public policies. Curr. Nutr. Rep. 2019, 8, 411–428. [Google Scholar] [CrossRef] [Green Version]
  21. Woodruff, R.C.; Raskind, I.G.; Harris, D.M.; Gazmararian, J.A.; Kramer, M.; Haardörfer, R.; Kegler, M.C. The dietary impact of introducing new retailers of fruits and vegetables into a community: Results from a systematic review. Public Health Nutr. 2017, 21, 981–991. [Google Scholar] [CrossRef] [Green Version]
  22. Stevenson, A.C.; Brazeau, A.S.; Dasgupta, K.; Ross, N.A. Neighbourhood retail food outlet access, diet and body mass index in Canada: A systematic review. Health Promot. Chronic Dis. Prev. Can. Res Policy Pract. 2019, 39, 261–280. [Google Scholar] [CrossRef] [Green Version]
  23. Clary, C.M.; Ramos, Y.; Shareck, M.; Kestens, Y. Should we use absolute or relative measures when assessing foodscape exposure in relation to fruit and vegetable intake? Evidence from a wide-scale Canadian study. Prev. Med. 2015, 71, 83–87. [Google Scholar] [CrossRef]
  24. Luan, H.; Law, J.; Quick, M. Identifying food deserts and swamps based on relative healthy food access: A spatio-temporal Bayesian approach. International journal of health geographics. Int. J. Health Geogr. 2015, 14, 37. [Google Scholar] [CrossRef] [Green Version]
  25. Mason, K.E.; Bentley, R.J.; Kavanagh, A.M. Fruit and vegetable purchasing and the relative density of healthy and unhealthy food stores: Evidence from an Australian multilevel study. J. Epidemiol. Community Health 2013, 67, 231–236. [Google Scholar] [CrossRef]
  26. Mercille, G.; Richard, L.; Gauvin, L.; Kestens, Y.; Payette, H.; Daniel, M. Comparison of two indices of availability of fruits/vegetable and fast food outlets. J. Urban Health 2013, 90, 240–245. [Google Scholar] [CrossRef] [Green Version]
  27. Polsky, J.Y.; Moineddin, R.; Dunn, J.R.; Glazier, R.H.; Booth, G.L. Absolute and relative densities of fast-food versus other restaurants in relation to weight status: Does restaurant mix matter? Prev. Med. 2016, 82, 28–34. [Google Scholar] [CrossRef]
  28. Giskes, K.; van Lenthe, F.; Avendano-Pabon, M.; Brug, J. A systematic review of environmental factors and obesogenic dietary intakes among adults: Are we getting closer to understanding obesogenic environments? Obes. Rev. 2011, 12, e95–e106. [Google Scholar] [CrossRef]
  29. Health Canada. Measuring the Food Environment in Canada. 2013. Available online: https://www.canada.ca/en/health-canada/services/food-nutrition/healthy-eating/nutrition-policy-reports/measuring-food-environment-canada.html (accessed on 15 November 2020).
  30. Cummins, S.; Macintyre, S. Food environments and obesity—Neighbourhood or nation? Int. J. Epidemiol. 2006, 35, 100–104. [Google Scholar] [CrossRef]
  31. Awadalla, P.; Boileau, C.; Payette, Y.; Idaghdour, Y.; Goulet, J.-P.; Knoppers, B.; Hamet, P.; Laberge, C. Cohort profile of the CARTaGENE study: Quebec’s population-based biobank for public health and personalized genomics. Int. J. Epidemiol. 2013, 42, 1285–1299. [Google Scholar] [CrossRef]
  32. Statistics Canada. 2016 Census Profile of Montreal, Quebec, Sherbrooke and Saguenay [Census Metropolitan Area], Quebec and Canada [Country]. Ottawa. 2017. Available online: https://www12.statcan.gc.ca/census-recensement/2016/dp-pd/prof/index.cfm?Lang=E (accessed on 15 November 2020).
  33. Lalonde, B.; Robitaille, É. L’environnement Bâti Autour des Écoles et les Habitudes de vie les Jeunes; État des Connaissances et Portrait du Québec.: Government of Quebec. 2014. Available online: https://www.inspq.qc.ca/pdf/publications/1894_Environnement_Bati_Ecoles.pdf (accessed on 15 November 2020).
  34. Robitaille, É.; Paquette, M.C. Development of a method to locate deserts and food swamps following the experience of a region in Quebec, Canada. Int. J. Environ. Res. Public Health 2020, 17, 3359. [Google Scholar] [CrossRef]
  35. Mahendra, A.; Polsky, J.Y.; Robitaille, E.; Lefebvre, M.; McBrien, T.; Minaker, L.M. Geographic retail food environment measures for use in public health. Health Promot. Chronic Dis. Prev. Can. Res. Policy Pract. 2017, 37, 357–362. [Google Scholar] [CrossRef] [Green Version]
  36. Statistics Canada. Dissemination Area (DA); Plain Language Definition 2018. Available online: https://www150.statcan.gc.ca/n1/pub/92-195-x/2011001/geo/da-ad/da-ad-eng.htm (accessed on 15 November 2020).
  37. Center for Disease Control and Prevention. Census Tract Level State Maps of the Modified Retail Food Environment Index (mRFEI). 2011. Available online: https://www.cdc.gov/obesity/downloads/census-tract-level-state-maps-mrfei_TAG508.pdf (accessed on 15 November 2020).
  38. Gamache, P.; Hamel, D.; Blasser, C. Material and Social Deprivation Index: A Summary. Institut National de Santé Publique du Québec. 2019. Available online: https://www.inspq.qc.ca/sites/default/files/santescope/indice-defavorisation/en/GuideMethodologiqueEN.pdf (accessed on 15 November 2020).
  39. Kullberg, K.; Aberg, A.C.; Bjorklund, A.; Ekblad, J.; Sidenvall, B. Daily eating events among co-living and single-living, diseased older men. J. Nutr. Health Aging 2008, 12, 176–182. [Google Scholar] [CrossRef]
  40. Kremmer, D.; Anderson, A.S.; Marshall, D.W. Living together and eating together: Changes in food choice and eating habits during the transition from single to married/cohabiting. Sociol. Rev. 1998, 46, 48–72. [Google Scholar] [CrossRef]
  41. IBM Corp. IBM SPSS Statistics for Windows, 25th ed.; IBM: Armonk, NY, USA, 2017. [Google Scholar]
  42. Mackenbach, J.D.; Beenackers, M.A.; Noordzij, J.M.; Groeniger, J.O.; Lakerveld, J.; van Lenthe, F.J. The moderating role of self-control and financial strain in the relation between exposure to the food environment and obesity: The GLOBE Study. Int. J. Environ. Res. Public Health 2019, 16, 674. [Google Scholar] [CrossRef] [Green Version]
  43. Mackenbach, J.D.; Rutter, H.; Compernolle, S.; Glonti, K.; Oppert, J.-M.; Charreire, H.; de Bourdeaudhuij, I.; Brug, J.; Nijpels, G.; Lakerveld, J. Obesogenic environments: A systematic review of the association between the physical environment and adult weight status, the SPOTLIGHT project. BMC Public Health 2014, 14, 233. [Google Scholar] [CrossRef]
  44. Assari, S.; Lankarani, M.M. Educational attainment promotes fruit and vegetable intake for Whites but not Blacks. J 2018, 1, 5. [Google Scholar] [CrossRef] [Green Version]
  45. Plante, C.; Blanchet, C.; Rochette, L. La Consommation des Aliments Chez les Québécois Selon les Recommandations du Guide Alimentaire Canadien. Québec: Institut National de Santé Publique du Québec. 2019. Available online: https://www.inspq.qc.ca/sites/default/files/publications/2616_consommation_aliments_quebecois_guide_alimentaire.pdf (accessed on 15 November 2020).
  46. Burgoine, T.; Mackenbach, J.D.; Lakerveld, J.; Forouhi, N.G.; Griffin, S.J.; Brage, S.; Wareham, N.J.; Monsivais, P. Interplay of socioeconomic status and supermarket distance is associated with excess obesity risk: A UK cross-sectional study. Int. J. Environ. Res. Public Health 2017, 14, 1290. [Google Scholar] [CrossRef] [Green Version]
  47. Zenk, S.N.; Lachance, L.L.; Schulz, A.J.; Mentz, G.; Kannan, S.; Ridella, W. Neighborhood retail food environment and fruit and vegetable intake in a multiethnic urban population. Am. J. Health Promot. 2009, 23, 255–264. [Google Scholar] [CrossRef] [Green Version]
  48. Han, H.Y.; Paquet, C.; Dubé, L.; Nielsen, D.E. Diet quality and food prices modify associations between genetic susceptibility to obesity and adiposity outcomes. Nutrients 2020, 12, 3349. [Google Scholar] [CrossRef]
  49. Nielsen, D.E.; Han, Y.; Paquet, C.; Portella, A.K.; Ma, Y.; Dube, L. Interaction of DRD2/ANKK1 Taq1A genotype with in-store retail food environment exposures on diet quality in a cohort of Quebec adults. Lifestyle Genom. 2020, 13, 74–83. [Google Scholar] [CrossRef]
  50. Bodor, J.N.; Ulmer, V.M.; Dunaway, L.F.; Farley, T.A.; Rose, D. The rationale behind small food store interventions in low-income urban neighborhoods: Insights from New Orleans. J. Nutr. 2010, 140, 1185–1188. [Google Scholar] [CrossRef]
  51. Enzenbach, C.; Wicklein, B.; Wirkner, K.; Loeffler, M. Evaluating selection bias in a population-based cohort study with low baseline participation: The LIFE-Adult-Study. BMC Med. Res. Methodol. 2019, 19, 135. [Google Scholar] [CrossRef]
  52. Strandhagen, E.; Berg, C.; Lissner, L.; Nunez, L.; Rosengren, A.; Torén, K.; Thelle, D. Selection bias in a population survey with registry linkage: Potential effect on socioeconomic gradient in cardiovascular risk. Eur. J. Epidemiol. 2010, 25, 163–172. [Google Scholar] [CrossRef]
  53. Kirkpatrick, S.I.; Reedy, J.; Butler, E.N.; Dodd, K.W.; Subar, A.F.; Thompson, F.E.; McKinnon, R.A. Dietary assessment in food environment research: A systematic review. Am. J. Prev. Med. 2014, 46, 94–102. [Google Scholar] [CrossRef] [Green Version]
  54. Perchoux, C.; Chaix, B.; Cummins, S.; Kestens, Y. Conceptualization and measurement of environmental exposure in epidemiology: Accounting for activity space related to daily mobility. Health Place 2013, 21, 86–93. [Google Scholar] [CrossRef]
  55. Kestens, Y.; Thierry, B.; Shareck, M.; Steinmetz-Wood, M.; Chaix, B. Integrating activity spaces in health research: Comparing the VERITAS activity space questionnaire with 7-day GPS tracking and prompted recall. Spat. Spatio-Temporal Epidemiol. 2018, 25, 1–9. [Google Scholar] [CrossRef]
  56. Chum, A.; Farrell, E.; Vaivada, T.; Labetski, A.; Bohnert, A.; Selvaratnam, I.; Larsen, K.; Pinter, T.; O’Campo, P. The effect of food environments on fruit and vegetable intake as modified by time spent at home: A cross-sectional study. BMJ Open 2015, 5, e006200. [Google Scholar] [CrossRef] [Green Version]
  57. Hartmann-Boyce, J.; Bianchi, F.; Piernas, C.; Payne Riches, S.; Frie, K.; Nourse, R.; Jebb, S.A. Grocery store interventions to change food purchasing behaviors: A systematic review of randomized controlled trials. Am. J. Clin. Nutr. 2018, 107, 1004–1016. [Google Scholar] [CrossRef]
  58. Jalbert-Arsenault, E.; Robitaille, E.; Paquette, M.C. Development, reliability and use of a food environment assessment tool in supermarkets of four neighbourhoods in Montreal, Canada. Health Promot. Chronic Dis. Prev. Can. Res Policy Pract. 2017, 37, 293–302. [Google Scholar] [CrossRef] [Green Version]
Figure 1. Sample size, exclusion criteria, and moments of data collection [31].
Obesities 02 00004 g001
Table 1. Characteristics and F&V intake of participants who took part in the food frequency questionnaire, by data completeness.
CharacteristicsParticipants with Complete Data
(n = 7783)
% or Mean (SD)
Participants Who Were Excluded after Completing Phase A Survey
% or Mean (SD)
Age54.7 (7.7)54.0 (8.0)
Sex n = 12,203
Men48.348.5
Women51.751.5
Annual household income n = 10,883
Less than 25,000$8.716.4
25,000$–49,999$22.024.3
50,000$–74,999$23.320.6
75,000$–99,999$16.313.7
100,000$–149,999$18.515.1
More than 150,000$11.39.9
Education n = 12,075
High school or less22.228.6
Trade or technical school21.521.9
Pre-university CEGEP 1 or non-university certificate10.110.0
University certificate8.58.0
Bachelor’s degree23.919.9
Graduate studies13.711.5
Marital status n = 12,073
Married and/or living with a partner67.561.3
Divorced, separated, widowed, or single32.538.7
Employment situation n = 12,046
Worker67.164.5
Unemployed, unable to work, retired, or caregiver32.935.5
Density of neighborhood of primary residence 2 n = 1853
1st and 2nd quintile—low density8.911.3
3rd quintile11.413.1
4th quintile29.626.3
5th quintile—high density50.249.3
Material deprivation index of primary residence neighborhood n = 1485
1st quintile—most privileged31.737.6
2nd quintile23.721.5
3rd quintile19.718.2
4th quintile15.812.7
5th quintile—most deprived9.210.1
Recommended F&V consumption n = 11,779
No (0 to 4 portions per day)46.150.4
Yes (5 or more portions per day)53.949.6
Fruit and vegetable intake per day (number of portions) n = 11,779
5.0 (2.6)4.8 (2.6)
1 In the province of Quebec, CEGEP represents the 12th and 13th years of schooling and precedes university. 2 Represents density quintile of the home neighborhood. As the study focused on the urban areas of Quebec, there were few low-density neighborhoods, so the 1st and 2nd quintiles were combined.
Table 2. Odds ratios representing chances of eating 5 or more F&V portions per day, by participant characteristics, as calculated with logistic regression (n = 7783).
CharacteristicsIndividual Models OR (95% CI)Model A 1
OR (95% CI)
Model B 2
OR (95% CI)
Sex
MenREF 3REFREF
Women2.88 (2.63–3.16) **3.13 (2.85–3.44) **3.13 (2.85–3.44) **
Age
1st quintile: Age 40.1–46.5REF
2nd quintile: Age 46.6–51.11.04 (0.89–1.20)
3rd quintile: Age 51.2–55.71.05 (0.91–1.22)
4th quintile: Age 55.8–62.31.03 (0.89–1.19)
5th quintile: Age 62.4–70.31.08 (0.93–1.25)
Annual household income
Less than 25,000$REFREFREF
25,000$–49,999$1.12 (0.94–1.34)1.14 (0.95–1.37)1.14 (0.94–1.37)
50,000$–74,999$1.30 (1.09–1.55) **1.32 (1.09–1.59) **1.32 (1.09–1.59) **
75,000$–99,999$1.28 (1.06–1.54) *1.31 (1.07–1.60) **1.31 (1.07–1.60) **
100,000$–149,999$1.42 (1.18–1.71) **1.41 (1.16–1.72) **1.40 (1.15–1.71) **
More than 150,000$1.75 (1.42–2.14) **1.59 (1.28–1.99) **1.57 (1.25–1.96) **
Education
High school or lessREFREFREF
Trade or technical school1.27 (1.11–1.45) **1.27 (1.11–1.47) **1.27 (1.10–1.46) **
Pre-university CEGEP 2 or non-university certificate1.53 (1.29–1.81) **1.51 (1.26–1.80) **1.50 (1.25–1.79) **
University certificate1.66 (1.38–1.99) **1.63 (1.35–1.97) **1.62 (1.34–1.96) **
Bachelor’s degree1.79 (1.56–2.04) **1.80 (1.56–2.07) **1.77 (1.53–2.04) **
Graduate studies2.08 (1.78–2.43) **2.20 (1.85–2.61) **2.16 (1.82–2.57) **
Marital status
Married and/or living with a partnerREF
Divorced, separated, widowed, or single0.98 (0.89–1.08)
Employment situation
WorkerREF
Unemployed, unable to work, retired, or care giver1.00 (0.91–1.10)
Density of neighborhood of primary residence
1st and 2nd quintile—low densityREF
3rd quintile0.98 (0.80–1.19)
4th quintile1.03 (0.87–1.22)
5th quintile—high density1.14 (0.97–1.34)
Material deprivation index of primary residence neighborhood
1st quintile—most privilegedREFREF
2nd quintile0.91 (0.81–1.03)1.00 (0.88–1.14)
3rd quintile0.75 (0.66–0.86) **0.85 (0.74–0.98) *
4th quintile0.79 (0.69–0.91) **0.93 (0.80–1.08)
5th quintile—most deprived0.79 (0.67–0.93) **0.99 (0.82–1.18)
Proximity to nearest retail food outlet 4
1st quintile: 0–391 (Near)REF
2nd quintile: 392–6940.91 (0.79–1.05)
3rd quintile: 695–11020.84 (0.73–0.97) *
4th quintile: 1103–17050.85 (0.74–0.98) *
5th quintile: 1706–13865 (Far)0.90 (0.78–1.04)
Proximity to the nearest convenience store
1st quintile: 0–248 (Near)REF
2nd quintile: 248–4410.76 (0.66–0.88) **
3rd quintile: 441–6740.84 (0.72–0.96) *
4th quintile: 674–10640.87 (0.75–1.00) *
5th quintile: 1065–6786 (Far)0.78 (0.68–0.90) **
Proximity to nearest fast food outlet
1st quintile: 0–377 (Near)REF
2nd quintile: 377–6130.89 (0.77–1.03)
3rd quintile: 613–9150.91 (0.79–1.05)
4th quintile: 916–13940.81 (0.70–0.93) **
5th quintile: 1395–14461 (Far)0.85 (0.74–0.98) *
Density of retail food outlets 4
1st quintile: 0.00–0.06REF
2nd quintile: 0.07–1.000.90 (0.79–1.03)
3rd quintile: 1.002–2.320.915 (0.79–1.06)
4th quintile: 2.33–6.000.98 (0.85–1.13)
5th quintile: 6.01–37.971.22 (1.05–1.40) **
Density of convenience stores
1st quintile: 0.00 -1.31REF
2nd quintile: 1.31–3.001.00 (0.87–1.15)
3rd quintile: 3.00–6.001.14 (0.99–1.31)
4th quintile: 6.04–13.521.08 (0.94–1.25)
5th quintile: 13.53–60.601.27 (1.11–1.47) **
Density of fast food outlet
1st quintile: 0.00–0.76REF
2nd quintile: 0.76–2.730.93 (0.81–1.07)
3rd quintile: 2.73–5.711.00 (0.87–1.15)
4th quintile: 5.72–11.581.00 (0.87–1.15)
5th quintile: 11.60–213.151.24 (1.07–1.43) **
Relative density of less healthy outlets (mRFEI 5)
1st quintile: 0–75%REF
2nd quintile: 75–81%1.00 (0.86–1.15)
3rd quintile: 81–87%0.95 (0.82–1.09)
4th quintile: 87–95%0.86 (0.75–0.99) *
5th quintile: 95–100%0.95 (0.83–1.10)
X2 (p-value) 712.1 (0.00)719.1 (0.00)
Cox & Snell R Square 0.0870.088
Nagelkerke R Square 0.1170.118
Percentage accuracy in classification (PAC) 63.7%63.8%
* Significant at p < 0.05. ** Significant at p < 0.01. 1 Model A is corrected for sex, annual household income, and education. 2 Model B is corrected for variables of model A and for material deprivation index.3 Reference category 4 Retail food outlets include grocery stores, supermarkets, fruit and vegetable shops, and farmers’ markets. 5 Modified Retail Food Environment Index.
Table 3. Sensitivity analysis of the association between chances of eating 5 or more F&V portions per day, and food environment variables, as calculated with multiple logistic regression (n = 7783).
CharacteristicsModels 1
OR (95% CI)
X2 (p-Value)Cox & Snell R SquareNagelkerke R Square
Proximity to nearest retail food outlet 1 747.260.090.122
1st quintile: 0–391 (Near)REF 2
2nd quintile: 392–6940.91 (0.78–1.06)
3rd quintile: 695–11020.87 (0.74–1.02)
4th quintile: 1103–17050.89 (0.76–1.05)
5th quintile: 1706–13,865 (Far)0.97 (0.81–1.16)
Proximity to the nearest convenience store 747.150.090.123
1st quintile: 0–248 (Near)REF
2nd quintile: 248–4410.82 (0.70–0.95) *
3rd quintile: 441–6740.84 (0.71–0.98) *
4th quintile: 674–10640.85 (0.71–1.01)
5th quintile: 1065–6786 (Far)0.76 (0.63–0.91) *
Proximity to nearest fast food outlet 753.830.090.123
1st quintile: 0–377 (Near)REF
2nd quintile: 377–6130.89 (0.76–1.04)
3rd quintile: 613–9150.92 (0.79–1.08
4th quintile: 916–13940.80 (0.68–0.93) *
5th quintile: 1395–14,461 (Far)0.86 (0.72–1.02)
Density of retail food outlets 751.960.090.123
1st quintile: 0.00–0.06REF
2nd quintile: 0.07–1.000.91 (0.79–1.05)
3rd quintile: 1.002–2.320.90 (0.77–1.06)
4th quintile: 2.33–6.000.95 (0.81–1.12)
5th quintile: 6.01–37.971.12 (0.94–1.33)
Density of convenience stores 754.900.090.124
1st quintile: 0.00–1.31REF
2nd quintile: 1.31–3.001.07 (0.92–1.25)
3rd quintile: 3.00–6.001.22 (1.03–1.43) *
4th quintile: 6.04–13.521.15 (0.97–1.38)
5th quintile: 13.53–60.601.35 (1.12–1.62) **
Density of fast food outlet 749.760.090.123
1st quintile: 0.00–0.76REF
2nd quintile: 0.76–2.730.92 (0.79–1.07)
3rd quintile: 2.73–5.710.99 (0.85–1.16)
4th quintile: 5.72–11.580.99 (0.85–1.17)
5th quintile: 11.60–213.151.13 (0.95–1.34)
Relative density of less healthy outlets (mRFEI 3) 747.150.090.122
1st quintile: 0–75%REF
2nd quintile: 75–81%1.02 (0.88–1.19)
3rd quintile: 81–87%0.98 (0.84–1.14)
4th quintile: 87–95%0.91 (0.78–1.05)
5th quintile: 95–100%1.05 (0.90–1.22)
* Significant at p < 0.05. ** Significant at p < 0.01; 1 Adjusted for sex, income, education, and deprivation, 2 Reference category, 3 Modified Retail Food Environment Index.
Publisher’s Note: MDPI stays neutral with regard to jurisdictional claims in published maps and institutional affiliations.

