Article

Intermittent Energy Restriction Combined with a High-Protein/Low-Protein Diet: Effects on Body Weight, Satiety, and Inflammation: A Pilot Study

1
Faculty of Health, Dalhousie University, Halifax, NS B3H 4R2, Canada
2
Faculty of Health and Human Performance, Dalhousie University, Halifax, NS B3H 4R2, Canada
*
Author to whom correspondence should be addressed.
Obesities 2023, 3(2), 180-192; https://doi.org/10.3390/obesities3020015
Submission received: 3 April 2023 / Revised: 6 May 2023 / Accepted: 16 May 2023 / Published: 19 May 2023
(This article belongs to the Special Issue How to Prevent Obesity and Inflammatory Disease 2022)

Abstract

:
Intermittent energy restricted (IER) diets have become popular as a body weight management approach. In this pilot study, we investigated if an IER diet would reduce systemic inflammation and if maintaining an elevated protein level while on an IER diet would enhance satiety. Six healthy women, aged 33–55 years with a BMI of 27–33 kg/m2, were randomized to first adhere to either a low- or high-protein IER diet using whole foods for three weeks. They then returned to their regular diets for a week, after which they adhered to the second diet for three weeks. Each test diet consisted of three low-energy intake days followed by four isocaloric energy intake days. The diets differed only in protein content. High-sensitivity C-reactive protein (hs-CRP), glucose, satiety, body weight, and waist circumference were measured at the beginning and end of each dietary intervention. Most participants showed reductions in hs-CRP levels from baseline on both IER diets but reported greater satiety when adhering to the higher protein IER diet. Overall, the IER diets reduced body weight and appeared to decrease inflammation in these overweight women, and the higher protein version enhanced satiety, which may lead to greater long-term dietary adherence.

1. Introduction

The worldwide prevalence of obesity is rising. According to the World Health Organization, approximately 1.9 billion individuals aged 18 years and older are overweight or obese [1]. By 2025, global obesity rates will reach 18% for the male population and 21% for the female population [2]. Evidence shows that obesity commonly generates adipose tissue dysfunction [3,4]. The excessive accumulation of fat in adipocytes can result in a decrease in mitochondrial metabolism, and an increase in the release of pro-inflammatory adipokines, such as TNF-α and IL-6 [4]. Additionally, this chronic low-grade systemic inflammation can act as an underlying risk factor for developing many chronic diseases, including type II diabetes, cardiovascular disease, hypertension, and cancer [4]. Adipose tissue also synthesizes and secretes certain hormones, such as leptin and adiponectin, which play essential roles in appetite regulation [5].
Recent epidemiological studies show that dietary strategies involving intermittent energy restriction (IER) are beneficial therapeutic interventions for the prevention or treatment of inflammatory disease [6,7]. IER diets restrict energy intake from one day to a few days a week, followed by intervals of refeeding in the remainder of the week. Various versions of IER diets restrict energy from 75% to as low as 10% of the total energy intake required to maintain body weight. IER diets have been demonstrated to improve metabolic performance and cellular modifications that contribute to reversing oxidative damage and inflammation [8,9]. These diets may also be effective at regulating blood glucose levels and enhancing metabolic outcomes [9]. In addition, recent evidence indicates that IER diets can serve as an alternative to continued energy restricted (CER) diets for weight loss and to improve health indicators like decreasing pro-inflammatory markers. For example, a recent randomized controlled trial compared an IER strategy to a CER diet in adults aged between 18 and 45 years with a BMI of 22.0–35.0 kg/m2. They reported similar benefits in terms of hunger and health markers such as total cholesterol and low-density lipoprotein cholesterol over the 12 weeks, although some indicators suggested that the IER diet may be more beneficial [10]. A systemic review that compared the effect of IER to CER diets on weight loss also reported that both have similar effects on weight loss [11]. Giving further credence to the efficacy of an IER diet, a recent systematic review, which included 27 randomized controlled trials on women and men who were overweight or obese, found that IER diets reduced both body weight and fat mass [12].
Many versions of IER diets are purported to be beneficial. Some of these alternate the intervals of energy restriction versus normal energy intake; currently, the optimal protocol for an IER diet is unclear. A study using an animal model has demonstrated that three consecutive days of energy restriction were associated with greater improvements in insulin sensitivity, inflammation, and even the regeneration of failed pancreatic cells [13]. Nevertheless, the benefits and feasibility of such diets for human subjects have not been adequately identified and investigated. Interestingly, a recent study demonstrated that an IER diet modified the hypothalamic expression of critical genes that are involved in lipid metabolism, inflammation, and the regulation of the insulin and leptin pathways [14]
Non-adherence is a common issue with human dietary interventions designed for weight loss, especially in diets that depend on restricted energy intake [15]. For instance, a systematic review and meta-analysis involving 45 randomized controlled trials that examined the effects of energy restriction interventions in obese individuals reported that nearly 28% of subjects dropped out due to non-adherence to their dietary interventions [16]. Accordingly, increasing the ability to adhere to an IER diet is an important factor for its success [15,17]. One of the critical elements for adherence may be increased satiety. Thus, including foods that increase the satiety in energy restricted diets, such as foods with higher protein content, may increase adherence [18].
An IER diet that increases the protein content of the diet while restricting the fat and carbohydrate proportions will result in a higher calculated total energy intake than a diet that decreases the intake of all three macronutrients. However, this difference in protein intake is unlikely to profoundly impact total energy availability because protein is used by the body sparsely as a primary source of energy [19], yet it is the macronutrient that provides the greatest satiety [20]. Therefore, in the current study, our primary hypothesis was that a higher protein content combined with an IER diet will facilitate adherence to the diet because protein intake enhances satiety. Secondly, we hypothesized that an IER diet will reduce inflammation independent of protein content. Since this is a feasibility study, we examined the feasibility, effectiveness, and acceptability of an IER diet at low- versus high-protein content to improve health indicators such as CRP, body weight, waist circumference, and fasting glucose.

2. Materials and Methods

2.1. Participants

In the summer of 2018, we posted the study poster in LISTSERVs for recruiting participants in Halifax, Nova Scotia, Canada. We recruited six women between the ages of 33 and 55 years with a body mass index of 27–33 kg/m2. Only women were included in order to increase the homogeneity of the participants in the study considering the small sample size [21]. An additional reason for selecting only women was that clinical trials have shown differences between men and women in appetite sensations and appetite responses to macronutrient content changes in diets [22,23]. We also narrowed the age range of participants because evidence has demonstrated physiological differences in sensory satiety among age groups (i.e., adolescent, middle age, and elderly) [24,25]. We also selected participants who were in a discrete range of overweight or obese measures. For the purpose of this study, overweight and obese criteria were determined by a body mass index (BMI) between 27 and 33 kg/m2. By excluding obese individuals who have a BMI greater than 33 kg/m2, we excluded those who were more likely to have undiagnosed obesity-related chronic disease [26]. Additionally excluded from this study were pregnant or breastfeeding women because of their greater nutritional needs, as well as individuals predisposed to or with serious diagnosed health conditions. Participants taking prescribed medications that could affect their metabolism and possibly their immune function, such as those with special dietary requirements for a health condition (collected by self-assessed report), were also excluded. All participants were non-smokers who did not consume more than one alcoholic beverage per day or drink more than two cups of coffee per day, as both can alter metabolism levels. All participants were willing to eat the food used in this study, either the regular (meat included) meal options or the vegetarian meal options, and they were capable of preparing their own food during the study period.
For the individuals who were interested in participating, we set up individual interviews for identity protection. This initial interview consisted of a brief description of the study, objectives, methodology, inclusion and exclusion criteria of the participants, and their answers to a prepared oral questionnaire, which provided the necessary information to ascertain a participant’s understanding of the study before starting further screening eligibility. The researcher then measured the waist circumference, weight, and height of the volunteer and calculated their BMI; if the BMI measurement met the criterion, then the interview was conducted with each prospective participant. The main purpose of the interview was to go through the self-screening questions that were already been filled by participants. The researcher did not retain a participant’s name until the researcher was certain of their eligibility and they agreed to participate. If eligibility was confirmed, and the volunteer fully understood the study and their role, they were asked to sign the consent form. Participant identification numbers rather than names were used on all materials, and this information was kept with consent forms in a separate locked cabinet. The study protocol was approved by the Dalhousie University Research Ethics Board (protocol number 2018-4477).

2.2. Study Design

The study utilized a cross-over design consisting of two three-week treatment periods with a one-week washout period with no dietary restrictions between treatment periods. The participants were randomized to begin with either the low- or high-protein IER diet. See Figure 1 and Section 2.3 for dietary details.

2.3. Dietary Interventions

The dietary plan consisted of three low-energy intake days followed by four days of consuming the amount of energy calculated to maintain body weight; this cycle was repeated for three weeks. The two treatment periods differed by protein content in days 1–3, which were designated as PRO− and PRO+ as shown in Figure 1. Between dietary periods, the participants had one week off so that the effects of the previous diet would wear off. Doing so helped us assess the effects of each diet separately. Since these are novel diets, this pilot study was used to inform us on the design of a future, larger study. For study purposes, we developed quick recipes, which use similar ingredients to those used in the classic Mediterranean diet, which is generally considered to be a healthy diet [27]. The primary source of protein was a variety of animal- and plant-based proteins based on each participant’s preferences. The recipes were same for both interventions and only differed by the macronutrient content as described in following section.

2.3.1. PRO− Diet

The PRO− diet consisted of a 7-day cyclical diet. On the first day of the PRO− diet, the participants’ dietary energy intake was restricted to 50% of the total energy required to maintain their current body weight. On days 2 and 3, energy intake was restricted to 70% of the total required energy. The proportion of energy intake from macronutrients remained at 17% protein, 28% fat, and 55% carbohydrates. The total energy on day one was approximately 1000–1300 kcal, and on days 2 to 3, it was approximately 700 to 800 calorie kcal. During days 4 to 7, the participants consumed a diet that maintained the same proportion of macronutrients (17% protein, 28% fat, and 55% carbohydrates) but in amounts calculated to maintain their body weight.

2.3.2. PRO+ Diet

The PRO+ diet, the experimental diet we developed for this study, differed substantially from the PRO− diet only in protein content on days 1–3 of each treatment week. The participants’ dietary energy intake was restricted to 45% of the total energy required to maintain their current body weight. On days 2 and 3, energy intake was restricted to 60% of the total required energy. The proportion of energy intake from macronutrients remained at 40% protein, 15% fat, and 45% carbohydrates. The total energy in day 1 was approximately 1200–1500 kcal, and on days 2–3, it was 900 to 1300 kcal. During days 4 to 7, the participants consumed a diet that maintained the same proportion of macronutrients (40% protein, 15% fat, and 45% carbohydrate) but in amounts calculated to maintain their body weight.

2.4. Anthropometric Measures

The anthropometric measurements were obtained on the first day of the diet (baseline) and at the end of the third week (the end of treatment) of each treatment period. These measurements included weight, height, and waist circumference, all of which were measured according to standardized procedures. To measure height, the participants were required to remove their shoes and anything on their heads and then stand upright on the central point of a stadiometer platform with their backs against the wall and their feet together while looking straight ahead with their backs and shoulders touching the wall. Their BMI was then calculated. Waist circumference was measured while the participants were in an upright but relaxed position using the World Health Organization method, which posits the location as “at the mid-point between the highest point of the iliac crest and the last floating rib” [28].

2.5. Blood Tests

Blood samples were collected via finger stick after a minimum of 12 h of fasting and tested for glucose and a hs-CRP test at baseline and at the end of each of the two treatment periods. The CRP high-sensitivity rapid test (CRP-K10, Schwerin, Germany) was used, which has a reference range for CRP as follows: negative, less than 10 mg/L; positive, which is divided into three levels: low, 10 mg/L or less than 30 mg/L; medium, 30 mg/L; and high, greater than 30 mg/L. These reference ranges were provided by the manufacturer of the test kits. Additionally, based on the manufacturer of the test kits, the relative sensitivity of the CRP-K10 kit depends on the CRP level. Specifically, for CRP values of 10 mg/L, the relative sensitivity is 99.4%; 94.3% for a CRP range of 10 mg/L to less than 30 mg/L; and 99.1% for CRP values of 30 mg/L or greater. For the measurement of blood glucose from serum, the One Touch Ultra (USA) was used, which has been demonstrated to have sufficient validity and reliability [29].

2.6. Hunger, Satisfaction, and Fullness

A visual analogue scale is a self-assessment tool that dietary researchers often use to assess the magnitude of hunger, satisfaction, and fullness. The visual analogue scales used in this study provide a continuum of values in ascending order from 0 to 10, where 0 is the lowest level, and 10 is the highest level represented. These values are classified into specific categories, with each category representing the level of a participant’s experience of hunger, satisfaction, and fullness. In the current study, the participants indicated their value of each category on the scale, as illustrated in Figure 2. Each participant completed the visual analogue scale by marking the point on the scale that best represented the level of their feelings of fullness, satisfaction, and hunger during the energy-restricted days.

2.7. Adherence

Subject behavior was our greatest concern when considering enhanced adherence to the diet. Tactics used in this study to avoid high withdrawal rates included the use of whole foods rather than liquids, because solid foods offer greater prolonged satiety than liquid meals. Additionally, our study did not require specific times for food consumption; thus, the participants could consume meals based on their individual schedules.
Adherence is also enhanced by self-monitoring [15]. Therefore, all participants were given a food journal and asked to record their food consumption on fasting days and then bring their journal to each lab visit. To further encourage compliance, each participant was contacted at least twice a week by phone or in person. During these communications and the lab visits, the participants were asked questions that gathered more information about how they were managing their diet, and to determine if they were experiencing any difficulties. Based on ongoing feedback, a researcher also customized the foods to the preferences of the participants to enhance adherence. All participants were also encouraged to use the Lifesum app for self-monitoring during non-restricted days. Additionally, each participant was provided with an individualized cookbook with recipes for days one to three of the PRO− and PRO+ diets; these recipes considered the participants’ food choices but remained commensurate with the dietary plan of the study.

2.8. Statistical Analysis

Each numerical parameter (weight, waist circumference, BMI, and glucose) of pre-diet values was subtracted from post-diet values using SPSS (Version 24). All data were expressed as mean ± SD. Considering that the current study used a single case study design that involved a small sample size, the data were also presented descriptively and graphically.

3. Results

3.1. Participants

Six participants completed both phases of the study. An additional participant completed only a single treatment and was not included in the results. See Table 1.

3.2. Body Weight

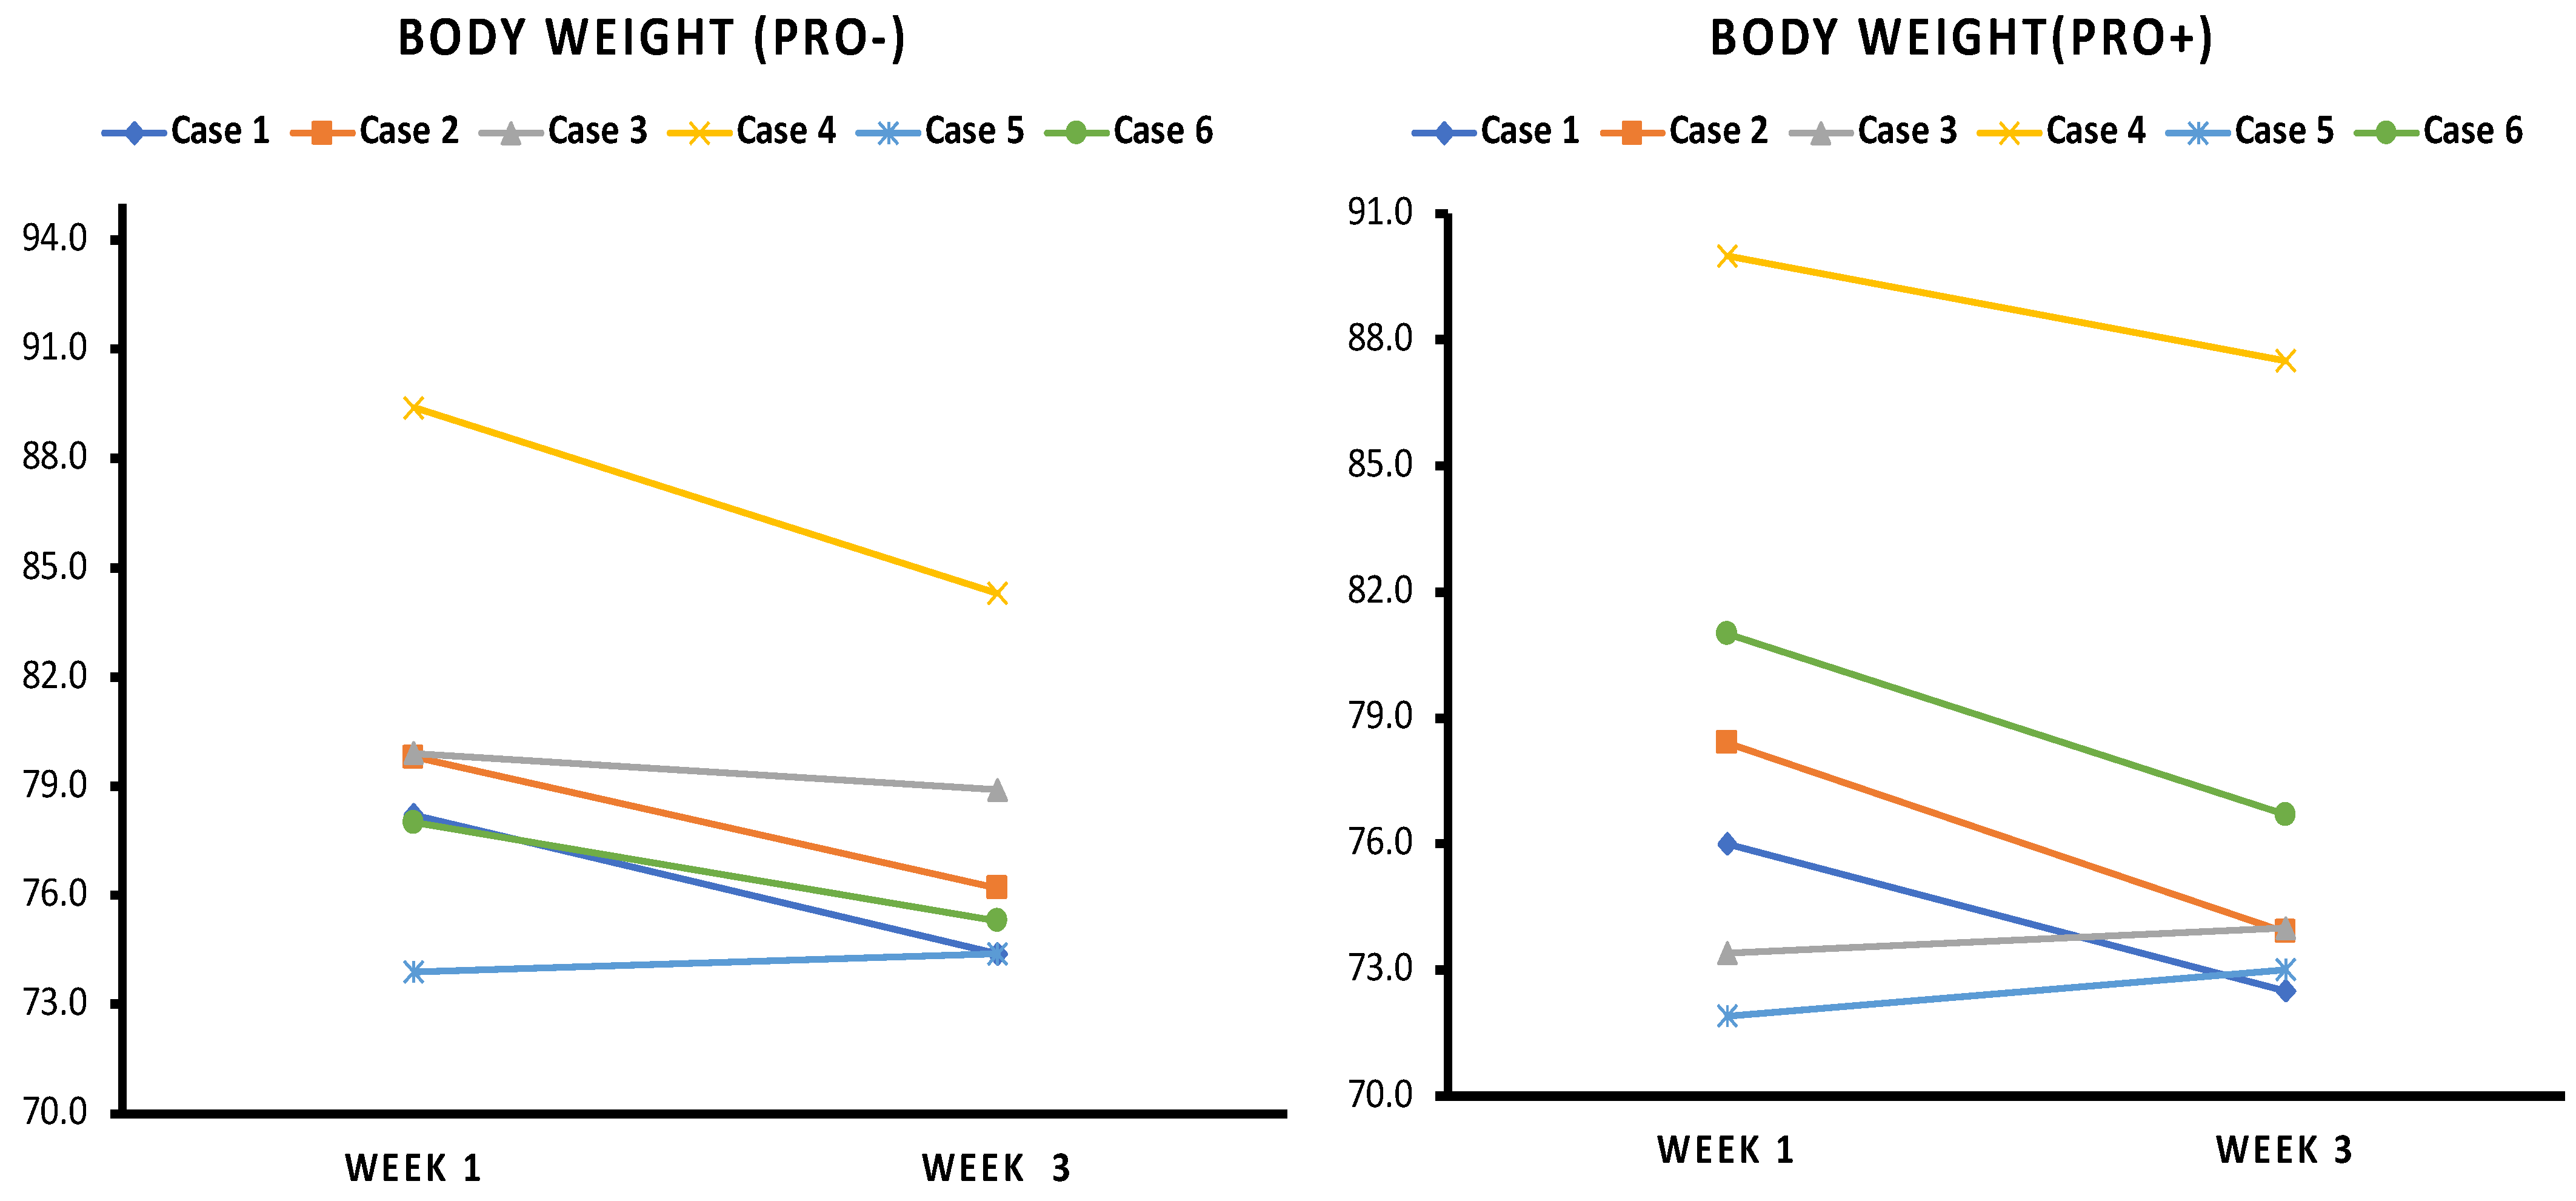
Weight loss occurred in 9 out of the 12 interventions, with an overall average loss of 2.40 kg on the IER diets. Similar losses occurred on both the PRO+ (2.45 kg) and PRO− (2.35 kg) diets (see Figure 3). The dietary records of Case 5, who showed a slight gain in body weight on both diets, indicated that she consumed an excessive amount of energy on the non-restricted days 4 to 7 compared to her isocaloric needs. Similarly, Case 3 reported that she ate unhealthy food during the restricted days of her PRO− diet, which may be the cause of her lack of weight loss.

3.3. Waist Circumference

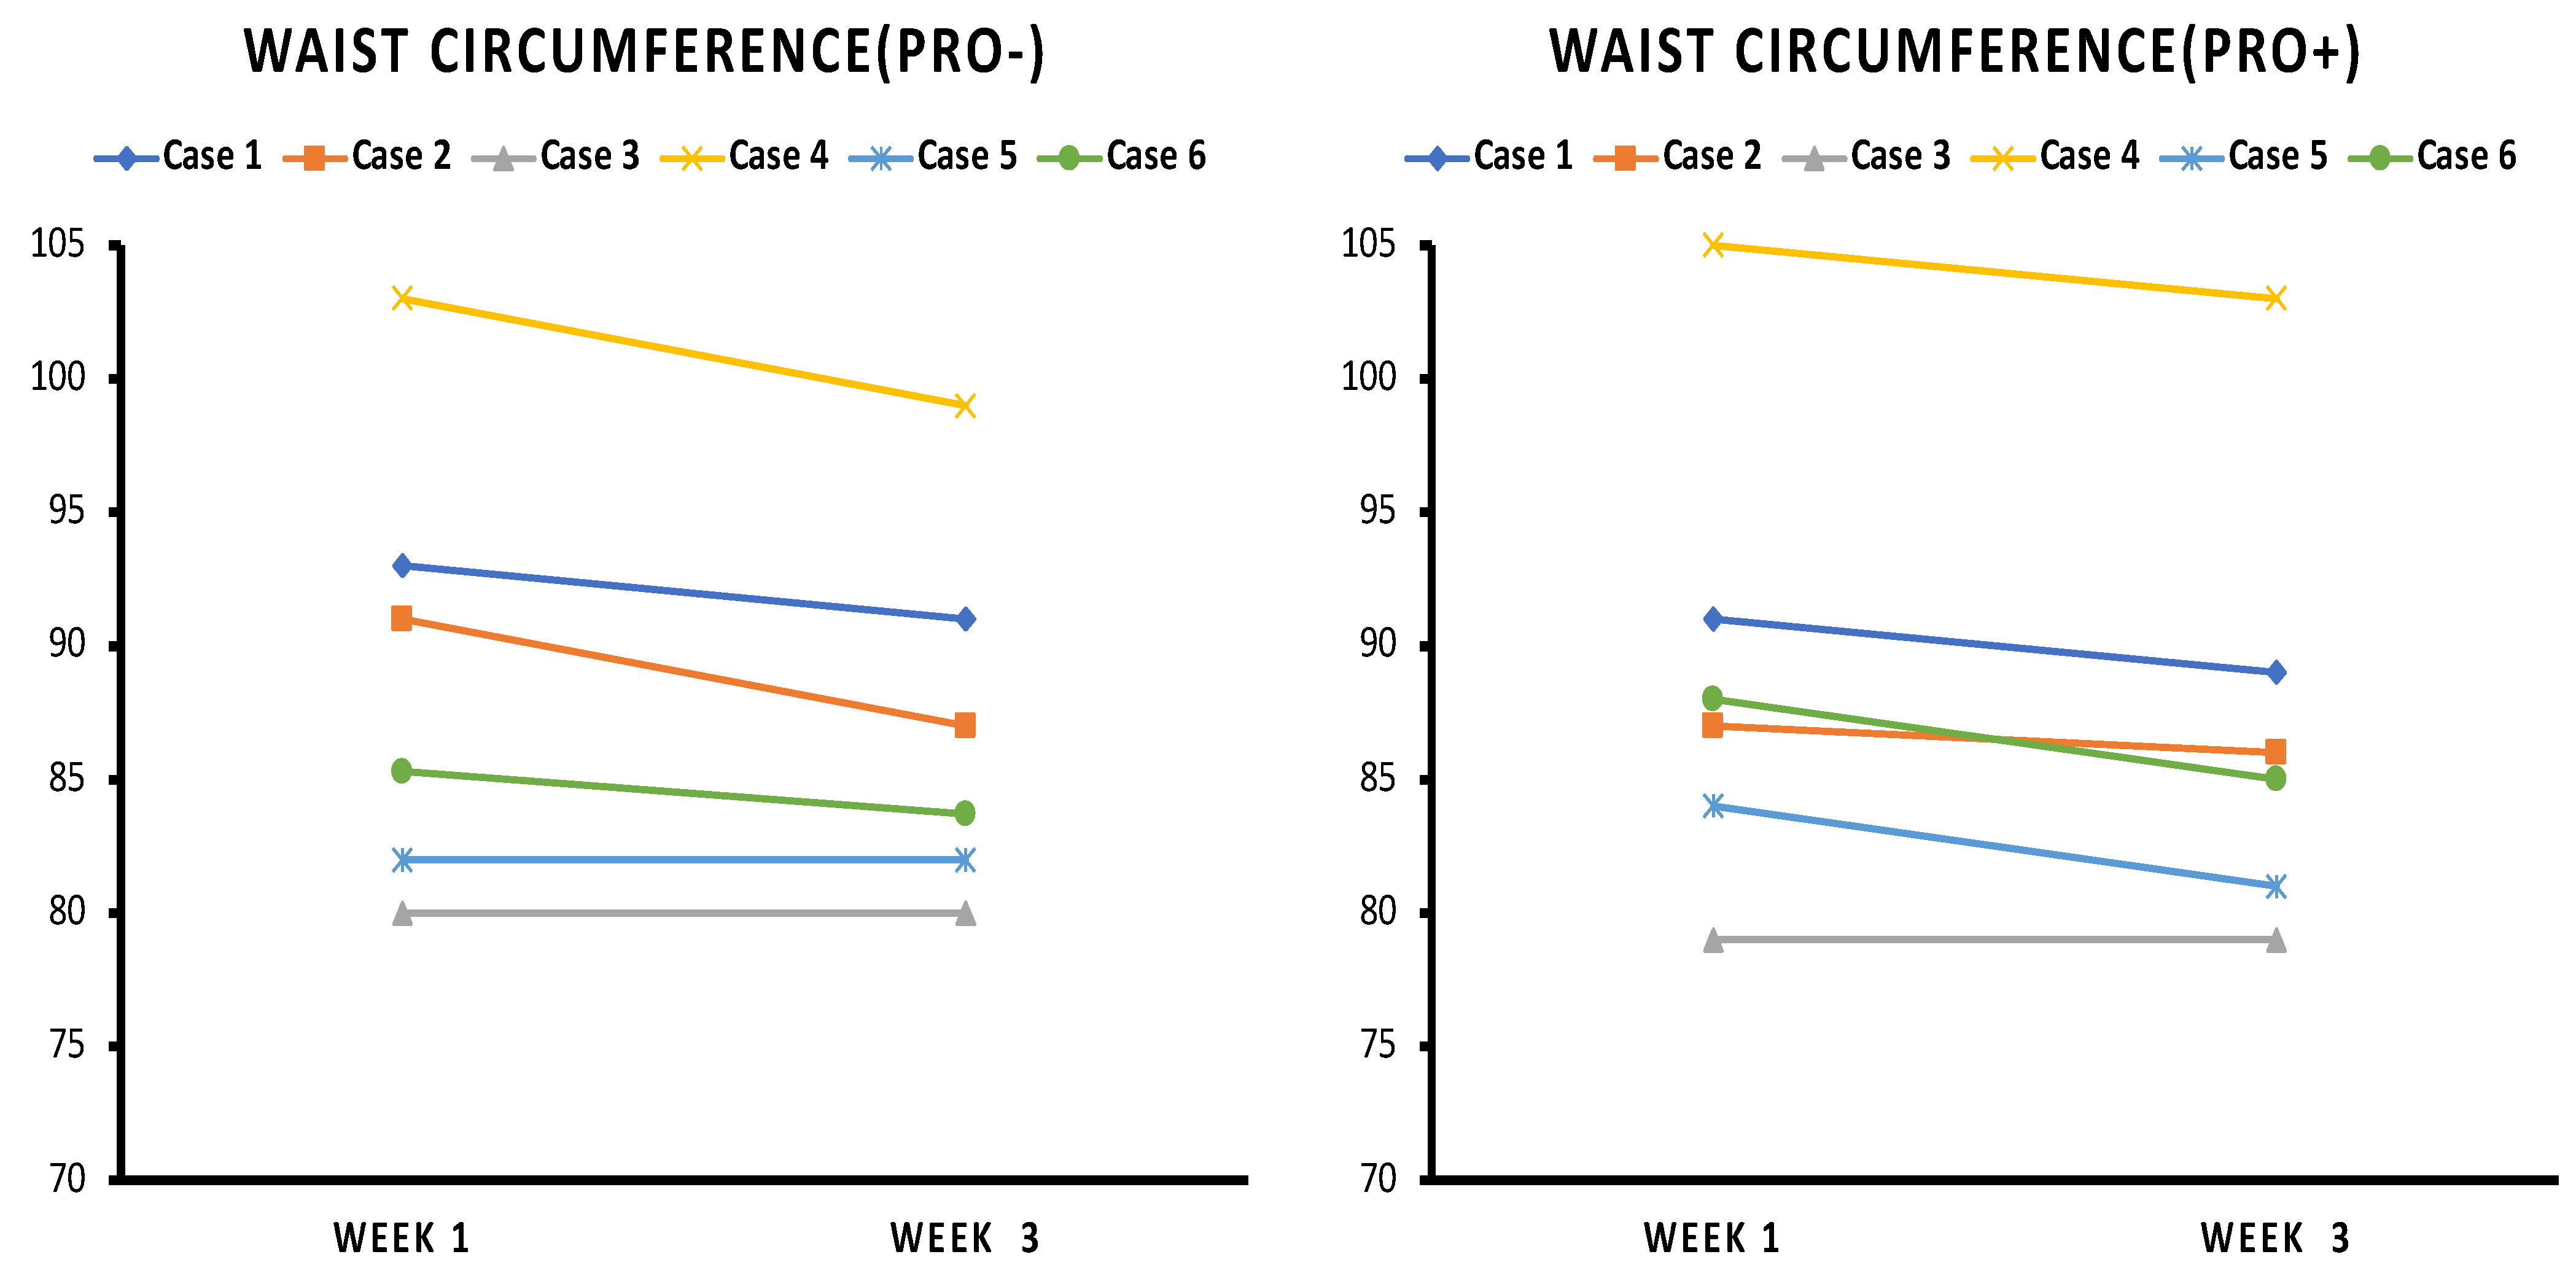
Changes in waist circumference varied considerably among the cases, ranging from 0 to 4 cm, with an average loss of 1.88 cm over each of the 12 periods (see Figure 4). A plausible reason that Case 5 did not experience a reduction in her waist circumference from her PRO− intervention is that she consumed more than the total energy required to main body weight on some non-restricted days.

3.4. CRP

Most participants showed reductions in CRP levels from the baseline value measured at their initial rotation (see Table 2). Three participants with a low level of CRP at the beginning of the first phase of intervention dropped to negative at the end of week three and maintained this negative status through their subsequent dietary rotation.

3.5. Fasting Glucose

There were no discernible trends in fasting glucose levels throughout the intervention period (see Figure 5). This might have been because the participants’ fasting glucose levels were within normal blood glucose levels both at baseline and at the end of the interventions. One participant, who had a higher than normal glucose level at baseline, decreased in fasting glucose from baseline to the final measurements in the second phase of the interventions.

3.6. Satiety

The participants reported greater satiety on the PRO+ diet than on the PRO− diet (see Figure 6). The participants indicated that they were successfully adhering to both diets (PRO+ and PRO−) but found the PRO+ diet easier to adhere to because it produced less hunger. All participants reported that, on the PRO+ diet, they felt more fullness than on the PRO− diet. Two participants in the PRO− diet group mentioned that on the third day of the restricted portion of the diet, they had an increased desire to eat, whereas two participants in the PRO+ diet group reported feeling full before finishing their meals.

3.7. Effect of Order of Rotation on Results

Participants who started with the PRO− diet achieved greater reduction in body weight and waist circumference than those who started with the PRO+ diet. There was no effect of the order of rotation of dietary intervention on fasting glucose and CRP results.

3.8. Additional Observations

Six participants completed the entire set of interventions. Only one participant did not complete the second phase of the intervention for reasons unrelated to the study. None of the participants reported adverse events during the PRO+ or PRO− diets. While following the PRO− diet, one participant reported slight headaches on days one and two of the restricted intake portion. No other adverse conditions were reported. Some of the participants found the Lifesum app was useful in teaching them how to select healthy food. All participants mentioned that they were committed to consuming the total recommended energy.

4. Discussion

4.1. Weight Loss and Waist Circumference

In this study, both diets induced a reduction in body weight and waist circumference, even though the high-protein diet contained higher energy density than the low-protein diet. These findings support a previous study that found that positive losses of waist circumference did not differ between two levels of moderate protein intake in participants on a low calorie diet [30]. Similarly, others have tested the effects of protein level while energy intake is restricted and reported similar results in weight loss [26]. Interestingly, the higher protein intakes result in increased retention of muscle mass at the expense of fat mass [26]. However, a very high-protein diet may have no further benefit, as increasing the protein content above the normal level of protein requirement has not produced a further reduction in body weight, although it helped maintain a higher level of free fat mass [31].

4.2. CRP

This pilot study suggests that three days of an energy restricted diet, whether it is high- or low-protein, can result in improvement in CRP for OW/OB women. Previous studies have used anti-inflammatory diets to investigate the effects of macronutrient proportions on inflammatory processes [32,33]. However, to our knowledge, no study has tested the effect of protein content on hs-CRP. Instead, various studies have investigated aspects of carbohydrate and fat intake on inflammation. Thus, previous studies have failed to fully inform guidelines for people with significantly high levels of hs-CRP.
Aspects of dietary carbohydrate content seem to exert effects on hs-CRP. For example, a study using 29 overweight women with an average BMI of 32.1 ± 5.4 kg/m2 found more benefits for reducing hs-CRP using a low-carbohydrate diet compared to a low-fat diet [34]. Interestingly, many of these studies found that macronutrient content is likely a more critical factor in reducing inflammation markers than weight loss. For example, a study with OW/OB patients aged 18–40 years reported that low glycemic load diets more effectively reduced the level of hs-CRP than a low-fat diet, although both diets similarly impacted weight loss [35]. These findings are consistent with those of a 12 month randomized trial that found that a low glycemic diet was more effective in reducing high levels of hs-CRP than a low-fat diet, despite the similarities in weight loss outcomes in both groups [36]. Another study compared the two versions of Mediterranean diets to a low-fat diet, and reported that the Mediterranean diets reduced hs-CRP without weight loss more effectively than the low-fat diet [37]. Similarly, in the current study, most of the participants demonstrated decreases in their hs-CRP levels, although some of them showed slight weight increases. However, this is inconsistent with a 2007 systematic review that concluded that weight loss led to a reduction in CRP regardless of which intervention approach was used [38]. It is important to mention that this review excluded the interventions that did not have weight loss as an objective. Further studies are required to obtain a clear conclusion about the role of the dietary intervention type, especially from protein level and weight loss on CRP levels.

4.3. Glucose

There was no significant reduction in fasting blood glucose for most of the participants. A possible reason for this finding is that most of the participants began this study at a normal level of the fasting blood glucose. Indeed, the beneficial effects of energy restriction interventions are more likely to manifest in individuals with insulin resistance than in healthy individuals [39]. Additionally, the apparent lack of correlation between weight loss and decreasing fasting glucose in our findings could also be attributed to the short study length, which may have been inadequate to show the effects of weight loss on enhancing fasting glucose. Most energy restricting studies that have demonstrated that the capacity to be effective for controlling glucose levels and enhancing metabolic outcomes were conducted over periods of seven weeks or more [40,41,42]. Lim et al., for instance, reported that, after eight weeks of restricted energy intake by type 2 diabetic patients, there was an enhancement in the function of beta cells [43], which has a curvilinear relationship with fasting blood glucose level [44]. Similarly, one large diabetes prevention study with middle-aged overweight women and men with impaired glucose tolerance used intensive lifestyle interventions for eight weeks, including reducing fat consumption to less than 30%, saturated fat intake to no more than 10% of the total energy consumed, and total body weight by at least 5% [45]. The study found that this dietary intervention prevented the progression to diabetes by 58% [45]. Thus, it is probable that a longer study than ours and one with participants with higher baseline glycemic values would be needed to test the effects of protein level on fasting glucose levels while on an IER diet.
In the current study, Case 4 initially had a glucose level that was stable at 8 mg/dL in week one and remained unchanged at the end of week three (during the PRO + diet intervention), although with a slight body weight loss. During the subsequent PRO− diet intervention, though, she lost 5% of her body weight, and her glucose level decreased to 6.8 in the fifth week even though she did not take medication to regulate blood glucose. These findings correspond to evidence suggesting that 5% weight loss in OW/OB individuals induces improved metabolic function and the diminution of metabolic, disease-associated risk factors such as fasting blood glucose [46,47]. Similarly, several studies have revealed that weight loss contributes to a decrease in visceral fat and improves markers of glucose metabolism [13,25,26]. These results match those observed in an earlier study, which concluded that OW/OB people can reduce their risk for diabetes with every kilogram of body fat they lose [48].

4.4. Adherence

The participants in this study completed both phases of the diet without exception, and only one participant withdrew by the end of Phase 1 for reasons unrelated to the study. We therefore assume that our methodology provides the ability to adhere to an energy-restricted diet. The participants reported that they experienced more fullness and satiety on the PRO+ diet than on the PRO− diet. The reason for this may be the role of protein in increasing satiety. Several studies have investigated the association between macronutrients and satiety, with the majority indicating that protein increases satiety and suppresses energy intake more than other macronutrients [20,49], likely because protein contributes to an increase in the release of gastrointestinal appetite hormones, such as PYY, and also increases concentrations of ghrelin [20]. A previously published systematic review recommended a high-protein diet for controlling appetite [50].

4.5. Limitations

There were certain limitations to this study, such as the small sample size. This study included only women who have a BMI between 27 and 33 kg/m2 and were aged 33–55 years in order to increase the homogeneity of the samples. The reason for selecting the age group is that evidence has demonstrated physiological differences in sensory satiety among age groups (i.e., adolescent, middle age, and elderly) [24,25]. Further research is needed to investigate the effects of IER diets on obese men because the clinical trials have shown differences between men and women in appetite sensations and appetite responses to changes in macronutrient content in diets [22,23].

5. Conclusions

This pilot study demonstrated that an IER diet, whether the protein content is low or high, is a feasible strategy for obese women. Most participants lost weight and reduced their waist circumference. Additionally, most of them improved their CRP. Although both PRO+ and PRO− diets reduced CRP levels among the participants, the IER PRO+ diet resulted in greater satiety than did the IER PRO− diet and was preferred by the participants. This suggests that a higher protein content while consuming a IER diet may lead to greater long-term adherence. These positive findings hold promise for potentially similar exciting advances in larger and longer studies that involve an IER high-protein diet. To provide more data, a large study should investigate the effects of intermittent fasting combined with a high-protein diet on satiety, weight loss, and various health indicators, such as blood glucose, lipid profile, and pro-inflammatory markers, in overweight and obese adults.

Author Contributions

Conceptualization, J.M.B. and N.E.A.; methodology, N.E.A. and J.M.B.; formal analysis, N.E.A.; investigation, N.E.A.; resources, J.M.B. and N.E.A.; writing—original draft preparation, N.E.A.; writing—review and editing, J.M.B. and N.E.A.; supervision, J.M.B.; project administration, J.M.B. All authors have read and agreed to the published version of the manuscript.

Funding

This research received no external funding.

Institutional Review Board Statement

The ethical approval for this study was granted by Dalhousie University Research Ethics Board (protocol number 2018-4477 on 19 April 2018).

Informed Consent Statement

All participants signed written informed consent forms for participation, and the Dalhousie University Research Ethics Board approved the study. Written informed consent has been obtained from the participants to publish this paper.

Data Availability Statement

Not applicable.

Conflicts of Interest

The authors declare no conflict of interest.

References

  1. Astrup, A. Carbohydrates as Macronutrients in Relation to Protein and Fat for Body Weight Control. Int. J. Obes. 2006, 30, S4–S9. [Google Scholar] [CrossRef]
  2. Paddon-Jones, D.; Westman, E.; Mattes, R.D.; Wolfe, R.R.; Astrup, A.; Westerterp-Plantenga, M. Protein, Weight Management, and Satiety. Am. J. Clin. Nutr. 2008, 87, 1558S–1561S. [Google Scholar] [CrossRef] [PubMed]
  3. Obesity and Overweight. Available online: https://www.who.int/news-room/fact-sheets/detail/obesity-and-overweight (accessed on 22 May 2021).
  4. NCD Risk Factor Collaboration (NCD-RisC). Trends in Adult Body-Mass Index in 200 Countries from 1975 to 2014: A Pooled Analysis of 1698 Population-Based Measurement Studies with 19·2 Million Participants. Lancet 2016, 387, 1377–1396. [Google Scholar] [CrossRef]
  5. Longo, M.; Zatterale, F.; Naderi, J.; Parrillo, L.; Formisano, P.; Raciti, G.A.; Beguinot, F.; Miele, C. Adipose Tissue Dysfunction as Determinant of Obesity-Associated Metabolic Complications. Int. J. Mol. Sci. 2019, 20, 2358. [Google Scholar] [CrossRef] [PubMed]
  6. Zatterale, F.; Longo, M.; Naderi, J.; Raciti, G.A.; Desiderio, A.; Miele, C.; Beguinot, F. Chronic Adipose Tissue Inflammation Linking Obesity to Insulin Resistance and Type 2 Diabetes. Front. Physiol. 2020, 10, 1607. [Google Scholar] [CrossRef] [PubMed]
  7. Coelho, M.; Oliveira, T.; Fernandes, R. Biochemistry of Adipose Tissue: An Endocrine Organ. Arch. Med. Sci. 2013, 9, 191–200. [Google Scholar] [CrossRef]
  8. Kroeger, C.M.; Klempel, M.C.; Bhutani, S.; Trepanowski, J.F.; Tangney, C.C.; Varady, K.A. Improvement in Coronary Heart Disease Risk Factors during an Intermittent Fasting/Calorie Restriction Regimen: Relationship to Adipokine Modulations. Nutr. Metab. 2012, 9, 98. [Google Scholar] [CrossRef] [PubMed]
  9. Harvie, M.; Wright, C.; Pegington, M.; McMullan, D.; Mitchell, E.; Martin, B.; Cutler, R.G.; Evans, G.; Whiteside, S.; Maudsley, S.; et al. The Effect of Intermittent Energy and Carbohydrate Restriction v. Daily Energy Restriction on Weight Loss and Metabolic Disease Risk Markers in Overweight Women. Br. J. Nutr. 2013, 110, 1534–1547. [Google Scholar] [CrossRef]
  10. Stanek, A.; Brożyna-Tkaczyk, K.; Zolghadri, S.; Cholewka, A.; Myśliński, W. The Role of Intermittent Energy Restriction Diet on Metabolic Profile and Weight Loss among Obese Adults. Nutrients 2022, 14, 1509. [Google Scholar] [CrossRef]
  11. Muñoz-Hernández, L.; Márquez-López, Z.; Mehta, R.; Aguilar-Salinas, C.A. Intermittent Fasting as Part of the Management for T2DM: From Animal Models to Human Clinical Studies. Curr. Diab. Rep. 2020, 20, 13. [Google Scholar] [CrossRef]
  12. Keenan, S.; Cooke, M.B.; Chen, W.S.; Wu, S.; Belski, R. The Effects of Intermittent Fasting and Continuous Energy Restriction with Exercise on Cardiometabolic Biomarkers, Dietary Compliance, and Perceived Hunger and Mood: Secondary Outcomes of a Randomised, Controlled Trial. Nutrients 2022, 14, 3071. [Google Scholar] [CrossRef] [PubMed]
  13. Wang, J.; Wang, F.; Chen, H.; Liu, L.; Zhang, S.; Luo, W.; Wang, G.; Hu, X. Comparison of the Effects of Intermittent Energy Restriction and Continuous Energy Restriction among Adults with Overweight or Obesity: An Overview of Systematic Reviews and Meta-Analyses. Nutrients 2022, 14, 2315. [Google Scholar] [CrossRef] [PubMed]
  14. Wei, X.; Cooper, A.; Lee, I.; Cernoch, C.A.; Huntoon, G.; Hodek, B.; Christian, H.; Chao, A.M. Intermittent Energy Restriction for Weight Loss: A Systematic Review of Cardiometabolic, Inflammatory and Appetite Outcomes. Biol. Res. Nurs. 2022, 24, 410–428. [Google Scholar] [CrossRef] [PubMed]
  15. Tessitore, L.; Chiara, M.; Sesca, E.; Premoselli, F.; Binasco, V.; Dianzani, M.U. Fasting during Promotion, but Not during Initiation, Enhances the Growth of Methylnitrosourea-Induced Mammary Tumours. Carcinogenesis 1997, 18, 1679–1681. [Google Scholar] [CrossRef] [PubMed]
  16. Rosas Fernández, M.; Concha Vilca, C.; Batista, L.O.; Tavares do Carmo, M.d.G.; de Albuquerque, K.T. Intermittent Food Restriction Upregulates Critical Hypothalamic Genes Involved in Energy Regulation Imbalance. Nutrition 2023, 110, 112006. [Google Scholar] [CrossRef]
  17. Gibson, A.A.; Sainsbury, A. Strategies to Improve Adherence to Dietary Weight Loss Interventions in Research and Real-World Settings. Behav. Sci. 2017, 7, E44. [Google Scholar] [CrossRef]
  18. Dombrowski, S.U.; Knittle, K.; Avenell, A.; Araújo-Soares, V.; Sniehotta, F.F. Long Term Maintenance of Weight Loss with Non-Surgical Interventions in Obese Adults: Systematic Review and Meta-Analyses of Randomised Controlled Trials. BMJ 2014, 348, g2646. [Google Scholar] [CrossRef]
  19. Lemstra, M.; Bird, Y.; Nwankwo, C.; Rogers, M.; Moraros, J. Weight Loss Intervention Adherence and Factors Promoting Adherence: A Meta-Analysis. Patient Prefer. Adherence 2016, 10, 1547–1559. [Google Scholar] [CrossRef]
  20. Leidy, H.J.; Clifton, P.M.; Astrup, A.; Wycherley, T.P.; Westerterp-Plantenga, M.S.; Luscombe-Marsh, N.D.; Woods, S.C.; Mattes, R.D. The Role of Protein in Weight Loss and Maintenance. Am. J. Clin. Nutr. 2015, 101, 1320S–1329S. [Google Scholar] [CrossRef]
  21. Jéquier, E. Carbohydrates as a Source of Energy. Am. J. Clin. Nutr. 1994, 59, 682S–685S. [Google Scholar] [CrossRef]
  22. Holdcroft, A. Gender Bias in Research: How Does It Affect Evidence Based Medicine? J. R. Soc. Med. 2007, 100, 2–3. [Google Scholar] [CrossRef] [PubMed]
  23. Westerterp-Plantenga, M.S.; Lejeune, M.P.G.M.; Smeets, A.J.P.G.; Luscombe-Marsh, N.D. Sex Differences in Energy Homeostatis Following a Diet Relatively High in Protein Exchanged with Carbohydrate, Assessed in a Respiration Chamber in Humans. Physiol. Behav. 2009, 97, 414–419. [Google Scholar] [CrossRef]
  24. Bédard, A.; Hudon, A.-M.; Drapeau, V.; Corneau, L.; Dodin, S.; Lemieux, S. Gender Differences in the Appetite Response to a Satiating Diet. J. Obes. 2015, 2015, 140139. [Google Scholar] [CrossRef] [PubMed]
  25. Rolls, B.J.; McDermott, T.M. Effects of Age on Sensory-Specific Satiety. Am. J. Clin. Nutr. 1991, 54, 988–996. [Google Scholar] [CrossRef] [PubMed]
  26. Pilgrim, A.L.; Robinson, S.M.; Sayer, A.A.; Roberts, H.C. An Overview of Appetite Decline in Older People. Nurs. Older People 2015, 27, 29–35. [Google Scholar] [CrossRef]
  27. Kitahara, C.M.; Flint, A.J.; Berrington de Gonzalez, A.; Bernstein, L.; Brotzman, M.; MacInnis, R.J.; Moore, S.C.; Robien, K.; Rosenberg, P.S.; Singh, P.N.; et al. Association between Class III Obesity (BMI of 40–59 Kg/M2) and Mortality: A Pooled Analysis of 20 Prospective Studies. PLoS Med. 2014, 11, e1001673. [Google Scholar] [CrossRef]
  28. Chrysohoou, C.; Panagiotakos, D.B.; Pitsavos, C.; Das, U.N.; Stefanadis, C. Adherence to the Mediterranean Diet Attenuates Inflammation and Coagulation Process in Healthy Adults: The ATTICA Study. J. Am. Coll. Cardiol. 2004, 44, 152–158. [Google Scholar] [CrossRef] [PubMed]
  29. Comparison of Waist Circumference Using the World Health Organization and National Institutes of Health Protocols. Available online: https://www150.statcan.gc.ca/n1/pub/82-003-x/2012003/article/11707-eng.htm (accessed on 16 February 2022).
  30. Nichols, S.D.; Crichlow, H. An Evaluation of the Diagnostic Utility of Anthropometric and Body Composition Cut-off Values in Assessing Elevated Fasting Blood Sugar and Blood Pressure. West Indian Med. J. 2010, 59, 253–258. [Google Scholar]
  31. Witjaksono, F.; Jutamulia, J.; Annisa, N.G.; Prasetya, S.I.; Nurwidya, F. Comparison of Low Calorie High Protein and Low Calorie Standard Protein Diet on Waist Circumference of Adults with Visceral Obesity and Weight Cycling. BMC Res. Notes 2018, 11, 674. [Google Scholar] [CrossRef]
  32. Celis-Morales, C.A.; Petermann, F.; Steell, L.; Anderson, J.; Welsh, P.; Mackay, D.F.; Iliodromiti, S.; Lyall, D.M.; Lean, M.E.; Pell, J.P.; et al. Associations of Dietary Protein Intake with Fat-Free Mass and Grip Strength: A Cross-Sectional Study in 146,816 UK Biobank Participants. Am. J. Epidemiol. 2018, 187, 2405–2414. [Google Scholar] [CrossRef]
  33. Shivappa, N.; Hébert, J.R.; Rietzschel, E.R.; De Buyzere, M.L.; Langlois, M.; Debruyne, E.; Marcos, A.; Huybrechts, I. Associations between Dietary Inflammatory Index and Inflammatory Markers in the Asklepios Study. Br. J. Nutr. 2015, 113, 665–671. [Google Scholar] [CrossRef]
  34. Hart, M.J.; Torres, S.J.; McNaughton, S.A.; Milte, C.M. Dietary Patterns and Associations with Biomarkers of Inflammation in Adults: A Systematic Review of Observational Studies. Nutr. J. 2021, 20, 24. [Google Scholar] [CrossRef]
  35. Rankin, J.W.; Turpyn, A.D. Low Carbohydrate, High Fat Diet Increases c-Reactive Protein during Weight Loss. J. Am. Coll. Nutr. 2007, 26, 163–169. [Google Scholar] [CrossRef]
  36. Pereira, M.; Swain, J.; Goldfine, A.; Rifai, N.; Ludwig, D. Effects of a Low-Glycemic Load Diet on Resting Energy Expenditure and Heart Disease Risk Factors during Weight Loss-PubMed. Available online: https://pubmed.ncbi.nlm.nih.gov/15562127/ (accessed on 1 April 2023).
  37. Brinkworth, G.D.; Noakes, M.; Buckley, J.D.; Keogh, J.B.; Clifton, P.M. Long-Term Effects of a Very-Low-Carbohydrate Weight Loss Diet Compared with an Isocaloric Low-Fat Diet after 12 Mo. Am. J. Clin. Nutr. 2009, 90, 23–32. [Google Scholar] [CrossRef] [PubMed]
  38. Estruch, R.; Martínez-González, M.A.; Corella, D.; Salas-Salvadó, J.; Ruiz-Gutiérrez, V.; Covas, M.I.; Fiol, M.; Gómez-Gracia, E.; López-Sabater, M.C.; Vinyoles, E.; et al. Effects of a Mediterranean-Style Diet on Cardiovascular Risk Factors: A Randomized Trial. Ann. Intern. Med. 2006, 145, 1–11. [Google Scholar] [CrossRef]
  39. Selvin, E.; Paynter, N.P.; Erlinger, T.P. The Effect of Weight Loss on C-Reactive Protein: A Systematic Review. Arch. Intern. Med. 2007, 167, 31–39. [Google Scholar] [CrossRef] [PubMed]
  40. Kusminski, C.M.; Bickel, P.E.; Scherer, P.E. Targeting Adipose Tissue in the Treatment of Obesity-Associated Diabetes. Nat. Rev. Drug Discov. 2016, 15, 639–660. [Google Scholar] [CrossRef]
  41. Harvie, M.N.; Pegington, M.; Mattson, M.P.; Frystyk, J.; Dillon, B.; Evans, G.; Cuzick, J.; Jebb, S.A.; Martin, B.; Cutler, R.G.; et al. The Effects of Intermittent or Continuous Energy Restriction on Weight Loss and Metabolic Disease Risk Markers: A Randomized Trial in Young Overweight Women. Int. J. Obes. 2011, 35, 714–727. [Google Scholar] [CrossRef]
  42. Georg Jensen, M.; Kristensen, M.; Astrup, A. Effect of Alginate Supplementation on Weight Loss in Obese Subjects Completing a 12-Wk Energy-Restricted Diet: A Randomized Controlled Trial. Am. J. Clin. Nutr. 2012, 96, 5–13. [Google Scholar] [CrossRef]
  43. Steven, S.; Taylor, R. Restoring Normoglycaemia by Use of a Very Low Calorie Diet in Long- and Short-Duration Type 2 Diabetes. Diabet. Med. J. Br. Diabet. Assoc. 2015, 32, 1149–1155. [Google Scholar] [CrossRef] [PubMed]
  44. Lim, E.L.; Hollingsworth, K.G.; Aribisala, B.S.; Chen, M.J.; Mathers, J.C.; Taylor, R. Reversal of Type 2 Diabetes: Normalisation of Beta Cell Function in Association with Decreased Pancreas and Liver Triacylglycerol. Diabetologia 2011, 54, 2506–2514. [Google Scholar] [CrossRef] [PubMed]
  45. Ritzel, R.A.; Butler, A.E.; Rizza, R.A.; Veldhuis, J.D.; Butler, P.C. Relationship Between β-Cell Mass and Fasting Blood Glucose Concentration in Humans. Diabetes Care 2006, 29, 717–718. [Google Scholar] [CrossRef] [PubMed]
  46. Tuomilehto, J.; Indstrom, J.; Eriksson, J.G.; Valle, T.T.; Hämäläinen, H.; Ilanne-Parikka, P.; Keinänen-Kiukaanniemi, S.; Laakso, M.; Louheranta, A.; Rastas, M.; et al. Prevention of Type 2 Diabetes Mellitus by Changes in Lifestyle among Subjects with Impaired Glucose Tolerance. N. Engl. J. Med. 2001, 344, 1343–1350. [Google Scholar] [CrossRef]
  47. Magkos, F.; Fraterrigo, G.; Yoshino, J.; Luecking, C.; Kirbach, K.; Kelly, S.C.; de Las Fuentes, L.; He, S.; Okunade, A.L.; Patterson, B.W.; et al. Effects of Moderate and Subsequent Progressive Weight Loss on Metabolic Function and Adipose Tissue Biology in Humans with Obesity. Cell Metab. 2016, 23, 591–601. [Google Scholar] [CrossRef] [PubMed]
  48. Hasegawa, Y.; Nakagami, T.; Oya, J.; Takahashi, K.; Isago, C.; Kurita, M.; Tanaka, Y.; Ito, A.; Kasahara, T.; Uchigata, Y. Body Weight Reduction of 5% Improved Blood Pressure and Lipid Profiles in Obese Men and Blood Glucose in Obese Women: A Four-Year Follow-up Observational Study. Metab. Syndr. Relat. Disord. 2019, 17, 250–258. [Google Scholar] [CrossRef] [PubMed]
  49. Ford, E.S.; Williamson, D.F.; Liu, S. Weight Change and Diabetes Incidence: Findings from a National Cohort of US Adults. Am. J. Epidemiol. 1997, 146, 214–222. [Google Scholar] [CrossRef]
  50. Halton, T.L.; Hu, F.B. The Effects of High Protein Diets on Thermogenesis, Satiety and Weight Loss: A Critical Review. J. Am. Coll. Nutr. 2004, 23, 373–385. [Google Scholar] [CrossRef]
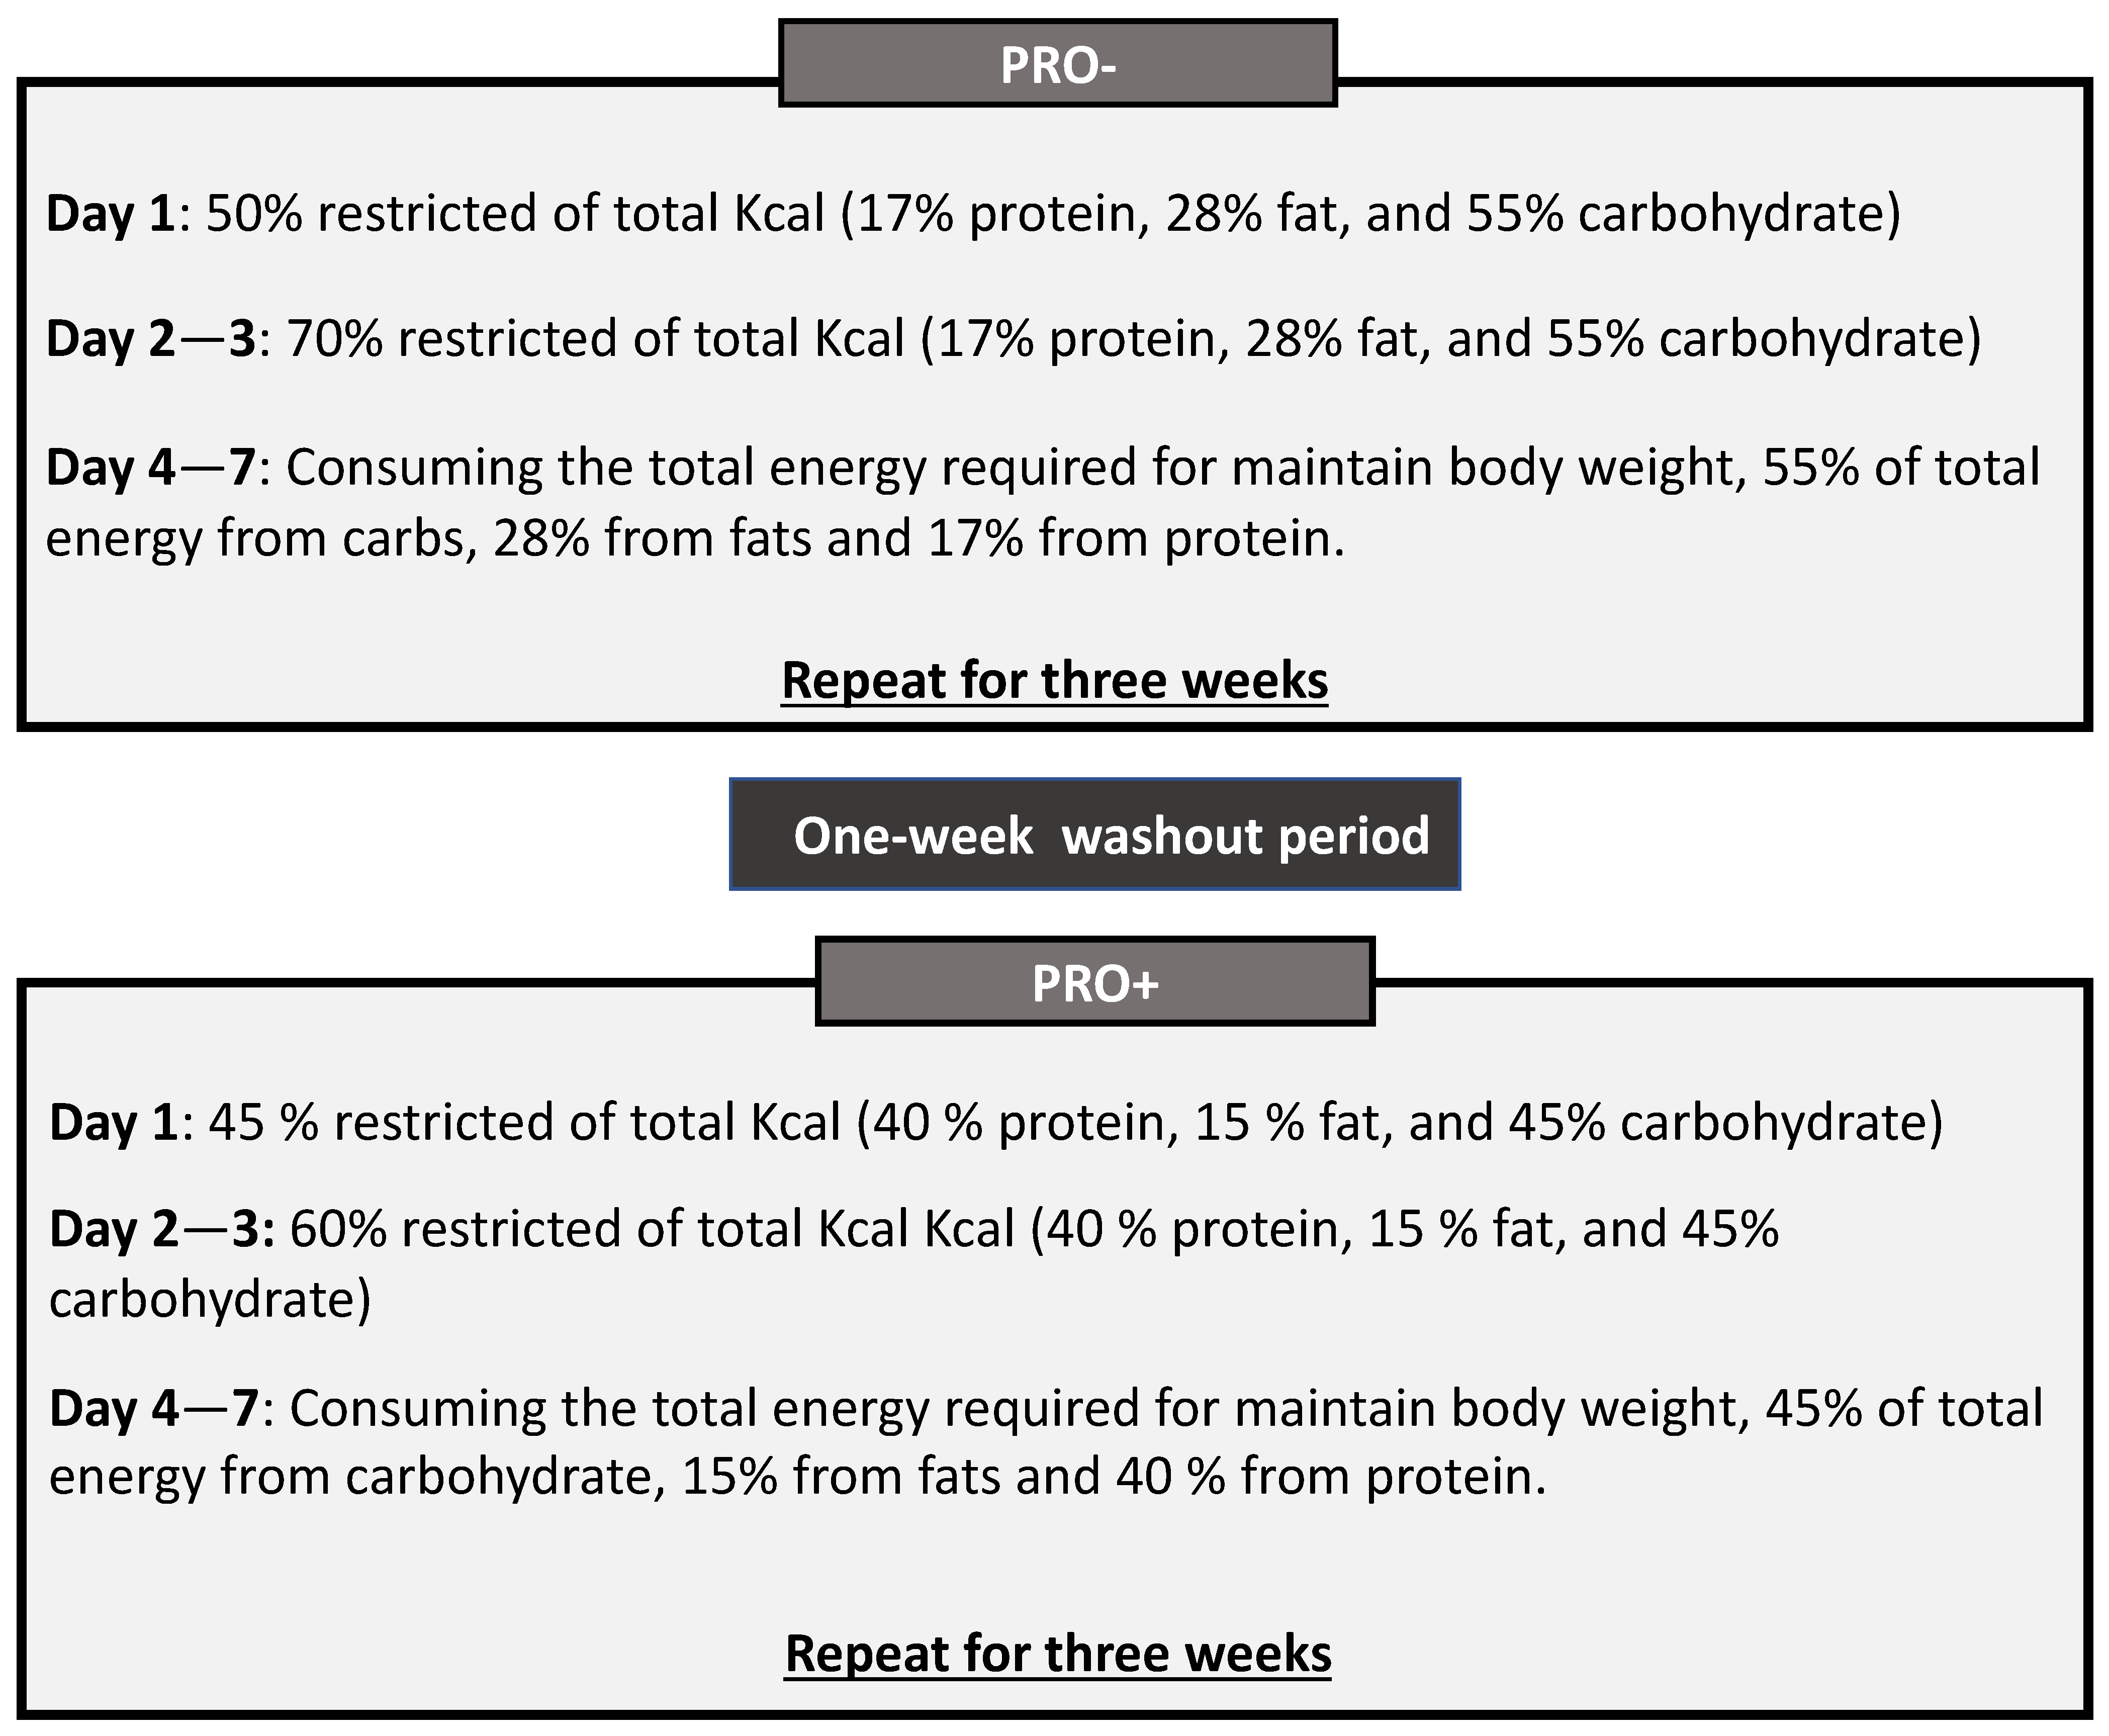
Figure 1. Study design. CHO = carbohydrate; FAT = fat; PRO = protein.
Obesities 03 00015 g001
Figure 2. The categories for hunger, satisfaction, and fullness on the visual analogue scale.
Obesities 03 00015 g002
Figure 3. Body weight changes on three weeks of the PRO+ and PRO− diets.
Obesities 03 00015 g003
Figure 4. Waist circumference changes on three weeks of the PRO+ and PRO− diets.
Obesities 03 00015 g004
Figure 5. Glucose changed after following the dietary interventions.
Obesities 03 00015 g005
Figure 6. Participants’ responses to a visual analog scale questionnaire for comparing the difficulties in adherence to PRO− and PRO+ diets.
Obesities 03 00015 g006
Table 1. Baseline characteristics of study participants.
Participant IDAge
(y)
Body Weight
(kg)
WC
(cm)
BMI
(kg/m2)
Case 14978.29328.9
Case 24779.89129.5
Case 33779.98029.2
Case 45490.010533.9
Case 55171.98429.4
Case 64481.08831.5
Table 2. CRP at baseline and the end of each intervention period.
CRPCRP
Baseline
(PRO−)
Week 3
(PRO−)
Baseline
(PRO+)
End Week 7
(PRO+)
Case 1Negative NegativeNegativeNegative
Case 2ModerateNegativeNegativeNegative
Case 3ModerateNegativeNegativeNegative
Case 4ModerateModerateHighModerate
Case 5NegativeNegativeModerateNegative
Case 6ModerateModerateModerateModerate
Negative: CRP concentration of less than 10 mg/L; moderate inflammation: CRP concentration 10 mg/L or less than 30 mg/L; high inflammation: CRP concentration > 30 mg/L.
Disclaimer/Publisher’s Note: The statements, opinions and data contained in all publications are solely those of the individual author(s) and contributor(s) and not of MDPI and/or the editor(s). MDPI and/or the editor(s) disclaim responsibility for any injury to people or property resulting from any ideas, methods, instructions or products referred to in the content.