Article

Overweight and Obesity Contribute to Inflammation and Reduction in Mean Corpuscular Volume and Mean Corpuscular Hemoglobin in Schoolchildren

by
Bárbara Leles Fernandes
1,
Alexandre Wallace Dias Cozer
2,
Filipe Caldeira Vasconcelos Souza
2,
Luana Dias Santiago
3,
Marlucy Rodrigues Lima
1,
Pauline Martins Leite
4,
Alda Maria Soares Silveira
4,
Barbara Nery Enes
5,
Marcelo Henrique Fernandes Ottoni
1,
Rafael Silva Gama
1 and
Thalisson Artur Ribeiro Gomides
1,*
1
Department of Pharmacy, Vale do Rio Doce University, Governador Valadares 35020-220, MG, Brazil
2
Department of Medicine, Vale do Rio Doce University, Governador Valadares 35020-220, MG, Brazil
3
Medical Clinic, Hospital Santa Marta, Brasília 72025-300, DF, Brazil
4
Department of Immunology, Universidade Federal de Juiz de Fora, Governador Valadares 35020-220, MG, Brazil
5
Department of Nutrition, Vale do Rio Doce University, Governador Valadares 35020-220, MG, Brazil
*
Author to whom correspondence should be addressed.
Obesities 2024, 4(4), 524-534; https://doi.org/10.3390/obesities4040041
Submission received: 16 September 2024 / Revised: 12 November 2024 / Accepted: 5 December 2024 / Published: 13 December 2024

Abstract

:
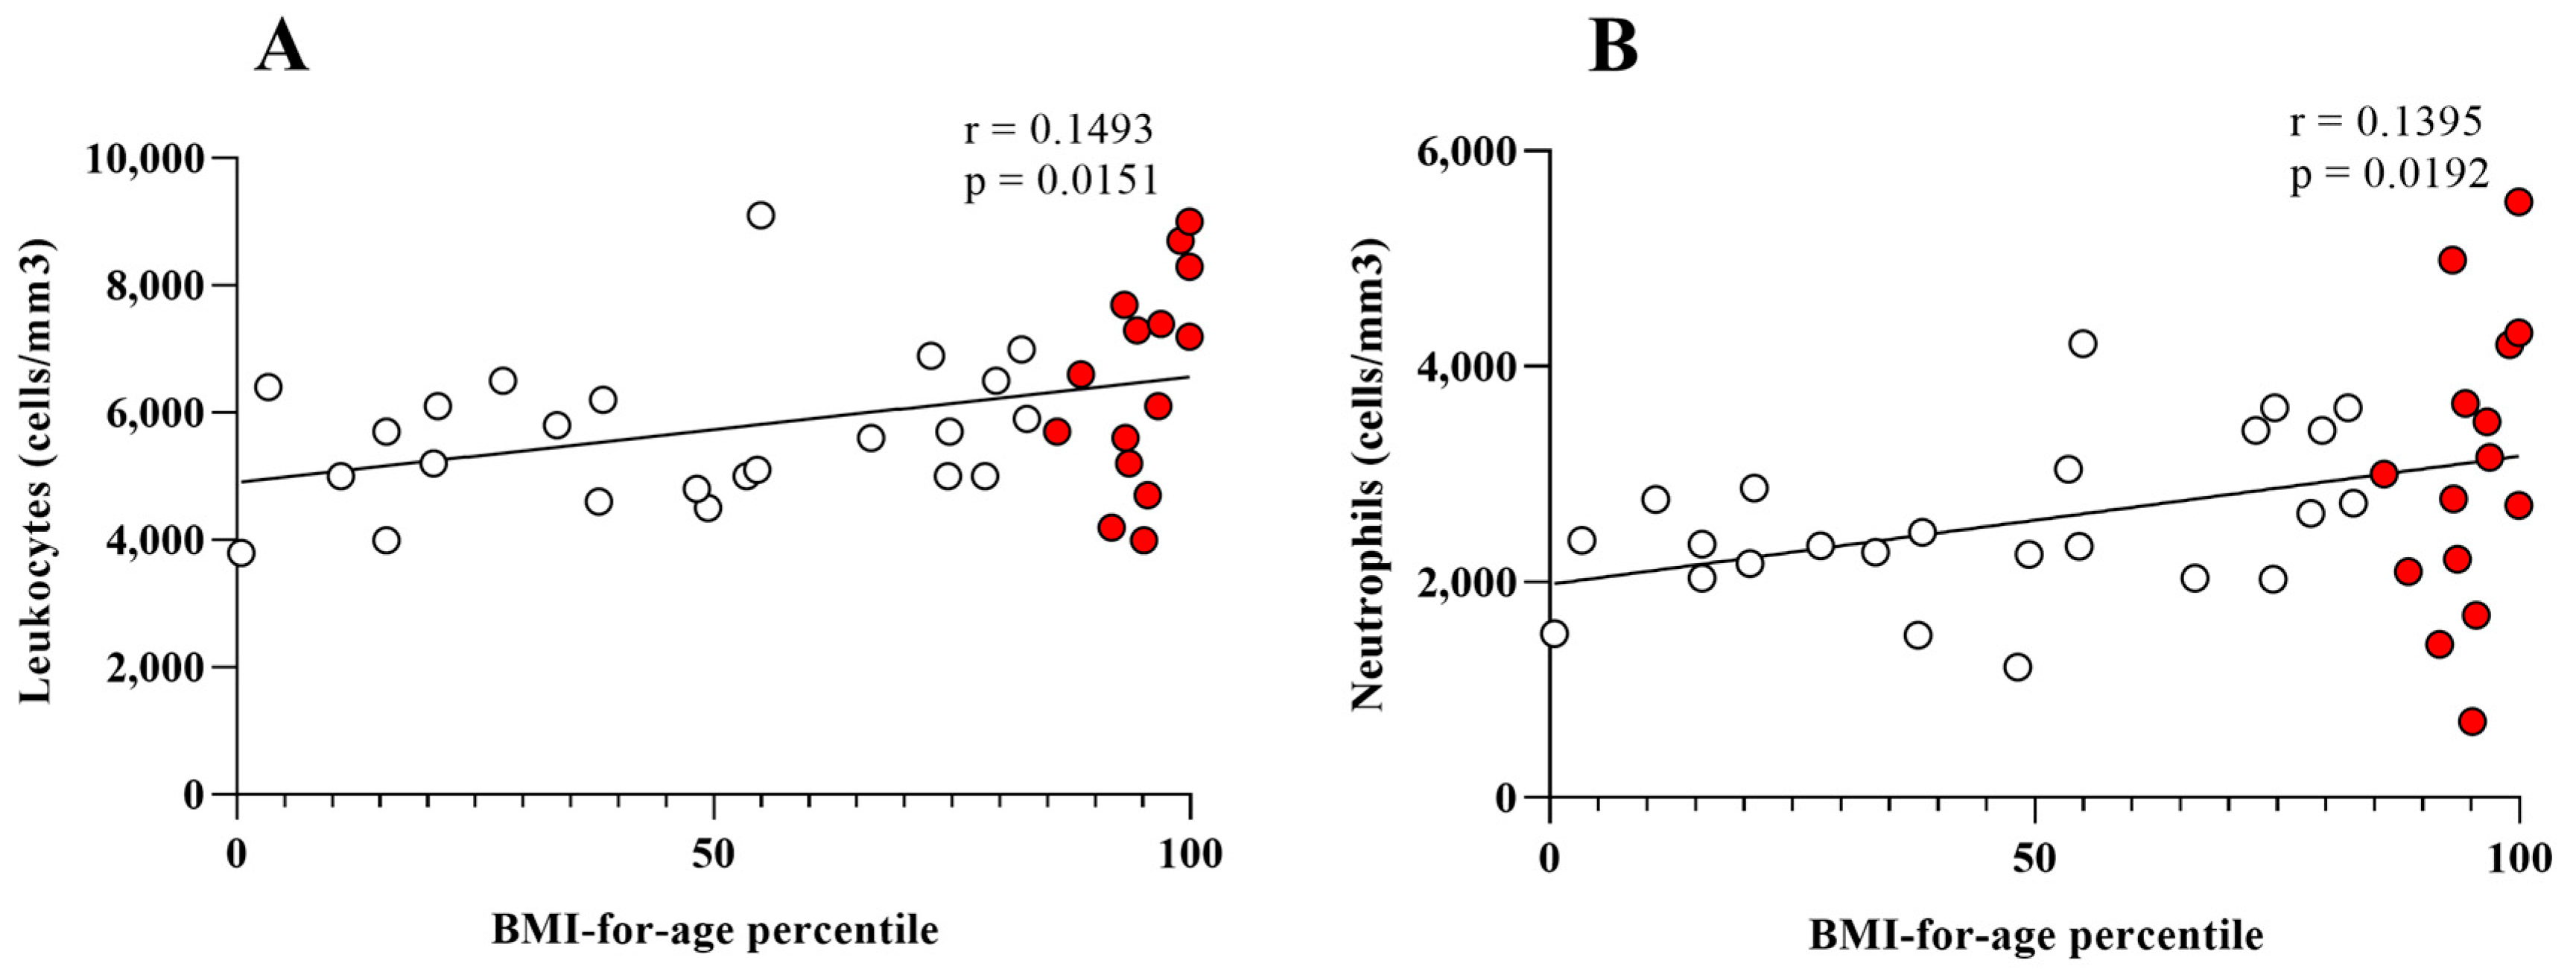
Background: The inflammation associated with overweight and obesity seems to alter iron metabolism, but there are few studies evaluating those conditions in children. Thus, we aimed to evaluate the leukometric, immunological, and hematimetric parameters of overweight and obese schoolchildren. Methods: This is a cross-sectional study in which 39 children living in Chonim de Cima (Brazil) underwent anthropometric, hematological, and immunological assessments. The evaluated parameters were compared between the study group (overweight/obesity, n = 15) and the control group (n = 24). Unpaired t-test, Mann–Whitney test, and linear regression were used for statistical tests, and the panoramic profile was used to illustrate differences between groups. Results: The study group had lower mean corpuscular volume (MCV) and mean corpuscular hemoglobin (MCH) and higher TNF levels compared to the control group. Positive correlations were observed between BMI-for-age percentile and total leukocytes (r = 0.1493; p = 0.0151) or neutrophils (r = 0.1395; p = 0.0192). Negative correlations between the BMI-for-age percentile and MCV (r = 0.1464; p = 0.0162) and MCH (r = 0.1460; p = 0.0164) were found. Furthermore, through the panoramic profile, it was noted that the study group had a higher frequency of individuals with high levels of TNF and lower frequencies of individuals with increased hemoglobin and serum iron. Conclusions: Our data suggest that overweight and obesity contribute to a pro-inflammatory context (leukocytes, neutrophils, and TNF) and MCV and MCH reduction in schoolchildren.

1. Introduction

Obesity in children and adolescents is a global health issue with high prevalence in many high-income countries and increasing prevalence in low- and middle-income countries (LMICs) [1]. The rate of childhood obesity has increased in parallel with adult obesity, resulting in pediatric patients presenting diseases traditionally associated with adulthood, such as dyslipidemia, non-alcoholic fatty liver disease (NAFLD), and type 2 diabetes [2]. Recent studies have evaluated the presence of subclinical inflammation in obesity through different laboratory parameters (leukocytes, lymphocytes, neutrophils, and C-reactive protein) and immunological (interleukin-6 and tumor necrosis factor alpha) [3,4]. The inflammatory state present in obesity promotes the constant infiltration of macrophages in adipose tissue and changes in the production of interleukin 1 and 6 (IL-1, IL-6) and tumor necrosis factor (TNF) [5]. The increase in cytokine release can also be caused by the hypoxic state induced by reduced blood supply to the multiplying adipocytes [6]. Schoolchildren, in addition to being more vulnerable to anemia, may have such risk increased when they are obese, as their inflammatory state modifies iron metabolism, which further increases the chance of anemia associated with chronic diseases [7,8]. Iron levels seem to be improved when the body weight is reduced, and consequently, inflammation is controlled [9]. In this sense, some research groups have proposed that inflammation in obesity could modify the concentrations of hepcidin and ferroportin [10,11,12]. Other studies point to the relationship between obesity and anemia, which may exist either due to insufficient iron intake in the diet or inflammation of adipose cells [13,14,15]. However, some studies have shown controversial results regarding the relationship between anemia and obesity [16,17]. Considering the small number of studies that aim to investigate the hematological consequences of childhood obesity among schoolchildren living in Brazil, in this work, we propose to evaluate the hematimetric and immunological profile of schoolchildren with obesity living in this country.

2. Methods

2.1. Study’s Design and Ethical Aspects

We performed a cross-sectional study of 39 children aged between 7 and 13 years, regularly attending elementary school in Chonim de Cima, Governador Valadares, Brazil, between June 2022 and March 2023. All children, as well as their parents/guardians, selected for this study were invited to sign the Free and Informed Consent Form (FICF) in order to meet the ethical aspects of this research (CAAE: 22348619.2.0000.5157). The exclusion criteria for the present study were being under 7 years old, schoolchildren and/or parents who did not sign FICF or have been absent from any of the research stages (anthropometric assessment, peripheral blood collection). When considering possible hypotheses and the criteria described previously, our study sample was divided according to the nutritional diagnosis established by the Guidelines for Collection and Analysis of Anthropometric Data in Health Services [18]. Thus, participants were organized into two groups according to their percentile values for Body Mass Index percentile by age (BMI-for-age percentile). The study group consisted of 15 children with overweight (BMI-for-age percentile ≥ 85 and < 95) and obesity (BMI-for-age percentile ≥ 95), while the control group consisted of 24 eutrophic schoolchildren (BMI-for-age percentile < 85) [18,19].

2.2. Anthropometric Assessment

Children’s body weight and height measurements were recorded to calculate anthropometric indicators. Body weight was measured using a digital platform scale, with a precision of 100 g, and height was obtained using a portable anthropometer (millimetric scale). During this assessment, all children were dressed in school uniforms and without shoes. Age, height, and weight records were used to calculate BMI and BMI-for-age percentile through the Growth Charts application http://www.slideshare.net/osamaorabi/growth-chart-app (accessed on 24 May 2023). The nutritional diagnosis was performed based on the values obtained in the anthropometric assessment and established by the Guidelines for Collection and Analysis of Anthropometric Data in the Brazilian Ministry of Health [18].

2.3. Hematimetric and Leukocyte Evaluation

Venous blood samples were collected in test tubes containing EDTA anticoagulant for hematological tests. We evaluated serum iron, ferritin, hemoglobin (Hb), hematocrit (Hct), mean corpuscular volume (MCV), mean corpuscular hemoglobin (MCH), mean corpuscular hemoglobin concentration (MCHC), red cell distribution width (RDW), absolute leukocyte counting, and their subpopulations. Those measures were performed using a hematology analyzer (ABX Pentra XL 80, Horiba, London, ON, Canada).

2.4. Cytokine Measurement

Blood samples were collected; serum was separated and used to determine TNF, IFN-γ, and IL-10 concentrations using ELISA assay kits (R&D Systems, Minneapolis, MN, USA). Measurements were made using a Multiskan™ FC Microplate Photometer (Thermo Scientific™, Waltham, MA USA), always following the manufacturer’s recommendations.

2.5. Statistical Analysis

The data were analyzed using GraphPad Prism 8 software (La Jolla, CA, USA). Analyses were made using unpaired t-test for parametric data, Mann–Whitney test for non-parametric data, and linear regression to evaluate possible relationships between variables. The panoramic profile of the evaluated groups was constructed based on the characterization of individuals with lower levels (LL) and higher levels (HL) of cytokines (TNF, IFN-γ, and IL10), serum iron, and hemoglobin. Individuals whose concentration of the evaluated parameters is less than or equal to the global median were classified as LL, while those with a greater concentration were classified as HL. The entire universe of data obtained for the groups was considered to calculate the global median, thus establishing a cutoff point (TNF = 2.1 pg/mL, IFN-γ = 6.1 pg/mL, IL-10 = 15.9 pg/mL, Fe = 92.0 mcg/dL, Hb = 13.0 g/dL). For comparison purposes between groups, the frequencies (%) of individuals with higher levels (HL) for each parameter will be used.

3. Results

Participants were classified according to nutritional assessment, with the study group consisting of 15 children with overweight (BMI-for-age percentile ≥ 85 and <95) or obesity (BMI-for-age percentile ≥ 95), while the control group consisted of 24 eutrophic schoolchildren (BMI-for-age percentile < 85). Characterizations in relation to gender and age, such as parameters like anthropometric, leukometric, immunological, and hematimetric variables, are represented in Table 1. From the analyses performed to compare the parameters identified in each group, it was observed that individuals in the study group presented lower values of Mean Corpuscular Volume (MCV) and Mean Corpuscular Hemoglobin (MCH) (Table 1 and Figure 1). Furthermore, plasma cytokine analysis showed that the study group presented a higher TNF level than the control group (Figure 2).
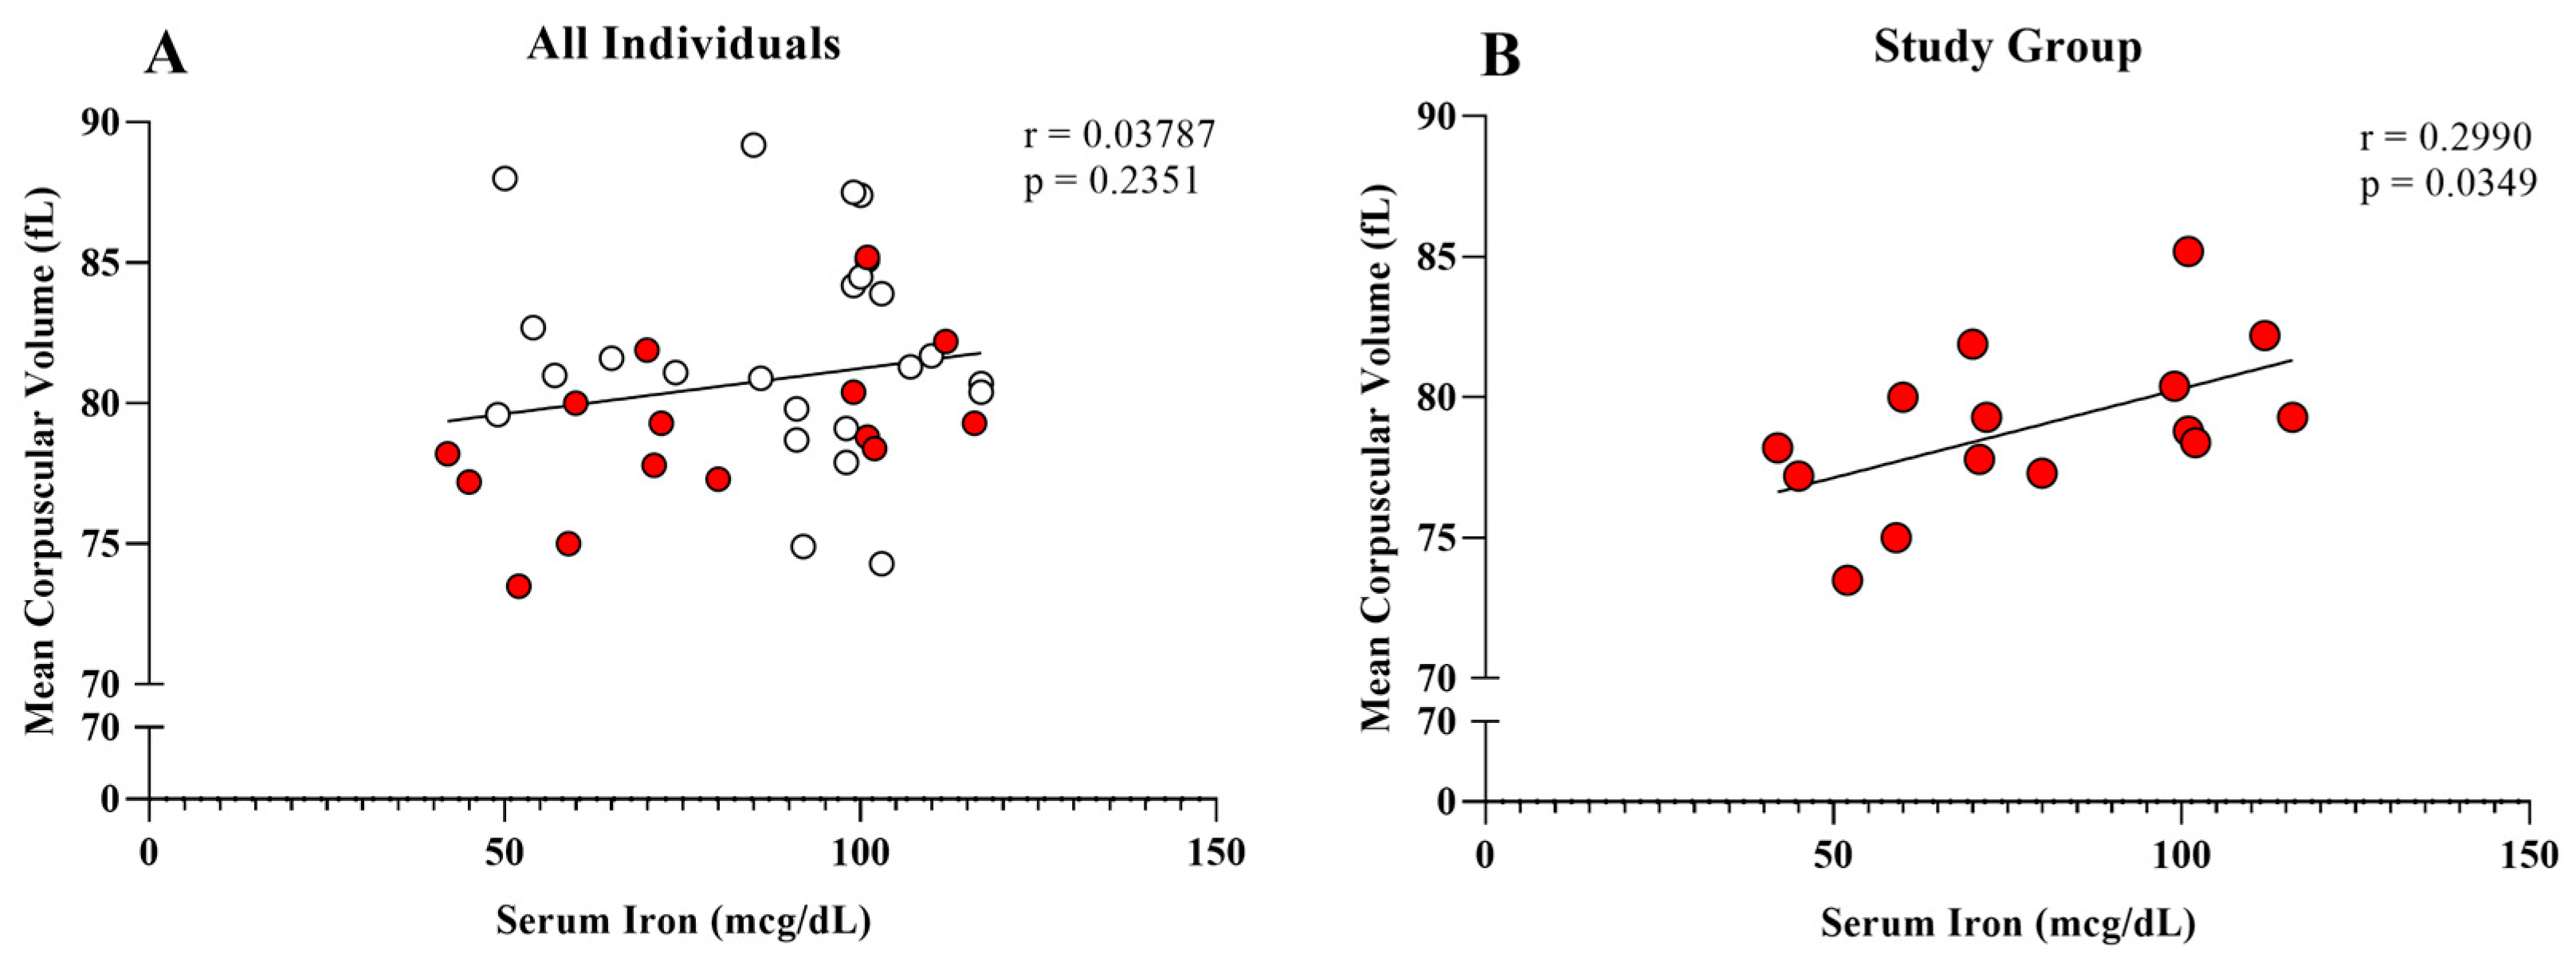
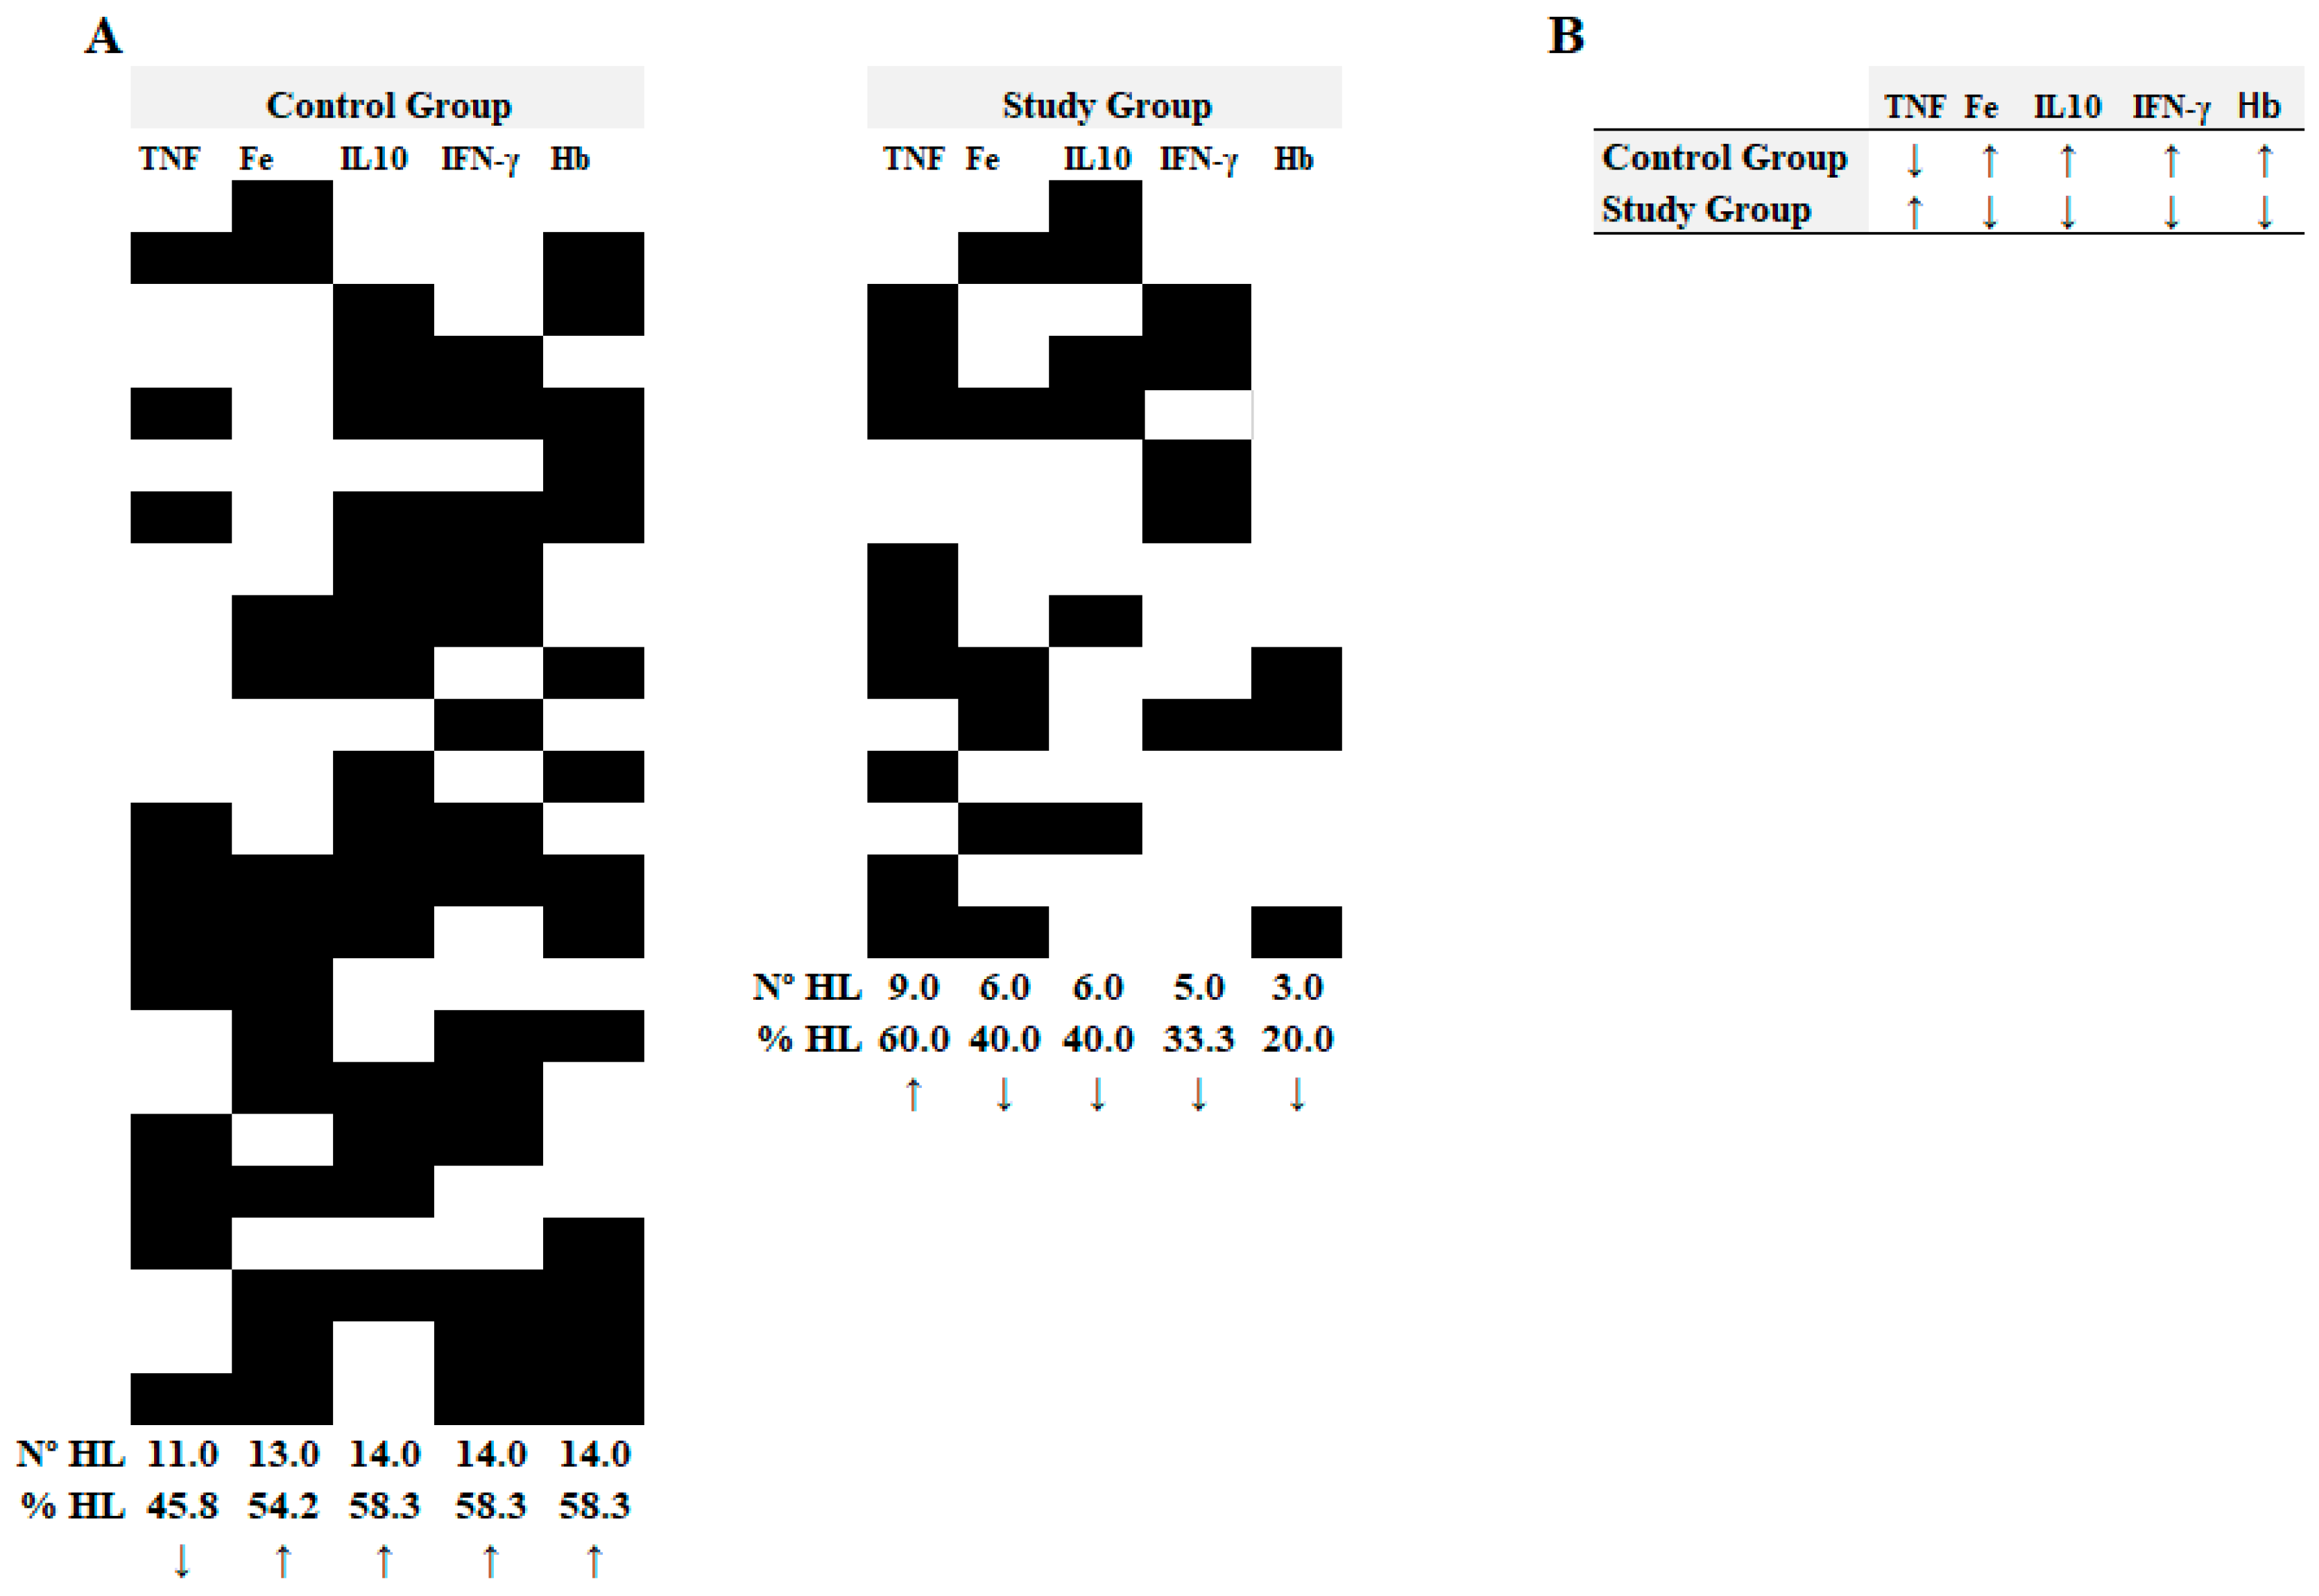
To understand the relationship between the BMI-for-age percentile and hematimetric and leukometric parameters, the values of each variable were subjected to linear regression analysis (Table 2). The analyses showed a positive correlation between the BMI-for-age percentile and the number of total leukocytes (Figure 3A) and neutrophils (Figure 3B). Interestingly, the analyses also showed the existence of a negative correlation between the BMI-for-age percentile and VCM (Figure 4A) and HCM (Figure 4B). Furthermore, the existence of a correlation between serum iron levels and MCV was assessed. Considering all individuals, our analyses showed no correlation (Figure 5A), while when evaluating only the study group, it was possible to observe the existence of a positive correlation (Figure 5B). When evaluating the possible correlation between serum iron and concentrations of TNF, IFN-γ, and IL-10, considering all individuals and grouping into a control group and study group, no statistically significant results were identified. The panoramic profile allowed us to observe that the study group presented a higher frequency of individuals with HL for TNF and a lower frequency of individuals with HL for serum iron, IL-10, IFN-γ, and hemoglobin compared to the profile presented by the control group (Figure 6).

4. Discussion

Childhood obesity is a complex disease considered a silent pandemic of the 21st century since the prevalence of childhood excess body weight is increasing year by year and has a global geographical distribution [20]. This disease is characterized by a mild, chronic, systemic inflammation due to excessive fat accumulation in the adipose tissue, with adipocyte stress [21,22]. Obesity alters the production of hormones (adipokines) and inflammatory mediators (cytokines, chemokines, and lipid mediators) by adipocytes, which influences local and systemic immune responses [23]. Our findings reinforce the inflammatory nature of overweight and obesity, also among schoolchildren, since a positive correlation between BMI-for-age percentile and the number of white blood cells (WBC) and neutrophils (Figure 3), in addition to the higher levels of TNF on plasma (Figure 2) was observed. The positive correlations identified are probably because neutrophils are the first cells of the immune system to reach adipose tissue, which implies the increasing circulating levels of such cells [24]. This fact is highly relevant to childhood obesity since other studies show that the number of neutrophils may be directly proportional to the severity of obesity and may be associated with carotid atherosclerosis, impaired glucose tolerance, and microvascular and macrovascular complications of type II diabetes [24,25,26,27,28,29].
In addition to neutrophils, macrophages may play an important role in obesity through changes in the local production of pro-inflammatory cytokines, such as interleukin 1 and 6 (IL-1, IL-6) and TNFα [5]. Although our results did not show statistically significant results regarding the number of monocytes (Table 1), it was observed that the group of overweight and obese schoolchildren showed greater production of TNF (Figure 2). TNF, along with IL-6 and IL-1, are increased in obese individuals with metabolic problems accompanied by a decrease in adiponectin [30]. Due to the behavior of TNF, this cytokine came to be known as an adipokine, which led to the appreciation of the inflammatory nature of obesity and associated metabolic diseases [31]. Other studies have shown the importance of TNF in obesity and have highlighted the possible relationships of this cytokine with other diseases, like the positive association with the risk of type 2 diabetes in humans [32,33] and with the hepatic inflammation present in hepatocellular carcinoma [34,35].
IFN-γ has been associated with low-grade inflammation in obesity and may be related to both general obesity (determined by BMI) and central obesity (determined by waist-to-hip ratio) [36]. IL-10 may have a regulatory role in childhood obesity [37]. Although our results showed no differences in IFN-γ and IL-10 production between the evaluated groups (Figure 2), the panoramic profile revealed that the study group showed a lower frequency of individuals with HL of IL-10 and IFN-γ (Figure 5). It is not clear why the inflammatory profile of the evaluated children is more related to high TNF and not IFN-γ, but this aspect, as well as the involvement of other inflammatory mediators, should be better investigated.
The relationship between obesity and changes in iron metabolism has been widely discussed [13,38,39]. In this aspect, our results showed that overweight and obesity are associated with changes in hematimetric parameters, with lower MCV and HCM (Figure 1) and a negative correlation between the BMI-for-age percentile and MCV and HCM (Figure 4). Previous studies have demonstrated lower values of MCV, adiponectin, and transferrin saturation in people with obesity, but they did not find significant differences in serum hemoglobin, ferritin, and iron [40]. Furthermore, Bertinato et al., 2014, [41] found that diet-induced obese rats have lower mean concentrations of HCM and iron in the liver.
In order to investigate the clinical importance of MCV analysis, we looked to verify a possible correlation between MCV and serum iron (Figure 5). Our results pointed to a positive correlation between MCV and serum iron in the study group, suggesting that in obese and overweight children, MCV values could indicate important information about serum level deviations. Such correlation was also established elsewhere by correlating MCV parameters and iron deficiency in adults but not infants or children [42].
Changes related to iron metabolism in obesity can be explained by dietary iron deficiency, the greater need for iron due to a greater blood volume, the reduced number of myoglobins in muscle associated with the absence of physical activity, and especially, the greater production of hepcidin [42]. In obesity, hepcidin seems to alter the function of ferroportin in the small intestine, which leads to a reduction in the release of iron into the blood [43]. Furthermore, higher levels of this hormone associated with inflammatory status may increase the risk of developing anemia [44].
Through the analysis of the panoramic profile (Figure 5), a high frequency of individuals with high levels of TNF (60%) and low frequencies of individuals with high levels of iron (40%) and especially Hb (20%) were noted among overweight schoolchildren and children with obesity. Several studies have sought to understand the relationship between chronic inflammatory diseases, including obesity, and changes in iron metabolism [45,46,47]. Such studies highlight that anemia of inflammation or anemia of chronic disease have become the second most common type of anemia after iron deficiency anemia.
Anemia of inflammation has been associated with chronic infections and autoimmune diseases, diseases in which inflammation is easily detectable and sustained [48,49]. In this aspect, TNF seems to act directly in the duodenum, contributing to the reduction in hepcidin-independent duodenal iron absorption [50]. Our results point to an inverse relationship between the production of TNF and the levels of iron and hemoglobin (Figure 5). This can be explained by the acute or chronic immune activation in patients with inflammatory diseases associated with greater production of TNF [51,52,53]. Thereby, Lucendo et al., 2020, [54] presented the first evidence that TNF inhibition can be considered an effective treatment for anemia in patients with inflammatory bowel disease. The literature also reveals the benefits of anti-TNF therapy for improving hemoglobin levels in patients with rheumatoid arthritis [55,56], psoriatic arthritis, ankylosing spondylitis [57], and among children with malaria [58].
In summary, overweight and obesity require special attention among schoolchildren due to the possible consequences generated by low-grade inflammation, especially related to high TNF levels, present in an early stage of life. Furthermore, we reinforce that schoolchildren must be frequently monitored in regard to hematimetric parameters and nutritional health once our data show the association of BMI with the decrease in MCV and MCH. Although no correlation was found between serum iron levels and cytokines in this investigation, we hope to evaluate the relationship between serum iron and inflammatory cytokines in new studies with larger numbers of participants. Schoolchildren’s follow-up will contribute to preventing medium and long-term complications, such as anemia. New studies with a larger number of participants are necessary to consolidate the evidence about the impacts of overweight and obesity on schoolchildren’s health.

Author Contributions

Concept and design, B.L.F., T.A.R.G., B.N.E. and R.S.G.; data analysis and interpretation, B.L.F., A.W.D.C., F.C.V.S., L.D.S. and M.R.L.; experiment conduction, B.L.F., A.W.D.C., F.C.V.S., L.D.S. and M.R.L.; writing this article, B.L.F. and T.A.R.G.; critical revision of this article, R.S.G., P.M.L., A.M.S.S. and M.H.F.O.; final approval of this article, T.A.R.G. and P.M.L.; statistical analysis, B.L.F. and A.M.S.S.; obtained funding, T.A.R.G., B.N.E. and R.S.G.; overall responsibility, T.A.R.G. All authors have read and agreed to the published version of the manuscript.

Funding

This study received financial support from Fundação de Amparo à Pesquisa do Estado de Minas Gerais (FAPEMIG) [State of Minas Gerais Assistance to Research Foundation]—Edital Nº 001/2021—DEMANDA UNIVERSAL APQ-02568-21.

Institutional Review Board Statement

The study was conducted in accordance with the Declaration of Helsinki, and approved by research ethics committee of Vale do Rio Doce University (Certificate of Presentation of Ethical Appreciation 22348619.2.0000.5157, opinion number: 3.790.674”.

Informed Consent Statement

Informed consent was obtained from all subjects involved in the study.

Data Availability Statement

Our group guarantees that the published data is in accordance with the consent provided by the participants and we guarantee that, if requested, we will make all necessary research data available.

Acknowledgments

We thank Universidade Vale do Rio Doce (UNIVALE) for the institutional support.

Conflicts of Interest

The authors declare no conflict of interest.

References

  1. Lobstein, T.; Brinsden, H. Atlas of Childhood Obesity; World Obesity Federation: London, UK, 2019. [Google Scholar]
  2. Skinner, A.C.; Perrin, E.M.; Skelton, J.A. Prevalence of obesity and severe obesity in US children, 1999–2014. Obesity 2016, 24, 1116–1123. [Google Scholar] [PubMed]
  3. Trellakis, S.; Rydleuskaya, A.; Fischer, C.; Canbay, A.; Tagay, S.; Scherag, A.; Bruderek, K.; Schuler, P.J.; Brandau, S. Low adiponectin, high levels of apoptosis and increased peripheral blood neutrophil activity in healthy obese subjects. Obes. Facts 2012, 5, 305–318. [Google Scholar] [PubMed]
  4. Lee, J.L. Cellular and molecular players in adipose tissue inflammation in the development of obesity-induced insulin resistance. Biochim. Biophys. Acta 2014, 1842, 446–462. [Google Scholar] [PubMed]
  5. Schmidt, F.M.; Weschenfelder, J.; Sander, C.; Minkwitz, J.; Thormann, J.; Chittka, T.; Mergl, R.; Kirkby, K.C.; Faßhauer, M.; Stumvoll, M.; et al. Inflammatory cytokines in general and central obesity and modulating effects of physical activity. PLoS ONE 2015, 10, e0121971. [Google Scholar] [CrossRef]
  6. Ellulu, M.S.; Patimah, I.; Khaza’ai, H.; Rahmat, A.; Abed, Y. Obesity and inflammation: The linking mechanism and the complications. Arch. Med. Sci. 2017, 13, 851. [Google Scholar]
  7. Assefa, S.; Mossie, A.; Hamza, L. Prevalence and severity of anemia among school children in Jimma Town, southwest Ethiopia. BMC Hematol. 2014, 14, 3. [Google Scholar]
  8. Ferrucci, L.; Guralnik, J.M.; Woodman, R.C.; Bandinelli, S.; Lauretani, F.; Corsi, A.M.; Chaves, P.H.M.; Ershler, W.B.; Longo, D.L. Proinflammatory state circulating erythropoietin in persons with without anemia. Am. J. Med. 2005, 118, 1288.e11–1288.e19. [Google Scholar] [CrossRef]
  9. Gong, L.; Yuan, F.; Teng, J.; Li, X.; Zheng, S.; Lin, L.; Deng, H.; Ma, G.; Sun, C.; Li, Y. Weight loss, inflammatory markers, and improvements of iron status in overweight and child with obesityren. J. Pediatr. 2014, 164, 795–800.e2. [Google Scholar]
  10. Tussing-Humphreys, L.; Pusatcioglu, C.; Nemeth, E.; Braunschweig, C. Rethinking iron regulation and assessment in iron deficiency, anemia of chronic disease, and obesity: Introducing hepcidin. J. Acad. Nutr. Diet. 2012, 112, 391–400. [Google Scholar]
  11. Aeberli, I.; Hurrell, R.F.; Zimmermann, M.B. Overweight children have higher circulating hepcidin concentrations and lower iron status but have dietary iron intakes and bioavailability comparable with normal weight children. Int. J. Obes. 2009, 33, 1111–1117. [Google Scholar] [CrossRef]
  12. Zimmermann, M.B.; Zeder, C.; Muthayya, S.; Winichagoon, P.; Chaouki, N.; Aeberli, I.; Hurrell, R.F. Adiposity in women and children from transition countries predicts decreased iron absorption, iron deficiency and a reduced response to iron fortification. Int. J. Obes. 2008, 32, 1098–1104. [Google Scholar] [CrossRef] [PubMed]
  13. González-Domínguez, Á.; Visiedo-García, F.M.; Domínguez-Riscart, J.; González-Domínguez, R.; Mateos, R.M.; Lechuga-Sancho, A.M. Iron metabolism in obesity and metabolic syndrome. Int. J. Mol. Sci. 2020, 21, 5529. [Google Scholar] [CrossRef] [PubMed]
  14. Paramastri, R.; Hsu, C.Y.; Lee, H.A.; Lin, L.Y.; Kurniawan, A.L.; Chao, J.C.F. Association between dietary pattern, lifestyle, anthropometric status, and anemia-related biomarkers among adults: A population-based study from 2001 to 2015. Int. J. Environ. Res. Public Health 2021, 18, 3438. [Google Scholar] [CrossRef] [PubMed]
  15. Panichsillaphakit, E.; Suteerojntrakool, O.; Pancharoen, C.; Nuchprayoon, I.; Chomtho, S. The Association between Hepcidin Iron Status in Children Adolescents with Obesity. J. Nutr. Metab. 2021, 2021, 9944035. [Google Scholar] [CrossRef]
  16. Wu, J.; Hu, Y.; Li, M.; Chen, J.; Mao, D.; Li, W.; Wang, R.; Yang, Y.; Piao, J.; Yang, L.; et al. Prevalence of anemia in Chinese children and adolescents and its associated factors. Int. J. Environ. Res. Public Health 2019, 16, 1416. [Google Scholar] [CrossRef]
  17. Kamruzzaman, M. Is BMI associated with anemia and hemoglobin level of women and children in Bangladesh: A study with multiple statistical approaches. PLoS ONE 2021, 16, e0259116. [Google Scholar] [CrossRef]
  18. Brasil, Ministério da Saúde, Secretaria de Atenção à Saúde, Departamento de Atenção Básica. Orientações para a Coleta e Análise de Dados Antropométricos em Serviços de Saúde: Norma Técnica do Sistema de Vigilância Alimentar e Nutricional; Il.—(Série G. Estatística e Informação em Saúde); SISVAN/Ministério da Saúde, Secretaria de Atenção à Saúde, Departamento de Atenção Básica, Ministério da Saúde: Brasília, Brazil, 2011; 76p, ISBN 978-85-334-1813-4.
  19. Mantzouranis, N.; Pilianidis, T.; Douda, H.; Tokmakidis, S. Comparison of international obesity taskforce cutoffs, centers for disease control and prevention growth charts, and body mass index Z-score values in the prevalence of childhood obesity: The Greek obesity and lifestyle study. Pediatrics 2008, 121, S149. [Google Scholar] [CrossRef]
  20. Di Cesare, M.; Sori´c, M.; Bovet, P.; Miranda, J.J.; Bhutta, Z.; Stevens, G.A.; Laxmaiah, A.; Kengne, A.P.; Bentham, J. The epidemiological burden of obesity in childhood: A worldwide epidemic requiring urgent action. BMC Med. 2019, 17, 212. [Google Scholar] [CrossRef]
  21. Gregor, M.F.; Hotamisligil, G.S. Inflammatory mechanisms in obesity. Annu. Rev. Immunol. 2011, 29, 415–445. [Google Scholar] [CrossRef]
  22. Ghaben, A.L.; Scherer, P.E. Adipogenesis and metabolic health. Nat. Rev. Mol. Cell Biol. 2019, 20, 242–258. [Google Scholar] [CrossRef]
  23. Weinstock, A.; Moura Silva, H.; Moore, K.J.; Schmidt, A.M. Leukocyte heterogeneity in adipose tissue, including in obesity. Circ. Res. 2020, 126, 1590–1612. [Google Scholar] [CrossRef] [PubMed]
  24. Uribe-Querol, E.; Rosales, C. Neutrophils Actively Contribute to Obesity-Associated Inflammation and Pathological Complications. Cells 2022, 11, 1883. [Google Scholar] [CrossRef] [PubMed]
  25. Herishanu, Y.; Rogowski, O.; Polliack, A.; Marilus, R. Leukocytosis in obese individuals: Possible link in patients with unexplained persistent neutrophilia. Eur. J. Haematol. 2006, 76, 516–520. [Google Scholar] [CrossRef] [PubMed]
  26. Weir, A.B.; Lewis, J.B.; Arteta-Bulos, R. Chronic idiopathic neutrophilia: Experience and recommendations. South. Med. J. 2011, 104, 99–504. [Google Scholar] [CrossRef]
  27. Kim, J.A.; Park, H.S. White blood cell count and abdominal fat distribution in female obese adolescents. Metabolism 2008, 57, 1375–1379. [Google Scholar] [CrossRef]
  28. Dixon, J.B.; O’Brien, P.E. Obesity and the white blood cell count: Changes with sustained weight loss. Obes. Surg. 2006, 16, 251–257. [Google Scholar] [CrossRef]
  29. Ohshita, K.; Yamane, K.; Hanafusa, M.; Mori, H.; Mito, K.; Okubo, M.; Hara, H.; Kohno, N. Elevated White Blood Cell Count in Subjects with Impaired Glucose Tolerance. Diabetes Care 2004, 27, 491–496. [Google Scholar] [CrossRef]
  30. Navarro, E.; Funtikova, A.N.; Fíto, M.; Schröder, H. Can metabolically healthy obesity be explained by diet, genetics, and inflammation? Mol. Nutr. Food Res. 2015, 59, 75–93. [Google Scholar] [CrossRef]
  31. Sethi, J.K.; Gökhan, S.H. Metabolic messengers: Tumour necrosis factor. Nat. Metab. 2021, 3, 1302–1312. [Google Scholar] [CrossRef]
  32. Lasselin, J.; Magne, E.; Beau, C.; Ledaguenel, P.; Dexpert, S.; Aubert, A.; Layé, S.; Capuron, L. Adipose inflammation in obesity: Relationship with circulating levels of inflammatory markers and association with surgery-induced weight loss. J. Clin. Endocrinol. Metab. 2014, 99, E53–E61. [Google Scholar] [CrossRef]
  33. Liu, C.; Feng, X.; Li, Q.; Wang, Y.; Li, Q.; Hua, M. Adiponectin, TNF-α and inflammatory cytokines and risk of type 2 diabetes: A systematic review and meta-analysis. Cytokine 2016, 86, 100–109. [Google Scholar] [CrossRef] [PubMed]
  34. Park, E.J.; Lee, J.H.; Yu, G.Y.; He, G.; Ali, S.R.; Holzer, R.G.; Österreicher, C.H.; Takahashi, H.; Karin, M. Dietary and genetic obesity promote liver inflammation and tumorigenesis by enhancing IL-6 and TNF expression. Cell 2010, 140, 197–208. [Google Scholar] [CrossRef] [PubMed]
  35. Nakagawa, H.; Umemura, A.; Taniguchi, K.; Font-Burgada, J.; Dhar, D.; Ogata, H.; Zhong, Z.; Valasek, M.A.; Seki, E.; Hidalgo, J.; et al. ER stress cooperates with hypernutrition to trigger TNF-dependent spontaneous HCC development. Cancer Cell 2014, 26, 331–343. [Google Scholar] [CrossRef] [PubMed]
  36. Rocha, V.Z.; Folco, E.J.; Sukhova, G.; Shimizu, K.; Gotsman, I.; Vernon, A.H.; Libby, P. Interferon-gama, uma citocina Th1, regula a inflamação da gordura: Um papel para a imunidade adaptativa na obesidade. Circ. Res. 2008, 103, 467–476. [Google Scholar] [CrossRef]
  37. Cheng, S.B.; Sharma, S. Interleukin-10: A pleiotropic regulator in pregnancy. Am. J. Reprod. Immunol. 2015, 73, 487–500. [Google Scholar] [CrossRef]
  38. Kim, S.L.; Shin, S.; Yang, S.J. Iron Homeostasis and Energy Metabolism in Obesity. Clin. Nutr. Res. 2022, 11, 316–330. [Google Scholar] [CrossRef] [PubMed] [PubMed Central]
  39. Qiu, F.; Wu, L.; Yang, G.; Zhang, C.; Liu, X.; Sun, X.; Chen, X.; Wang, N. The role of iron metabolism in chronic diseases related to obesity. Mol. Med. 2022, 28, 130. [Google Scholar] [CrossRef] [PubMed] [PubMed Central]
  40. Sal, E.; Yenicesu, I.; Celik, N.; Pasaoglu, H.; Celik, B.; Pasaoglu, O.T.; Kaya, Z.; Kocak, U.; Camurdan, O.; Bideci, A.; et al. Relationship between obesity and iron deficiency anemia: Is there a role of hepcidin? Hematology 2018, 23, 542–548. [Google Scholar] [CrossRef]
  41. Bertinato, J.; Aroche, C.; Plouffe, L.J.; Lee, M.; Murtaza, Z.; Kenney, L.; Lavergne, C.; Aziz, A. Diet-induced obese rats have higher iron requirements are more vulnerable to iron deficiency. Eur. J. Nutr. 2014, 53, 885–895.55. [Google Scholar] [CrossRef]
  42. Coimbra, S.; Catarino, C.; Santos-Silva, A. The role of adipocytes in the modulation of iron metabolism in obesity. Obes. Rev. 2013, 14, 771–779. [Google Scholar] [CrossRef] [PubMed]
  43. Bryant, B.J.; Hopkins, J.A.; Arceo, S.M.; Leitman, S.F. Evaluation of low red blood cell mean corpuscular volume in an apheresis donor population. Transfusion 2009, 49, 1971–1976. [Google Scholar] [CrossRef] [PubMed]
  44. Nemeth, E.; Ganz, T. The role of hepcidin in iron metabolism. Acta Haematol. 2009, 122, 78–86. [Google Scholar] [CrossRef] [PubMed] [PubMed Central]
  45. Becker, C.; Orozco, M.; Solomons, N.W.; Schümann, K. Iron metabolism in obesity: How interaction between homoeostatic mechanisms can interfere with their original purpose. Part I: Underlying homoeostatic mechanisms of energy storage and iron metabolisms and their interaction. J. Trace Elem. Med. Biol. 2015, 30, 195–201. [Google Scholar] [CrossRef] [PubMed]
  46. Kassebaum, N.J.; Jasrasaria, R.; Naghavi, M.; Wulf, S.K.; Johns, N.; Lozano, R.; Regan, M.; Weatherall, D.; Chou, D.P.; Eisele, T.P.; et al. A systematic analysis of global anemia burden from 1990 to 2010. Blood 2014, 123, 615–624. [Google Scholar] [CrossRef]
  47. Verma, S.; Cherayil, B.J. Iron and inflammation the gut reaction. Metallomics 2017, 9, 101–111. [Google Scholar] [CrossRef]
  48. Weiss, G.; Ganz, T.; Goodnough, L.T. Anemia of inflammation. Blood 2019, 133, 40–50. [Google Scholar] [CrossRef]
  49. Weiss, G.; Schett, G. Anaemia in inflammatory rheumatic diseases. Nat. Rev. Rheumatol. 2013, 9, 205–215. [Google Scholar] [CrossRef]
  50. Maccio, A.; Madeddu, C.; Gramignano, G.; Mulas, C.; Tanca, L.; Cherchi, M.C.; Floris, C.; Omoto, I.; Barracca, A.; Ganz, T. The role of inflammation, iron, and nutritional status in cancer-related anemia: Results of a large, prospective, observational study. Haematologica 2015, 100, 124–132. [Google Scholar] [CrossRef]
  51. Atkinson, M.A.; Leonard, M.B.; Herskovitz, R.; Baldassano, R.N.; Denburg, M.R. Changes in Hepcidin and hemoglobin after Anti-TNF-alpha therapy in children and adolescents with Crohn disease. J. Pediatr. Gastroenterol. Nutr. 2018, 66, 90–94. [Google Scholar] [CrossRef]
  52. Weiss, G.; Goodnough, L.T. Anemia of chronic disease. N. Engl. J. Med. 2005, 352, 1011–1023. [Google Scholar] [CrossRef]
  53. Capocasale, R.J.; Makropoulos, D.A.; Achuthanandam, R.; Stowell, N.; Quinn, J.; Rafferty, P.A.; O’Brien, J.; Emmell, E.; Bugelski, P.J. Myelodysplasia and anemia of chronic disease in human tumor necrosis factor-alpha transgenic mice. Cytom. A 2008, 73, 148–159. [Google Scholar] [CrossRef] [PubMed]
  54. Murawska, N.; Fabisiak, A.; Fichna, J. Anemia of chronic disease and Iron defi ciency Anemia in inflammatory bowel diseases: Pathophysiology, diagnosis, and treatment. Inflamm. Bowel Dis. 2016, 22, 1198–1208. [Google Scholar] [CrossRef] [PubMed]
  55. Lucendo, A.J.; Roncero, Ó.; Serrano-Duenas, M.T.; Hervías, D.; Alcázar, L.M.; Ruiz-Poncea, M.; Cristina Verdejo, C.; Laserna-Mendieta, E.; Lorentee, R.; Arias, A. Effects of anti–TNF-alpha therapy on hemoglobin levels and anemia in patients with inflammatory bowel disease. Dig. Liver Dis. 2020, 52, 400–407. [Google Scholar] [CrossRef] [PubMed]
  56. Papadaki, H.A.; Kritikos, H.D.; Valatas, V.; Boumpas, D.T.; Eliopoulos, G.D. Anemia of chronic disease in rheuma toid arthritis is associated with increased apoptosis of bone marrow erythroid cells: Improvement following anti-tumor necrosis factor-alpha antibody ther apy. Blood 2002, 100, 474–482. [Google Scholar] [CrossRef] [PubMed]
  57. Doyle, M.K.; Rahman, M.U.; Han, C.; Han, J.; Giles, J.O.; Bingham, C.O.; Bathon, J. Treatment with infliximab plus methotrex ate improves anemia in patients with rheumatoid arthritis independent of improvement in other clinical outcome measures-a pooled analysis from three large, multicenter, double-blind, randomized clinical trials. Semin. Arthritis Rheum. 2009, 39, 123–131. [Google Scholar] [CrossRef]
  58. Furst, D.E.; Kay, J.; Wasko, M.C.; Keystone, E.; Kavanaugh, A.; Deodhar, A.; Murphy, F.T.; Magnus, J.H.; Hsia, E.C.; Hsu, B. The effect of golimumab on haemoglobin levels in patients with rheumatoid arthritis, psoriatic arthritis or ankylosing spondylitis. Rheumatology 2013, 52, 1845–1855. [Google Scholar] [CrossRef]
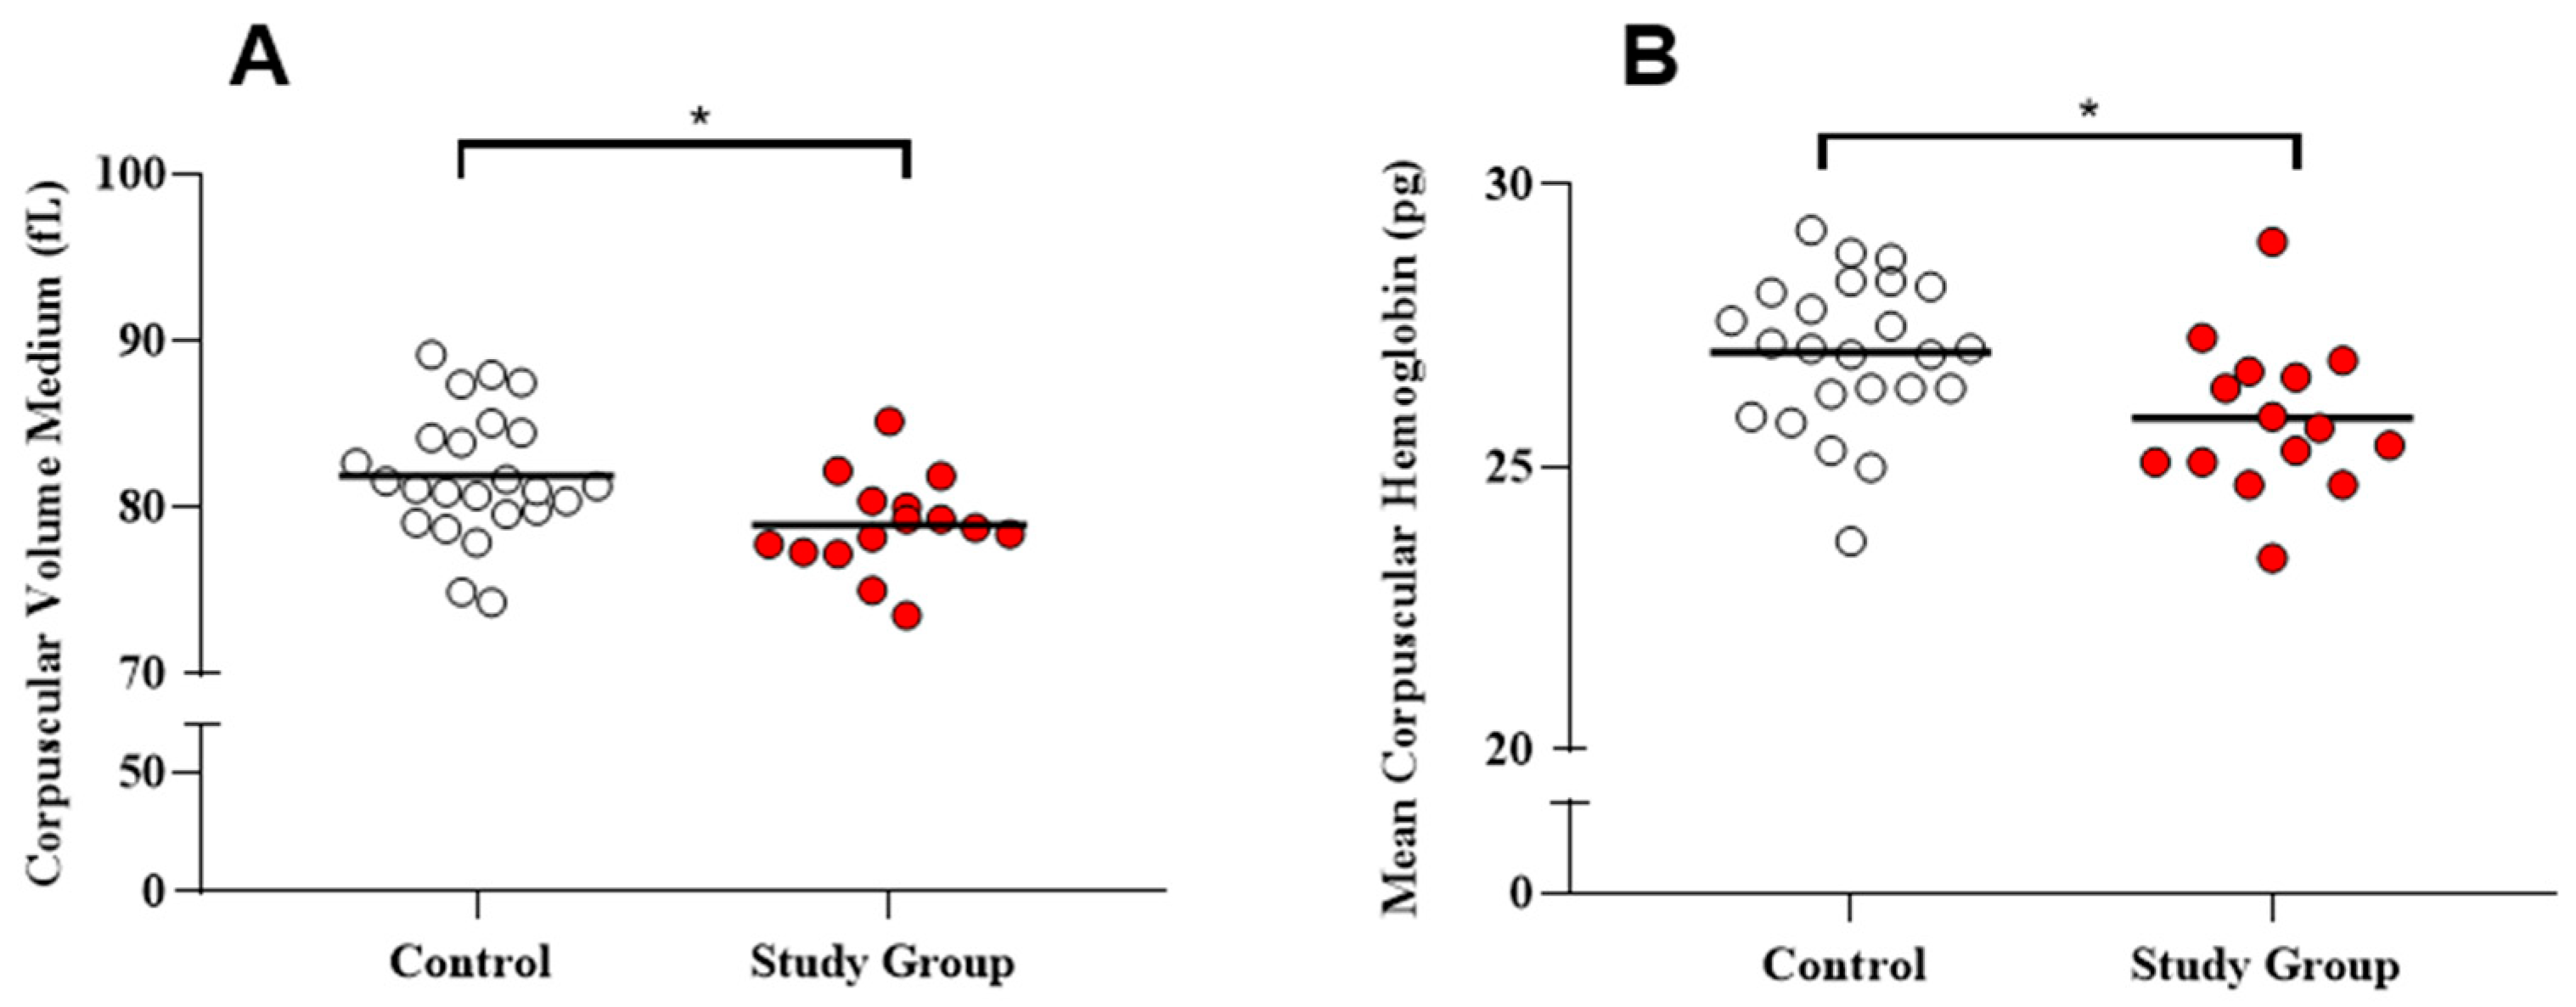
Figure 1. The study group presents differences in hematimetric indices compared to the control group. The study group (overweight and obese) has lower Mean Corpuscular Volume (A) and lower Mean Corpuscular Hemoglobin (B) compared to the control group. The differences between the groups (A,B) were considered statistically significant if p < 0.05 (Unpaired t-test). * Statistically significant differences.
Obesities 04 00041 g001
Figure 2. Comparison of serum levels of TNF, IFN-γ, and IL-10 between the control group and the study group (overweight and obese). Serum TNF levels are higher in schoolchildren in the study group (overweight and obese) compared to the control group (A). There were no statistically significant differences between serum levels of IFN-γ and IL-10 between the groups evaluated (B,C). The Mann–Whitney test was used for the statistical evaluation. * Values of p < 0.05 were considered significant.
Obesities 04 00041 g002
Figure 3. Positive correlation between BMI-for-age percentile and leukocytes in schoolchildren. (A) Positive correlation between BMI-for-age percentile and total leukocytes in schoolchildren. (B) Positive correlation between BMI-for-age percentile and neutrophils in schoolchildren. White circles represent individuals in the control group, and red circles represent individuals in the study group (overweight and obese). p-values < 0.05 indicate a statistically significant correlation (linear regression).
Obesities 04 00041 g003
Figure 4. Negative correlation between BMI-for-age and hematimetric parameters. Negative correlation between BMI-for-age percentile and Mean Corpuscular Volume (A) and Mean Corpuscular Hemoglobin (B) in schoolchildren. White circles represent individuals in the control group, and red circles represent individuals in the study group (overweight and obese). The correlations (A,B) were statistically significant if p < 0.05 (linear regression).
Obesities 04 00041 g004
Figure 5. Analysis of the correlation between serum iron and mean corpuscular volume (MCV). Peripheral blood was collected from all study participants for analysis. Eutrophic (control) (white circles) and overweight and obese (study group) (red circles) schoolchildren were analyzed. Serum iron and mean corpuscular volume were counted using routine biochemical reactions and hematologic cell counters, respectively. The correlation between serum iron and MCV was then calculated using linear regression. (A) No correlation between MCV and Serum Iron among all individuals evaluated. (B) Positive Correlation between MCV and Serum Iron in the study group (overweight and obese). A significant correlation was considered when p < 0.05.
Obesities 04 00041 g005
Figure 6. Panoramic profile of immune and hematologic characteristics of the control group and the study group. (A) Matrix for individuals with low levels—LL (white boxes) and high levels—HL (black boxes) of the evaluated parameters (TNF, Fe, IL-10, IFN-γ, and Hb). Below each matrix (control group and study group), the number of HL (Nº HL) and frequency of HL (% HL) individuals are observed (black boxes). (B) On the side, you can see a table of arrows for comparing the profiles presented by the groups, where the upward arrow (↑) indicates that the frequency of HL is greater than 50%, and the downward arrow (↓) indicates that the frequency of HL is less than 50%.
Obesities 04 00041 g006
Table 1. Anthropometric and hematologic parameters presented by the study and control groups.
ParametersStudy Group (n = 15)
Mean ± SD (Median)
Control Group (n = 24)
Mean ± SD (Median)
p Value
Age (years)10.13 ± 2.59 (10.00)9.25 ± 2.42 (9.00)0.2869
Weight (kg)47.24 ± 18.40 (41.30)30.54 ± 10.41(27.80)* 0.0009
Height (cm)140.60 ± 13.48 (136.00)133.40 ± 12.45 (132.80)0.1084
BMI/age percentile94.90 ± 4.10 (95.16)45.77 ± 26.94 (48.84)* <0.0001
Iron (mcg/dL)78.80 ± 24.73 (72.00)89.42 ± 20.52 (98.00)0.1548
Ferritin (ng/mL)51.55 ± 27.46 (49.00)55.74 ± 30.38 (50.60)0.6670
Hemoglobin (g/dL)12.77 ± 1.03 (12.80)13.01 ± 0.91 (13.10)0.4540
Hematocrit (%)38.97 ± 2.82 (12.80)39.4 ± 2.67 (39.55)0.6354
Mean Corpuscular Volume (fL)78.97 ± 2.87 (78.80)81.90 ± 3.82 (81.20)* 0.0099
Mean Corpuscular Hemoglobin (Pg)25.88 ± 1.34 (25.70)27.05 ± 1.32 (27.10)* 0.0125
Mean Corpuscular Hemoglobin Concentration (%)32.78 ± 0.66 (32.70)33.29 ± 1.30 (33.30)0.1671
Red Cell Distribution Width (%)12.69 ± 1.34 (12.60)12.61 ± 1.70 (11.85)0.8766
Total leukocytes (cells/mm3)6513.00 ± 1599.00 (6600.00)5642.00 ± 1130.00 (5650.00)0.0784
Eosinophils (cells/mm3)445.20 ± 281.30 (405.00)333.80 ± 231.00 (313.80)0.1862
Neutrophils (cells/mm3)3064.00 ± 1341.00 (3004.00)2552.00 ± 726.80 (2371.00)0.1896
Lymphocytes (cells/mm3)2662.00 ± 678.90 (2406.00)2428.00 ± 629.20 (2423.00)0.2905
Monocytes (cells/mm3)338.20 ± 114.10 (308.00)304.30 ± 104.30 (283.10)0.3469
TNF (Pg/mL)8.13 ± 10.82 (4.44)2.47 ± 1.73 (1.95)** 0.0429
IFN-Ƴ (Pg/mL)15.63 ± 33.01 (5.29)11.39 ± 23.23 (6.62)0.3950
IL-10 (Pg/mL)14.75 ± 12.98 (12.46)20.16 ± 13.22 (19.48)0.1402
* p < 0.05; ** p < 0.001.
Table 2. Correlations of hematimetric or leukometric parameters with BMI-for-age.
ParametersPercentile
r Coefficient95% Confidence Interval (CI)p-Value
Mean Corpuscular Volume (fL)0.1464−0.0803 to 0.00870.0162
Mean Corpuscular Hemoglobin (Pg)0.1460−0.0307 to −0.00330.0164
Mean Corpuscular Hemoglobin Concentration (%)0.0006−0.0124 to 0.01070.8839
Red Cell Distribution Width (%)0.0107−0.0209 to 0.01090.5300
Total leukocytes (cells/mm3)0.14933.398 to 29.760.0151
Eosinophils (cells/mm3)0.0023−2.250 to 3.0100.7714
Neutrophils (cells/mm3)0.13952.054 to 21.730.0192
Lymphocytes (cells/mm3)0.0395−2.580 to 10.630.2246
Monocytes (cells/mm3)0.0558−0.2935 to 1.8820.1475
Disclaimer/Publisher’s Note: The statements, opinions and data contained in all publications are solely those of the individual author(s) and contributor(s) and not of MDPI and/or the editor(s). MDPI and/or the editor(s) disclaim responsibility for any injury to people or property resulting from any ideas, methods, instructions or products referred to in the content.