

Estimated Energy Requirement: Comparison Between the 2005 and 2023 Dietary Reference Intakes in Sedentary Adults and Older Adults—A Retrospective Cross-Sectional Study

 ,
,  , , , and
Abstract

1. Introduction
2. Materials and Methods
2.1. Study Design and Sample
2.2. Data Collection and Inclusion Criteria
2.3. Classifications: Nutritional Status, Age Group, and Physical Activity Level
2.4. Estimation of Daily Energy Requirements
2.5. Data Analysis
3. Results
4. Discussion
5. Conclusions
Author Contributions
Funding
Institutional Review Board Statement
Informed Consent Statement
Data Availability Statement
Conflicts of Interest
References
- Harris, J.A.; Benedict, F.G. A Biometric Study of Human Basal Metabolism. Proc. Natl. Acad. Sci. USA 1918, 4, 370. [Google Scholar] [CrossRef] [PubMed]
- Frankenfield, D.; Roth-Yousey, L.; Compher, C. Comparison of Predictive Equations for Resting Metabolic Rate in Healthy Nonobese and Obese Adults: A Systematic Review. J. Am. Diet. Assoc. 2005, 105, 775–789. [Google Scholar] [CrossRef] [PubMed]
- Bendavid, I.; Lobo, D.N.; Barazzoni, R.; Cederholm, T.; Coëffier, M.; de van der Schueren, M.; Fontaine, E.; Hiesmayr, M.; Laviano, A.; Pichard, C.; et al. The centenary of the Harris–Benedict equations: How to assess energy requirements best? Recommendations from the ESPEN expert group. Clin. Nutr. 2021, 40, 690–701. [Google Scholar] [CrossRef]
- Mifflin, M.; St Jeor, S.; Hill, L.; Scott, B.; Daugherty, S.; Koh, Y. A new predictive equation for resting energy expenditure in healthy individuals. Am. J. Clin. Nutr. 1990, 51, 241–247. [Google Scholar] [CrossRef]
- Kawase, F.; Masaki, Y.; Ozawa, H.; Imanaka, M.; Sugiyama, A.; Wada, H.; Kobayashi, S.; Tsukahara, T. New prediction equations for resting energy expenditure in older hospitalized patients: Development and validation. Nutrition 2023, 115, 112188. [Google Scholar] [CrossRef]
- Almajwal, A.M.; Abulmeaty, M.M.A. New Predictive Equations for Resting Energy Expenditure in Normal to Overweight and Obese Population. Int. J. Endocrinol. 2019, 2019, 5727496. [Google Scholar] [CrossRef]
- Niederer, L.E.; Miller, H.; Haines, K.L.; Molinger, J.; Whittle, J.; MacLeod, D.B.; McClave, S.A.; Wischmeyer, P.E. Prolonged progressive hypermetabolism during COVID-19 hospitalization undetected by common predictive energy equations. Clin. Nutr. ESPEN 2021, 45, 341–350. [Google Scholar] [CrossRef]
- Tinsley, G.M.; Graybeal, A.J.; Moore, M.L. Resting metabolic rate in muscular physique athletes: Validity of existing methods and development of new prediction equations. Appl. Physiol. Nutr. Metab. 2019, 44, 397–406. [Google Scholar] [CrossRef]
- Porter, J.; Ward, L.C.; Nguo, K.; Ward, A.; Davidson, Z.; Gibson, S.; Prentice, R.; Neuhouser, M.L.; Truby, H. Development and validation of age-specific predictive equations for total energy expenditure and physical activity levels for older adults. Am. J. Clin. Nutr. 2024, 119, 1111–1121. [Google Scholar] [CrossRef]
- Kajale, N.; Khadilkar, A.; Oza, C.; Gondhalekar, K.; Khadilkar, V. Resting metabolic rate and its association with body composition parameters in 9- to 18-year-old Indian children and adolescents. Nutrition 2022, 99–100, 111652. [Google Scholar] [CrossRef]
- United Nations University; World Health Organization; Food and Agriculture Organization of the United Nations. Human Energy Requirements. Report of a Joint FAO/WHO/UNU Expert Consultation; FAO Food and Nutrition Technical Report Series 1; FAO: Rome, Italy, 2001. [Google Scholar]
- Miles-Chan, J.L.; Harper, M.E. Deconstructing interindividual variability in energy metabolism: Implications for metabolic health. Am. J. Physiol. Endocrinol. Metab. 2023, 325, E107–E112. [Google Scholar] [CrossRef] [PubMed]
- Carvalho, F.G.D.; Monteiro, B.d.A.; Goulart-de-Andrade, D.E.; Bronzi, É.d.S.; Oliveira, M.R.M.d. Métodos de Avaliação de Necessidades Nutricionais e Consumo de Energia em Humanos. Rev. Simbiol. 2012, 5, 99–120. [Google Scholar]
- Argilés, J.M.; López-Soriano, F.J.; Stemmler, B.; Busquets, S. Cancer-associated cachexia—Understanding the tumour macroenvironment and microenvironment to improve management. Nat. Rev. Clin. Oncol. 2023, 20, 250–264. [Google Scholar] [CrossRef] [PubMed]
- Institute of Medicine. Dietary Reference Intakes for Energy, Carbohydrate, Fiber, Fat, Fatty Acids, Cholesterol, Protein, and Amino Acids; National Academies Press: Washington, DC, USA, 2005. [Google Scholar] [CrossRef]
- National Academies of Sciences. Dietary Reference Intakes for Energy; National Academies Press: Washington, DC, USA, 2023. [Google Scholar] [CrossRef]
- World Health Organization. Obesity and Overweight. 2024. Available online: https://www.who.int/news-room/fact-sheets/detail/obesity-and-overweight (accessed on 20 January 2025).
- Pearson-Stuttard, J.; Zhou, B.; Kontis, V.; Bentham, J.; Gunter, M.J.; Ezzati, M. Worldwide burden of cancer attributable to diabetes and high body-mass index: A comparative risk assessment. Lancet Diabetes Endocrinol. 2018, 6, e6–e15. [Google Scholar] [CrossRef]
- Safizadeh, F.; Mandic, M.; Hoffmeister, M.; Brenner, H. Colorectal Cancer and Central Obesity. JAMA Netw. Open 2025, 8, e2454753. [Google Scholar] [CrossRef]
- Phelps, N.H.; Singleton, R.K.; Zhou, B.; Heap, R.A.; Mishra, A.; Bennett, J.E.; Paciorek, C.J.; Lhoste, V.P.; Carrillo-Larco, R.M.; Stevens, G.A.; et al. Worldwide trends in underweight and obesity from 1990 to 2022: A pooled analysis of 3663 population-representative studies with 222 million children, adolescents, and adults. Lancet 2024, 403, 1027–1050. [Google Scholar] [CrossRef]
- Pureza, I.R.d.O.M.; Macena, M.L.; Silva, A.E.; Praxedes, D.R.S.; Vasconcelos, L.G.L.; Florêncio, T.M.M.T.; Bueno, N.B. Agreement between equations-estimated resting metabolic rate and indirect calorimetry-estimated resting metabolic rate in low-income obese women. Arch. Endocrinol. Metab. 2020. [CrossRef]
- Lin, Y.R.; Chen, P.C.; Li, W.T.; Huang, M.H.; Huang, S.F.; Wang, C.J.; Chien, Y.W.; Kao, A.W.; Shan, Y.S. The relationship between caloric intake and clinical outcomes in critically ill patients: A retrospective study. Clin. Nutr. ESPEN 2025, 65, 9–15. [Google Scholar] [CrossRef]
- Moonen, H.P.F.X.; Beckers, K.J.H.; van Zanten, A.R.H. Energy expenditure and indirect calorimetry in critical illness and convalescence: Current evidence and practical considerations. J. Intensive Care 2021, 9, 8. [Google Scholar] [CrossRef]
- World Health Organization (WHO). Physical Status: The Use and Interpretation of Anthropometry; WHO Technical Report Series n. 854; World Health Organization: Geneva, Switzerland, 1995. [Google Scholar]
- World Health Organization (WHO). Surveillance of Chronic Disease Risk Factors: Country Level Data and Comparable Estimates; World Health Organization: Geneva, Switzerland, 2005; Available online: https://iris.who.int/handle/10665/43190 (accessed on 16 October 2024).
- United Nations Department of Economic; Social Affairs; Population Division. World Population Ageing 2019; United Nations: New York, NY, USA, 2019. [Google Scholar]
- BRASIL. Lei No 14.423. 2022. Available online: https://www.planalto.gov.br/ccivil_03/_Ato2019-2022/2022/Lei/L14423.htm (accessed on 1 December 2024).
- Lenhard, W.; Lenhard, A. Computation of Effect Sizes. 2022. Available online: https://www.psychometrica.de/effect_size.html (accessed on 1 December 2024). [CrossRef]
- Cohen, J. Statistical Power Analysis for the Behavioral Sciences, 2nd ed.; Lawrence Erlbaum Associates: New York, NY, USA, 1988. [Google Scholar]
- Jamovi (2.6.13), The Jamovi Project. 2024.
- R Core Team. R: A Language and Environment for Statistical Computing. 2023. [Google Scholar]
- Fox, J.; Weisberg, S. CAR: Companion to Applied Regression; [R Package]. 2023. [Google Scholar]
- Lenth, R. emmeans: Estimated Marginal Means, aka Least-Squares Means; [R Package]. 2023. [Google Scholar]
- Singmann, H. AFEX: Analysis of Factorial Experiments; [R Package]. 2023. [Google Scholar]
- Holdy, K.E. Monitoring Energy Metabolism with Indirect Calorimetry: Instruments, Interpretation, and Clinical Application. Nutr. Clin. Pract. 2004, 19, 447–454. [Google Scholar] [CrossRef]
- Speakman, J.R.; Pontzer, H.; Rood, J.; Sagayama, H.; Schoeller, D.A.; Westerterp, K.R.; Wong, W.W.; Yamada, Y.; Loechl, C.; Murphy-Alford, A.J. The International Atomic Energy Agency International Doubly Labelled Water Database: Aims, Scope and Procedures. Ann. Nutr. Metab. 2019, 75, 114–118. [Google Scholar] [CrossRef] [PubMed]
- Gaillard, C.; Alix, E.; Sallé, A.; Berrut, G.; Ritz, P. Energy requirements in frail elderly people: A review of the literature. Clin. Nutr. 2007, 26, 16–24. [Google Scholar] [CrossRef] [PubMed]
- Cruz-Jentoft, A.J.; Bahat, G.; Bauer, J.; Boirie, Y.; Bruyère, O.; Cederholm, T.; Cooper, C.; Landi, F.; Rolland, Y.; Sayer, A.A.; et al. Sarcopenia: Revised European consensus on definition and diagnosis. Age Ageing 2019, 48, 16–31. [Google Scholar] [CrossRef] [PubMed]
- Cooper, J.A.; Manini, T.M.; Paton, C.M.; Yamada, Y.; Everhart, J.E.; Cummings, S.; Mackey, D.C.; Newman, A.B.; Glynn, N.W.; Tylavsky, F.; et al. Longitudinal change in energy expenditure and effects on energy requirements of the elderly. Nutr. J. 2013, 12, 73. [Google Scholar] [CrossRef]
- de Lima Macena, M.; da Costa Paula, D.T.; da Silva Júnior, A.E.; Praxedes, D.R.S.; de Oliverira Maranhão Pureza, I.R.; de Melo, I.S.V.; Bueno, N.B. Estimates of resting energy expenditure and total energy expenditure using predictive equations in adults with overweight and obesity: A systematic review with meta-analysis. Nutr. Rev. 2022, 80, 2113–2135. [Google Scholar] [CrossRef]

| 2005 EQUATIONS (≥19 years) | |
| Male | EER = 662 − (9.53 × Age [Y]) + PA × (15.91 × Weight [Kg] + 539.6 × Height [M]) |
| Female | EER = 354 − (6.91 × Age [Y]) + PA × (9.36 × Weight [Kg] + 726 × Height [M]) |
| 2023 EQUATIONS (≥19 years) | |
| Male | EER = 753.07 − (10.83 × Age [Y]) + (6.50 × Height [Cm]) + (14.10 × Weight [Kg]) |
| Female | EER = 584.90 − (7.01 × Age [Y]) + (5.72 × Height [Cm]) + (11.71 × Weight [Kg]) |
| Sex (Female) | 345 (80.00%) |
| Age (Y) | 43.57 ± 17.30 (CI95%: 41.93–45.21) |
| Adults (<60 years old) | 346 (80.30%) |
| 20–29 (years old) | 136 (39.31%) |
| 30–39 (years old) | 60 (17.34%) |
| 40–49 (years old) | 68 (19.65%) |
| 50–59 (years old) | 72 (20.81%) |
| Elderly (≥60 years old) | 85 (19.70%) |
| 60–69 (years old) | 45 (64.70%) |
| +70 (years old) | 40 (47.05%) |
| Height (M) | 1.62 ± 0.08 (CI 95%: 1.62–1.63) |
| Weight (Kg) | 79.52 ± 21.72 (CI 95%: 77.47–81.58) |
| Overall BMI (Kg/m2) | 30.08 ± 7.55 (CI 95%: 29.36–30.79) |
| Underweight (n = 15; 3.5%) | 17.1 ± 1.02 (CI 95%: 16.50–17.70) |
| Normal weight (n = 106; 24.6%) | 22.2 ± 1.88 (CI 95%: 21.00–22.60) |
| Overweight (n = 113; 26.2%) | 27.7 ± 1.42 (CI 95%: 27.50–28.00) |
| Obesity (n = 197; 45.7%) | 36.6 ± 5.46 (CI 95%: 35.90–37.40) |
| Overall (Kcal) | Adults (Kcal) | Elderly (Kcal) | Within-Subjects Effect | Between-Subjects Effect | |||
|---|---|---|---|---|---|---|---|
| F (df) | p (ES) | F (df) | p (ES) | ||||
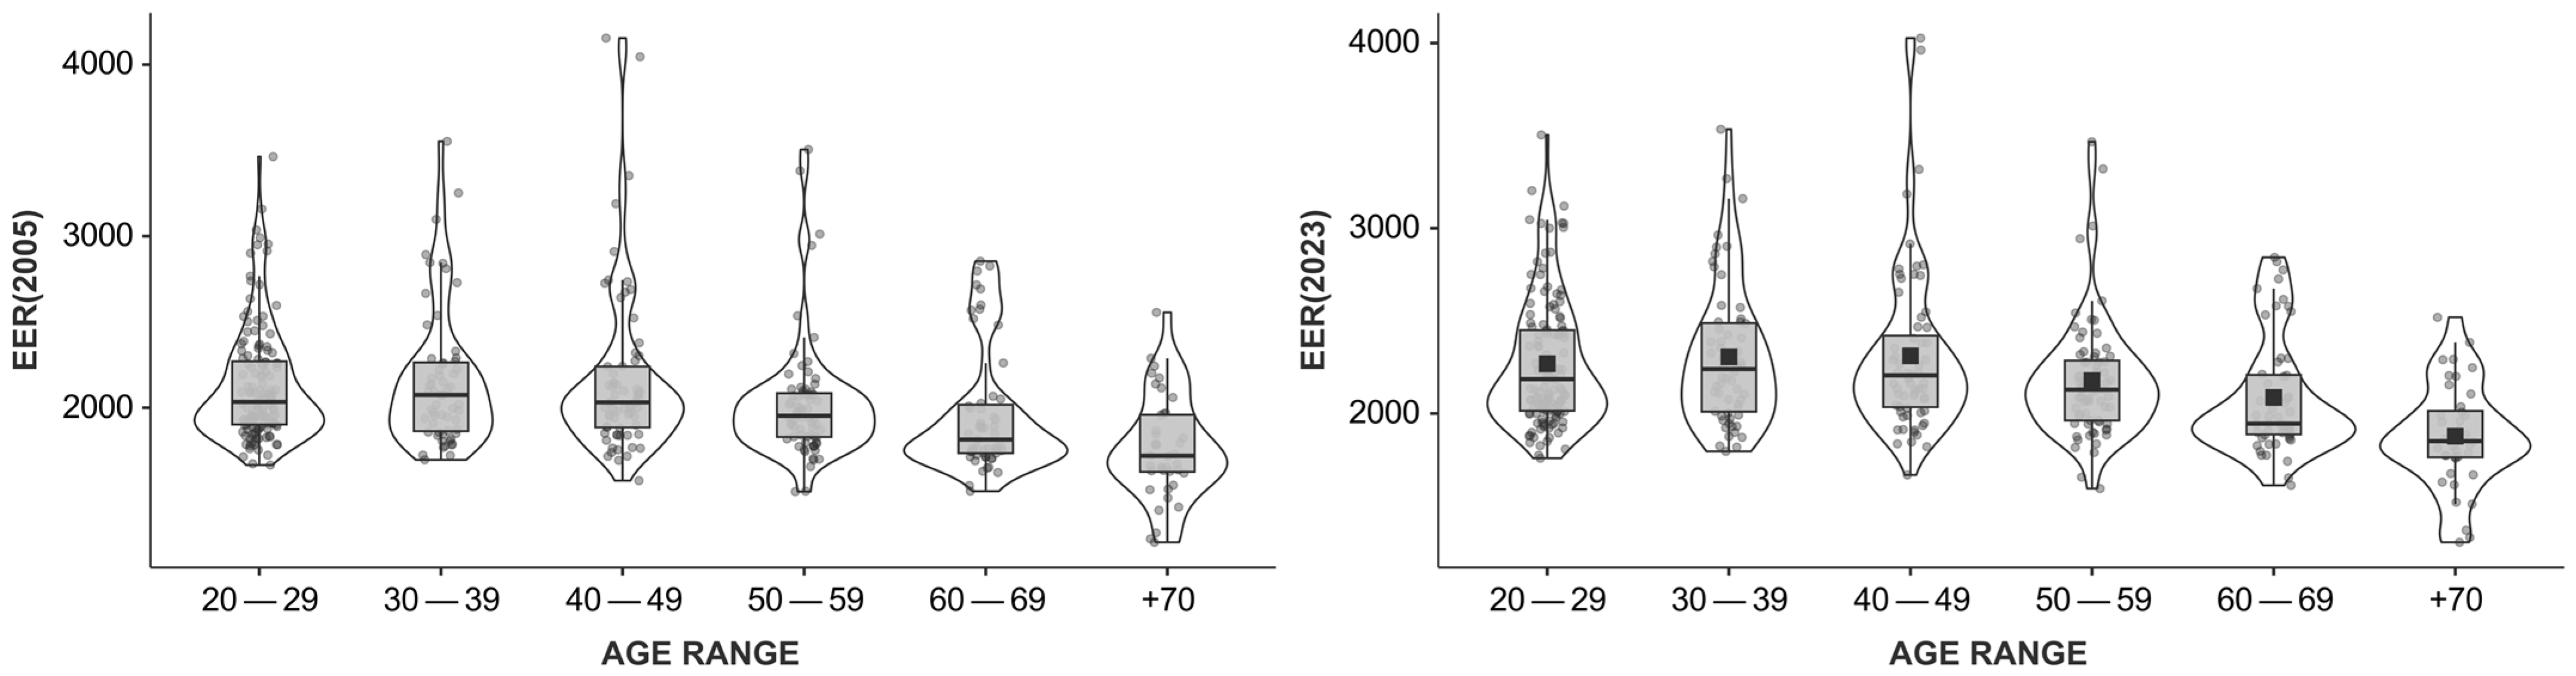
| EER, 2005 | 2066.22 ± 391.43 (CI 95%: 2029.16–2103.28) | 2113.83 ± 386.62 (CI 95%: 2072.94–2154.71) | 1872.44 ± 350.86 (CI 95%: 1796.76–1948.12) | 1567.24 (1, 429) | <0.001 (η2 = 0.02) | 43.1 (1, 429) | <0.001 (η2 = 0.09) |
| EER, 2023 | 2205.68 ± 374.78 (CI 95%: 2170.20–2241.16) | 2259.16 ± 368.86 (CI 95%: 2220.15–2298.16) | 1987.99 ± 316.98 (CI 95%: 1919.62–2056.36) | ||||
| Underweight (Kg/m²) | Normal Weight (Kg/m²) | Overweight (Kg/m²) | Obesity (Kg/m²) | Within-Subjects Effect | Between-Subjects Effect | |||
|---|---|---|---|---|---|---|---|---|
| F (df) | p (ES) | F (df) | p (ES) | |||||
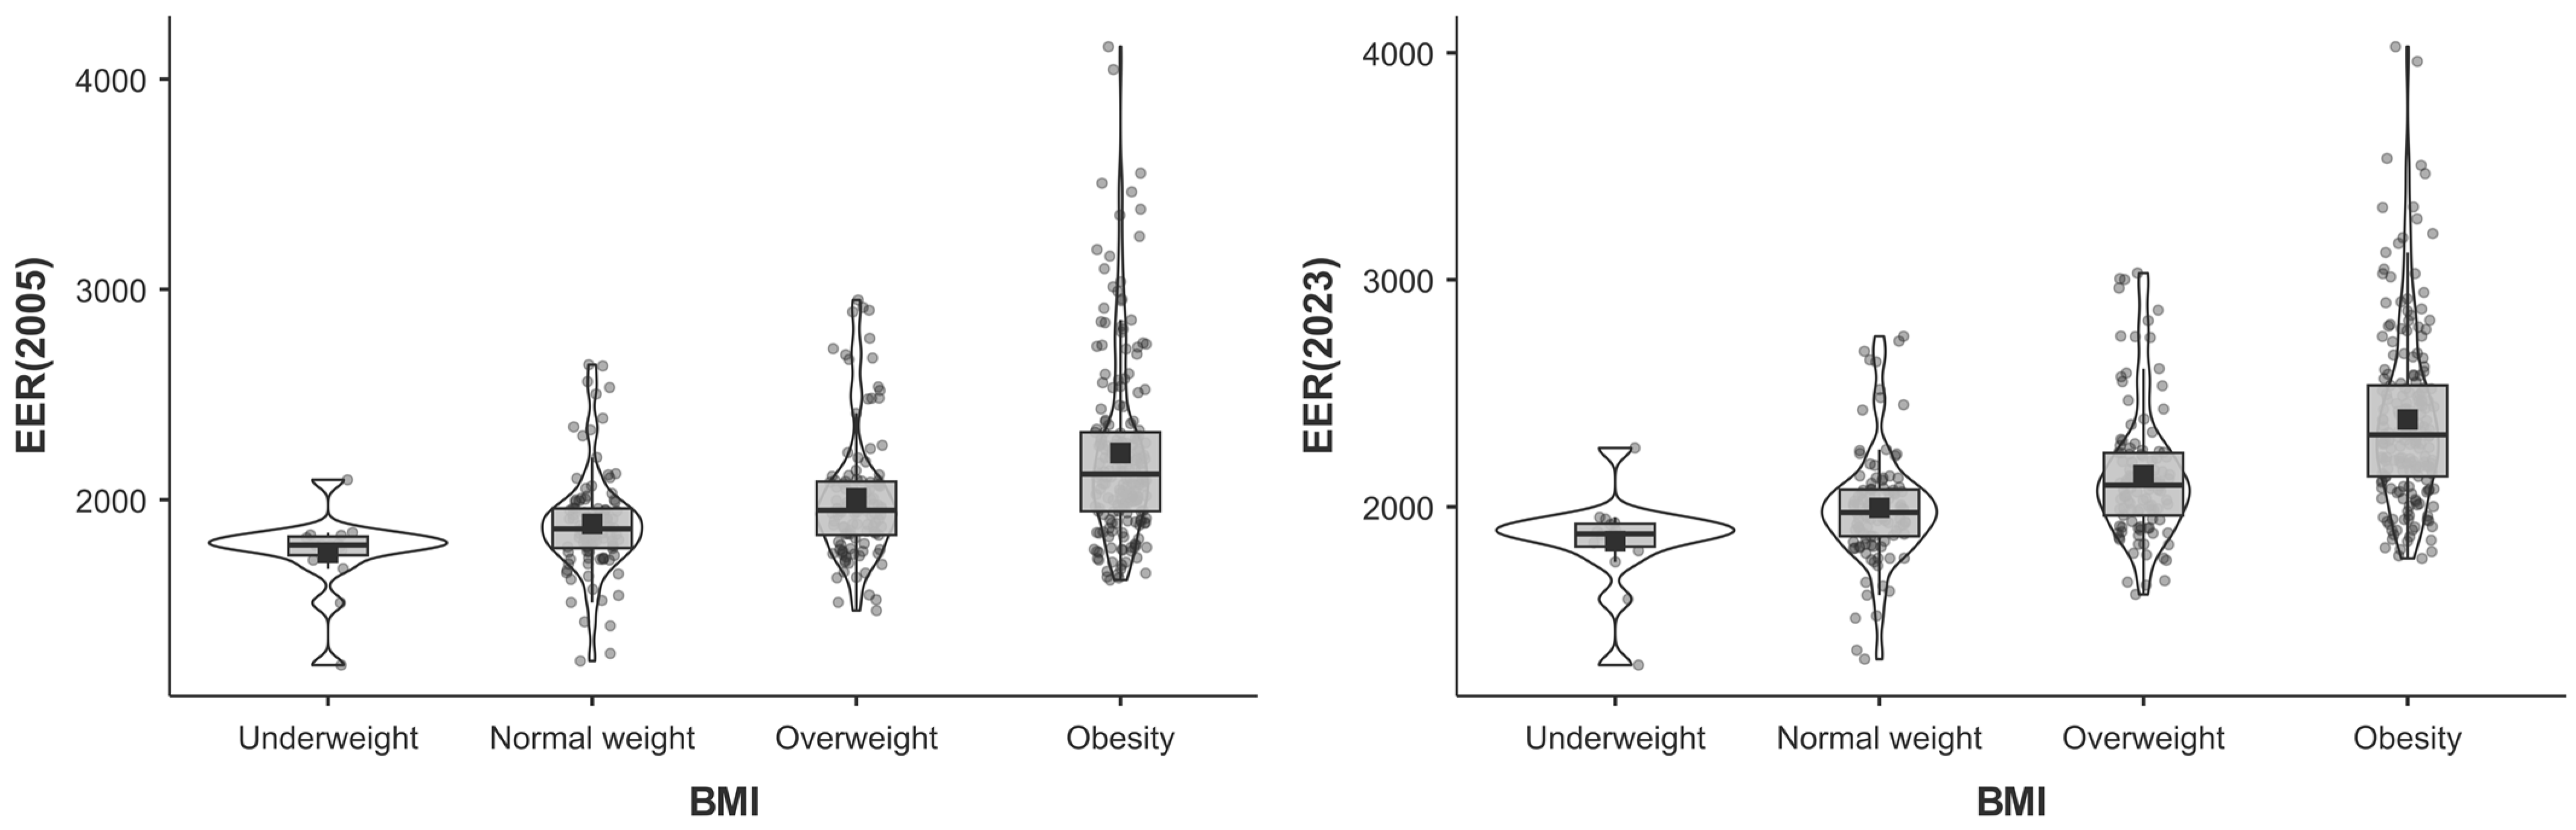
| EER, 2005 | 1747.68 ± 189.35 (CI 95%: 1642.82–1852.54) | 1885.20 ± 244.77 (CI 95%: 1838.06–1932.35) | 2007.59 ± 309.93 (CI 95%: 1949.82–2065.36) | 2221.50 ± 441.47 (CI 95%: 2159.47–2283.53) | 1010.3 (1, 427) | <0.001 (η2 = 0.01) | 36.7 (3, 427) | <0.001 (η2 = 0.20) |
| EER, 2023 | 1848.83 ± 203.18 (CI 95%: 1736.31–1961.35) | 1995.32 ± 248.73 (CI 95%: 1947.42–2043.22) | 2139.73 ± 293.57 (CI 95%: 2085.02–2194.45) | 2383.87 ± 393.34 (CI 95%: 2328.60–2439.13) | ||||
| BMI | BMI | MD | SE | df | t | p Tukey | |
|---|---|---|---|---|---|---|---|
| Underweight | - | Normal weight | −0.032 | 0.018 | 427 | −1.82 | 0.266 |
| - | Overweight | −0.060 | 0.018 | −3.41 | 0.004 | ||
| - | Obesity | −0.104 | 0.017 | −6.00 | <0.001 | ||
| Normal weight | - | Overweight | −0.028 | 0.009 | −3.22 | 0.008 | |
| - | Obesity | −0.071 | 0.008 | −9.19 | <0.001 | ||
| Overweight | - | Obesity | −0.043 | 0.008 | −5.69 | <0.001 |
Disclaimer/Publisher’s Note: The statements, opinions and data contained in all publications are solely those of the individual author(s) and contributor(s) and not of MDPI and/or the editor(s). MDPI and/or the editor(s) disclaim responsibility for any injury to people or property resulting from any ideas, methods, instructions or products referred to in the content. |
© 2025 by the authors. Licensee MDPI, Basel, Switzerland. This article is an open access article distributed under the terms and conditions of the Creative Commons Attribution (CC BY) license (https://creativecommons.org/licenses/by/4.0/).
Share and Cite
Verdi, A.M.O.H.; Soares, J.M.; Carneiro, J.F.; Felez, I.O.; Schiessel, D.L.; Vieira, D.G.; Kühl, A.M.; Gonçalves, D.C.; Melhem, A.R.d.F. Estimated Energy Requirement: Comparison Between the 2005 and 2023 Dietary Reference Intakes in Sedentary Adults and Older Adults—A Retrospective Cross-Sectional Study. Obesities 2025, 5, 15. https://doi.org/10.3390/obesities5010015
Verdi AMOH, Soares JM, Carneiro JF, Felez IO, Schiessel DL, Vieira DG, Kühl AM, Gonçalves DC, Melhem ARdF. Estimated Energy Requirement: Comparison Between the 2005 and 2023 Dietary Reference Intakes in Sedentary Adults and Older Adults—A Retrospective Cross-Sectional Study. Obesities. 2025; 5(1):15. https://doi.org/10.3390/obesities5010015
Chicago/Turabian StyleVerdi, Anderson Matheus Oliveira Haas, Jaqueline Machado Soares, Jaqueline Fernandes Carneiro, Izadora Oliveira Felez, Dalton Luiz Schiessel, Daniele Gonçalves Vieira, Adriana Masiero Kühl, Daniela Caetano Gonçalves, and Angelica Rocha de Freitas Melhem. 2025. "Estimated Energy Requirement: Comparison Between the 2005 and 2023 Dietary Reference Intakes in Sedentary Adults and Older Adults—A Retrospective Cross-Sectional Study" Obesities 5, no. 1: 15. https://doi.org/10.3390/obesities5010015
APA StyleVerdi, A. M. O. H., Soares, J. M., Carneiro, J. F., Felez, I. O., Schiessel, D. L., Vieira, D. G., Kühl, A. M., Gonçalves, D. C., & Melhem, A. R. d. F. (2025). Estimated Energy Requirement: Comparison Between the 2005 and 2023 Dietary Reference Intakes in Sedentary Adults and Older Adults—A Retrospective Cross-Sectional Study. Obesities, 5(1), 15. https://doi.org/10.3390/obesities5010015