Abstract
Bead-free nanofibrous scaffolds composed of PVOH/keratin/chitosan were prepared using electrospinning after optimising the process parameters using a Box–Behnken experimental design. Two quadratic models were developed to optimise the fibre diameter and the diameter of fibre beads considering the voltage, flow rate, spinning distance, and amount of biopolymer as independent variables. All independent variables were found to be significant in determining responses, although not all interactions among these were significant. The models were highly effective in describing responses, with an R2 of 98.58 and 99.67%. The optimum conditions were determined to be 15.82 kV voltage, 0.25 mL/h flow rate, 105 mm spinning distance, and 30% biopolymers. The accuracy of the models was verified and found to be within an acceptable range. The bead-free nanofibrous scaffold exhibited no cytotoxicity to Human Aneuploid Immortal Keratinocyte (HaCaT) and Normal Human Dermal Fibroblast (NHDF) cell lines, enabling cell adhesion and proliferation. Both cell lines remained attached with perfect cell morphology when co-cultured on the scaffold for 30 days, indicating the scaffold’s potential for biomedical applications.
1. Introduction
Electrospun nanofibre from biomaterials has attracted a lot of interest in the preparation of biocompatible three-dimensional scaffolds in tissue engineering, especially soft tissue regeneration, due to the similarity between its structure and that of native extracellular matrices (ECMs) [1]. Electrospun nanofibres are more desirable for this purpose than other nanostructured materials because they have a very high surface-area-to-mass ratio and a high length-to-diameter ratio [2,3].
Carbohydrate biopolymers such as chitosan (CH) have been widely studied in tissue engineering due to their antimicrobial activity, lack of toxicity, biocompatibility, and biodegradability [4]. Wool-based keratin protein (biopolymer) has also been extensively researched in tissue engineering due to its inherent bioactivity, biocompatibility, biodegradability, and natural abundance [5]. Therefore, both chitosan [6] and keratin [7] fibre have been electrospun for biomedical applications. Recently, a novel electrospun nanofibrous scaffold (ENS) composed of both CH and keratin powder (KP) was prepared, where polyvinyl alcohol (PVOH) was added to increase the electrospinnibility [8]. However, the fabricated PVOH/KP/CH ENS were not defect-free. Beads were evident in the nanofibres as well as spherical-shaped nanofibres (Figure 1). Nanofibres with a higher content of biopolymers were prone to defects, although a higher content of biopolymers is desirable in ENS as it is associated with better biomedical performance. Therefore, optimising the electrospinning processing parameters was necessary to produce defect-free ENS with the highest possible biopolymer content. The optimisation of electrospinning to obtain such ENS is reported here.
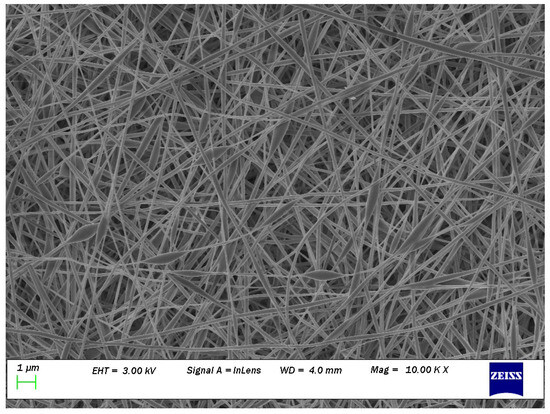
Figure 1.
Many beads (spherical shaped) can be seen on the SEM image at magnification of 10 K of nanofibers obtained from 60% of PVA (10% w/w) + 40% of keratin (5% w/w) and 60% of PVA (10% w/w) + 40% of chitosan (2% w/w); reprinted from [8] with permission from Elsevier.
The four most important parameters in electrospinning are viscosity, applied voltage (kV), the flow rate of the solution, and the distance between the collector and the spinneret (spinning distance) [9]. These parameters were considered independent variables for optimising the electrospinning of defect-free PVOH/KP/CH ENS.
Different strategies can be used to optimise a production process, including simplex optimisation and response surface methodology (RSM). The simplex method can only encircle the optimum, whereas RSM can determine the exact optimum. Moreover, RSM can graphically show the relationship between the responses and experimental variables [10]. The Box–Behnken design [11] is one experimental design tool based on RSM, in which only three levels are required to develop a quadratic model. These levels are equally spaced. The Box–Behnken design takes upper, lower, and middle values as the levels of the given variable. The quadratic model establishes relations between variables and responses. The model can allow for interpolation in the space between the lower and upper values of the variable to optimise the response to the desired target. Therefore, a Box–Behnken design tool was used as an efficient way to optimise the production of PVOH/KP/CH ENS. No published studies report similar bead-free electrospun scaffolds, as well as no in vitro studies. It is expected that the development of bead-free nanofibrous electrospun scaffolds made of KP and CH will have an increasing effect in the biomedical field.
The main aim of this study was to fabricate ENS consisting of defect-free, uniform, and smooth nanofibres with the highest possible content of carbohydrate and protein biopolymers, i.e., CH and KP. A secondary aim was to achieve this in the most efficient way considering time and cost. A mathematical model was created to allow for prediction of the optimum process parameters capable of producing defect-free ENS containing the greatest quantity of biopolymer.
2. Materials and Methods
2.1. Materials
Qingdao Aurora Chemical Co., Ltd., Qingdao, China, provided KP powder (hydrolyzed, code: 69430-36-0). Weseta International, Shanghai, China, provided the CH (degree of deacetylation: 91%, molecular weight: 503 kDa). Sigma-Aldrich, Auckland, New Zealand, provided PVOH powder (degree of hydrolysis > 99%; Mw = 8.9104–9.8104), sodium hydroxide (NaOH), and acetic acid (CH3COOH). Gibco™ DMEM (Dulbecco’s Modified Eagle Medium) used as the cell growth media and UltraPure™ 10% SDS solution used for disrupting cell membranes were all obtained from Gibco, Thermo Fisher Scientific, Waltham, MA, USA. Calcein AM to stain live cells was purchased from Invitrogen, Thermo Fisher Scientific, USA. 3-(4, 5-Dimethylthiazol-2-yl)-2, 5-Diphenyltetrazolium Bromide (MTT) was supplied by Life Technologies, Auckland, New Zealand. Phosphate-buffered saline (PBS) used as a buffer solution and dimethyl sulfoxide (DMSO) used for dissolving formazan were purchased from Sigma-Aldrich, New Zealand. All materials were used without additional purification. The American Type Culture Collection (ATCC®, Manassas, VA, USA) provided the Human Aneuploid Immortal Keratinocyte (CVCL-0038) (HaCaT) and Normal Human Dermal Fibroblasts (ATCC PCS-201-010) (NHDF) for the cell investigation.
2.2. Preparation of Polymer Solutions
To prepare electrospinning solutions, PVOH, KP, and CH were dissolved at various concentrations in suitable solvents. PVOH powder was dissolved in distilled water by heating at 80 °C with constant stirring for four hours to produce 10% (w/v) PVOH solution. To create a 5% (w/v) KP solution, sulphitolysed KP powder was mixed with distilled water before being completely dissolved by gradually adding a 1 M NaOH solution while stirring continuously at 50 °C. Then, 0.1 M NaOH was added to the solution to lower the pH to 9.5. CH powders were dissolved in 2% (v/v) acetic acid solution at 50 °C with continuous stirring to make a 2% (w/v) CH solution. PVOH/KP blend solutions designated PK1, PK3, and PK5 were made with PVOH/KP weight ratios of 90:10, 70:30, and 50:50, respectively. Similarly, PVOH/CH blend solutions marked PC1, PC3, and PC5 were made with PVOH/CH weight ratios of 90:10, 70:30, and 50:50, respectively. Each solution mixture was thoroughly mixed until it was completely homogenous.
2.3. Characterization of the Polymer Solution
The solution viscosity was measured using a HAAKE RheoStress 1 (Thermo ScientificTM, USA) at 20 °C with cone-plate geometry (60 mm diameter and 1° angle) coupled with an MP61 liquid temperature control device. A linear change in the shear rate from 1 to 300 s−1 was made. The electrical conductivity of the solutions at 20 °C was measured using a digital conductivity meter. Every measurement was made three times.
2.4. Production of PVOH/KP/CH ENS
An attempt was made to prepare bead-free electrospun nanofibrous scaffold by optimising electrospinning parameters from a tertiary mixture of PVOH (10% w/v), KP (5% w/v), and CH (2% w/v) solutions, utilizing an electrospinning setup with four spinnerets (TL-BM, TONG LI TECH Co Ltd., Shenzhen, China). PVOH/KP solution was delivered by spinnerets 1 and 2 from syringes 1 and 2 by tubing, and PVOH/CH solution was delivered by spinnerets 3 and 4 from syringes 3 and 4 via tubing. In order to deliver the solutions concurrently, spinnerets 1 and 2 were positioned on one side of the rotary drum (collector) and spinnerets 3 and 4 on the opposing side (Figure 2). A 23-gauge needle (blunt-tipped) was used as a spinneret, carried by the robotic arms moving at a linear speed of 40 mm/s. The fibre was collected on a cylindrical mandrel wrapped with aluminium foil rotating at 100 rpm. The temperature and relative humidity were maintained at 20 ± 2 °C and 65 ± 5%. Scaffolds were produced by operating the electrospinning for 24 ± 2 h at a 0.5 ± 0.05 mm thickness.
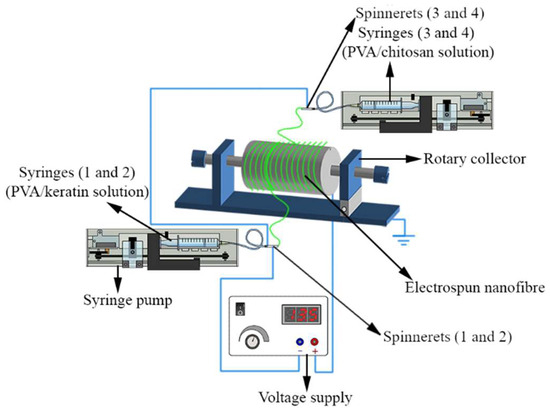
Figure 2.
Electrospinning using multiple spinnerets: PVOH/KP and PVOH/CH delivered by spinnerets 1 and 2, and spinnerets 2 and 4, respectively, with varied amounts of macromolecules, voltage, flow rate, and spinning distance. Fabricated ENS collected on a rotary drum.
2.5. Experimental Design
A Box–Behnken design that included four variables, biopolymer (X1: 10%, 30%, 50%), voltage (X2: 12 kV, 15 kV, 18 kV), flow rate (X3: 0.1 mL/h, 0.3 mL/h, 0.5 mL/h), and SD (spinning distance) (X4: 70 mm, 100 mm, 130 mm), was used to create a model that explained the dependent variables’ response patterns. The values of the independent variables (lowest and highest), obtained from a preliminary study, are listed in Table 1. There were 29 experimental runs, with five replicates at the centre point for four factors at three levels each. In Table 2, the experimental layout is displayed. The following is the full quadratic equation utilized in this model (Equation (1)):
where Y is the predicted response, β0 is the intercept, βi is linear coefficients, βii is quadratic coefficients, and βij is the coefficients of interaction. N is the number of design variables, and the independent variables are coded as Xi and Xj.

Table 1.
Values of independent variables obtained from the preliminary experiments.
Table 2.
Box–Behnken design of experiments and response values determined for each design point.
Minitab 17.0 statistical software [12] was used to carry out the regression analysis, and significant terms were identified. In order to further improve the model, the non-significant terms were eliminated. The model correctness was assessed using the coefficients of determination (R2) and the analysis of variance (ANOVA). The improved model was used to calculate the expected values.
2.6. Determination of Mean Fibre Diameter and Mean Diameter of Fibre Defect
SEM (JEOL 6700F FE-SEM, JEOL Ltd., Tokyo, Japan) was used to assess the diameter and defect of the electrospun fibres. Emitech K575X Peltier-cooled high-resolution sputter coater (EM Technologies Ltd., Kent, England) equipped with an Emitech 250× carbon coater was used to coat all specimens with 5 nm platinum–palladium prior to scanning. Micrographs of coated samples were taken at a 3.0 kV accelerated voltage. The SEM micrographs (Figure S1, Supplementary Files) at their original magnification were analysed using ImageJ software (Version 1.52i 26 November 2018) to determine the fibre diameter [13]. The mean diameter of fibre and defect was calculated from at least 100 measurements for each specimen.
2.7. Optimisation
The responses were optimised using a numerical optimisation method based on Derringer’s desirability function. This function identifies the combination of factor levels to jointly optimise a series of responses by fulfilling the requirements for each response. The optimisation was completed in three steps. First, each response was transformed into a partial desirability function using the dimensionless desirability scale Yi (i = 1, 2, …, n) (di). Secondly, global desirability function (D) was obtained after combining the individual desirables. Finally, optimal factor settings were identified.
2.8. In Vitro Studies
For all in vitro studies, round-shaped ENS specimens with a diameter of 10 mm were sterilized using UV irradiation (Cross-beam UV lamp in Thermo Scientific™ Herasafe™ KS (NSF) Class II, Type A2 Biological Safety Cabinet, Thermo Fisher Scientific, Auckland, NZ) for 90 min.
MTT was used in a cell proliferation assay to assess cell viability as a function of redox potential according to ISO 10993-5:2009 [14]. Specimens were placed in wells of the 48-well microplate. Prepared cell suspensions (500 µL) of HaCaT and NHDF cell lines with a concentration of 1 × 10⁵ cells/mL were seeded separately on top of the ENS and incubated at 37 ± 0.5 °C with 5% CO2 for 7 days. After incubation, MTT solution (50 µL) with a concentration of 2.5 mg/mL and 150 µL of complete DMEM was added to each well and incubated at 37 ± 0.5 °C with 5% CO2 for 4 h. Following incubation, 200 µL DMSO was used to dissolve formazan.
The absorbance (optical density) of the content of MTT-treated wells was measured using a multimode plate reader, Varioskan™ Flash, Thermo Scientific, USA, at 570 nm in dual-band mode. The viable cell percentage was then calculated using Equation (2).
Live and dead cells on the 7th day were detected using a fluorescence microscope (Olympus IX71 inverted microscope, Olympus Corporation, Osaka, Japan). Calcein AM was used to stain live cells, and a U-MNIBA3 filter enabled the live cells to be observed due to their bright-green colour. Propidium iodide was used to stain dead cells red, and red-coloured dead cells were observed through a U-MWIB3 filter. Images of live and dead cells were captured at 20-times magnification. Imaging was controlled by cellSens software (OLYMPUS cellSens Standard 1.13; Build 13479) installed on a desktop computer connected to the fluorescence microscope.
The ability of ENS to support cell adhesion and differentiation of cells was assessed qualitatively using SEM. HaCaT and NHDF cell lines were co-cultured on the specimens of ENS in 48-well microplates. To culture both cell lines on the specimen, the NHDF cell line (500 µL) was first seeded on them at a concentration of 1 × 10⁵ cells/mL and cultured for 7 days. The complete DMEM media were changed every day. On the 8th day, HaCaT cells (500 µL) at a concentration of 1 × 10⁵ cells/mL were seeded on top of the ENS specimens containing NHDF-cultured cells. After culturing for 30 days, the microplate-containing specimens were washed twice with PBS to remove unattached cells. The attached cells were fixed and viewed using SEM. Cells were fixed and dehydrated according to the protocol described by Fischer et al. [15] and Moran et al. [16].
3. Results and Discussions
3.1. Development of RSM Models
Table 2 lists the predicted fibre and defect diameter values and the corresponding experimental observations for each design point. Tables S1 and S2 show the results of the ANOVA. When the p-value is less than 0.05, a factor significantly affects the response. p-values are also used to assess the statistical significance of a model. The coefficient of determination (R2), which symbolises the percentage of total variability described by the regression model, was examined to verify the adequacy of the fitted models. Higher values of R2 and Adj-R2 indicate the extent to which the model matches the experimental results.
The lack of fit was calculated to assess the model-related errors by contrasting the residual error (caused by model error) with the pure error (resulting from replicated experiments). A significant lack of fit exists when the model fails to fit the experimental data effectively. The adequacy of the fitted models was confirmed in cases where the p-values for lack of fit were greater than 0.05, i.e., non-significant (NS).
The predictive model for the mean fibre diameter had a coefficient of determination (R2) of 98.58 and adj-R2 of 97.15. The model for the mean diameter of fibre defects gave 99.84% and 99.67% as the coefficient of determination (R2) and adj-R2. This shows that the models used were highly effective in describing the measured response. The RSM estimate adequately described the fibre smoothness variation and average diameter variation.
The lack of fit was computed and is reported in Tables S1 and S2 (Supplementary Files). The lack of fit for the two models is large (p > 0.05), confirming that both models fit satisfactorily. Negligible terms were eliminated from the models in order to create mathematical expressions with fewer parameters, comprising a sequence of linear, quadratic, and interaction terms for the real value of each parameter. These expressions are given in Equations (3) and (4):
where Y1 = predicted fibre diameter, Y2 = predicted fibre defect diameter, X1 = biopolymer amounts, X2 = voltage, X3 = flow rate, and X4 = SD
The adequacy of the model (Figure S1, Supplementary File) and verification test (Figure S2, Supplementary File) of the experimental design are discussed in the Supplementary File.
3.2. Determination of Optimal Conditions
The goal for mean fibre diameter was set at 170 nm, while the mean diameter of defects was set to minimization. To obtain optimal conditions at higher biopolymer contents, the boundary for the biopolymer (%) was selected from 30 to 50 v/v %. The boundaries of the other three variables, namely, the applied voltage, SD, and the solution flow rate, were set in the experimental range. The optimal conditions with a composite desirability value of 0.85 for a 170 nm average fibre diameter without defects are 30% biopolymer contents, 15.82 kV, 0.25 mL/h flow rate, and 105 mm spinning distance. Further electrospinning was performed as per the optimised conditions, and the agreement between predicted and measured responses was verified to prove the RSM model’s capacity for response prediction.
3.3. Influence of Processing Variables on Surface Topography
3.3.1. Effect of Biopolymer Contents
Electrospinning was carried out with the biopolymer content ranging from 10% to 50% (w/v) to assess the effect. The morphological characteristics of electrospun nanofibres with different biopolymer content are shown in Figure 3. Despite the levels of the other three processing factors, beads and spindles were produced in large numbers at a high biopolymer concentration (50% w/v), as shown in the images. However, the beads reduced and disappeared when the biopolymer content was decreased to 30% w/v and 10% w/v.
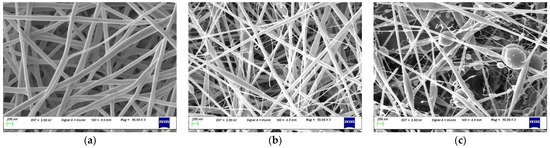
Figure 3.
SEM examples with different biopolymer content: (a) 10%, (b) 30%, (c) 50% (w/v).
Droplets formed in the electrospray can be connected to bead formation. When a high electrical force is applied to a low-molecular-weight solution, droplets can be formed [17]. Rayleigh proposed a theory to explain this phenomenon. Droplet size decreases when droplet evaporation occurs, increasing its surface charge density. Because the greater Coulomb repulsion overcomes the droplet surface tension due to the increased charge density, the droplet splits into smaller droplets [17,18]. The emerging jet of a high-molecular-weight solution (polymer solution) does not disintegrate into droplets. Instead, the jet is stabilized, creating a string of beads held together by a fibre. With increased polymer solution viscosity (Figure S3, Supplementary File), beads were reduced until only smooth fibres were formed [19]. The transformation of the bead-free fibre from spherical beads takes place via spindle beads [20].
Electrospinning solution containing a high amount (50% w/v) of less viscous biopolymer solution produced a fibre with spherical beads. When the viscosity of the electrospinning solution increased by decreasing the content of biopolymer solution (30% w/v), spherical beads started to disappear, giving rise to spindle-like beads in the fibre (Figure S3, Supplementary File). A 10% w/v biopolymer-containing solution could spin bead-free fibre in any given condition of the experimental design set.
Branching of the fibres appeared in the ENS at higher biopolymer contents (Figure 4). The unequal dispersion of the charge carried by jets may cause a split or branched fibres. Solvent evaporation and bending or elongation of the jet can cause the uneven distribution of the charges. Jets aim to lower their local surface charge density by splitting into several shorter jets or ejecting shorter jets off the surface of the major jets [21]. The conductivity of the electrospinning solutions increased (Figure S4, Supplementary File) with an increase in the wt.% of biopolymers. A uneven jet surface charge distribution may result from a highly conductive polymer solution [22]. As a result, in this study, there was a higher probability of jet branching for 30% w/v and 50% w/v. It should be mentioned here that Figure 4 shows negative values for biopolymers (%) due to the extrapolation, which is not realistic.
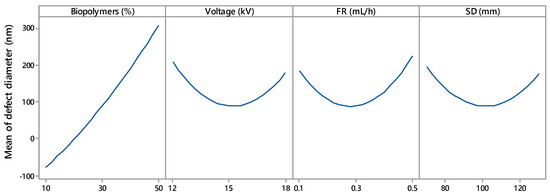
Figure 4.
Main effects of biopolymers (%), voltage (kV), flow rate (mL/h), and SD (spinning distance; mm) on mean defect diameter.
3.3.2. Effect of Voltage
Figure 4 shows the effect of voltage on fibre morphology. Fibre defects with larger diameter were produced at lower (12 kV) and higher (18 kV) voltages. The voltage range of 14 kV to 16 kV appeared to yield defects with the lowest diameter. Deitzel et al. and Zong et al. [19,23] reported similar voltages in electrospinning. Defect-free fibres require a jet emerging from a stable Tylor cone of a small drop held at the tip of the spinneret. A minimum voltage is required to establish a stable Tylor cone. With an increase in voltage, the Tylor cone becomes unstable and starts to recede; the volume of the drop also reduces. Elevated voltage may form an asymmetrical Tylor cone or start jet initiation inside the spinneret without any Tylor cone. The resulting fibres contain spindle-like beads and spherical beads. In this study, the absence of a stable Tylor cone at a voltage below 14.2 kV and above 15.8 kV contributed to the larger-diameter spindle-like beads and spherical beads. Figure 4 also reveals that lower voltage had a more adverse effect on the fibre morphology. At 12 kV, defects were generated with a mean diameter of 200 nm, whereas 18 kV corresponded to defects with a 170 nm diameter.
3.3.3. Effect of Flow Rate
Flow rates of 0.1 mL/h to 0.5 mL/h were investigated to understand the role of the flow rate in constructing the electrospun fibre morphology. The flow rate had an effect similar to voltage, except that a higher flow rate affected fibre morphology more adversely (Figure 4). At a flow rate of 0.1 mL/h, fibre defects with a diameter of 175 nm were observed. With the flow rate increase, the defect diameter started to decrease and became minimum in a range between 0.25 mL/h and 0.35 mL/h before increasing again. Larger defects with a diameter of 220 nm were observed for a higher flow rate at 0.5 mL/h. Thus, 0.25 to 0.35 mL/h was the optimum flow rate for the experimental settings. Below and above this range, the Tylor cone became less stable, producing fibre with defects.
When the flow rate is high, more polymer solution is delivered from the spinneret, and the fibre does not have the appropriate time to dry before reaching the collector. As a result, the risk of beaded fibre increases [24,25]. Zuo et al. [26] found a similar effect of flow rate on the morphology of electrospun fibres.
3.3.4. Effect of Spinning Distance
Figure 4 depicts the SD effect on the mean diameter of the defect. The mid-value (90 mm to 110 mm) of the experimental range of SD produced defects with the lowest diameters. The defect size was increased when the SD was lower than 90 mm or higher than 110 mm. Similar SD behaviour was reported by Geng et al. [27]. Geng et al. fabricated bead-free fibre at a certain range of SD; below and above that range, beads appeared in the fibre. If the distance between the collector and the spinneret is not wide enough, the jet from the spinneret tip may not have enough time to dry by evaporating solvent before reaching the collector. An accumulation of wet fibre may lead to poor fibre morphology [28]. A longer SD produces a weaker electric field, i.e., voltage per unit length (kV/mm), whereas a shorter SD creates a strong electric field. A strong electric force corresponds to increased elongation force and instability in the charged jet, causing bead defects.
3.4. Interaction among the Operational Variables
Surface and contour plots were used to predict the fibre diameter for an experimental setting within the design space, determine the best conditions for producing ENS with the desired fibre diameter, and evaluate the effect of electrospinning conditions on the mean diameter of the fibre. The surface plots for nanofibre diameter relative to the independent factors are shown in Figure 5. A curvilinear form is visible in the fitted quadratic model. The experimental area is curved, as seen in the counter and 3D surface plots, indicating that the optimum point is located inside the experimental region. The influence of biopolymer content on the fibre diameter is depicted in Figure 5a–c, demonstrating how the applied voltage alters fibre diameter. These results show that, despite the other electrospinning parameters remaining constant, a rise in the biopolymer solution concentration decreases the fibre diameter.


Figure 5.
Response surface and contour plots showing the effect of biopolymers (%), voltage (kV), flow rate (mL/h), and SD (mm) on mean fibre diameter.
An increase in the biopolymer contents from 10% w/v to 50% w/v caused a decrease in the nanofibre diameter from 220 nm to 120 nm. This may suggest that the biopolymer content interacts very poorly with the other three studied variables. The viscous nature of the electrospinning solutions probably explains this. Incorporating low-viscous biopolymers in the electrospinning solution with a more viscous PVOH solution lowered the viscosity. In general, a low-viscous polymer solution tends to yield fibres with finer diameters.
Figure 5a,d,e demonstrate how the applied voltage alters fibre diameter. Like the biopolymer contents, the higher voltage also generated finer fibre in each condition of the other electrospinning parameters. The diameter decreased very slightly with the voltage increase for any given biopolymer % (w/v). This means that the voltage did not affect the biopolymer contents in changing the nanofibre diameter. The effect of voltage on the diameter reduction was less prominent compared to the biopolymer. The voltage induced a maximum 50 nm fibre diameter thinning, whereas biopolymer contents performed double action in the same role. Again, it might be concluded that voltage also did not interact strongly with the other independent variables. The electric force can explain the behaviour of voltage on the fibre diameter. The polymer jet underwent strong electric force and stretching at higher voltage, producing finer fibre.
Figure 5b,d,f also show the impact of flow rate on the fibre diameter. These images show that fibre diameter increases with a flow rate up to a threshold limit (0.3 mL/h) while holding two other parameters constant. Above this limit, the influence of flow rate was reversed and fibres with thinner diameters were obtained as the flow rate increased. The solution volume and defect formation can explain this trend. More polymer solution was delivered at a higher feed rate, producing coarser fibres. After a certain limit, excessive delivery of the polymer solution introduced fibre defects in terms of beads. Those beads took much of the polymer solution in the jet, producing a finer fibre.
Figure 5c,e,f show the influence of SD. The effect of SD was not always the same for the whole range of corresponding variables, i.e., biopolymer contents, voltage, and flow rate. Fibre diameter decreased with an increase in the SD at the lower and higher ranges of the corresponding variables. In these figures, within the middle range of the three other variables, an increase in fibre diameter was observed with an initial increase in SD, followed by a subsequent decrease in fibre diameter. At low and high biopolymer contents, operating with long SD leads to the formation of finer fibres, whereas at medium biopolymer contents, the effect of SD is different. In that case, in this study, coarser fibre was generated for a certain increase in SD, and a further increase in SD finer fibre was obtained. The dual effects of SD can explain this pattern [29].
Using greater intervals encourages the production of coarser fibres due to a reduction in the strength of the electric field. Raising SD lengthens the fluid jet flight time, which leads to thinner fibres because a longer flight time is more likely to experience stretching [29,30]. The competition between these two effects affects the extent of fibre diameter variability.
3.5. Confirmation Test
Six additional experiments were conducted to verify the estimated model’s adequacy, including optimised conditions. The test conditions chosen were not used to generate the model but stayed within the design space. Figure 6 illustrates the prepared ENS. During the model establishment, ENS without beads was obtained with a maximum biopolymer concentration of 30%. As expected, the scaffold containing more than 30% biopolymers (MV3) shows the presence of some tiny beads. The other five ENSs shown in Figure 6 contain no beaded fibre. Table 3 illustrates the confirmation test design, response, and error percentage. The predicted values were observed to be fairly similar to the corresponding experimental data, which supports the model accuracy and sufficiency. The error percentage range is between 1.23% and 3.87%, which is less than 5% and acceptable.
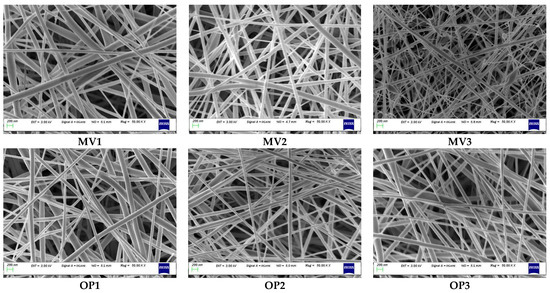
Figure 6.
SEM images of confirmation experiments: MV3 prepared with 35% had tiny beads; other ENS were free from beads as ≤30% biopolymer was used (bead found in ENS when biopolymer% more than 30%). All images were captured at 50,000 magnifications. MV = model verification, OP = optimised.
Table 3.
Results of confirmation test to validate the model developed and optimised for mean fibre diameter.
3.6. In Vitro Results
The optical density values obtained from the MTT-treated HaCat and NHDF cells were converted into viable cell percentages and are shown in Figure 7a and Figure 7b, respectively. The cell viability % increased with an increasing incubation time. More viable cells were observed on day 4 than on day 1, and the maximum number of viable cells was present on day 7. However, the mean cell viability (%) difference at different incubation time points was insignificant. Nanofibrous scaffolds were found to have excellent biocompatibility, with more than 93% of cells (p ≤ 0.05) able to proliferate in the wells after culturing for 7 days.
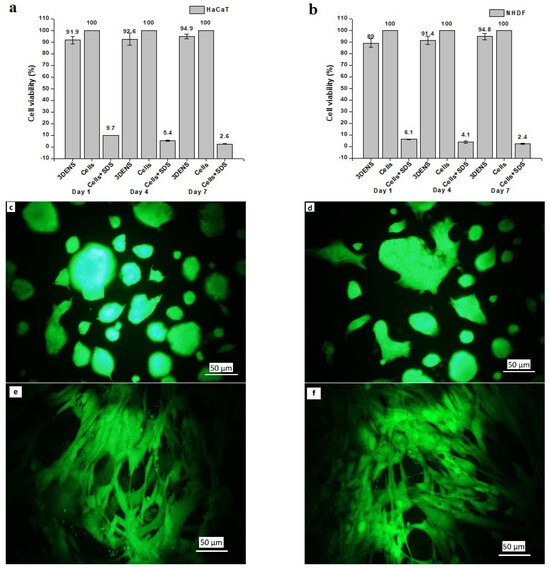
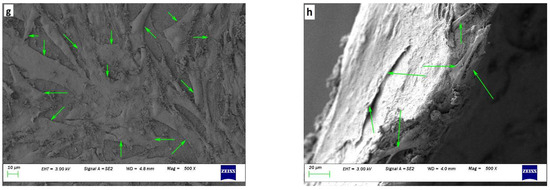
Figure 7.
Cytotoxic effect of (a) HaCaT, and (b) NHDF via MTT cell assay on days 1, 4, and 7 on ENS (n = 9); fluorescence images of (c) HaCaT on ENS, (d) HaCaT only, (e) NHDF on ENS, and (f) NHDF only after culturing for 7 days; SEM images of cell adhesion and attachment of HaCaT and NHDF cell lines co-cultured for 30 days on ENS: (g) surface view, and (h) cross-sectional view. Cells with normal morphology are indicated by green arrows.
Fluorescence micrographs of HaCaT and NHDF cells are shown in Figure 7c and Figure 7d, respectively, after culturing for 7 days. Cells were attached, and their morphology and viability were maintained. Most of the space of the cell well bottom was covered with attached and proliferated cells with regular morphology. No cytotoxic effect of prepared ENS on HaCaT and NHDF cell lines was observed via fluorescence microscopy. HaCaT cells were seen with their normal spread-out morphology (Figure 7c,d). Fibre-like NHDF cells were easily identified after culturing for 7 days (Figure 7e,f).
Figure 7g,h show scaffolds at a magnification of x500 after co-culturing HaCaT and NHDF for 30 days. Green arrows mark cells that attached, proliferated, and spread to a normal morphology. Many cells with wide cellular membrane bridges and flattened morphology were observed. There were almost no cells with deformed morphology present on the scaffolds. Moreover, some cells were found attached to the cross-section of the ENS (Figure 7h). Prepared ENSs had 0.4 mm thickness, which also facilitated cell attachment and proliferation.
4. Conclusions
The Box–Behnken design based on RSM successfully generated two models to achieve a bead-free nanofibrous scaffold for the first time using PVOH, chitosan, and keratin via electrospinning. The p-values of lack of fit for both models were much higher than 0.05, indicating satisfactory fitting. The higher R2 values for both models (98.58 and 99.84%) confirmed their effectiveness in accurately describing the measured responses, namely the fibre diameter and diameter of fibre beads. Diagnostic plots comparing the predicted and experimental values of fibre diameter and bead diameter displayed straight lines, further confirming the adequacy of the models. The assumptions underlying the quadratic models were examined and found to be valid, without any violations. Therefore, the developed models have the potential to be used in optimising the electrospinning process conditions of PVOH/chitosan/keratin.
Surface and contour plots were used to analyse the effects of the electrospinning settings on the fibre diameter and fibre bead. Both the contour and 3D surface plots exhibited curvature within the experimental range, indicating that the optimum point lay within the experimental domain. The optimum electrospinning conditions were identified by giving three-times more importance to bead-free fibre than finer fibre. The developed models and the identified optimum conditions were validated by conducting five additional electrospinning experiments, which yielded consistent results without any errors.
Biopolymers exceeding 30% were unsuitable for producing bead-free fibres, as the conductivity of the electrospinning solution increased with higher biopolymer concentrations. The optimised bead-free ENS demonstrated excellent biocompatibility with HaCaT and NHDF cell lines, as evidenced by over 93% cell viability (p ≤ 0.05). Both cell lines maintained their typical morphology and firmly adhered to the scaffold on the surface and in the cross-sections during the 30-day co-culture period. These findings suggest that this bead-free electrospun nanofibrous scaffold holds promise for applications in skin tissue engineering. Furthermore, there is potential for enhancing its functionality by incorporating antimicrobial agents, which could provide an alternative approach for managing chronic wounds.
Supplementary Materials
The following supporting information can be downloaded at: https://www.mdpi.com/article/10.3390/polysaccharides5020009/s1, Figure S1: SEM micrographs of the 3DENS; Figure S2: Normal probability plot for mean fibre and mean diameter of fibre defects; Figure S3: Residual versus fit plot for mean fibre and mean diameter of fibre defects; Figure S4: Residual versus order plot for mean fibre and mean diameter of fibre defects; Table S1: Estimated coefficients of the fitted quadratic polynomial equation for the response of mean fibre diameter; Table S2: Estimated coefficients of the fitted quadratic polynomial equation for the response of mean diameter of fibre defects.
Author Contributions
Conceptualization, M.T.I. and M.A.A.; methodology, M.T.I. and A.A.S.; validation, M.T.I.; formal analysis, A.A.S.; investigation, M.T.I.; writing—original draft preparation, M.T.I.; writing—review and editing, M.M., R.L. and M.A.A.; visualization, M.T.I.; supervision, M.M., R.L. and M.A.A. All authors have read and agreed to the published version of the manuscript.
Funding
This research received no external funding.
Institutional Review Board Statement
Not applicable.
Data Availability Statement
The original contributions presented in this study are included in the article/Supplementary Material; further inquiries can be directed to the corresponding author/s.
Acknowledgments
It is acknowledged that Mohammad Tajul Islam received a scholarship from the University of Otago and the Home Science Alumnae Todhunter Carpenter Trust for his PhD program. The Otago Micro and Nanoscale Imaging Unit (OMNI) at the University of Otago provided the facilities as well as scientific and technical support. The contribution of Cheryl Wilson to research discussions with the primary author is acknowledged.
Conflicts of Interest
The authors declare no conflicts of interest.
References
- Wang, X.; Ding, B.; Li, B. Biomimetic electrospun nanofibrous structures for tissue engineering. Mater. Today 2013, 16, 229–241. [Google Scholar] [CrossRef] [PubMed]
- Xue, J.; Wu, T.; Dai, Y.; Xia, Y. Electrospinning and Electrospun Nanofibers: Methods, Materials, and Applications. Chem. Rev. 2019, 119, 5298–5415. [Google Scholar] [CrossRef] [PubMed]
- Ho, Y.-S.; Sharmin, A.A.; Islam, M.T.; Halim, A.F.M.F. Future direction of wound dressing research: Evidence From the bibliometric analysis. J. Ind. Text. 2022, 52, 15280837221130518. [Google Scholar] [CrossRef]
- Madni, A.; Kousar, R.; Naeem, N.; Wahid, F. Recent advancements in applications of chitosan-based biomaterials for skin tissue engineering. J. Bioresour. Bioprod. 2021, 6, 11–25. [Google Scholar] [CrossRef]
- Ranjit, E.; Hamlet, S.; George, R.; Sharma, A.; Love, R.M. Biofunctional approaches of wool-based keratin for tissue engineering. J. Sci. Adv. Mater. Devices 2022, 7, 100398. [Google Scholar] [CrossRef]
- Marjani, M.E.; Hmtshirazi, R.; Mohammadi, T. CDI crosslinked chitosan/poly (vinyl alcohol) electrospun nanofibers loaded with Achillea millefolium and Viola extract: A promising wound dressing. Carbohyd. Polym. 2024, 336, 122117. [Google Scholar] [CrossRef]
- Aadil, K.R.; Nathani, A.; Rajendran, A.; Sharma, C.S.; Lenka, N.; Gupta, P. Investigation of human hair keratin-based nanofibrous scaffold for skin tissue engineering application. Drug Deliv. Transl. Res. 2024, 14, 236–246. [Google Scholar] [CrossRef]
- Islam, M.T.; Laing, R.M.; Wilson, C.A.; McConnell, M.; Ali, M.A. Fabrication and characterization of 3-dimensional electrospun poly(vinyl alcohol)/keratin/chitosan nanofibrous scaffold. Carbohyd. Polym. 2022, 275, 118682. [Google Scholar] [CrossRef]
- Sun, T.; Mai, S.; Norton, D.; Haycock, J.W.; Ryan, A.J.; MacNeil, S. Self-organization of skin cells in three-dimensional electrospun polystyrene scaffolds. Tissue Eng. 2005, 11, 1023–1033. [Google Scholar] [CrossRef]
- Carley, K.M.; Kamneva, N.Y.; Reminga, J. Response Surface Methodology; CMU-ISRI-04-136; School of Computer Science, Institute for Software Research, Center for Computational Analysis of Social and Organizational Systems, Carnegie Mellon University: Pittsburgh, PA, USA, 2004; pp. 1–36. [Google Scholar]
- Box, G.E.P.; Behnken, D.W. Some New Three Level Designs for the Study of Quantitative Variables. Technometrics 1960, 2, 455–475. [Google Scholar] [CrossRef]
- Minitab. Minitab 17.0; Minitab, LLC.: State College, PA, USA, 2018; Available online: https://www.minitab.com (accessed on 26 February 2024).
- Schneider, C.A.; Rasband, W.S.; Eliceiri, K.W. NIH Image to ImageJ: 25 years of image analysis. Nat. Methods 2012, 9, 671–675. [Google Scholar] [CrossRef] [PubMed]
- ISO 10993-5:2009; Biological Evaluation of Medical Devices—Part 5: Tests for In Vitro Cytotoxicity. 3rd ed. International Organization for Standardization: Geneva, Switzerland, 2009.
- Fischer, E.R.; Hansen, B.T.; Nair, V.; Hoyt, F.H.; Dorward, D.W. Scanning Electron Microscopy. Curr. Protoc. Microbiol. 2012, 25, 2B.2.1–2B.2.47. [Google Scholar] [CrossRef]
- Moran, P.; Coats, B. Biological Sample Preparation for SEM Imaging of Porcine Retina. Microsc. Today 2012, 20, 28–31. [Google Scholar] [CrossRef]
- Rayleigh, L. On the equilibrium of liquid conducting masses charged with electricity. Lond. Edinb. Dublin Philos. Mag. J. Sci. 1882, 14, 184–186. [Google Scholar] [CrossRef]
- Zeleny, J. The electrical discharge from liquid points, and a hydrostatic method of measuring the electric intensity at their surfaces. Phys. Rev. 1914, 3, 69–91. [Google Scholar] [CrossRef]
- Deitzel, J.M.; Kleinmeyer, J.; Harris, D.; Beck Tan, N.C. The effect of processing variables on the morphology of electrospun nanofibers and textiles. Polymer 2001, 42, 261–272. [Google Scholar] [CrossRef]
- Jiang, H.; Fang, D.; Hsiao, B.S.; Chu, B.; Chen, W. Optimization and Characterization of Dextran Membranes Prepared by Electrospinning. Biomacromolecules 2004, 5, 326–333. [Google Scholar] [CrossRef] [PubMed]
- Xu, X.; Jiang, L.; Zhou, Z.; Wu, X.; Wang, Y. Preparation and Properties of Electrospun Soy Protein Isolate/Polyethylene Oxide Nanofiber Membranes. ACS Appl. Mater. Interfaces 2012, 4, 4331–4337. [Google Scholar] [CrossRef] [PubMed]
- He, M.; Zhang, B.; Dou, Y.; Yin, G.; Cui, Y.; Chen, X. Fabrication and characterization of electrospun feather keratin/poly(vinyl alcohol) composite nanofibers. Rsc. Adv. 2017, 7, 9854–9861. [Google Scholar] [CrossRef]
- Zong, X.; Kim, K.; Fang, D.; Ran, S.; Hsiao, B.S.; Chu, B. Structure and process relationship of electrospun bioabsorbable nanofiber membranes. Polymer 2002, 43, 4403–4412. [Google Scholar] [CrossRef]
- Zargham, S.; Bazgir, S.; Tavakoli, A.; Rashidi, A.S.; Damerchely, R. The Effect of Flow Rate on Morphology and Deposition Area of Electrospun Nylon 6 Nanofiber. J. Eng. Fabr. Fibers (JEFF) 2012, 7, 42–49. [Google Scholar] [CrossRef]
- Yuan, X.; Zhang, Y.; Dong, C.; Sheng, J. Morphology of ultrafine polysulfone fibers prepared by electrospinning. Polym. Int. 2004, 53, 1704–1710. [Google Scholar] [CrossRef]
- Zuo, W.; Zhu, M.; Yang, W.; Yu, H.; Chen, Y.; Zhang, Y. Experimental study on relationship between jet instability and formation of beaded fibers during electrospinning. Polym. Eng. Sci. 2005, 45, 704–709. [Google Scholar] [CrossRef]
- Geng, X.; Kwon, O.-H.; Jang, J. Electrospinning of chitosan dissolved in concentrated acetic acid solution. Biomaterials 2005, 26, 5427–5432. [Google Scholar] [CrossRef]
- Fathy, M.; Kashyout, A.B.; El Nady, J.; Ebrahim, S.; Soliman, M.B. Electrospun polymethylacrylate nanofibers membranes for quasi-solid-state dye sensitized solar cells. Alex. Eng. J. 2016, 55, 1737–1743. [Google Scholar] [CrossRef][Green Version]
- Li, L.; Jiang, Z.; Xu, J.; Fang, T. Predicting poly(vinyl pyrrolidone)s’ solubility parameter and systematic investigation of the parameters of electrospinning with response surface methodology. J. Appl. Polym. Sci. 2014, 131, 40304. [Google Scholar] [CrossRef]
- Neo, Y.P.; Ray, S.; Easteal, A.J.; Nikolaidis, M.G.; Quek, S.Y. Influence of solution and processing parameters towards the fabrication of electrospun zein fibers with sub-micron diameter. J. Food Eng. 2012, 109, 645–651. [Google Scholar] [CrossRef]


Disclaimer/Publisher’s Note: The statements, opinions and data contained in all publications are solely those of the individual author(s) and contributor(s) and not of MDPI and/or the editor(s). MDPI and/or the editor(s) disclaim responsibility for any injury to people or property resulting from any ideas, methods, instructions or products referred to in the content. |
© 2024 by the authors. Licensee MDPI, Basel, Switzerland. This article is an open access article distributed under the terms and conditions of the Creative Commons Attribution (CC BY) license (https://creativecommons.org/licenses/by/4.0/).