Article

Analysis of the Substituent Distribution in Carboxymethyl-1,4-glucans on Different Structural Levels—An Ongoing Challenge

1
Institute of Food Chemistry, Technische Universität Braunschweig, Schleinitzstr. 20, 38106 Braunschweig, Germany
2
Saltigo GmbH, Chempark Building Q18-2, 51369 Leverkusen, Germany
3
IFF N&H Germany GmbH & Co. KG, August-Wolff-Str. 13, 29699 Walsrode, Germany
*
Author to whom correspondence should be addressed.
Polysaccharides 2024, 5(3), 332-357; https://doi.org/10.3390/polysaccharides5030022
Submission received: 18 June 2024 / Revised: 9 July 2024 / Accepted: 31 July 2024 / Published: 2 August 2024

Abstract

:
Carboxymethylglucans (CMGs) are widely used semisynthetic polyelectrolytes, e.g., for pharmaceuticals. They are produced in heterogeneous processes on activated starch granules or cellulose fibers. In contrast to neutral ether derivatives, a lower DS in the range, commonly between 0.6 and 1.2, is sufficient to achieve the water solubility of CM cellulose. The high proportion of unsubstituted domains, which could aggregate and therefore only swell and form gel particles but do not dissolve, places higher demands on the statistical distribution of the substituents. The knowledge of regioselectivity, essential for the interpretation of higher structural-level data, can be obtained by various methods, preferentially by CE/UV after hydrolysis. To study the distribution of substituents at the polymer level by mass spectrometric (MS) analysis, partial random depolymerization is required. Due to the ionic character and acid functionality, all the attempts of the direct depolymerization of CMG and further sample preparation suffered from bias, side reactions, and multiple ion formation in MS. Finally, the transformation of CMGs to the corresponding hydroxyethylglucans (HEGs) by the reduction of the esterified carboxy groups with LiAlH4 opened the window for quantitative oligomer MS analysis. While the CM amyloses were reduced quantitatively, the transformation of the CMC was only about 60% but without the formation of mixed CM/HE ethers.

Graphical Abstract

1. Introduction

Polysaccharides, mainly cellulose and starch, are modified in various ways to change their functionalities and properties and broaden their fields of application. It is now 100 years ago that in 1924 carboxymethyl starch (CMS) was produced for the first time [1], while carboxymethyl cellulose (CMC) was invented as early as 1918 and has been industrially produced since 1920 [2]. Etherification with chloroacetic acid or sodium chloroacetate under alkaline conditions in the presence of an organic solvent, for instance methanol (MeOH) or iso-propanol (2-PrOH), as a dispersing agent, yields O-carboxymethyl glucans (CMGs), which can be crosslinked in a subsequent step. The degree of substitution (DS) is commonly low for CMS, about 0.1–0.3, while for CMC it is in the range of about 0.6–1.2 for most applications and 90% in the range of 0.7–0.95. Depending on the reaction process, the degree of polymerization (DP), and the DS, different properties are observed for these polyelectrolytes regarding aspects such as water solubility, water adsorption, viscosity, and thixotropy. Carboxymethyl starch is widely used as a disintegrant in tablets or, for instance, as a constituent of wallpaper pastes. Carboxymethyl celluloses are also used for pharmaceuticals, but furthermore in the paper and textile industry, for oil drilling, in detergents, in cosmetics, and in food (E466) [2,3].
Polysaccharide derivatives are very complex mixtures. Via polymer analog modification, eight different constituents are formed as long as only one type of substituent is introduced as in CMGs; in addition to the residual glucose, the reaction yields three regioisomeric mono- and disubstituted units, respectively, as well as the fully modified 2,3,6-tri-O-methyl-glucosyl unit. In the case of equal access for all the glucosyl units in all the glucan chains, the distribution along and over the glucan chains at a particular DS will only depend on the regioselectivity of the reaction as long as the relative rate constants k2, k3, and k6 do not change over the course of the reaction [4,5,6]. This means that, for randomly substituted glucans, the distribution of substituents in the material, often discussed as homogeneous versus heterogeneous, can be very different in and over the glucan chains. It can be calculated assuming a weighted randomness, i.e., considering the different reactivities of the three OH groups in the glucosyl unit. In reality, the pattern will differ from this ideal model, which can be used as a reference to evaluate the analytical data. The typical deviations from randomness are caused by the local and temporal differences in the reaction conditions and consequently kinetics, resulting in a DS gradient (DS: degree of substitution). The differences in the early stages of the reactions can be leveled if the slower-reacting areas catch up but can also result in bimodal distributions with a certain, for instance poorly activated portion, left behind [5,6,7,8]. It is therefore obvious that the substituent distribution in the glucosyl unit is essential for the evaluation of the data obtained at higher molecular levels.

1.1. Substituent Distribution in the Glucosyl Unit

Very early attempts to obtain insight into the regioselectivity of the carboxymethylation regarding the three different OHs of the glucosyl units in positions 2, 3, and 6 used chemical reactions, selective for primary (6-OH) or diol structures (2,3-OH), to differentiate between these reaction sites, as reported by Croon and Purves [9]. However, by these methods, conflicting results were obtained, which did not enable the formation of any unequivocal conclusions. The best way to determine the substituent distribution in the glucosyl unit of acid-stable ethers is after complete depolymerization. In 1959, Croon and Purves reported on the preparative separation of all eight constituents from CMC hydrolysates on a carbon-Celite column with polarimetric detection [9]. CM-O-Glc (si, i = position of substitution) was separated as such and after the esterification and reduction with lithium aluminum hydride (LAH) to the corresponding hydroxyethyl ethers. However, the yield of the preparative entry was only 33% and the composition was considered as biased. Heinze and Koschella comprehensively reviewed the synthesis of CMS and CMC in various systems [2]. They reported a statistical distribution for common CMS and CMC and a limited DS achievable in one derivatization step.
Under hydrolysis conditions that are overly harsh, using sulfuric acid, ether cleavage has been observed by Heinze [10] (pp. 62–66). The limited stability of CM ethers is also demonstrated by the determination of the CM content of CMCs after cleavage with 40% H2SO4 under reflux as glycolic acid and applying a colorimetric method [11]. The 1H NMR [12] spectra of O-CM-α,β-Glc show resolved signals for the methylene groups of CM in the three positions i, which can be related to the summarized H-1 signals in order to determine the partial DS values xi (i = 2, 3, 6). Care must be taken to exclude the presence of glycolic acid, the by-product of carboxymethylation, from the solvolysis of the reagent since its methylene group overlaps with that of CM at O-6. In addition, the H-1 signals of all the 2-O-substituted glucosyl units are shifted downfield and can be used for the independent calculation of x2. Reuben and Conner [13] reported on a high-resolution 13C NMR spectroscopic assignment and the quantification of all the constituents of hydrolyzed CM for a set of CMCs in the DS range 0.55–2.17. The NMR method has been applied in several systematic studies [14,15,16,17,18]. In 2016, Kono et al. reported on an advanced NMR analysis and determined all eight constituents si of a set of CMCs in the continuous DS range 0.68–2.84 [19]. Complementary to the xi-analysis by 1H NMR spectroscopy, the mol fractions ci (i = number of CM/Glc = 0–3) have been determined by HPLC (high-performance liquid chromatography) of the hydrolyzed CMG on a cation exchange resin followed by a selective polarimetric detection of the chiral compounds or refractive index detection [20]. GLC–MS studies following HCl hydrolysis and the trimethylsilylation of CMC have been reported by Niemelä and Sjöström [21]. Due to the complex mutarotation, lactonization, and the presence of hemicelluloses, more than seventy products have been observed [21]. Much less complex gas chromatograms are obtained after the permethylation and reductive cleavage to 1,5-anhydroglucitol acetates, as reported by Zeller et al. [22]. However, the permethylation of CMC is challenging due to the low DS and functionality, especially with the increasing viscosity of the samples. The products of acid hydrolysis have also been directly separated by high-pH anion exchange chromatography with pulsed amperometric detection (HPAEC/PAD) under alkaline conditions [15,23]. The drawback of this method is the wide variation in the electrochemical response of the components, which also depends on the state of the PAD, and it is not linear. Currently, capillary electrophoresis (CE-UV) in a borate buffer system is the method of choice for quantifying the molar fractions of glucose and its charged O-CM ethers [17,24]. For UV detectability, a chromophore is introduced by the reductive amination with aminobenzonitrile (ABN). High separation efficiency is achieved by complexation with borate, which introduces a temporary charge. The charge state averaged over time strongly depends on the availability of the 1,2-diol groups, i.e., the non-substituted positions. The molar UV response only depends on the chromophore and is the same for all the constituents, as confirmed by the calibration with the isolated standards.
Commercial CMCs usually show preferred substitution at O-2, closely followed by O-6, and the lowest reactivity at O-3. However, depending on the conditions, the preferred reaction at O-6 can also occur and has been observed in the solvent system DMSO/TBAF (dimethylsulfoxide/tetrabutylammonium fluoride) with NaOH as a base [25]. If NaOH was applied in solid form, the reactivity of the two secondary OHs was even-leveled [2,3]. Starches commonly show a much higher preference for the most acidic 2-OH in kinetically controlled etherifications, and similar reactivity of O-3 and O-6 at very low DS levels, with 6-O-CM increasing faster than 3-O-CM AGU; thus, 2 > 6 > 3 [17,24,26].
The incomplete dissolution of CMG is an indicator of heterogeneities in the material, which in CMC also depends on the quality and hemicellulose content of the cellulose. For instance, Jardeby et al. investigated the nature of the undissolved particles of CMC. The residuals were shown to consist mainly of swollen cell wall parts and some whole wood cells from sulfite pulp [27]. In another study, the thin-walled fibers were found to have lower DSs than the thick-walled fibers, probably due to the slower diffusion of the reagents into the denser thin fibers [28]. Olaru et al. studied the influence of the process conditions, especially the impact of organic co-solutes such as 2-PrOH, ethanol (EtOH), acetone or benzene, or mixtures thereof on the efficiency and DS distribution. They correlated the kinetics of the overall reaction with the changes in the supramolecular structure, studied by X-ray diffraction [29,30,31]. Stigsson et al. reported on a more even activation and consequent carboxymethylation of the cellulose with EtOH compared to 2-PrOH [32]. Mann and Fink systematically studied the stepwise structure-selective carboxymethylation of cellulose at low-alkali concentrations, insufficient to swell and interrupt the crystalline regions of the cellulose. By 13C CP/MAS-NMR (cross-polarization magic-angle-spinning nuclear magnetic resonance) spectroscopy, they could differentiate the crystalline and amorphous structures and correlate their results from further analysis with respect to the structure selectivity of their procedure [33].
In the case of starch granules, the supramolecular structures of amylose and amylopectin with their highly ordered and less-ordered layers play a role as well as the existence of channels. The latter are also important for the rate of diffusion of the reagents into and over the granule versus the rate of reaction [34,35].

1.2. Analysis of the Intact Polymer

To obtain insight in the CM distribution across the material, the CMCs in a DS range of 0.69–1.64 have been analyzed directly by CE-UV in an alkaline borate buffer and detection at 196 nm [36]. With increasing DS, the migration time increases and the sample profiles became narrower, but the correlation was not linear. The chromatographic separation of CMCs according to their chemical composition distribution (DS distribution) and in the second dimension according to the size by SEC (size exclusion chromatography) was reported by Shakun et al. [37,38]. Two sets of CMCs in a DS range of 0.45–1.55, one from Avicel (DP ≈ 160) and the other from cotton linters (DP ≈ 1400), could successfully be distinguished in a 2D plot. The asymmetry of the peaks may indicate a non-random DS distribution over the material. The CMC blends with different DPs and/or DSs were separated; the method, however, is limited to high-molecular-weight samples. For the lower average DP CMC from Avicel, beside the DS, also the molar mass influences the separation in the first dimension.

1.3. Substituent Distribution along and across the Polysaccharide Chains

In order to gain insight into the closely related substituent distribution along and across the polysaccharide chains [5] and thus ultimately over the material, the glucan derivatives are usually partially depolymerized in a selective or random manner, respectively [6]. The selectivity is achieved by enzymes and is difficult to interpret unless the regioselectivity of the etherification and the specificity of the enzymes are known. Early work by Wirick [39] and Gelman [40] focused on the amount of glucose released by the enzymatic degradation of CMCs with a given DS. The fractionation of the enzymatically degraded CMCs by SEC and the subsequent HPAEC analysis of the constituents provided more insight into the molecular weight distribution, DS, and composition and enabled the direct comparison of the materials from different synthetic processes [14,41,42]. Based on the enzymatic digestion with an endo-glucanase/exo-glucosidase preparation, Stigsson et al. [32] found that CMCs with the same DS had different, probably less regioselective and more uniform, substituent distributions when prepared with EtOH as the co-solvent in the slurry compared to i-PrOH. Finally, Enebro et al. [43,44,45] reported the application of purified endoglucanases (EGs) instead of a complex mixture of enzymes from Trichoderma. Further structure elucidation of the oligomeric degradation product revealed the particular tolerance of four EGs with respect to the −1/+1 positions of a glucoside cleavage. While 2-O-substitution at the newly formed reducing end (position −1 of the active complex) was not tolerated at all, two EGs (Cel7B and Cel45A) tolerated 3-O-CM and two 6-O-CMs (Cel5A and Cel74A), respectively. The latter accepted all three monosubstituted moieties in position +1 (the newly formed non-reducing end), while Cel7B and Cel45A could only handle two regioisomers of this group [43,44]. Already from these results, it is obvious that the extent of the degradation is not simply a measure of the homo- or heterogeneity of the substitution. However, the application of specific enzymes has high potential and can provide valuable information regarding the overall picture.
For CMS (DS 1.25–1.50), it was demonstrated that the portion of unsubstituted glucose present in the CMS, which was released by exhaustive enzymic digestion, was much higher for a CMS prepared at a high pulp density (42%), accompanied by a strong deviation from the Spurlin model for the weighted random substitution [4]. From those CMSs, which dissolved completely in water to clear solutions, only tiny amounts of glucose were released [24]. A decrease in the viscosity with increasing enzymic degradability, evaluated by the average reduction in the molecular weight of the CMSs of similar DSs after digestion, was found by Zhang and Wu [46].
The idea behind the ‘random depolymerization approach’ is to quantify the distribution of the number of substituents at the oligosaccharide level—usually by mass spectrometry (MS)—and to compare it with the random distribution of the glucosyl constituents along and over the glucan chains [5,6,7,47,48,49,50,51]. The latter is calculated on the basis of the molar composition of the eight monomeric constituents, again demonstrating the importance of accurate data at this level. This method requires a nonselective hydrolysis process that produces oligosaccharide ether mixtures representing the original glucan derivative. The hydrolysis kinetics have been studied for methylcellulose (MC), and permethylated hydroxyethyl methylcellulose (HEMC) and ethylcellulose (EC) with respect to the possible influence of substituent position. Small substitution pattern-dependent differences in the rate constants were found, the lowest for methylated HEMC, but these were negligible as long as the material was well-dissolved [52,53]. Lewis acid-promoted depolymerization [22] requires the permethylation of the CMG, and reduction by triethylsilane (TES) would also prevent further labeling.
In addition to these challenges regarding proper sample preparation, the final MS measurement to quantify the DS/DP distributions is also a source of bias. Depending on the instrument used, discrimination may occur in the ionization process due to different chemistry and size, or in ion transport and storage (in the case of an ion trap), favored by differences in the m/z [54]. While the substituent profiles of deuteromethylated or 13C-methylated MCs can be determined with high accuracy [54,55], hydroxyalkyl ethers require a segmented measurement method under optimized conditions to enable correct quantification by electrospray ionization-ion trap-mass spectrometry ESI-IT-MS [56].
Due to the complexity of the structural characteristics of CMC and CMS, it is not surprising that the analytical work on different materials using different methods does not simply add up to a consistent picture. Each method has its strengths and limitations, and, in the absence of a defined reference material, the results cannot be independently verified. As a result, the interpretation is often more or less speculative, and the interpretation of the results can easily be exaggerated.
After establishing the CE method for the monomer analysis of CMG, we began to develop an MS method for the analysis of the substituent distribution over and across the polymer chains. In the following, we describe and discuss the attempts to produce representative oligosaccharide derivatives from CMCs for MS analysis, with the eventual realization that a transformation of CM glucans into permethylated HE glucans prior to partial depolymerization is a prerequisite for the correct quantitative analysis of representative oligosaccharides.

2. Materials and Methods

2.1. Materials

Unless otherwise noted, reagents and solvents were purchased from Sigma/Aldrich and were of the highest purity available. Acetic anhydride, propionic acid anhydride, methoxyacetyl chloride, perchloric acid, boric acid, and NaCNBH3 were from Fluka. MeOH-d4 was from Deutero, dry MeOH (water ≤ 0.005%) from Merck. Dialysis tube, MWCO (molecular weight cut-off) 12.000–14.000, was from Carl Roth, membrane filter, pore size 0.45 μm from Sartorius. For ESI-MS, MeOH of LC–MS grade was used. Water was deionized to a conductivity (Nanopure®, Werner, Leverkusen) ≤17 µS/cm. Ammonium acetate for ESI-MS (>99%) was from VWR Chemicals. Na-chloroacetate and MeI were from Alfa Aesar. Trifluoroacetic acid (TFA) was from Riedel De Haёn. Aminobenzonitrile (98%) and 2 m trimethylsilyl diazomethane (TMS-DAM) in Et2O were from Aldrich.
Carboxymethylcelluloses, CMCs: (DS values provided by the supplier in brackets) CMC-0.88 (0.86), CMC-0.85 (0.84), CMC-0.94 (0.92), and CMC-0.96 (0.99) were provided by former Dow-Wolff cellulosics (DWC). They were prepared from softwood. CMC-0.73 (0.78), CMC-0.75, CM-0.82 (0.85), and CMC-1.26 (1.22) were purchased from Sigma and are prepared from wood pulp.
Carboxymethylamyloses, CMAs, were prepared as follows: CMA-1.06: Amylose (from corn) (100 mg) was suspended in 2.5 mL 2-PrOH and heated to 60 °C under vigorous stirring. Conc. aqueous NaOH (2 eq/AGU) was added dropwise. After 20 min., Na-chloroacetate (ClCH2COONa, 2 eq/AGU) was added as aqueous solution. Final ratio of 2-PrOH/H2O = 4:1 (v/v), 3.13 mL. After 3 h at 60 °C, the mixture was cooled down, diluted with H2O until full dissolution, and then dialyzed against water and freeze-dried. Yield: 131 mg. CMA-0.65 and CMA-0.64 were prepared accordingly from 5 g corn amylose in a total volume of 150 mL 2-PrOH/H2O, 4:1 (v/v). In the case of CMA-0.65, 1 eq/AGU NaOH and 1 eq/AGU ClCH2COONa were applied. Isolated material was 4.52 g. For CMA-0.64, 5.2 eq/AGU NaOH and 2.3 eq/AGU ClCH2COONa were applied and 4.74 g material was recovered. ATR-IR: 3312 cm−1 (OH), 1588 cm−1 (C=O, Na-CM), 1000–1200, max. at 1015 cm−1 (C-O), 852 cm−1 (α-glucosidic linkage, C1-group vibration).
Monomer compositions (si distributions) and DS of all CMGs were determined by CE/UV [17]. Data are provided in the Supplementary Materials, Tables S1 and S2 (CMC) and S3 (CMA).
All CMGs were assigned according to their DS as determined by CE/UV.

2.2. Capillary Electrophoresis

A P/CAE MDQ from Beckman, Munich, Germany, and a 7100 Capillary Electrophoresis, Agilent Technologies, Inc., Waldbronn, Germany, were used. Fused silica capillary: L 60–62 cm, I.D. 50 μm, 25 °C, injection: hydrodynamic, 40 mbar, 10 s, 23–28 kV, DAD-Detection at 285 nm, band width 10 nm. Buffer: 150 mM borate, pH 10.5.
Sample preparation: Briefly, perchloric acid hydrolysis, neutralization with KOH, and reductive amination with ABN was performed as described [17].

2.3. Partial Depolymerization of CMG and Acylation for MS Analysis

2.3.1. Partial Methanolysis

A portion of 2 mg CMC are degraded with 1 mL 1.5 M water free methanolic hydrochloric acid in a 1 mL V-vial by stirring at 90 °C for 60 to 90 min in a heating block. After cooling to room temperature, HCl is removed by co-distillation with methanol under a stream of dry nitrogen. Methanolic HCl is freshly prepared from dry MeOH and acetyl chloride under cooling.

2.3.2. Acylation of Methanolysates

A portion of 200 µL acetic or propionic acid anhydrides, or 300 µL of butyric acid anhydride, respectively, and 50 μL pyridine are added to the dried methanolysate. The reaction mixture is stirred for 3 h at 90 °C. The sample is cleaned up by washing the organic phase (CH2Cl2) with aqueous saturated bicarbonate solution, 0.1 M cold HCl, and distilled water. After separation and drying of the organic phase, samples are filled up to 1 mL with CH2Cl2. In the case of methoxyacetylation, methanolysis was performed with MeOH-d4 and acylation with methoxyaccetyl chloride/pyridine.

2.3.3. Partial Hydrolysis

CMC (10 mg) are stirred and heated to 95 °C in a 1 mL-V-vial with 1 mL 2 M aq TFA for 2 h. The sample is co-distilled with toluene and evaporated to dryness under a stream of nitrogen.

2.4. Reduction of CMG Zu HEG

2.4.1. Transformation of Na-CMG to H-CMG

Dialyzed and freeze-dried CMG is dispersed in acetone and treated with 6 m HCl under stirring for 30 min, washed until free of chloride, and dried as described [57]. Alternatively, 1–2 g of Na CMG is dialyzed against 0.1 M HCl, 0.05 M HCl, and finally water. The product is checked by ATR-IR spectroscopy: C=O, Na-salt: 1590 cm−1, C=O, acid: 1725–1730 cm−1.

2.4.2. Methyl Esterification of H-CMG

The freeze-dried H-CMG (about 300 mg) is dispersed in dry MeOH (4 mL/mmol CM) and DMAc (15 mL/mmol CM) under nitrogen; 1.3 Eq/mmol CM of 2 M TMS-DAM in Et2O is added in four portions in intervals of 30 min. After 24 h at 15 °C, solvents and reagents are removed in vacuum.

2.4.3. Acetylation of CMG Methyl Esters

To the dried CMG methyl esters, pyridine (1–2 mL/100 mg material) and acetic anhydride (3–4 mL) are added and the mixture is stirred overnight at 70 °C. After partial evaporation, the product is isolated by dialysis against MeOH and freeze-dried. Yields, estimated under the assumption of full transformation, are between 80 and 100%, except CMA-0.64 with 61%. Products are checked by ATR-IR spectroscopy: disappearance of ν(OH); C=O (Ac) 1739 cm−1 (not resolved from CM-OMe). 13C CP/MAS NMR spectra were recorded from CMG-0.64 and CMC-1.26 after esterification and acetylation by Dr. Bacher, from the University of Natural Resources and Life Sciences, BoKu, Vienna, Austria.

2.4.4. Reduction of CMG-Methyl Ester/Acetate With LAH

To the dry CMG CMOMe/Ac (scale 33–140 mg) under nitrogen, cooled to 5–9 °C, dry dichoromethane (1 mL/10 mg) is added. LAH (1 m in Et2O, 1.1 eq/ester) is added dropwise. The suspension is stirred at 5–9 °C for 20 h. In some entries, a second portion of LAH was added. The reaction is quenched, and DCM is removed in a stream of nitrogen.
Work-up A: The sample is neutralized with HCl, stored over night, and centrifuged. The supernatant is separated, dialyzed against water, and freeze-dried. The solid residue is dialyzed against 0.05 M HCl, finally against water. Yields of soluble fraction: CMC-0.82: 20%, CMC-1.26: 40%, CMA-0.65: 92% CMA-0.64: 65%. The insoluble material was still contaminated by Al- and Li-salts. ATR-IR spectroscopy showed complete reduction of soluble fractions, incomplete reduction of insoluble CMC (for details, see text), and no glucan content for CMA.
Work-up B: The entry is dissolved in cold 2.4 M HCl, dialyzed at 6 °C against 2.4 M HCl for 30 min, then against 1 M HCl for 30 min, followed by dialysis against 0.1 M HCl for 30 min., and finally against water until neutral. Apparent yields: CMA: 94–105%, CMC: 119–124%, calculated for full transformation. Recoveries indicate residual contamination with salt, probably Al salts of residual CM in CMC. ATR-IR spectra are recorded to check for disappearance of ν(C=O) and compared with a spectrum of HEC.

2.5. ESI-MS Analysis

ESI-IT-MS analysis of CM-COS was performed on an Esquire LC 00081 (Bruker Daltonics, Bremen, Germany) in positive mode. Software Bruker Data Analysis Esquire LC. Capillary voltage = 4.5 kV, end plate offset −500 V, capillary exit 120 V, skimmer 1 40 V, skimmer 2 10 V, dry gas nitrogen with 4 L/min at 300 °C, and nebulizer gas nitrogen 10 p.s.i. Sample application by syringe pump, flow 190–220 μL/h.
Fully reduced CMA or CMC fractions were permethylated, partially hydrolyzed, and labeled with mABA as has been described [56]. ESI-MS analysis of HE-OS was performed on an HCT ultra ETD II (Bruker Daltonics, Bremen, Germany) in negative mode. Software Bruker Compass Data Analysis 4.0. Capillary voltage 3.5 kV, end plate offset −500 V, skimmer −40 V, Oct 1 DC −8 V, Lens1/Lens 2 5V/60 V, Oct RF 200 Vpp, dry gas nitrogen 6 L/min, 300 °C, and nebulizer gas nitrogen 10 psi. ICC target 70.000, max. acc. time 200 ms. The measurement and evaluation method is described in detail in [56]. The heterogeneity Hi parameter for each DP i is calculated according to Hi = √Σ(Δci)/(n − 1).

2.6. ATR-IR Spectroscopy (Attenuated Total Reflection-Infrared)

Alpha FT-IR Spectrometer, Bruker Daltonics, Bremen, Diamond-ATR, Software Opus 7.0, Bruker Optik GmbH. (Ettlingen and Leipzig, Germany)

3. Results and Discussion

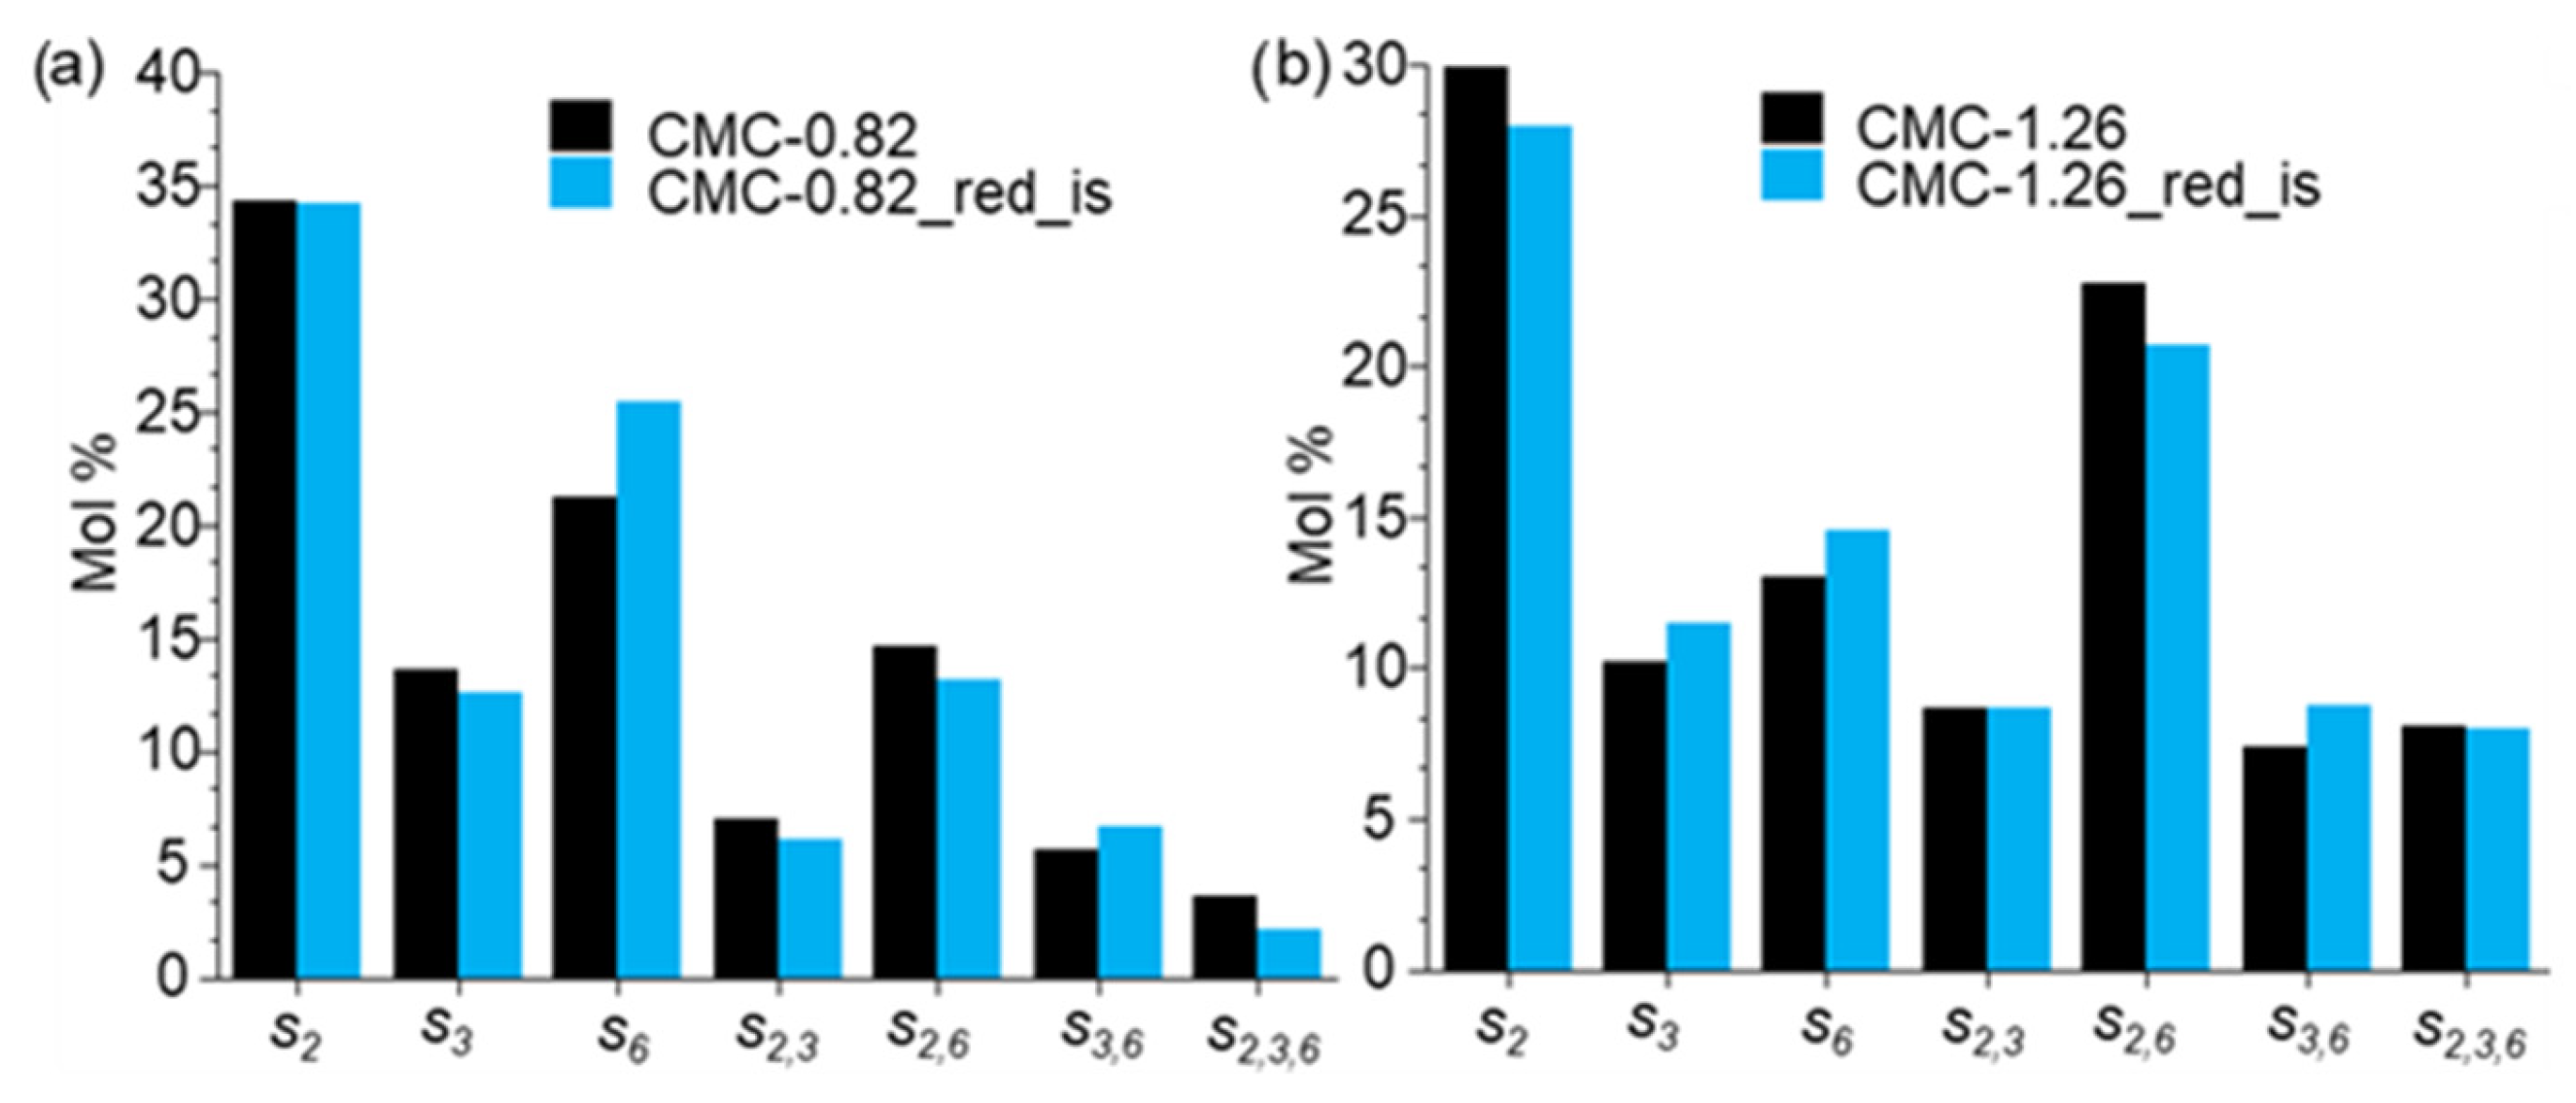
3.1. Distribution of CM in the Glucosyl Units

The monosaccharide composition of all the CMGs used in this study was analyzed by CE/UV as described. The mol percentage of each constituent si (i = position of the CM in the glucosyl unit) and its comparison with the statistic models of Spurlin and Reuben, respectively, are provided in the Supplementary Materials (Tables S1–S3). The models are explained in detail by Reuben [18]. It has been discussed in the literature [2,9,13] whether the negative charge of the carboxymethyl function reduces the probability of the substitution in the adjacent position, i.e., O-3 in 2-O-CM (or vice versa), due to the electrostatic repulsion of the negatively charged deprotonated glucan backbone and the reagent. Croon and Purves found reactivities in the order of 6 > 2 > 3 and less 2,3-CM substitution than expected. From this, they concluded such a neighbor effect [9], while Heinze and Koschella [2] as well as Reuben and Conner did not find any influence [13]. Kono et al. studied the substitution pattern development over a wide DS range of CMCs, suggesting a vicinal effect that was interpreted as steric [19]. Indeed, for the set of CMCs provided by DWC, the deviation from the calculated distribution, expressed by the heterogeneity parameter H1, is always smaller for the Reuben model than for the Spurlin model, which takes such an effect into account. Compared to the Spurlin model, the mol fraction of 2,3-CM-Glc (s23) is slightly diminished, while 2- (s2) and 3-CM-Glc (s3) are enhanced. Complementarily, 6-CM-Glc (s6) is reduced since 2,6-CM-Glc (s26) and 3,6-CM-Glc (s36) are preferentially formed in the consecutive etherification step. For CMC-0.88 and CMC-0.85 from this set of CMCs, the difference in H1 is small: 0.60 (Reuben) compared to 0.70 (Spurlin) and 0.51 compared to 0.68, respectively. The probability of 3-substitution is reduced by only 2% by O-2 carboxymethylation. For CMC-0.94 and CMC-0.96, the difference is more pronounced: 0.29 (Reuben) compared to 0.80 (Spurlin) and 0.25 compared to 0.66, respectively. The probability of 3-substituion is reduced by 3%.
As in the oligosaccharide (OS) analysis, one can also compare the ci (i = number of CM) fractions to separate the regioselective effect in the glucose from the impact of heterogeneity on the polymer level. For CMC-0.94 and CMC-0.96, we see nearly no difference: 0.60/0.58 und 0.40/0.45 (Spurlin/Reuben), respectively. In contrast, CMC-0.88 and CMC-0.85 show large differences in H1, i.e., 0.39/1.09 and 0.43/1.07, respectively (see Figure S1). This indicates that the heterogeneity in these CMCs is not visible in the Spurlin model because it is compensated by the regioselective neighbor effect.
For the second set of CMCs, purchased from Sigma, H1 is almost the same for the Spurlin and Reuben models. Only for CMC-1.26 is the deviation for si reduced from 1.52 (Spurlin) to 1.04 (Reuben) and the probability of 3-substitution is reduced by 7%. However, looking at the si values, we see the typical decrease in s6 and s23 for CMC-0.73 and CMC-0.82 (Figure 1b), and, not surprisingly, it is much more pronounced for CMC-1.26 (Figure 1a). But, only the latter s2 and s3 are enhanced, while the patterns of CMC-0.73 and CMC-0.82 are characterized by a general heterogeneity (for CMC-0.73, see Supplementary Materials, Table S2 and Figure S2). CMC-0.82 shows low H1 values (si) (0.87/0.88) and no evidence of a neighborhood effect (Figure 1b). In conclusion, the data support the possibility of a charge effect that reduces the rate constant for the etherification adjacent to a CM group. However, depending on the stock consistency or the salt concentration, the charges may be more or less masked, shielding this impact. In addition, the effect is superimposed by the overall heterogeneity of the substitution, i.e., the heterogeneity across the material [5]. The latter is indicated by increased amounts of low- and high-substituted glucosyl units. Since the neighbor effect only affects the distribution in the glucosyl unit, and since it causes deviations from the statistics that are opposite to the heterogeneity effect, it can be better recognized after applying the Reuben model. This is clearly visible for CMC-1.26 considering the ci fractions (Figure 1a). In contrast, for CMC-0.82 H1 (ci) for Reuben and Spurlin, it also makes no difference (Figure 1b).

3.2. Distribution of CM over and across the Polysaccharide Chains

3.2.1. Methanolysis

In a first approach to generate a representative mixture of oligosaccharides, the direct partial depolymerization of the first set of CMCs in the DS range of 0.85–0.96 was investigated. Methanolysis with dry MeOH/HCl was chosen in order to simultaneously convert the carboxyl groups into neutral methyl esters/methyl cellooligosaccharide glycosides (COSs) (Figure 2). The motivation was to avoid the lactonization of CM with the adjacent free OH, as well as the salt formation of the carboxyl functions and thus the formation of multiple types of ions in the ESI process.
The ESI-IT-MS of the sodium adducts of the obtained COS showed the n(CMOMe) distributions/DPs, which were shifted tremendously to higher DSs (for instance, apparent mean DS 1.41 (DP2) and 1.43 (DP3) at DSCE 0.85, or 1.62 (DP2) and 1.64 (DP3) at DSCE 0.96). The unsubstituted COSs (n(CM) = 0) were completely suppressed, and obviously the lower-substituted constituents were also discriminated (Figure 3).
The mass increment for each additional CMOMe group is 72; i.e., the entire Δm/z range for the evaluation of DP2 is already 432 (m/z 379–811), and it increases further with DP. In addition, the chemical differences and cation coordination properties between OH and CH2(C=O)OCH3 are significant and obviously influence the equilibria between the surface and the inner part of the droplet in the ESI process and the consequent relative ion yields [55,58,59]. Thus, in order to reduce Δm/z/DP and to level the chemical differences in the analytes, we applied various acylations to CMOMe-COS: acetylation (Δm/z to CMOMe = 30), propionylation (Δm/z to CMOMe = 16), and butyrylation (Δm/z to CMOMe = 2). The ESI-IT-MS measurement showed the expected shift in the profiles towards lower DSs compared to the methanolysate, as is obvious in Figure 3 for CMC-0.96. However, the effect was small and the apparent mean DS values for DP2 were still much too large. No clear trend for the type of acylation was found when four different samples were studied (compare the CM profiles for CMC-0.88 in the Supplementary Materials, Figure S4). The proportion of n(CMOMe) = 0 within DP2, which was expected to be about 9% (CMC-0.96, c0 30 mol%), was still close to 0 for the acylated COS. This indicates that CMOMe is much more efficient for sodium complexation than the glucose esters. The dilution of the methanolysate with MeOH for the MS measurement shifted the profile to a lower DS, indicating that concentration-dependent suppression effects occur (see Figure S5) [59]. Therefore, methoxyacetate was introduced as a hopefully more suitable protective group. Methoxyacetate (MeOAc) is isomeric to CMOMe; i.e., it introduces the same type and number of atoms in the free glucosyl hydroxyl positions, only in a different order. Especially, the additional oxygen was considered to be supportive. In order to maintain a mass difference between the substituted and originally unsubstituted positions, methanolysis accompanied by CM esterification was performed in CD3OH/HCl. The Δm/z between CH2(C=O)OCD3 and (C=O)CH2OCH3 is 3, a perfect difference for quantitative MS and spectrum evaluation [54]. The CMdistribution for DP2 is also shown in Figure 3. Surprisingly, however, the higher carboxymethylated COSs were still heavily overestimated. For CMC-0.96, the apparent DS derived from DP2 was 1.23. The unsubstituted COSs were at least detected now.
In a comprehensive study of the defined CMOMe-, MeOAc-, or mixed substituted diols as model compounds, supported by DFT (density functional theory) calculations including CM-Glc and cellobioses [60], we found that the sp2 and sp3 oxygens in the CMOMe residues were much more appropriately positioned and oriented to form stable sodium adducts than MeOAc, where the better donors, the carbonyl groups, could not contribute. The pronounced ion suppression of the MeOAcisomers occurred above the saturation of the droplet surface in ESI [60]. From these results, it was no longer surprising that even methoxyacetylation could not overcome the strong discrimination effects observed for CMOMe/OH-COS. This effect is more and more leveled when n(CMOMe) increases with increasing DP, where the low-substituted COS becomes less and less important and the analytes become more similar with respect to their ionization properties.
In addition to the sodiation bias, however, the heterogeneous methanolysis is another critical step. CMC is not soluble in methanol. While the reaction proceeds, the material is subsequently dissolved, but a small insoluble residue is maintained. More comprehensively, we analyzed the dissolved and the insoluble fractions of two commercial CMCs (DSCE 0.75 and 0.77) from a methanolysis time course study [61]. The dissolved fraction showed an increased but nearly constant DS and only COSs of low DP, while the decreasing insoluble fraction showed a decreased DS and a continuous enrichment in the unsubstituted glucosyl moieties. The substituent distribution in the degraded part was in agreement with the Spurlin model. In contrast, the insoluble residue clearly deviated from a random substitution due to an excess of unsubstituted glucosyl moieties, probably poorly activated and from very low-substituted domains. From these results, it was evident that methanolysis is not applicable for partial random degradation. It prefers higher-substituted areas, and, from the heterogeneous material, just the interesting parts are lost. In addition, methanolysis blocks the carbonyl function at the reducing end of the COS, preventing any labeling to overcome the sodium complexation bias described above.

3.2.2. Production of CM Oligosaccharides by Acid Hydrolysis of CMC and Labeling

Alternatively, partial hydrolysis of CMC was performed. Due to the—compared to other cellulose derivatives—relatively low DS of the CMC, it must be considered that aggregates of unsubstituted domains may exist as a part of fringed micelles [62]. These are hard to access and require swelling in oxygen-rich concentrated acids to interrupt such supramolecular structures. H2SO4 (72%) and HClO4 (70%) have been used for this purpose and subsequently diluted and heated to achieve full depolymerization [16]. After hydrolysis, the solutions are neutralized and the acids removed as BaSO4 or KClO4. This step reduces the likelihood of the lactonization of 2-O-CM and 3-O-CM, which is promoted by water removal in the presence of acid. However, lactones have been observed after sulfuric acid hydrolysis but not after perchloric acid treatment [10]. Considering the potential ether cleavage by sulfuric acid and poorer yield of the hydrolysis as reported by Saake et al. [16], perchloric acid hydrolysis is the method of choice for total hydrolysis. However, due to the relatively high solubility product of KClO4 (KL = 2.9 × 10⁻⁵ at 20 °C), only the salt concentration may be critical for further analysis by electrospray ionization mass spectrometry (ESI-MS). In the kinetic studies of the hydrolysis of neutral cellulose ethers regarding water and water/acetone, it was observed that the stereoelectronic effects of the substituents on the rate constants are marginalized in water, the solvent, in which the solvation and thus stabilization of the oxocarbenium ion intermediate is the best [52,53]. However, the impact of the substituents was larger for MC with Me/OH compared to fully alkylated mixed ethers.
In order to avoid the KClO4 salt load, 2 M of trifluoroacetic acid (TFA) was applied (90 °C, 3 h). Enebro and Karlsson [63] reported on the MALDI-ToF-MS measurements of the TFA hydrolysates of CMC. They observed overly large DS values, decreasing with DP and leveling at about the average DS of the CMC at DP6. Ammonium sulfate was added as a proton source to produce the COOH form and avoid partial salt formation but to favor only a single sodiation in the ESI process. However, in our ESI measurements, the formation of multiple ions, such as ammonium and potassium adducts, could not be completely suppressed. Although the average DS calculated from the CM distribution profiles was now more similar to the average DS of the CMC, sometimes even lower, multiple ion formation with different preferences regarding n(CM) and the polar character of the analytes caused poor reproducibility. The ESI spray stability and signal intensity are poor in water or high-water-content solvents. The CM profiles of DP2 all show a broader distribution than calculated, i.e., more heterogeneous (Figure 4). DP3 is already no longer evaluable. Nevertheless, obviously, aqueous hydrolysis is superior to methanolysis, and R=CH2COOH has a much smaller impact on sodiation than its methyl ester. This advantage is, however, impaired by the poor spray stability and signal intensities.
In contrast to methanolysis, the carbonyl function at the reducing end of the CM-COS is no longer blocked but is available for the introduction of a charged labe, and the simultaneous elimination of the sodiation. We labeled CM-COS with Girard T, a quaternary ammonium compound (2-trimethylammonium acetyl hydrazide) that forms hydrazones with the terminal carbohydrate carbonyl function [64,65]. However, the carboxymethylated COSs were strongly discriminated. They probably interfere with the positively charged reagent.
While the results from the direct MS measurement of the CMC hydrolysates look promising, the quality of the mass spectra and reproducibility are not sufficient. In addition, the lactonization of 2- and 3-O-CM-COS with the adjacent free OH may discriminate these constituents. The signals at Δm/z -18 support this concern. Furthermore, due to the difference between CM (H-Form) and OH of 58, a wide m/z range must be evaluated (DP2: m/z 365–713), which is critical due to the mass discrimination effect, especially in IT-MS [54,56].
Finally, the direct hydrolysis of the polyacid CMG is supposedly affected by the solubility state under acidic conditions. The pKa of the CM groups is about 3.65 [66,67]. The average pKa in these polyelectrolytes is not identical for all the carboxyl groups but depends on the concentration, DS, the degree of dissociation, and the electrolyte content. Under the conditions of acid hydrolysis, CM carboxylates are re-protonated. Consequently, electrostatic repulsion and chain extension decrease. The COOH groups can form complementary intermolecular hydrogen bonds. The lower the DS of a cellulose chain or domain, the higher the pH at which the CMC precipitates from the aqueous solution. According to Dogsa et al. [67], at pH < pKa, the entanglement and aggregation of the CMC molecules increase, large dense aggregates are formed, and the density distribution becomes more heterogeneous. This may most likely cause a bias during partial hydrolysis.
From all the experiments performed with CMG directly, we concluded that carboxymethyl functions in any form are not compatible with the generation of stable and uniform OS derivatives and subsequently ions in MS, representing the original CMG. Therefore, we decided to focus on the conversion of CMG in its polymeric form to the well-studied neutral hydroxyethyl glucans (HEGs).

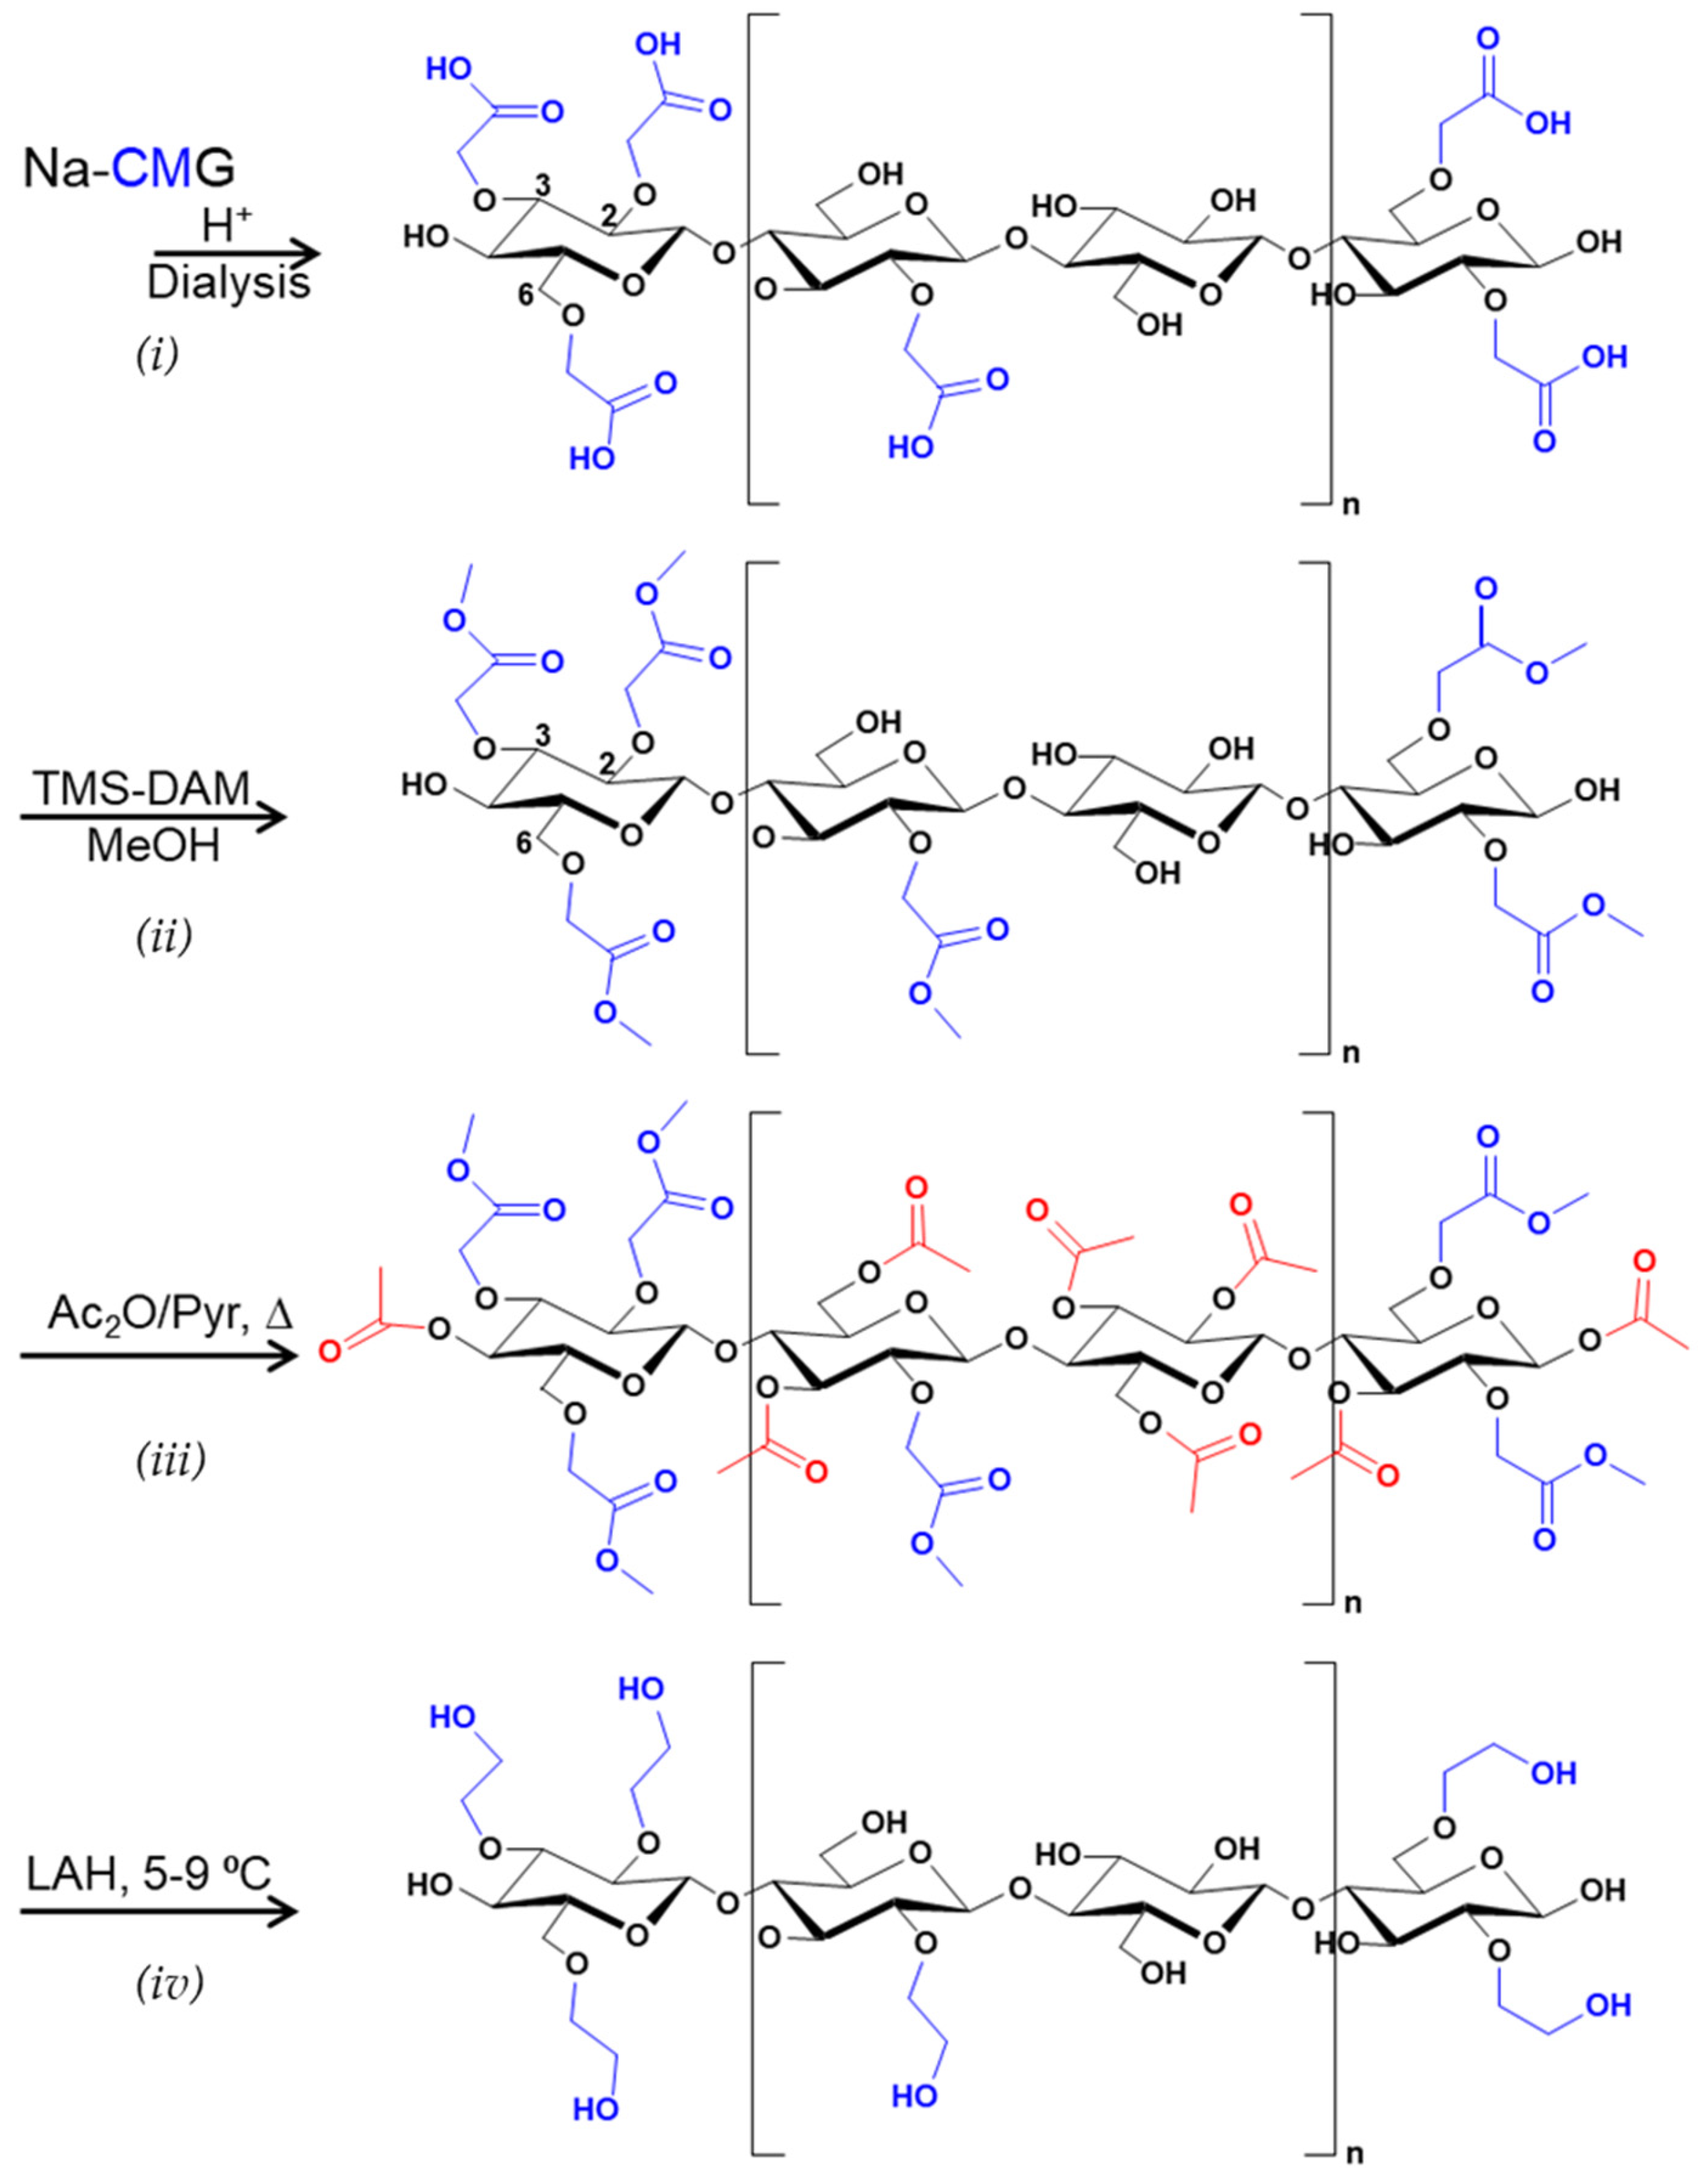
3.3. Transformation of Carboxymethyl Glucans to Hydroxyethyl Glucans

3.3.1. Reduction with NaBH4 after Activation by Carbodiimide

Carboxyl groups, such as those in uronic acid-containing glycans, have been reduced with sodium borohydride, NaBH4, to hydroxyethyl after the activation with water-soluble 1-ethyl-3-(3-dimethylaminopropyl)carbodiimide (EDC) [68,69]. The reaction is sensitive to the pH since the activated intermediate is only stable in an acidic pH, while NaBH4 forms an alkaline solution and is destroyed under the formation of hydrogen in acidic solutions. This method was applied to aqueous solutions of CMC. For the EDC activation step, the pH was first adjusted to 4.75 and subsequently kept at 7.0 during the reduction with NaBH4. Afterwards, the samples were dialyzed (final yields 60–70%) and the success of the conversion was checked by ATR-IR spectroscopy (a decrease in the C=O vibration of COONa at 1590 cm−1). The reaction was repeated up to four times but was never fully complete. De Vries et al. [70] could only achieve a 40% reduction after repeated treatments of the enzymatically released hairy regions of pectin containing branched galacturonic acid (GalA) with EDC/NaBH4. Thus, the reduction of the higher moieties, especially CM-trisubstituted glucosyl moieties in the 1,4-glucan, may also cause sterical hindrance. Therefore, we decided to use the more reactive lithium aluminum hydride LiAlH4 for the reduction.

3.3.2. Reduction with LiAlH4

Lithium aluminum hydride (LAH) has a higher reducing potential than NaBH4. It can reduce not only aldehydes and ketones but also organic esters (C=O)OR and even free acids (C=O)OH to alcohols. This reduction has been applied to various protected O-carboxymethyl-monosaccharides in order to produce regioselectively hydroxyethylated glucose standards while excluding the tandem reaction that occurs in direct hydroxyethylation. In 1955, Shyluk und Timell [71] reported on the successful reduction of methyl 3,5,6-tri-O-benzyl-2-O-methoxycarbonylmethyl-d-glucofuranoside, 3-O-methoxycarbonylmethyl-1,2:5,6-di-O-isopropylidene-d-glucofuranose, and and 6-O-methoxycarbonymethyl-1,2:3,5-di-O-methylene-d-glucofuranose to the corresponding hydroxethyl ethers. Further examples of protected monosaccharides were published by Höök und Lindberg [72]. As mentioned above, Croon and Purves [9] applied this method to hydrolyzed and methylesterified CMCs, converting the CMOMe methyl glucosides to a mixture of methyl O-hydroxyethyl-α,β-glucosides (HE-Glc). The reduction of pectin-derived di- and trisaccharides has been used by Aspinall et al. for structure elucidation. Methylesterified methyl glycosides were trimethylsilylated and reduced with LAH in diethyl ether under reflux [73]. After the permethylation, the enzymatically released pectin side chains (DP about 25) mentioned above were reduced with LAH in THF. The reduction was not complete; however, it was much better than a direct reduction with EDC/NaBH4 [70].
We performed reactions with CMC and CM amyloses (CMA), which were prepared as representatives of α-1,4-glucans under different conditions in a slurry process. All the samples were characterized with respect to their CM distributions in the glucosyl units by CE/UV as described (Tables S2 and S3).
The reaction scheme is shown in Figure 5. The CMGs were transferred to the H-form by dialysis against dilute HCl [57] and esterified with trimethylsilyl diazomethane (TMS-DAM) in DMAc/MeOH after freeze-drying [74,75]. They were then acetylated in Ac2O/pyridine in order to protect all the OHs. The ATR-IR spectra showed carbonyl absorptions for CMOMe and Ac at 1739 cm−1, while the OH vibration disappeared almost completely (see Figure S6). The CMOMe/Ac-glucans were dispersed in dry DCM under nitrogen, and an excess (1.1–2.0 equiv.) of LAH in ether was added. The reaction was stirred at 5–9 °C usually for 20–24 h. After quenching, HE and MeOH should be obtained from CMOMe and the protecting acetates should be cleaved to form ethanol [76].
The work-up, aimed at recovering all the material in order to avoid any discrimination, was finally successful by dissolving the product and the inorganic salts resulting from LAH in cold 2.4 M HCl followed by stepwise dialysis against HCl of decreasing molarity and finally against water. This procedure was necessary because the Li and Al salts could only be dissolved under acidic or (Al) alkaline conditions. The direct separation of the polysaccharide from the precipitated salts by centrifugation was quantitative only in the case of CMA. The solubility of the product depends on the DS and the degree of conversion. For two CMCs and CMAs, respectively, the soluble and insoluble fractions were separated by centrifugation prior to the acid dialysis of the undissolved fraction. While the converted CMA-0.65 and CMA-0.64 were roughly quantitatively recovered from the supernatant, for CMC-0.82 and CMC-1.26, these portions corresponded to only 20 and 40% of the theoretical yield, respectively.
The ATR-IR spectra of the soluble reduction products of CMA and CMC were in good agreement with an HEC reference. No C=O absorption was visible anymore (Figure 6). Surprisingly, the ATR-IR spectrum of the water-insoluble part of CMC-1.26 (Figure 6c), isolated following dissolution in acid, showed only a weak residual C=O absorption, although the CE analysis indicated that the degree of conversion was only 35% (see below, Section 3.3.3). Since attenuated total reflection-infrared-spectroscopy is a surface-analysis method with a depth of penetration of 0.5–3 μm (depending on the λ and difference in the refractive indices, i.e., for C=O in diamond ATR about 1 μm), this observation indicates that the surface is covered with HE, while the CM functions are hidden in the inner part of the fibers or aggregates. The insolubility in water is probably due to the formation of Al salts.
Repeated reductions caused only little improvement. Performing the reaction at room temperature or in diethyl ether instead of DCM did not enhance the conversion of CMC.
For a better understanding of the reason of the different behaviors of CMC and CMA, 13C CP/MAS NMR spectra were recorded from the methylesterified CMG acetates. The light microscopy showed a fibrillary structure of the β-1,4-linked glucan, while the α-1,4-linked CMA formed little particles, which could be grinded (Figure S6 in the Supplementary Materials). The solid-state NMR spectra (Figure 7) did not show any hint regarding the crystalline domains [15,33]. In addition to the glucose signals, non-resolved carbonyl (CMOMe and Ac), the two methyl groups of the CM methyl ester, and the acetate were visible. The signal areas cannot be used for absolute quantitative evaluation [77], but the ratios of CM and Ac-related signals in CMA and CMC can be compared assuming the complete acetylation of CMA-0.64. On this basis, from the ratios of CH3 (Ac) to CH3 (CMOMe), the DSAc of CMC-1.26 is estimated to be about 80% of the theory. In conclusion, the solid-state NMR provides at least a hint that already acetylation in the methylesterified CMC was not complete, probably due to the supramolecular fibrillary structure. The ATR-IR spectra show no difference with respect to the completeness of the acetylation of the CMA and CMC (Figure S7 in the Supplementary Materials). However, this result cannot fully exclude OH hidden in the fibrillary CMC.

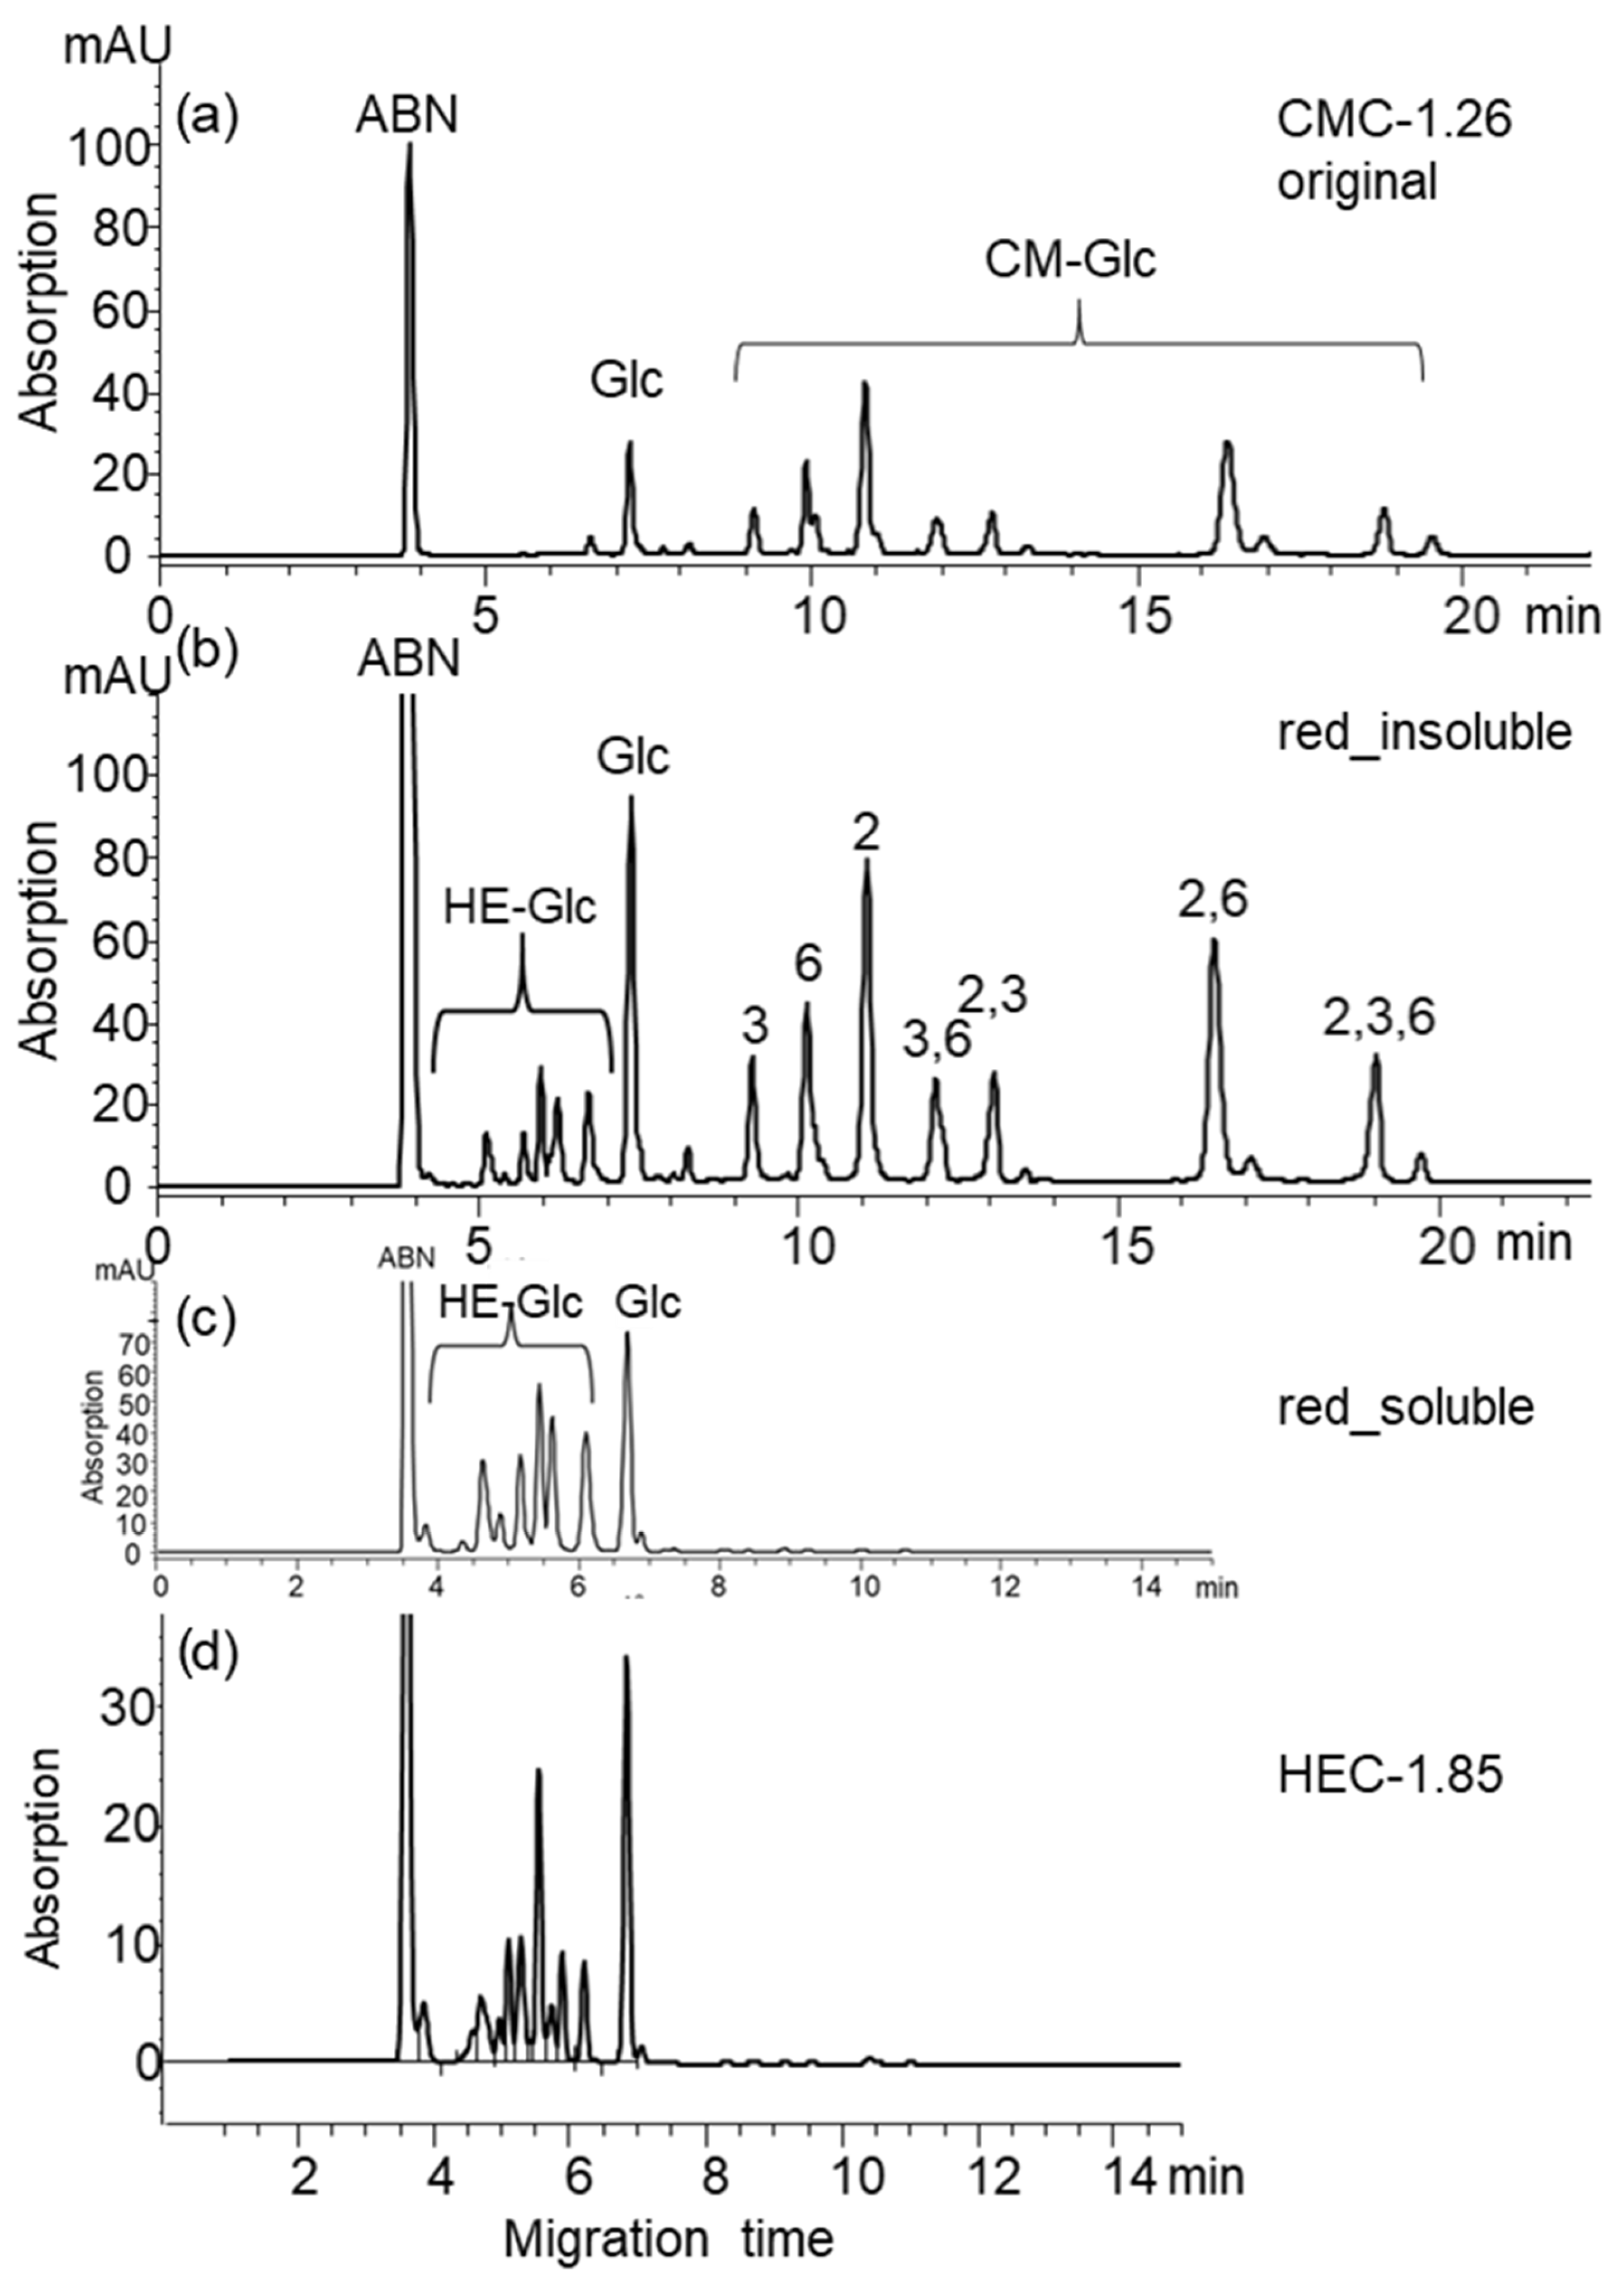
3.3.3. CE Analysis of Reduced CMG

For any conversion of polyfunctional material, it is expected that an incomplete conversion will be visible on each molecule. Therefore, in the case of the incomplete reduction of CMG, mixed glucose ethers carrying CM and HE were expected. To check this, the undissolved fractions from the reductions of CMC (or the incompletely reduced CMC isolated by acid dialysis) were analyzed with respect to their monosaccharide composition by CE/UV as described above. In the alkaline borate buffer system, generating an electroosmotic flow (EOF) to the cathode, the charged CM derivatives migrate behind the neutral glucose since they are more strongly attracted to the anode and thus decelerated. In contrast, the neutral HE ethers migrate faster than glucose because they are also neutral but have less chance to form charged borate complexes. Mixed ethers (CM/HE-Glc) should be identified by additional signals that are not present in CMG or HEG but migrate slower than glucose. Surprisingly, only two groups of signals were observed: one eluting before glucose with peaks corresponding to those of an HEC reference and one representing the original CMC (Figure 8). Obviously, there are no detectable amounts of mixed ethers. Although the glucan chains were depolymerized completely for the CE analysis, it can be excluded that ‘CM-only’ and ‘HE-only’-Glc exist in the same macromolecule without any mixed Glc ethers.
From the CE analysis of the incompletely reduced CMC, the sum in mol% (∑) of the corrected HE and CM signals, respectively, was evaluated. Since the unsubstituted glucose belongs to both the HE and the CM glucan, its portion was split accordingly, if required for evaluation. ∑HE-Glc/(∑HE-Glc + ∑CM-Glc) provides the degree of reduction (Dred, ×100 in %). When the fully reduced water-soluble and the partially reduced insoluble fractions were separated by centrifugation, the total Dred was estimated by their weighted contributions. For example, in the case of CMC-1.26, the undissolved portion represents 60% of the CMC and has been reduced to 35%. The total conversion was 0.4∙100 + 0.6∙35 = 61%. From this evaluation, it is concluded that the Dred for all the CMC entries was roughly between 52 and 67%.
The CM pattern in Figure 8a,b and the HE pattern in Figure 8b,c resemble each other closely. For CMC-1.26, the total amount of glucose, s0, in the partly reduced portion (Figure 8b) is increased compared to the starting material (22 compared to 19 mol %); thus, the DS is only 1.21. On the other hand, in the case of CMC-0.82, 40 mol % s0 fits the amount in the starting material. The CM distribution in the remaining CM glucosyl units was compared to that of the original CMC. Figure 9 shows such comparisons of the si compositions for CMC-0.82 and CMC-1.26.
With respect to positions 2, 3, and 6, there is no completely systematic distortion, even though position 2 is the most affected. Most commonly, in six out of the seven partially reduced CMC fractions analyzed, s6 is relatively increased compared to the original material, s3 in five of them, and also s36. Relatively decreased are the 2-O-substituted units, especially s26 (five samples), s23, and s236 (four samples each), resulting in the slightly decreased DSCM. This is also illustrated by Figure 9.

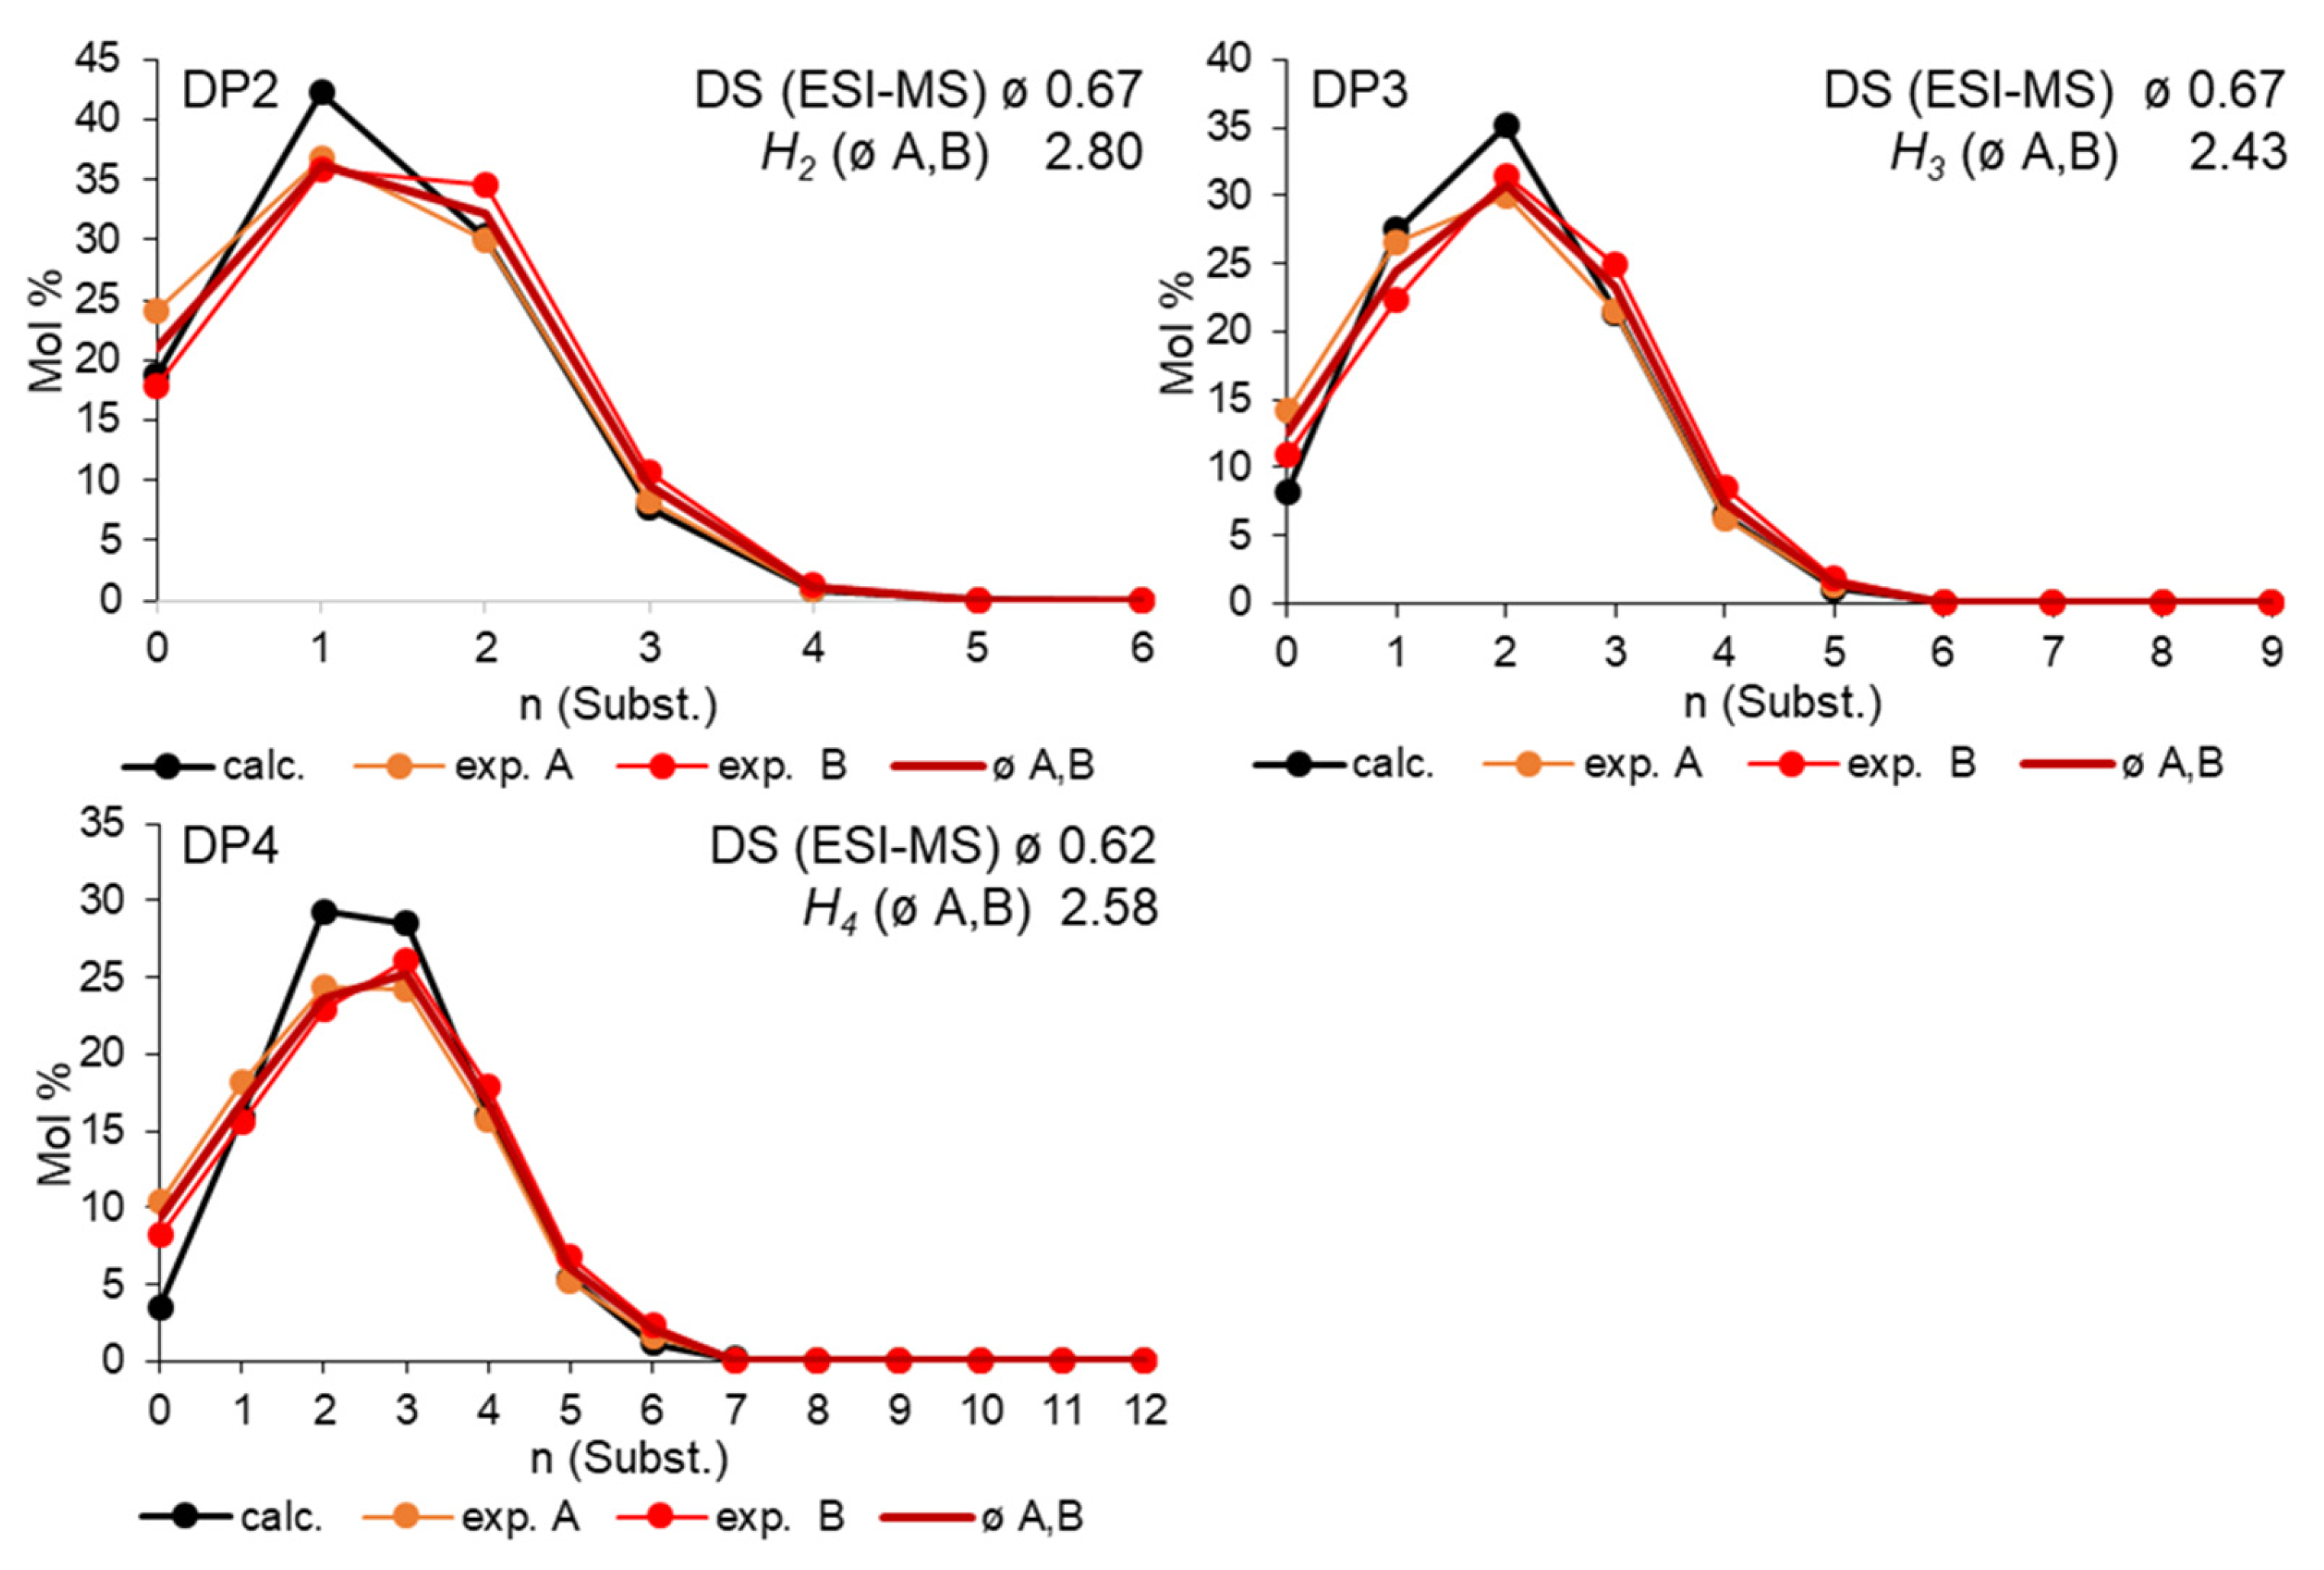
3.4. Quantitative MS Oligosaccharide Analysis of Hydroxyethyl Glucans Derived from Carboxymethyl Glucans

Finally, three fully reduced CMAs and the soluble fraction of the reduced CMC-1.26 were permethylated and prepared for the MS analysis, i.e., partially hydrolyzed, and the resulting oligosaccharides labeled with mABA. The OS mixtures were measured by ESI-IT-MS under the conditions validated for quantitative HE-COS analysis [56]. The sample was applied by syringe pump infusion under optimized instrumental settings for different overlapping m/z ranges and finally evaluated by relating the overlapping signals to each other. Ideally, the average DS calculated from the respective substituent distribution profiles should match the DS of the material under investigation and be constant over the DPs. This was not achieved perfectly but sufficiently. The results for two completely independent entries of CMA-0.65, of CMA-1.06, and of CMA-0.64 are shown in Figure 10, Figure 11 and Figure 12.
CMA-0.65 was prepared with 1 eq NaOH and 1 eq ClCH2COONa/AGU in a 2-PrOH/H2O slurry. For the first reduction entry (A) of CMA-0.65, isolated from the supernatant after centrifugation, the DS values for DP2-DP4 were 0.63, 0.61, and 0.60, respectively. For the second entry (B), isolated after dissolution in HCl and dialysis, DS values of 0.70, 0.67, and 0.64 were evaluated. These results suggest that the deviation is not systematic, but the reproducibility should be improved by further optimization. Figure 10 shows both profiles and the average values for DP2–4. Compared to the random profile, more unsubstituted and more highly substituted OSs were observed than expected for a random distribution of glucosyl units, as calculated from the monomer data. This indicates a significant heterogeneity, i.e., a wider DS distribution in the material than would be expected if all the glucosyl moieties in all the amylose molecules reacted in the same way (same rate constants ki).
The results obtained for the higher-substituted CMA-1.06 are demonstrated in Figure 11. With 1.11, 1.08, and 1.05, the DS values again show a slight trend with DP but agree sufficiently well for DP3 and DP4. The substituent profiles of DP2–4 show a moderate heterogeneity. The sample was prepared in a small scale, and 2 eq of each NaOH and Na-chloroacetate were applied. The monomer analysis had shown a regioselective intramonomeric effect on the si distribution, which partly levels the ci-differences related to heterogeneity, as has been outlined above (Section 3.1). Therefore, for the H1 of the number of substituents distribution, the ci data calculated by the Reuben model were used. The value is 1.41, while the comparison with the ci data calculated by the Spurlin model provided an apparent H1 of only 0.37. The heterogeneity parameters Hi (i = DP) from ESI-MS must be considered with caution (especially for H2) since the deviation in the DS also contributes.
The OS analysis of the third HE-amylose, reduced CMA-0.64, shows another type of profile, indicating a bimodal distribution (Figure 12). With DS 0.66 (DP2) and 0.65 (DP3), the DS is well-matched. The comparison of the CE monomer analysis with the Spurlin model (see Supplementary Materials, Table S3) had already indicated that a certain part of the amylose was probably hardly affected during the carboxymethylation, performed in a slurry with 5.2 eq NaOH/AGU and 2.3 eq ClCH2COONa. However, the shape of the substituted part of the bimodal profile is characterized by a broad DS profile, i.e., an additional pronounced heterogeneity.
Compared to the other CMA, the large excess of NaOH has shifted the regioselectivity in favor of primary 6-OH and inactivated the chloroacetate (→glycolate). Thus, the overall DS is only in the range obtained with only 1 eq of reagents (see CMA-0.65).
Finally, the fully reduced portion of CMC-1.26, corresponding to about 40% of the starting material, was analyzed by ESI-MS. Figure 13 shows the n(CM) distribution profiles of DP2 and DP3. As discussed above, the CE analysis of the non-reduced portion showed that the residual CM pattern deviated slightly from the original one (see Figure 8a,b and Figure 9b). However, this decrease in DSCM is not reflected in an increased DSHE. From the MS analysis of the HE-COS, DS values of 1.21 and 1.13 were obtained for DP2 and DP3, respectively. The shape of the DP3 profile indicates that the data for n (Subst.) = 7–9 were not included, resulting in a too-low DS. Regardless of the uncertainties described, the profiles show significant heterogeneity with increased contributions from the low- and high-substituted COSs at the expense of the most probable ones (for a random distribution). This heterogeneity may be overestimated but is qualitatively reliable.

4. Conclusions

As a resume of the comprehensive studies of the substituent distribution of carboxymethyl amyloses and celluloses by the MS analysis of the representative oligosaccharides, it is concluded that the direct depolymerization to CM-OS cannot be guaranteed to proceed randomly. Methanolysis preferentially cleaves the higher-substituted regions, while the low-substituted and heterogeneous portions are not captured and thus discriminated. While simultaneous CM esterification prevents side reactions of this functional group, it has a strong impact on the sodiation and thus the ion yield in the ESI process. Labeling as an alternative charged control is blocked by the methyl glycoside formation. The attempts to enable quantitative MS analysis by leveling the chemical and mass differences by the acylation of all the free OH of the OS obtained resulted in failure. Even the isomeric methoxyacetate did not overcome this bias due to the steric and electronic requirements for the multiple coordination of the sodium ions. The aqueous partial hydrolysis of CMG is more suitable for random depolymerization but might also discriminate the less-soluble domains and thus produce non-representative oligosaccharides in the case of low-DS or heterogeneous material. Although the results from the ESI-MS analysis of CM-OS appear to be promising, this approach suffers from a number of sources of bias: the poor ion intensities and instable spray of the water-rich solvent required for the polar analytes, the lactonization of the CM groups, multiple ion formation, interference with the charged labeling reagents, and a wide m/z range. Therefore, transformation to hydroxyethyl glucans was found to be the method of choice to overcome the CM-related obstacles. After the esterification of the CM groups and the acetylation of all the free OH, a reduction with LAH was performed. The heterogeneous reaction was quantitative for the CMAs, but only about a 60% reduction was achieved for the CMCs. Analysis of the latter did not show mixed CM/HE-glucose ether, but fully reduced beside intact starting material was retained at good total recoveries. The CM distribution in the non-reduced part is in acceptable agreement with the reference material. The HEGs were permethylated and analyzed after partial acid hydrolysis and labeling with mABA by ESI-IT-MS, according to a procedure developed and validated for HEC with respect to both the randomness of the hydrolysis and the quantifiability of the MS measurement. Due to the additional sample preparation steps, the results were not of the same quality as for the direct HE-glucan analysis but were of sufficient quality to evaluate the type of deviation from a random distribution, e.g., a DS gradient or even bimodality in the case of one CMA. The results obtained for a commercial CMC (DS 1.26) also showed a heterogeneous distribution, but the results can only be interpreted qualitatively since the reduced material has not been demonstrated to be representative of the entire CMC. In spite of some shortcomings, the method has been demonstrated to work on the example of CMAs. The reduction of CMC suffered from the fibrillary structure and seems to progress from outside the core and finally to cease. Perspectively, an acetyl–methyl exchange prior to the LAH reduction may be an alternative to improve the solubility and reduction of CMC. This could also facilitate permethylation, which is required for further analysis.
It has sometimes been discussed whether the substitution at O-2 reduces the probability of 3-O-carboxymethylation as a result of electrostatic repulsion or sterical effects. The comparison of the experimental si data with the models of Spurlin and Reuben gives rise to the assumption that such a regioselective neighbor effect could occur but is not generally observed. This neighbor effect is superimposed by the heterogeneities across the polymer material, as indicated by the comparison of the ci data of the Spurlin and Reuben models.

Supplementary Materials

The following supporting information can be downloaded at https://www.mdpi.com/article/10.3390/polysaccharides5030022/s1, Figures S1–S3: CMC and CMA: Deviation from the Spurlin and Reuben models, heterogeneity H1(si) and H1(ci), calculated from Δ Spurlin and Δ Reuben, respectively. Figure S4: Distribution of the CM groups in DP 2 of CMC-0.88 obtained from ESI-IT-MS (M + Na) of methanolysates, and in addition after acetylation, propionylation, and butyrylation of free OH, respectively. Figure S5: Distribution of the CM groups of DP 2 from CMC-0.96 obtained after ESI-IT-MS of the d4-methanolysate after methoxyacetylation and stepwise dilution with MeOH-d4. Figure S6: ATR-IR spectra of (a) CMA-0.64 and (b) CMC-1.26 after methyl esterification of CM and acetylation of OH. Tables S1–S3: Monomer distribution (Mol %) of CMCs and CMAs determined by CE/UV, and the substitution pattern based on the models of Spurlin and Reuben.

Author Contributions

Conceptualization, F.S., A.A. and P.M.; Data curation, F.S.; Investigation, F.S. and A.A.; Methodology, F.S., A.A. and P.M.; Resources, P.M.; Supervision, P.M.; Validation, F.S.; Visualization, F.S., A.A. and P.M.; Writing—original draft, P.M.; Writing—review and editing, F.S., A.A. and P.M. All authors have read and agreed to the published version of the manuscript.

Funding

This research received no external funding.

Institutional Review Board Statement

Not applicable.

Data Availability Statement

Data are available in the Supplementary Materials or on demand.

Acknowledgments

For recording the 13C CP/MAS NMR spectra, we thank Markus Bacher from the University of Natural Resources and Life Sciences, BoKu Vienna, Austria.

Conflicts of Interest

Petra Mischnick declares no conflicts of interest. Anne Adden and Franziska Steingaß were both PhD students at TU Braunschweig when conducting the work presented. Both were financed by TU Braunschweig. Anne Adden is employed by IFF N&H Germany GmbH & Co. KG, Walsrode, Germany. Franziska Steingaß is employed by Saltigo GmbH, Leverkusen, Germany. All authors declare that the research was conducted in the absence of any commercial or financial relationships that could be construed as potential conflicts of interest.

References

  1. Chowdhury, J.K. Über Äther von Polysacchariden mit Oxysäuren. Biochem. Ztschr. 1924, 148, 76–97. [Google Scholar]
  2. Heinze, T.; Koschella, A. Carboxymethyl ethers of cellulose and starch—A review. Macromol. Symp. 2005, 223, 13–40. [Google Scholar] [CrossRef]
  3. Heinze, T.; El Seoud, O.A.; Koschella, A. Chapter 6.1.1. Anionic cellulose ethers. In Cellulose Derivatives—Synthesis, Structure and Properties, 1st ed.; Springer: Berlin/Heidelberg, Germany, 2018; pp. 431–444. [Google Scholar] [CrossRef]
  4. Spurlin, H.M. Arrangement of substituents in cellulose derivatives. J. Am. Chem. Soc. 1939, 61, 2222–2227. [Google Scholar] [CrossRef]
  5. Mischnick, P.; Voiges, K.; Cuers-Dammann, J.; Unterieser, I.; Sudwischer, P.; Wubben, A.; Hashemi, P. Analysis of the heterogeneities of first and second order of cellulose derivatives: A complex challenge. Polysaccharides 2021, 2, 843–865. [Google Scholar] [CrossRef]
  6. Mischnick, P.; Momcilovic, D. Chemical Structure Analysis of Starch and Cellulose Derivatives. Adv. Carbohydr. Chem. Biochem. 2010, 64, 117–210. [Google Scholar] [CrossRef]
  7. Cuers, J.; Rinken, M.; Adden, R.; Mischnick, P. Critical investigation of the substituent distribution in the polymer chains of hydroxypropyl methylcelluloses by (LC-)ESI-MS. Anal. Bioanal. Chem. 2013, 405, 9021–9032. [Google Scholar] [CrossRef]
  8. Adden, R.; Müller, R.; Mischnick, P. Fractionation of methyl cellulose according to polarity—A tool to differentiate first and second order heterogeneity of the substituent distribution. Macromol. Chem. Phys. 2006, 207, 954–965. [Google Scholar] [CrossRef]
  9. Croon, I.; Purves, C.B. The distributioin of substituents in partially substituted carboxymethyl celluloses. Svensk Papperstidn. 1959, 62, 876–882. [Google Scholar]
  10. Heinze, T. Ionische Funktionspolymers aus Cellulose: Neue Synthesekonzepte, Strukturaufklärung und Eigenschaften; Habilitation, Universität Jena, Shaker: Aachen, Germany, 1998; pp. 62–66. [Google Scholar]
  11. Crössmann, F.; Kupfer, H.; Soucid, S.W.; Mergenthaler, E. Zur physikalischen und chemischen Charakterisierung der als Lebensmittelzusatzstoffe verwendeten Celluloseäther, IV. Mitteilung. Z. Lbm. Forsch. 1970, 142, 410–418. [Google Scholar] [CrossRef]
  12. Ho, F.F.L.; Klosiewicz, D.W. Proton nuclear magnetic resonance spectrometry for determination of substituents and their distribution in carboxymethylcellulose. Anal. Chem. 1980, 52, 913–916. [Google Scholar] [CrossRef]
  13. Reuben, J.; Conner, H.T. Analysis of the carbon-13 n.m.r. spectrum of hydrolyzed O-(carboxymethyl)cellulose. Monomer composition and substitution patterns. Carbohydr. Res. 1983, 115, 1–13. [Google Scholar] [CrossRef]
  14. Baar, A.; Kulicke, W.M.; Szablikowski, K.; Kiesewetter, R. Nuclear magnetic resonance spectroscopic characterization of carboxymethylcellulose. Macromol. Chem. Phys. 1994, 195, 1483–1492. [Google Scholar] [CrossRef]
  15. Käuper, P.; Kulicke, W.-M.; Horner, S.; Saake, B.; Puls, J.; Kunze, J.; Fink, H.-P.; Heinze, U.; Heinze, T.; Klohr, E.-A.; et al. Development and evaluation of methods for determining the pattern of funtionalization in sodium carboxymethylcelluloses. Angew. Makromol. Chem. 1998, 260, 53–62. [Google Scholar] [CrossRef]
  16. Saake, B.; Horner, S.; Puls, J.; Heinze, T.; Koch, W. A New Approach in the Analysis of the Substituent Distribution of Carboxymethyl Celluloses. Cellulose 2001, 8, 59–67. [Google Scholar] [CrossRef]
  17. Lazik, W.; Heinze, T.; Pfeiffer, K.; Albrecht, G.; Mischnick, P. Starch derivatives of high degree of functionalization—6. Multi step carboxymethylation. J. Appl. Polym. Sci. 2002, 86, 743–752. [Google Scholar] [CrossRef]
  18. Reuben, J. Analysis of the 13C-N.M.R. spectra of hydrolyzed and methanolyzed O-methylcelluloses: Monomer compositions and models for their description. Carbohydr. Res. 1986, 157, 201–213. [Google Scholar] [CrossRef]
  19. Kono, H.; Oshima, K.; Hashimoto, H.; Shimizu, Y.; Tajima, K. NMR characterization of sodium carboxymethyl cellulose. Substituent distribution and mole fraction of monomers in the polymer chains. Carbohydr. Polym. 2016, 146, 1–9. [Google Scholar] [CrossRef]
  20. Heinze, T.; Erler, U.; Nehls, I.; Klemm, D. Determination of the substituent pattern of heterogeneously and homogeneously synthesized carboxymethyl cellulose by using high-performance liquid chromatography. Angew. Makromol. Chem. 1994, 215, 93–106. [Google Scholar] [CrossRef]
  21. Niemelä, K.; Sjöström, E. Identification of the products of hydrolysis of carboxymethylcellulose. Carbohydr. Res. 1988, 180, 43–52. [Google Scholar] [CrossRef]
  22. Zeller, S.G.; Greisgraber, G.W.; Gray, G.R. Analysis of positions of substitution of O-carboxymethyl groups in partially O-carboxymethylated cellulose by the reductive-cleavage method. Carbohydr. Res. 1991, 211, 41–45. [Google Scholar] [CrossRef]
  23. Kragten, E.A.; Kamerling, J.P.; Vliegenthart, J.F.G. Composition analysis of carboxymethylcellulose by high-pH anion-exchange chromatography with pulsed amperometric detection. J. Chromatogr. A 1992, 623, 49–53. [Google Scholar] [CrossRef]
  24. Tüting, W.; Albrecht, G.; Volkert, B.; Mischnick, P. Structure Analysis of Carboxymethyl Starch by Enzymic Degradation and Capillary Electrophoresis. Starch/Stärke 2004, 56, 315–321. [Google Scholar] [CrossRef]
  25. Ramos, L.A.; Frollini, E.; Heinze, T. Carboxymethylations of cellulose in the new solvent dimethylsulfoxide/tetrabutyl ammonium fluoride. Carbohydr. Pol. 2005, 60, 259–267. [Google Scholar] [CrossRef]
  26. Volkert, B.; Loth, F.; Lazik, W.; Engelhardt, J. Highly carboxymethylated starch. Starch/Stärke 2004, 56, 307–314. [Google Scholar] [CrossRef]
  27. Jardeby, K.; Lennholm, H.; Germgård, U. Characterisation of the undissolved residuals in CMC-solutions. Cellulose 2004, 11, 195–202. [Google Scholar] [CrossRef]
  28. Jardeby, K.; Germgård, U.; Kreutz, B.; Heinze, T.; Heinze, U.; Lennholm, H. The influence of fibre wall thickness on the undissolved residuals in CMC solutions. Cellulose 2005, 12, 165–167. [Google Scholar] [CrossRef]
  29. Olaru, N.; Staimberg, S.; Bontea, D.; Asandei, N. Research on optimization of some reaction parameters in synthesis of sodium carboxymethylcellulose. Cell. Chem. Technol. 1980, 14, 713–717. [Google Scholar]
  30. Olaru, N.; Olaru, L.; Stoleriu, A.; Timpu, D. Carboxymethyl cellulose synthesis in organic media containing ethanol and/or acetone. J. Appl. Polym. Sci. 1998, 67, 481–486. [Google Scholar] [CrossRef]
  31. Olaru, N.; Olaru, L. Influence of organic diluents on cellulose carboxymethylation. Macromol. Chem. Phys. 2001, 202, 207–211. [Google Scholar] [CrossRef]
  32. Stigsson, V.; Kloow, G.; Germgård, U. The influence oft he solvent system used during manufacturing of CMC. Cellulose 2006, 13, 705–712. [Google Scholar] [CrossRef]
  33. Mann, G.; Kunze, J.; Loth, F.; Fink, H.-P. Cellulose ethers with a block-like distribution of the substituents by structure-selective derivatization of cellulose. Polymer 1998, 39, 3155–3165. [Google Scholar] [CrossRef]
  34. Steeneken, P.A.M.; Ebbe, S. Topochemical effects in the methylation of starch. Carbohydr. Res. 1991, 209, 239–249. [Google Scholar] [CrossRef]
  35. Fannon, J.E.; Gray, J.A.; Gunawan, N.; Huber, K.C.; BeMiller, J.N. Heterogeneity of starch granules and the effect of granule channelization on starch modification. Cellulose 2004, 11, 247–254. [Google Scholar] [CrossRef]
  36. Oudhoff, K.A.; Buijtenhuijs, F.A.; Wijnen, P.H.; Schoenmakers, P.J.; Kok, W.T. Determination of the degree of substitution and its distribution of carboxymethylcelluloses by capillary zone electrophoresis. Carbohydr. Res. 2004, 339, 1917–1924. [Google Scholar] [CrossRef]
  37. Shakun, M.; Heinze, T.; Radke, W. Determination of the DS distribution of non-degraded sodium carboxymethyl cellulose by gradient chromatography. Carbohydr. Polym. 2013, 98, 943–950. [Google Scholar] [CrossRef]
  38. Shakun, M.; Heinze, T.; Radke, W. Characterization of sodium carboxymethyl cellulose by comprehensive two-dimensional liquid chromatography. Carbohydr. Polym. 2015, 130, 77–86. [Google Scholar] [CrossRef]
  39. Wirick, M.G. A study of the enzymic degradation of CMC and other cellulose ethers. J. Polym. Sci. Polm. Chem. 1968, 6, 1965–1974. [Google Scholar] [CrossRef]
  40. Gelman, R.A. Characterization of carboxymethylcellulose: Distribution of substituent groups along the chain. J. Appl. Polym. Sci. 1982, 27, 2957–2964. [Google Scholar] [CrossRef]
  41. Saake, B.; Horner, S.; Kruse, T.; Puls, J.; Liebert, T.; Heinze, T. Detailed investigation on the molecular structure of carboxymethyl cellulose with unusual substitution pattern by means of an enzyme-supported analysis. Macromol. Chem. Phys. 2000, 201, 1996–2002. [Google Scholar] [CrossRef]
  42. Olaru, L.; Popa, V.I.; Olaru, N. Kinetic study of rapid step CMC enzymatic hydrolysis. Cell. Chem. Technol. 2004, 38, 165–173. [Google Scholar]
  43. Enebro, J.; Momcilovic, D.; Siika-Aho, M.; Karlsson, S. Investigation of endoglucanase selectivity on carboxymethyl cellulose by mass spectrometric techniques. Cellulose 2009, 16, 271–280. [Google Scholar] [CrossRef]
  44. Enebro, J.; Momcilovic, D.; Siika-Aho, M.; Karlsson, S. Liquid chromatography combined with mass spectrometry for the investigation of endoglucanase selectivity on carboxymethyl cellulose. Carbohydr. Res. 2009, 344, 2173–2181. [Google Scholar] [CrossRef]
  45. Enebro, J.; Momcilovic, D.; Siika-Aho, M.; Karlsson, S. A New Approach for Studying Correlations between the Chemical Structure and the Rheological Properties in Carboxymethyl Cellulose. Biomacromolecules 2007, 8, 3253–3257. [Google Scholar] [CrossRef]
  46. Zhang, J.; Wu, D. Characteristics of the aqueous solution of carboxymethyl starch ether. J. Appl. Polym. Sci. 1992, 46, 369–374. [Google Scholar] [CrossRef]
  47. Arisz, P.W.; Kauw, H.J.J.; Boon, J.J. Substituent distribution along the cellulose backbone in O-methylcelluloses using GC and FAB MS for monomer and oligomer analysis. Carbohydr. Res. 1995, 271, 1–14. [Google Scholar] [CrossRef]
  48. Mischnick, P.; Kühn, G. Correlation between reaction conditions and primary structure: Model studies on methyl amylose. Carbohydr. Res. 1996, 290, 199–207. [Google Scholar] [CrossRef]
  49. Adden, R.; Niedner, W.; Müller, R.; Mischnick, P. Comprehensive analysis of the substituent distribution in the glucosyl units and along the polymer chain of hydroxyethylmethylcelluloses and statistical evaluation. Anal. Chem. 2006, 78, 1146–1157. [Google Scholar] [CrossRef]
  50. Mischnick, P.; Unterieser, I.; Voiges, K.; Cuers, J.; Rinken, M.; Adden, R. A new method for the analysis of the substitution pattern of hydroxyethyl(methyl)-celluloses along the polysaccharide chain. Macromol. Chem. Phys. 2013, 214, 1363–1374. [Google Scholar] [CrossRef]
  51. Gohdes, M.; Mischnick, P. Determination of the substitution pattern in the polymer chain of cellulose sulfates. Carbohydr. Res. 1998, 309, 109–115. [Google Scholar] [CrossRef]
  52. Voiges, K.; Lämmerhardt, N.; Distelrath, C.; Mischnick, P. Substituent effects on the kinetics of acid-catalyzed hydrolysis of methyl cellulose. Cellulose 2017, 24, 555–569. [Google Scholar] [CrossRef]
  53. Voiges, K.; Lämmerhardt, N.; Mischnick, P. Kinetic studies of acid-catalyzed hydrolysis of mixed cellulose ethers. Cellulose 2017, 24, 627–639. [Google Scholar] [CrossRef]
  54. Schleicher, S.; Lottje, I.-R.; Mischnick, P. Impact of instrumental settings in electrospray ionization ion trap mass spectrometry on the analysis of multi-CH3/CD3-isotopologs in cellulose ether analysis: A quantitative evaluation. Anal. Bioanal. Chem. 2022, 414, 1279–1296. [Google Scholar] [CrossRef] [PubMed]
  55. Schleicher, S.; O’Connor, G.; Mischnick, P. Comparing 13C methyl and deuterated methyl isotopic labeling for the quantification of methyl cellulose patterns using mass spectrometry. Anal. Bioanal. Chem. 2023, 415, 1817–1828. [Google Scholar] [CrossRef] [PubMed]
  56. Schleicher, S.; Horoba, D.; Krafzig, P.; Mischnick, P. Impact of instrumental settings in electrospray ionization ion trap mass spectrometry on the analysis of O-methoxyethyl-O-methyl cellulose: A comprehensive quantitative evaluation. Anal. Bioanal. Chem. 2022, 414, 4727–4743. [Google Scholar] [CrossRef] [PubMed]
  57. Stojanović, Ž.; Jeremić, K.; Jovanović, S. Molecular structure of carboxymethyl starch in dilute aqueous sodium chloride solutions. Starch/Stärke 2013, 65, 902–911. [Google Scholar] [CrossRef]
  58. Tang, L.; Kebarle, P. Dependence of ion intensity in electrospray mass spectrometry on the concentration of the analytes in the electrosprayed solution. Anal Chem. 1993, 65, 3654–3668. [Google Scholar] [CrossRef]
  59. Cech, N.B.; Enke, C.G. Practical implications of some recent studies in electrospray ionization fundamentals. Mass Spectrom. Rev. 2002, 20, 362–387. [Google Scholar] [CrossRef] [PubMed]
  60. Bol, M.; Sakellaris, C.N.; Jacob, C.R.; Mischnick, P. Differences in the complexation of sodium with methyl esterified carboxymethyl/methoxyacetyl-O-glucans in electrospray ionization-mass spectrometry. Int. J. Mass Spectrom. 2017, 419, 20–28. [Google Scholar] [CrossRef]
  61. Bol, M.; Dobos, M.A.; Lebioda, S.; Saake, B.; Mischnick, P. Methanolysis of Carboxymethyl Cellulose—A Comprehensive Study. Cellulose 2019, 26, 383–397. [Google Scholar] [CrossRef]
  62. Schulz, L.; Seger, B.; Burchard, W. Structures of cellulose in solution. Macromol. Chem. Phys. 2000, 201, 2008–2022. [Google Scholar] [CrossRef]
  63. Enebro, J.; Karlsson, S. Improved matrix-assisted laser desorption/ionisation time-of-flight mass spectrometry of carboxymethyl cellulose. Rapid Commun. Mass Spectrom. 2006, 20, 3693–3698. [Google Scholar] [CrossRef]
  64. Naven, T.J.P.; Harvey, D.J. Cationic derivatization of oligosaccharides with Girard’s T reagent for improved performance in Matrix-Assisted Laser Desorption Ionization and Electrospray Mass Spectrometry. Rapid Commun. Mass. Spectrom. 1996, 10, 829–834. [Google Scholar] [CrossRef]
  65. Unterieser, I.; Mischnick, P. Labeling of Oligosaccharides for Quantitative Mass Spectrometry. Carbohydr. Res. 2011, 346, 68–75. [Google Scholar] [CrossRef]
  66. Trivedi, H.C.; Patel, C.K.; Patel, R.D. Studies on carboxymethyl cellulose—Potentiometric titrations, 3. Macromol. Chem. 1981, 82, 243–245. [Google Scholar] [CrossRef]
  67. Dogsa, I.; Tomšič, M.; Orehek, J.; Benigar, E.; Jamnik, A.; Stopar, D. Amorphous supramolecular structure of carboxymethyl cellulose in aqueous solution at different pH values as determined by rheology, small angle X-ray and light scattering. Carbohydr. Polym. 2014, 111, 492–504. [Google Scholar] [CrossRef]
  68. Taylor, R.L.; Conrad, H.E. Stoichiometric depolymerization of polyuronides and glycosaminoglycans to monosaccharides following reduction of their carbodiimide-activated carboxyl groups. Biochemistry 1972, 11, 1383–1388. [Google Scholar] [CrossRef]
  69. Ukai, S.; Honda, A.; Nagai, K.; Kiho, T. Gas-liquid chromatographic analysis of carboxymethyl cellulose and carboxymethyl starch. J. Chromoatogr. 1990, 513, 338–342. [Google Scholar] [CrossRef]
  70. De Vries, J.A.; Den Uijl, C.H.; Voragen, A.G.J.; Rombouts, F.M.; Pilnik, W. Structural features of the neutral sugar side chains of apple pectic substances. Carbohydr. Polym. 1983, 3, 193–205. [Google Scholar] [CrossRef]
  71. Shyluk, W.P.; Timell, T.E. A new method for preparing hydroxyethyl ethers of glucose. Can. J. Chem. 1956, 34, 571–574. [Google Scholar] [CrossRef]
  72. Höök, J.E.; Lindberg, B.; Nielsen, P.H.; Schwieter, U.; Paasivirta, J. Acid Hydrolysis of Mono-hydroxyethyl Ethers of Methyl alpha- and beta-D-Glucopyranoside. Acta Chem. Scand. 1968, 22, 921–926. [Google Scholar] [CrossRef]
  73. Aspinall, G.O.; Craig, J.W.T.; Whyte, J.L. Lemon-peel pectin: Part I. Fractionation and partial hydrolysis of water-soluble pectin. Carbohydr. Res. 1968, 7, 442–452. [Google Scholar] [CrossRef]
  74. Kühnel, E.; Laffan, D.D.P.; Lloyd-Jones, G.C.; Del Martínez Campo, T.; Shepperson, I.R.; Slaughter, J.L. Mechanism of methyl esterification of carboxylic acids by trimethylsilyldiazomethane. Angew. Chem. Int. Ed. Engl. 2007, 46, 7075–7078. [Google Scholar] [CrossRef] [PubMed]
  75. Tot, I.; Müller, Y.; Werner, C.; Rosenau, T.; Potthast, A. A novel, mild and selective methylation of carboxyl groups in cellulosic pulps 10th EWLP, Stockholm, Sweden, August 25–28, 2008. Holzforschung 2009, 63, 657–663. [Google Scholar] [CrossRef]
  76. Garcia, J.G.; Voll, R.J.; Younathan, E.S. Reductions of Carbohydrate Vicinal Diacetates with Lithium Aluminum Hydride. J. Carbohydr. Chem. 1993, 119–124. [Google Scholar] [CrossRef]
  77. Karrasch, A.; Jäger, C.; Saake, B.; Potthast, A.; Rosenau, T. Solid-state NMR studies of methyl celluloses. Part 2: Determination of degree of substitution and O-6 vs. O-2/O-3 substituent distribution in commercial methyl cellulose samples. Cellulose 2009, 16, 1159–1166. [Google Scholar] [CrossRef]
Figure 1. Deviation of the experimentally determined mol fractions si substituted in position i from those calculated according to the Spurlin and Reuben models, respectively. (a) CMC-1.26: the better matches of s3, s6, s23, and s36 by the Reuben model compared to the Spurlin model display the reduced probability of adjacent 3-O-carboxymethylation, considered by the Reuben model. The increased forpositive deviation of c0 and c3 and the negative deviation of c1 and c2 in the Reuben model indicate the heterogeneity, partly compensated by the neighbor effect in the Spurlin model. H1(si) = 1.52 (Spurlin)/1.04 (Reuben); H1(ci) = 0.50 (Spurlin)/1.71 (Reuben). (b) CMC-0.82 does not show a neighbor effect but only slight heterogeneity; H1(si) = 0.87 (Spurlin)/0.88 (Reuben); H1(ci) = 1.56 (Spurlin)/1.71 (Reuben), respectively (for CMA, see Supplementary Materials, Figure S3).
Polysaccharides 05 00022 g001
Figure 2. Sample preparation for MS analysis: partial depolymerization of CMC by methanolysis and subsequent acylation. For acyl with R=CH2OCH3 (methoxyacetylation), isomeric to CH2COOCH3, methanolysis is performed with MeOH-d4.
Polysaccharides 05 00022 g002
Figure 3. Distribution of the CM groups of DP 2 of CMC-0.96 obtained from ESI-IT-mass spectra (positive mode, [M + Na]+) of the methanolysate, and, in addition, after acetylation, propionylation, butyrylation, and methoxyacetylation of free OH, respectively (see Figure 2). Experimentally obtained data are compared with the random distribution calculated from monomer data obtained by CE-UV analysis (calc., DSCE 0.96; see Table S1). Apparent DS: methanolysate: 1.62; Ac: 1.62; EtCO: 1.49; PrCO: 1.43; MeOAc: 1.23.
Polysaccharides 05 00022 g003
Figure 4. Distribution of the CM groups of DP 2 from CMC-0.88, CMC-0.85, CMC-0.94, and CMC-0.96. Two entries, A and B, and the average DS values calculated from their profiles are shown.
Polysaccharides 05 00022 g004
Figure 5. Reaction scheme for the reduction of CMG to HEG. (i) Transformation of Na-CMG (here Na-CMC) to the acid form; (ii) CM esterification with TMS-DAM/MeOH; (iii) acetylation of glucan OH with Ac2O/pyridine; (iv) reduction with LAH.
Polysaccharides 05 00022 g005
Figure 6. ATR-IR spectra (transmission normalized to C-O-vibration at (a) 1007 cm−1, or (b,c) 1048 cm−1, respectively) of (a) reduced and soluble CMA-0.64 and CMC-0.65, (b) of the water-soluble portions of reduced CMC-0.82 and CMC-1.26 in comparison with an HEC reference (MS 1.85), and (c) of the soluble and insoluble portions of reduced CMC-1.26 (see also for CE analysis of this sample below). Absorption at 1646–1650 cm−1 refers to adsorbed water.
Polysaccharides 05 00022 g006
Figure 7. 13C CP/MAS NMR spectra of methylesterified CMG acetates. Red: CMA-0.64; black: CMC-1.26.
Polysaccharides 05 00022 g007
Figure 8. Electropherograms of (a) the original CMC-1.26, (b) the LAH-reduced insoluble part of CMC-1.26, 60% of the material, Dred 35%, (c) the LAH-reduced dissolved part of CMC-1.26, 40% of the material, and (d) the HEC reference, MSHE 1.85, including tandem substitution products. In (b), peaks of CM-Glc are assigned according to the CM position. The electropherograms are aligned according to the ABN–Glc window.
Polysaccharides 05 00022 g008
Figure 9. CM distributions in (a) CMC-0.82 and (b) CMC-0-1.26, respectively, and in the insoluble (is) fractions after reduction of CM by LAH, determined by CE/UV. Notice: unsubstituted glucose (s0) is not included since it refers to both the residual CM and the generated HE portion. For corresponding electropherograms of CMC-1.26, see also Figure 8a,b).
Polysaccharides 05 00022 g009
Figure 10. Distribution of HE groups in CMA-0.65 after reduction to HEA, permethylation, partial hydrolysis, and labeling with m-ABA by ESI-IT-MS according to [56]. In addition to the mean value, the results of two independent entries are shown: A isolated from the supernatant after centrifugation and B isolated by dialysis in acid solution (see text). Data are compared with the calculated random distribution based on the CE/UV data. n(Hy) = 2, each measured 3 times in ESI-MS. Hi = standard deviation of the differences in calc. and exp. values for the mean values of A and B. H1, (ci) for the Reuben model, presenting the heterogeneity after correction for regioselective effects in the AGU, is 1.42 (see Section 3.1 and Supplementary Materials, Figure S3). n (Subst.) = number of substituents = HE → CM. DS for DP2, 3, 4 A: 0.63, 0.61, 0.60; B: 0.71; 0.71, 0.65.
Polysaccharides 05 00022 g010
Figure 11. Distribution of HE groups in CMA-1.06 after reduction to HEA, permethylation, partial hydrolysis, and labeling with m-ABA by ESI-IT-MS according to [56]. Data are compared with the calculated random distribution based on the CE/UV data. n(Hy) = 2, each measured 3 times in ESI-MS. Hi = standard deviation of the differences in calc. and exp. values. H1, (ci) for the Reuben model, presenting the heterogeneity after correction for regioselective effects in the AGU, is 1.41 (see Section 3.1).
Polysaccharides 05 00022 g011
Figure 12. Distribution of HE groups in CMA-0.64 after reduction to HEA, permethylation, partial hydrolysis, and labeling with m-ABA by ESI-IT-MS according to [56]. Data are compared with the calculated random distribution based on the CE/UV data. n(Hy) = 1, measured 3 times in ESI-MS. Hi (i = DP) = standard deviation of the differences in calc. and exp. values. H1 values, calculated from Δci of the experimental and Spurlin and Reuben models, are 6.8 and 6.1, respectively (see Section 3.1).
Polysaccharides 05 00022 g012
Figure 13. Distribution of HE groups in CMC-1.26 after reduction to HEC, permethylation of the fully reduced portion (40%), partial hydrolysis, and labeling with m-ABA by ESI-IT-MS according to [56]. Data are compared with the calculated random distribution based on the CE/UV data. n(Hy) = 1, measured 3 times in ESI-MS. Hi (i = DP) = standard deviation of the differences in calc. and exp. values. H1 values, calculated from Δci of the Spurlin and Reuben models, are 0.50 and 1.71, respectively (see Section 3.1, Figure 1a). No Hi values for DP2 and 3 are provided due to the difference in DS values.
Polysaccharides 05 00022 g013
Disclaimer/Publisher’s Note: The statements, opinions and data contained in all publications are solely those of the individual author(s) and contributor(s) and not of MDPI and/or the editor(s). MDPI and/or the editor(s) disclaim responsibility for any injury to people or property resulting from any ideas, methods, instructions or products referred to in the content.

