Review

Polysaccharide as a Separation Medium for Gel Electrophoresis

1
Alliance Protein Laboratories, 13380 Pantera Road, San Diego, CA 92130, USA
2
Research and Development Division, Kyokuto Pharmaceutical Industrial Co., Ltd., 3333-26, Aza-Asayama, Kamitezuna, Tahahagi-shi 318-0004, Japan
*
Authors to whom correspondence should be addressed.
Polysaccharides 2024, 5(3), 380-398; https://doi.org/10.3390/polysaccharides5030024
Submission received: 6 June 2024 / Revised: 16 July 2024 / Accepted: 31 July 2024 / Published: 5 August 2024
(This article belongs to the Collection Current Opinion in Polysaccharides)

Abstract

:
Gel electrophoresis and size exclusion chromatography (SEC) are vital techniques in biochemical research, employing gel matrix structures made of polysaccharides or synthetic polymers like polyacrylamide for the analysis and separation of macromolecules. Polysaccharides, such as agarose, offer safer alternatives to acrylamide. Polysaccharide gels, notably agarose, facilitate the analysis and purification of proteins and nucleic acids through a molecular sieving mechanism. Gel electrophoresis for proteins is mainly divided into denaturing and native methods. Denaturing electrophoresis with sodium dodecyl sulfate (SDS) simplifies protein migration but disrupts molecular interactions. Conversely, native gel electrophoresis, without SDS, allows proteins to migrate based on the running pH and the isoelectric point of the proteins, while nucleic acids consistently migrate toward the anode. The electrophoresis of proteins with variable charges presents complexes. This review focuses on the use of polysaccharides, particularly agarose, for native gel electrophoresis, highlighting their applications in separating macromolecules. It also discusses the applications and limitations of agarose gels when used as a matrix for electrophoresis. Such information should help in designing electrophoresis experiments using polysaccharides.

1. Introduction

Gel electrophoresis and size exclusion chromatography (SEC) are two fundamental technologies in biochemical research. Both technologies use gel matrix structures for separating macromolecules. Gels are made of either polysaccharides or synthetic polymers. Gels for electrophoresis employ both polyacrylamide and polysaccharides, which include starch, cellulose and agarose. Among polysaccharide gels, agarose is most frequently used, in particular for the analysis of nucleic acids. As is evident from their applications in food products, polysaccharides are much safer than the acrylamide monomers that need to be polymerized. Polysaccharide gels have been used to analyze and purify proteins and nucleic acids and their interactions [1,2,3,4]. They offer a molecular sieving mechanism for macromolecules, leading to separation based on the different molecular sizes of the macromolecules. In applications for proteins, gel electrophoresis is mainly divided into denaturing and native electrophoresis. Denaturing electrophoresis mostly uses sodium dodecyl sulfate (SDS), which is negatively charged and binds to proteins. The SDS–protein complex is, thus, negatively charged and migrates toward the anode under the electric field. However, SDS disrupts molecular interactions and, hence, makes the analysis of macromolecular complexes impossible [5,6,7,8]. On the contrary, native gel electrophoresis is done in the absence of denaturing SDS and, thus, can analyze macromolecular complexes. While SDS–protein complexes always migrate toward the anode in SDS gel electrophoresis, native proteins and their complexes migrate toward both the anode and cathode, depending on the pH of the gel electrophoresis system and the isoelectric point of the analyte. Since nucleic acids are always negatively charged, they always migrate toward the anode, making their electrophoresis experiments more feasible under native conditions. Here, we review the use of polysaccharides for native gel electrophoresis and aim to demonstrate the applicability of agarose gels for the analysis of not only nucleic acids but also proteins, especially in the current context, where commercially available polyacrylamide gels dominate in protein research. Various examples of agarose native gel electrophoresis should highlight the advantages of this technology.

2. Mechanism of Molecular Sieving

Gel structure offers a sieving mechanism for macromolecules, which is utilized in both SEC and electrophoresis. However, the sieving mechanism is fundamentally different, as shown in Figure 1, between SEC and gel electrophoresis. Figure 1A shows the mechanism for SEC, in which a macromolecule is partitioned between the cone-shaped hole in the gel beads and the bulk phase outside the beads. It is more difficult for a larger macromolecule to penetrate the cone-shaped hole, and, thus, it is more excluded from staying in the hole. Smaller molecules stay longer in the hole. If the hole size is smaller than the macromolecule, the macromolecular solute is totally excluded from the holes. When the solution flows, those macromolecules that have a lower partition coefficient and spend less time in the hole move faster with the solution flow than the smaller macromolecules, as depicted by the different sizes of the arrows and their positions in the SEC column.
The size dependence of the migration rate is the opposite in gel electrophoresis. As shown in Figure 1B, the separation matrix is entirely made of gel structure, and, hence, there is no bulk phase as in the SEC matrix. Migration is faster for smaller macromolecules than for larger ones. This relation is schematically expressed in Figure 1B, where we show that it would be more difficult for a large macromolecule to pass through a mesh than it would be for its smaller counterpart, as depicted with the different arrows that indicate the varying mobility of molecules in the electrophoretic gel matrix.

3. Polysaccharide vs. Polyacrylamide

Rees [9] proposed a step-wise formation of α-helical bundles of agarose chain, as depicted in Figure 2A. Random coils of melted agarose are converted to α-helical bundles that, in turn, form a network structure, resulting in the formation of a gel matrix that traps water molecules with an internal pore size of, e.g., 0.05–0.1 μm [10], although the pore diameter shows a strong dependence on agarose concentration and ionic strength [11]. This bundle structure may increase the gel strength at low agarose concentrations. In fact, it has been shown that those agarose gels that are highly charged have weak gel strength due to charge repulsion between the agarose chains during the process of forming helical bundles (see Figure 2A) [12,13]. Namely, charged gels may be unstable for electrophoresis purposes.
A similar gel structure was observed with polyacrylamide, which has a similar pore size, in the range of, e.g., 130 nm for 3.5% gels to 70 nm for 10.5% gels at a constant bis-acrylamide concentration of 3% [14,15]. As seen in Figure 2B, long polyacrylamide chains are cross-linked by bis-acrylamide in polyacrylamide gels. Both agarose and polyacrylamide gels are made of rod-like fibers that form a gel network, through which macromolecules move. On the contrary, starch gels are made of a stack of hollow boxes, as depicted in Figure 2C, just like bee honeycomb. They are made of walls, not rod-like fibers. The pore size of starch gels appears to be much larger than the pore sizes of agarose and polyacrylamide gels, in the order of, e.g., 10–30 μm at 12% starch, although different pore sizes have been reported [16]. Different from the agarose gels and polyacrylamide gels, the internal cells or pores of starch gels are surrounded by imperfect walls, through which macromolecules move.
There are other polymers similar to polyacrylamide that can form gels (called hydrogels), and they are developed for medical use, such as tissue engineering [17,18,19]. Biodegradable hydrogels made from cross-linked polymers or non-covalent interactions can absorb a large amount of water, and they are used in agriculture, biomaterials, drug delivery and regenerative medicine [17,18,19]. These polymers are also used to make films for artificial muscles and wound dressing [20,21]. Among various synthetic polymers, acrylamide is perhaps the only one used for gel electrophoresis. Other synthetic polymers may form gels that are too porous for separating macromolecules, while such properties are ideal for tissue engineering and other biomedical applications. Among biocompatible polymers, agarose also appears to be most suitable for gel electrophoresis.

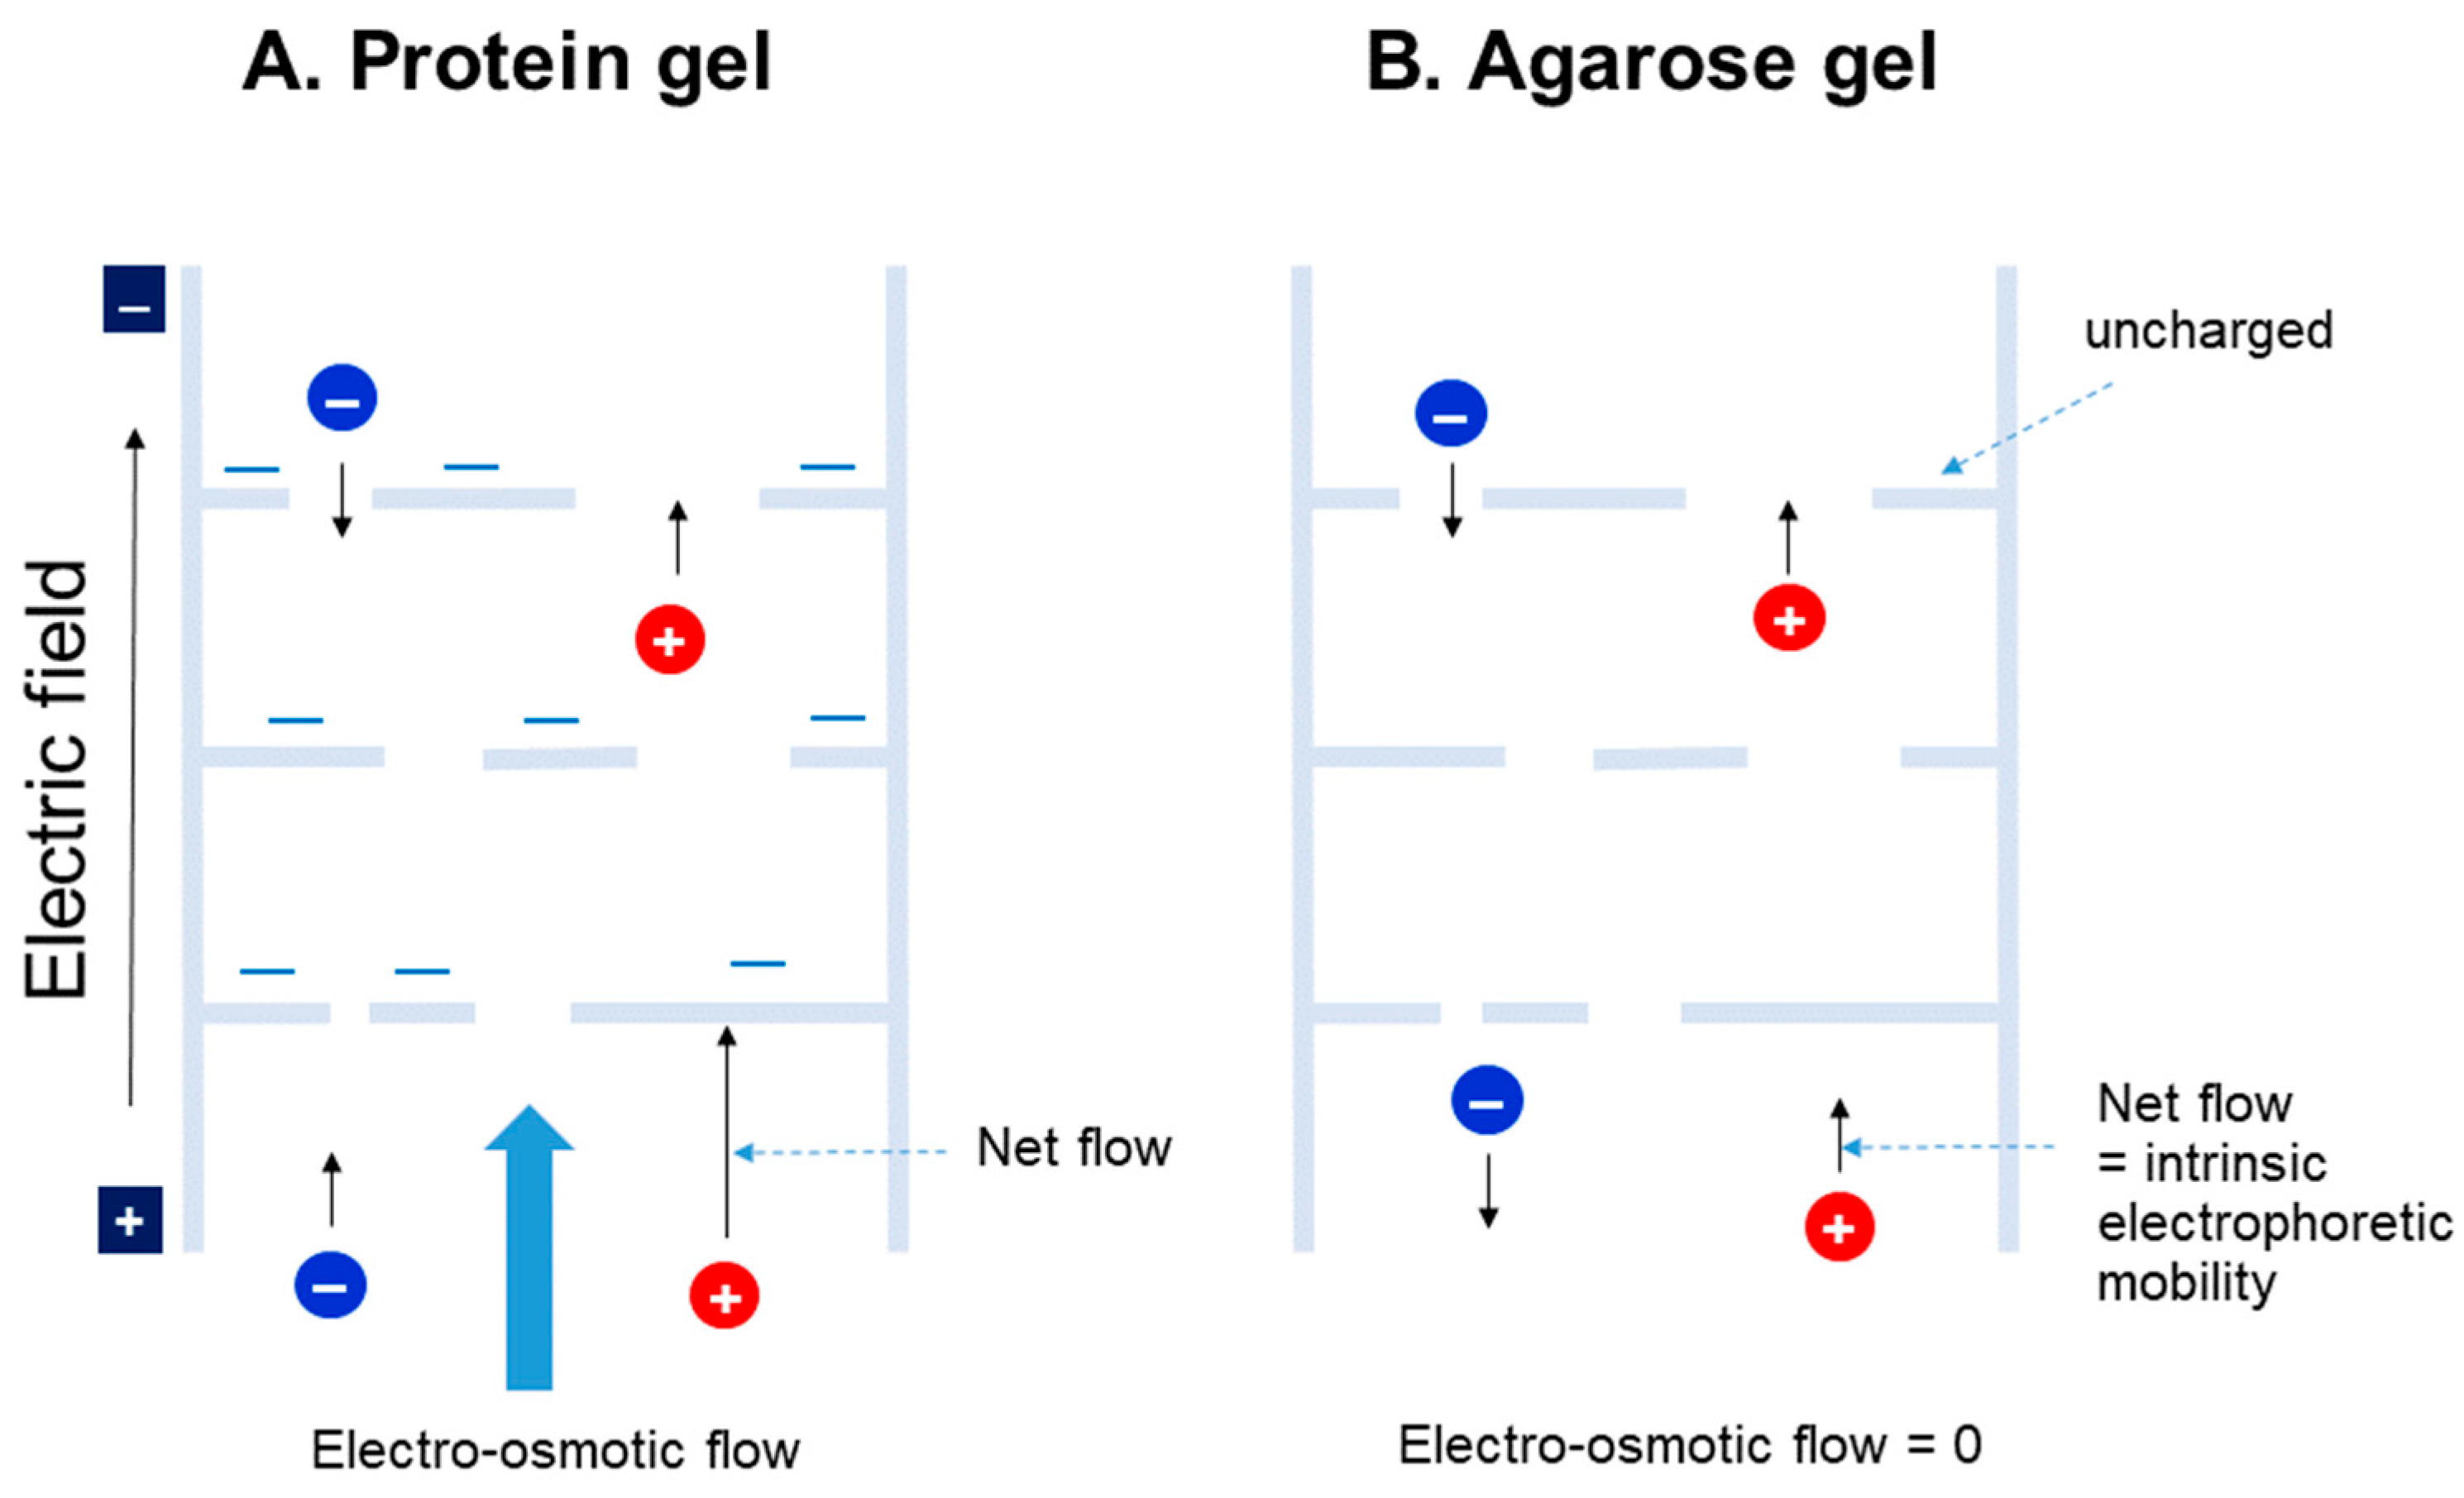
4. Agarose Gel vs. Protein Gel

Gel electrophoresis uses, among various biological resources, almost entirely polysaccharide or polyacrylamide gels. However, in food product areas, proteins, e.g., gelatins and glutens, are extensively utilized for generating gel structures. Why is protein gel not utilized in electrophoresis? Differences between those gels made of polysaccharides and those made of proteins are related to their charges and the other functional groups in proteins. As shown in Figure 3, proteins can, in general, possess many charged groups and thus, as a result, charges on the gel structure. When an electric field is applied during electrophoresis, the gel structure may change, as the positively charged segments may move toward the cathode and vice versa. An additional disadvantage may be the binding of sample macromolecules meant to be analyzed to the protein gels by various interaction forces. Lastly, and perhaps most importantly, is the electro-osmotic flow of water through the gel. As depicted in Figure 3 (left), for example, the gel may be negatively charged. The negatively charged stationary protein gel cannot move toward the anode, and instead, water moves toward the cathode as depicted in Figure 3, in the form of a flow called “electro-osmotic flow’. This phenomenon has been explained by the accumulation of counter-ions on the charged stationary surface. For example, positive ions accumulate on the negatively charged gel surface and move toward the cathode, carrying along water molecules under the electric field. On the other hand, polysaccharide gels that are not charged or are less charged do not suffer significant electro-osmotic flow. Thus, the mobility of the macromolecules is affected by the electro-osmotic flow in protein gels, but not in polysaccharide (e.g., agarose) gels. Thus, the intrinsic electrophoretic mobility of the negatively charged macromolecule moving toward the anode may be reversed by the electro-osmotic flow, as shown in panel A (blue circle).

5. Denaturing vs. Native Gel Electrophoresis

As stated in the introduction, two types of gel electrophoresis are, in principle, employed for the analysis and purification of macromolecules. SDS gel electrophoresis is a major denaturing electrophoresis, as SDS disrupts the structure and inter-molecular interactions of the proteins [6], except for certain amyloid structures that are stable against SDS [22]. SDS gel electrophoresis can be done in both polyacrylamide and polysaccharide gels. In the presence of SDS, protein structures and complexes are destroyed. On the other hand, native gel electrophoresis is done without SDS and, hence, under non-denaturing conditions, where protein structures and molecular assemblies are retained in the native state. There is another fundamental difference between SDS and native gel electrophoresis. SDS provides negative charges to the proteins and, thereby, makes the proteins universally negatively charged. This makes proteins migrate toward the anode, regardless of their intrinsic charges, and simplifies the electrophoretic procedure. This condition applies to nucleic acids, which are always negatively charged, causing them to always migrate toward the anode. On the contrary, proteins can have either negative or positive charges, depending on the solution’s pH and the pI of the proteins. As shown later in the application section, proteins can migrate toward either the cathode or anode, depending on the pI of the proteins and the running pH of the electrophoresis. This is depicted in Figure 4, where the running pH of the electrophoresis is assumed to be 6.1; this running pH was developed recently by us [23]. Both acidic proteins with pIs below 6.1 and nucleic acids are negatively charged at pH 6.1 and migrate toward the anode, and basic proteins with pI s above 6.1 are positively charged at pH 6.1 and run toward the cathode.

6. Effect of Small Pore Structure

The approximate pore sizes of various gel structures have been determined, as described earlier. For example, a 0.1–0.5 μm pore size was indicated for 1% agarose gels, and 0.05 μm was suggested for polyacrylamide gels. BSA has a hydrodynamic radius of ~0.007 μm, as shown in Figure 5. It thus seems that the pore size of the gel is rather small relative to the volume of the BSA molecules that move into the pores during electrophoresis. Let us assume that there is 1 mg/mL of BSA in each pore and calculate how many BSA molecules are in a cubic box of (0.1 − 2 × 0.007) μm length, i.e., a volume (μL) of 0.0863. This number, 0.086, corresponds to the length of the cell where the center of the BSA can move. The inside of this length (Figure 5, shown by the dotted line) is not available for the BSA to occupy. In other words, the diffusion is limited in the cell to within the volume (μL) of 0.0863. At 1 mg/mL BSA, about 5.74 × 10⁹ molecules of BSA will be present within this volume. Assuming the partial specific volume of 0.73 mL/gram (protein volume per gram protein), the volume fraction of BSA within this volume was calculated as 0.11% at 1 mg/mL and 1.1% at 10 mg/mL. When the cell (pore) size was reduced to 0.05 μm, the volume fraction increased to 0.2% at 1 mg/mL and 2% at 10 mg/mL. However, this assumes that a protein molecule can approach the surface of another protein molecule and, hence, ignores the excluded volume effect of the protein molecule itself. As shown in Figure 6, the center of a protein molecule cannot penetrate the space between the radius of another protein molecule and the protein surface (shown by the dotted line). Thus, a more reasonable calculation uses the protein volume of 0.73 × 8 mL/gram. Using this value, the volume fraction becomes 9.2% for a 0.1 μm cell at 10 mg/mL and 16% for a 0.05 μm cell at 10 mg/mL. This small cell effect may cause the protein oligomerization of monomeric proteins or the renaturation of unfolded proteins, as seen in crowded environments, where steric exclusion between macromolecules forces protein to either associate or condense, both of which can reduce the surface area, as depicted in Figure 5 [24,25,26,27,28,29].

7. Application of Agarose Gel Electrophoresis

Gel electrophoresis is one of the most highly used technologies in many areas of bioscience. There are extensive studies that have used this technology, and it is not possible to cover all of them in this review. Thus, we will introduce typical applications of native gel electrophoresis using agarose gels. There are a number of agaroses that are commercially available. Among them, we have observed significant differences between a standard UltraPure agarose gel and a high-resolution MetaPhor agarose gel. MetaPhor gels are derived from the standard agarose gels by chemical modification. UltraPure gels have high gel strength at low concentrations, as has been described earlier, and become too viscous above 5%, which hampers the production of high-concentration gels. On the contrary, the MetaPhor gels are too brittle to make low-concentration gels (e.g., below 5%). However, they have a high size resolution, resulting in, for example, a separation of BSA oligomers that cannot be achieved by the UltraPure agarose [30]. The examples below are most likely obtained using the standard agarose gels, even when not explicitly indicated, due to the high cost and handling difficulty of the MetaPhor agarose.

7.1. Nucleic Acids

Agarose gel electrophoresis is widely used in nucleic acid analysis [31]. This is perhaps due to the large pore size of agarose gel, which allows for highly extended nucleic acids to migrate, owing to the high gel strength even at low concentrations, as described earlier in Figure 2A. Gel electrophoresis gained popularity for nucleic acid separation with the discovery of restriction enzymes and the use of fluorescent reagents (e.g., Ethidium bromide) for detection in recombinant DNA technology [32,33]. There are a number of buffers used for agarose electrophoresis; common ones for nucleic acids include Tris/acetate/EDTA (TAE) and Tris/borate/EDTA (TBE). This technology greatly benefits molecular cloning, PCR, genome editing, and next-generation sequencing. Figure 7A shows typical gel formats, where gels are made in a horizontal or vertical mode. In the former format, gels are immersed in a running buffer, while in the latter, the upper part of the gel is immersed in the cathode buffer and the lower part is immersed in the anode buffer. Figure 7B shows the results using GelGreen fluorescence detection with the TAE buffer for the analysis of three plasmids, which are well characterized by different digestion patterns. Figure 7B clearly demonstrates that the examination field of nucleic acid is always the anode side of the sample loading position in native gel electrophoresis.

7.1.1. Gel Shift Assay
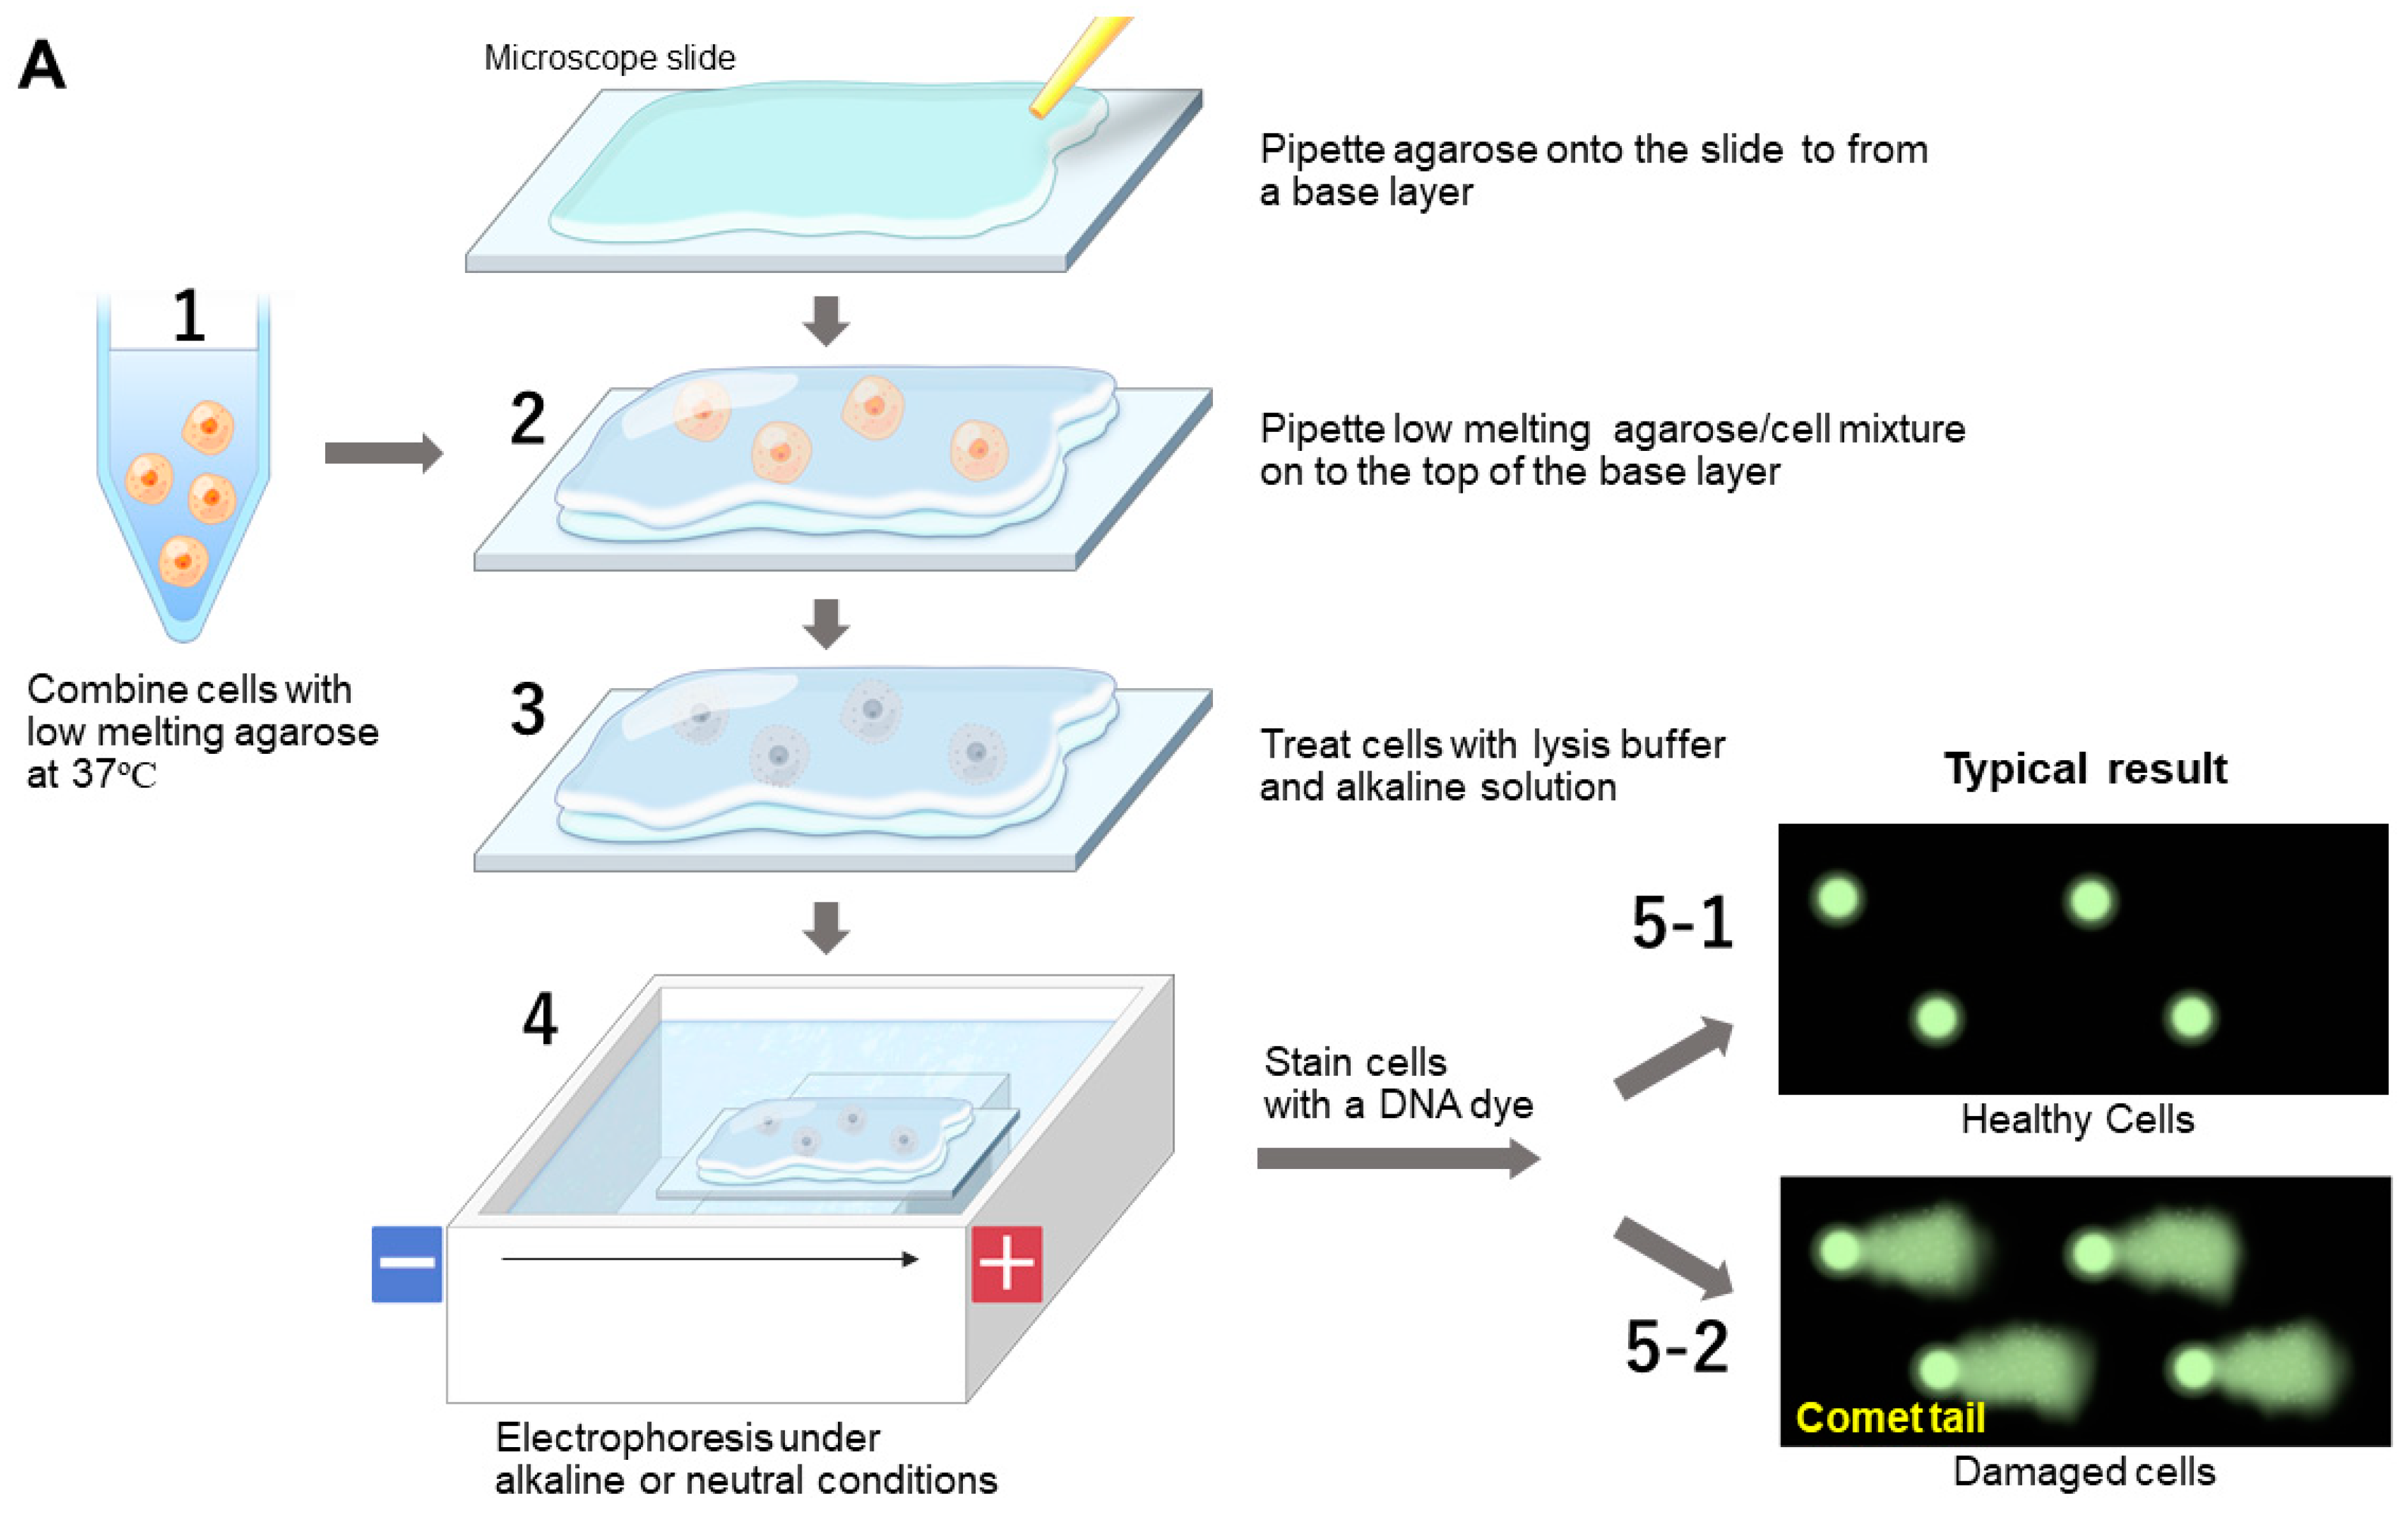
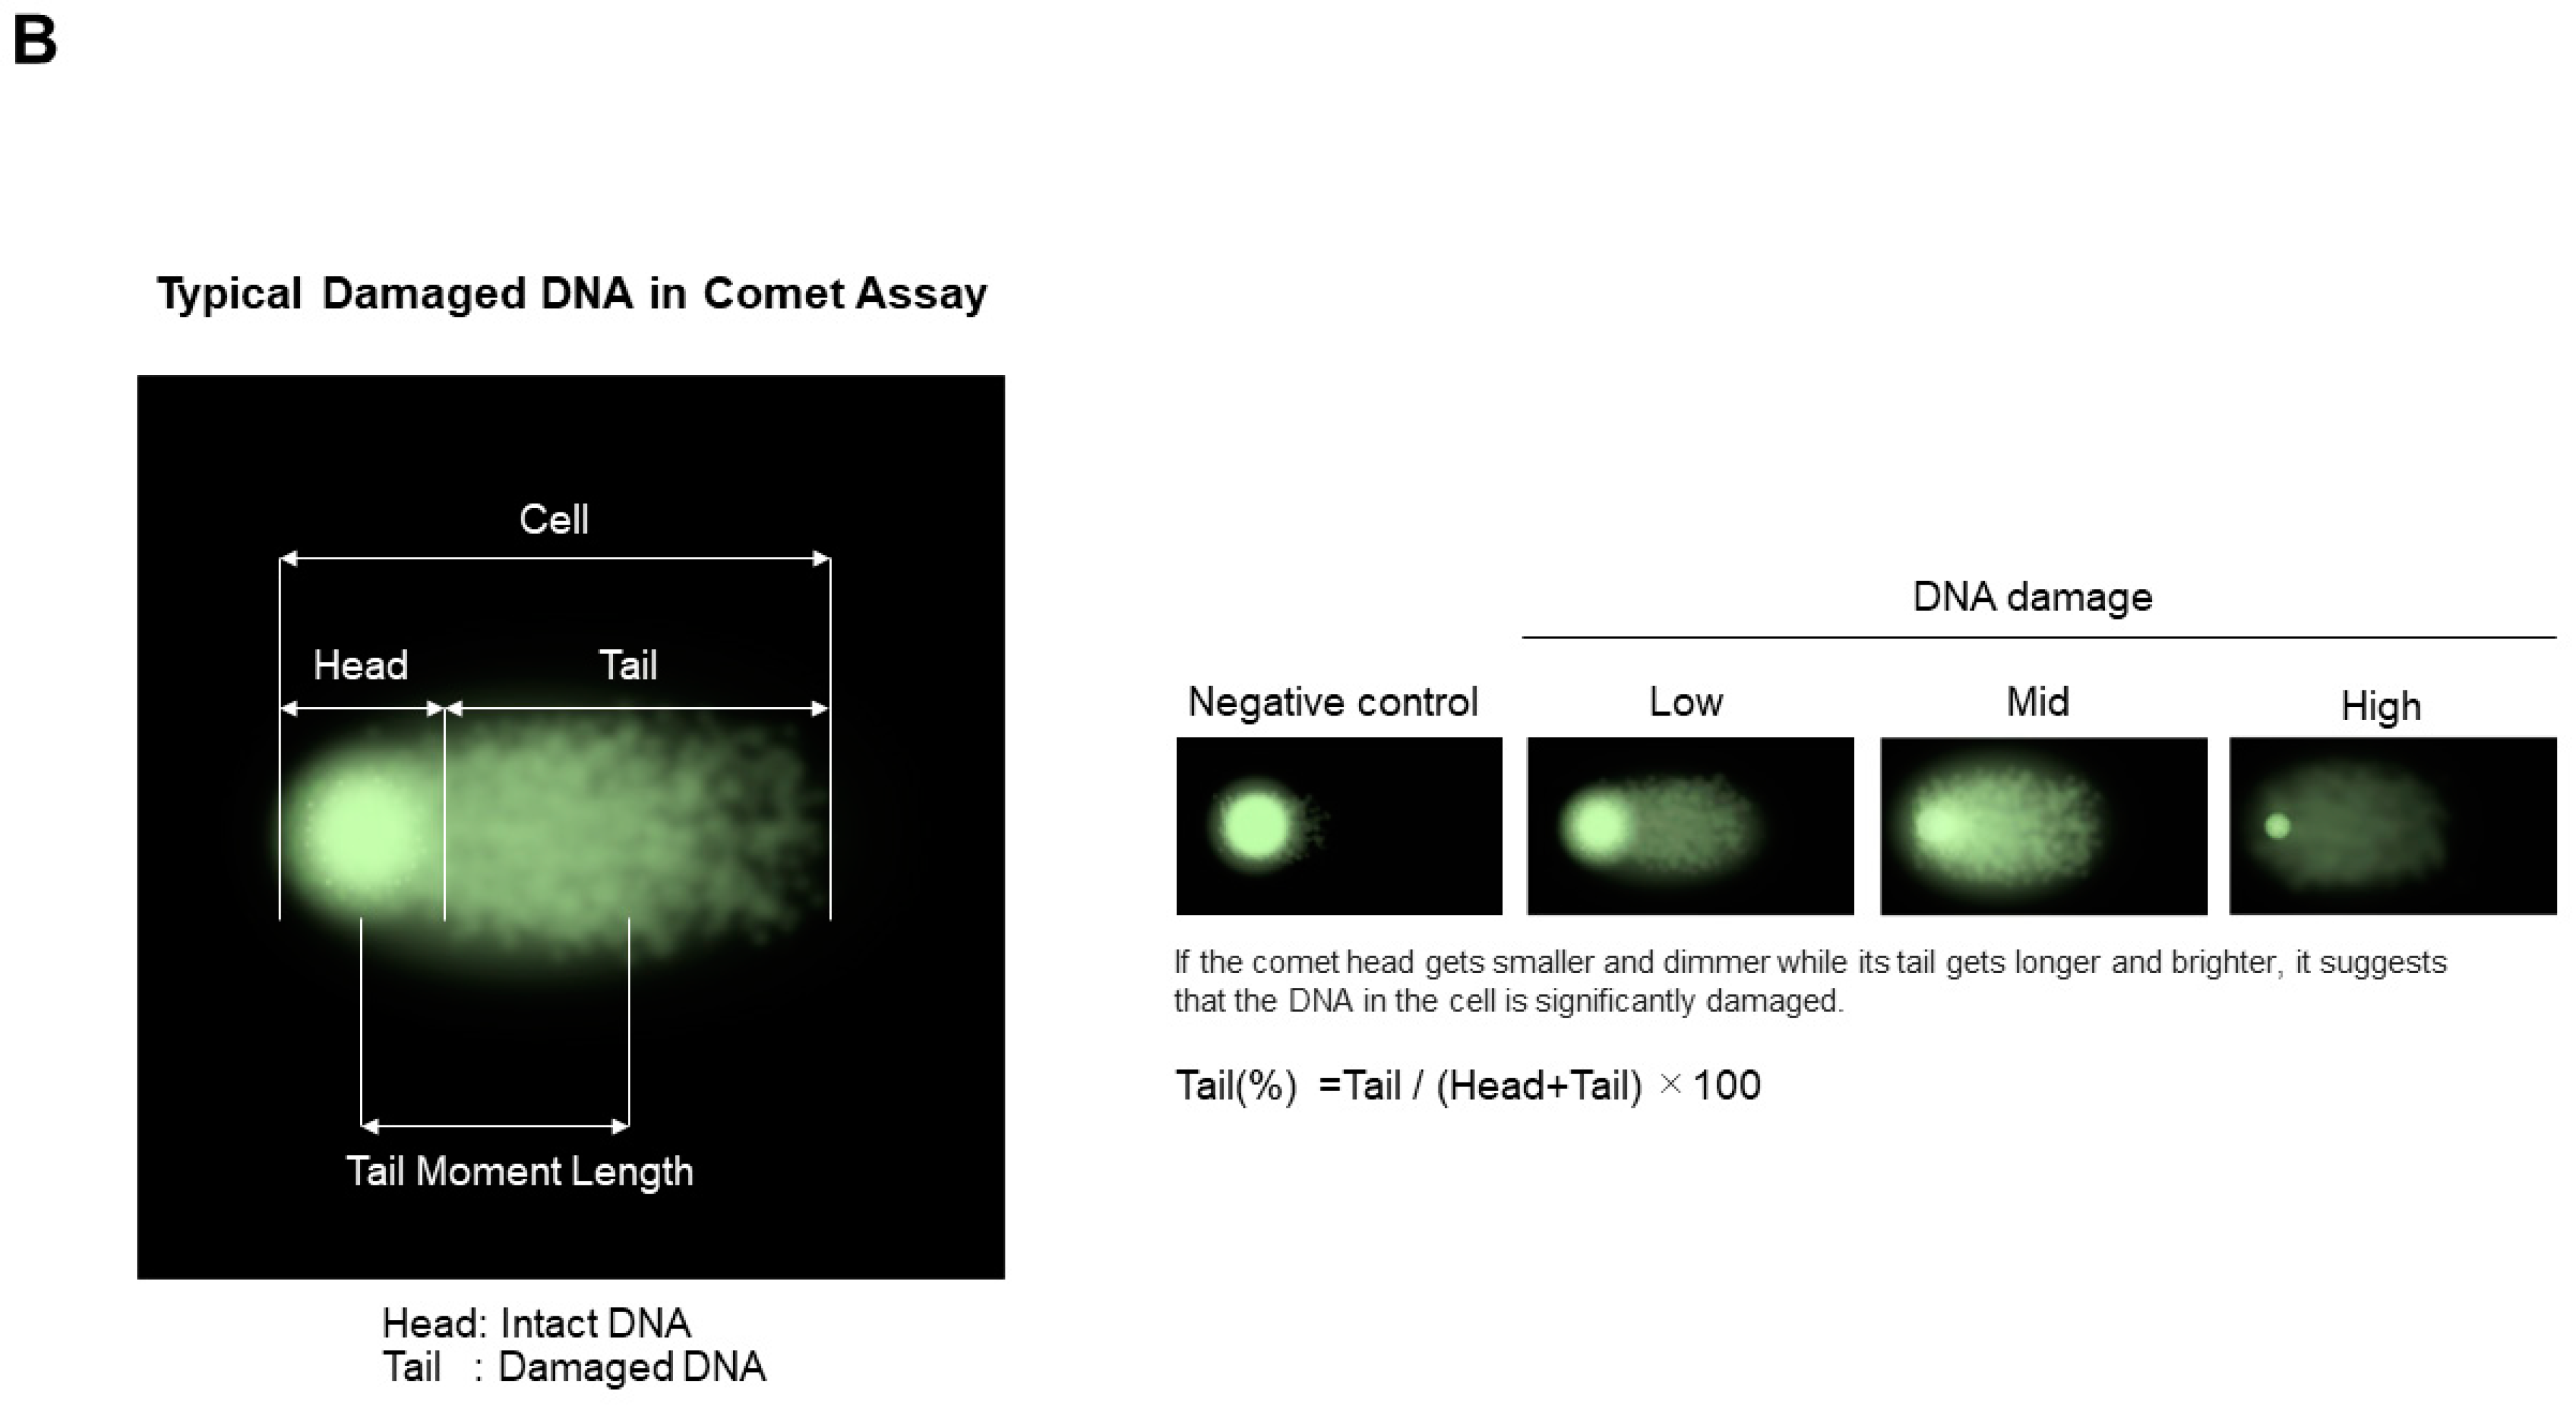
A gel shift assay, or electrophoretic mobility shift assay (EMSA), also referred to as mobility shift electrophoresis, a gel mobility shift assay, a band shift assay, or a gel retardation assay, is a common affinity electrophoresis technique used to study protein–DNA or protein–RNA interactions [34,35]. The most widely used running conditions for a gel shift assay are polyacrylamide with a TAE buffer. Vossen et al. reported an alternative method using agarose gel, 2 mM Tris-acetate (pH 8.0) and 0.5 mM EDTA [36]. They proposed agarose, specifically MetaPhor XR agarose, as a solution for analyzing large protein complexes that present challenges with polyacrylamide gels. Nevertheless, when employing the above alkaline buffers (TAE or Tris-acetate) for electrophoresis, the nucleic acid-binding proteins (that are highly basic) and their complexes with nucleic acid may fail to migrate into the gel, remaining near the wells. Addressing this issue, we have developed a novel running buffer—0.1 M His/0.1 M MES (pH 6.1)—potentially capable of facilitating the migration of basic proteins and their complexes in agarose gel. This is schematically depicted in Figure 8, which compares the expected changes in nucleic acid bands upon protein binding at pH 8.3 (conventional pH 8.3 TAE buffer) and pH 6.1 (new buffer). Since nucleic acids are negatively charged, the proteins that bind to them are usually positively charged. The binding of positively charged proteins to nucleic acids leads to the loss of negatively charged nucleic acid bands at pHs of both 8.3 and 6.1. However, complex bands may exhibit different behaviors at the two pH levels. This is shown in Figure 8, where the pI of the complex is too close to pH 8.3, with the result that there is little migration of the complex. On the contrary, the complex acquires a positive charge (namely, the charged state of nucleic acids is reversed by their binding to basic proteins), and it moves toward the cathode at pH 6.1. In addition, for unknown reasons, those bands that move toward the cathode normally show smearing or a round shape in the pH 8.3 system. Such problems are reduced when using the new pH 6.1 buffer system.

7.1.2. Comet Assay

The comet assay, or single-cell gel electrophoresis assay, is a sensitive, cost-effective and reliable technique for assessing DNA damage and repair in individual cells [37,38,39,40]. First introduced in 1984 [41] and later optimized [42,43], this method leverages the porous structure of agarose gels and applies them to various eukaryotic and prokaryotic cells, including those from human, animal and plant tissues.
The comet assay has two main types: the neutral comet assay, which detects double-stranded DNA breaks, and the alkaline comet assay, which detects both single- and double-stranded breaks under denaturing conditions [44]. The alkaline version is more sensitive and, thus, more commonly used.
As depicted in Figure 9A, the alkaline assay procedure involves embedding cells in low-melting-point agarose (step 1), lysing them with Triton X-100 and high-salt buffer to release cellular components (step 2), and then incubating them in an alkaline buffer (step 3) before electrophoresis (step 4) [45]. DNA is stained with intercalating dyes like propidium iodide or ethidium bromide and visualized under a fluorescence microscope [46,47]. Healthy cells display intact nucleic acids as the round shape (step 5-1), whereas damaged DNA forms a “comet tail” (step 5-2), indicating the extent of damage [48]. This comet shape is characterized by the comet head corresponding to the intact DNA and the comet tail corresponding to the damaged DNA, as shown in Figure 9B. The tail moment length corresponding to the length between the center of the round-shaped intact DNA and the center of the comet shape is used to assess the magnitude of the DNA damage. The actual image of the comet as a function of the DNA damage is shown in Figure 9B, categorized by low, mid and high levels (right panel).
In 2016, the OECD established guidelines for the use of the comet assay in vivo in animals. Its applications span genotoxicity testing, human biomonitoring, DNA repair studies, environmental biomonitoring, and clinical research [49,50]. The advantages of the comet assay include its simplicity, quick results, low cost, and minimal cell requirements [51,52]. However, it faces limitations such as low throughput, difficulty distinguishing between live and dead cells, and high variability between laboratories [53].
To enhance throughput and consistency, advanced methods like mini-gel slides, GelBond films, and CometChips have been developed [54,55,56,57,58]. These innovations are solidifying the comet assay’s critical role in genetic toxicology, medical research, and environmental biomonitoring.

7.2. Proteins

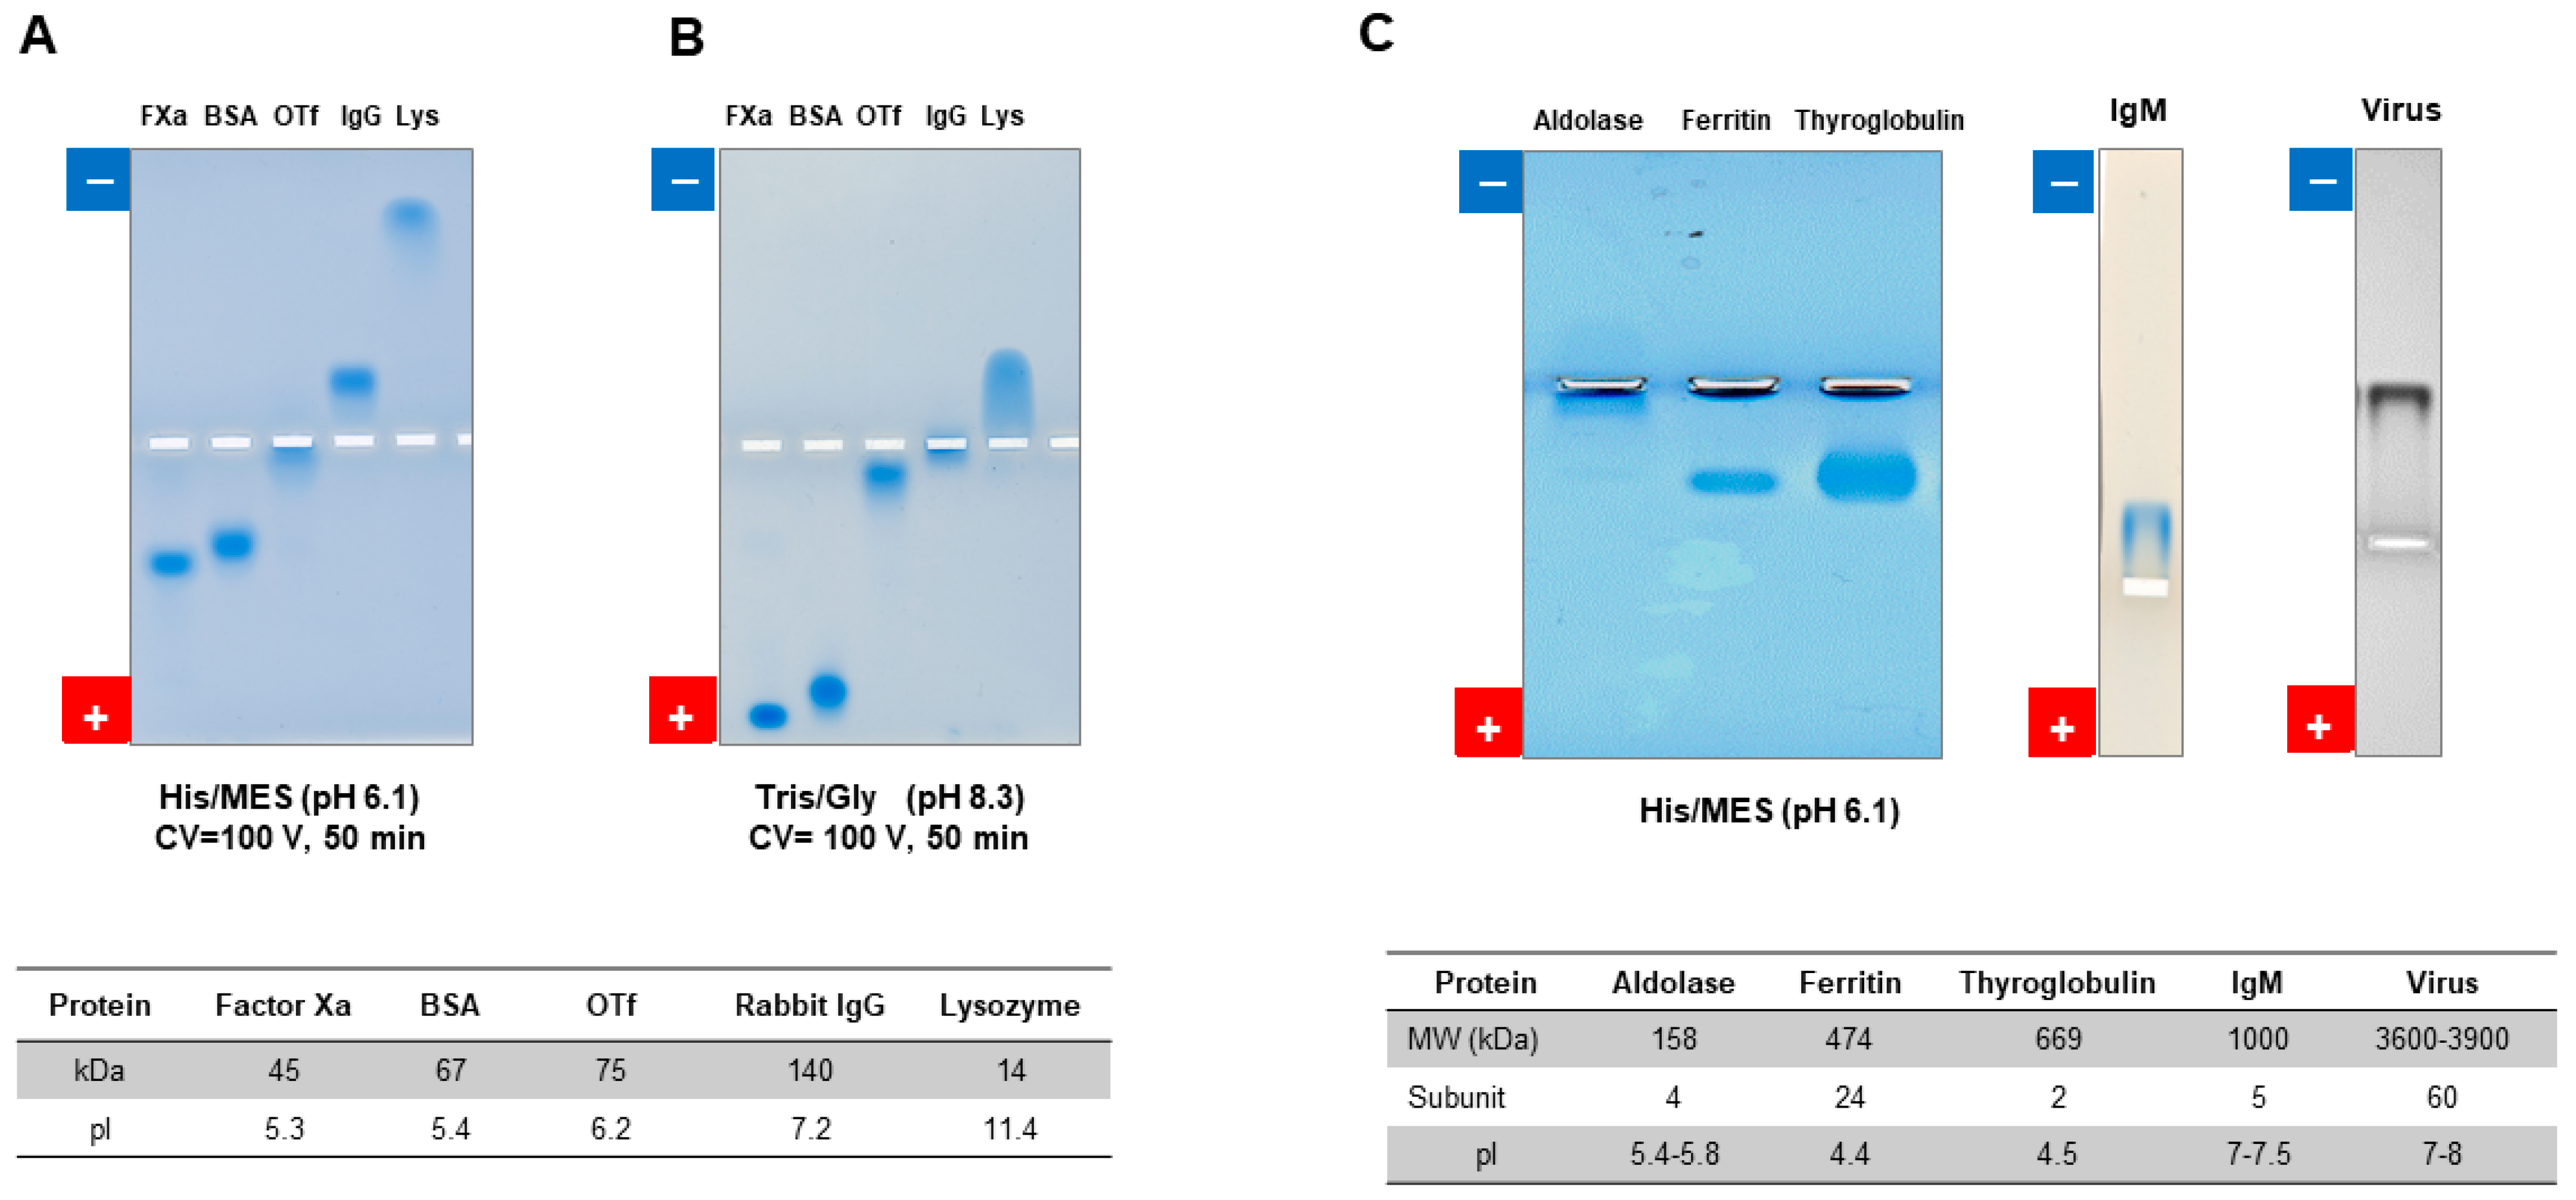
7.2.1. Native Gel Electrophoresis

We recently developed a new method that involves replacing the conventional Tris-glycine buffer (pH 8.3) with 0.1 M His/0.1 M MES (pH 6.1) in agarose gel electrophoresis [34]. This innovative approach enables the comprehensive analysis of proteins and their complexes across a broad spectrum of isoelectric points (pI). Through our research endeavors, we substantiated its potential, particularly in the evaluation of basic proteins, including antibodies, which have posed challenges in electrophoresis analysis [59,60]. The porous nature of agarose gel can be used for a variety of structures that differ widely in size. Figure 10 shows the data with 1% agarose gel for different proteins and a virus. Figure 10A shows the agarose native gel electrophoresis using the pH 6.1 system for recombinant factor Xa, BSA, ovotransferrin (OTf), a monoclonal antibody (rabbit IgG) and lysozyme. Except for OTf, with a pI close to 6.1 (running pH), the other four proteins show reasonable band profiles with the pH 6.1 system. On the contrary, the pH 8.3 shows little migration for OTf, rabbit IgG and lysozyme (Figure 10B). The observed smearing band for lysozyme indicates the odd electrophoretic mobility behavior for basic proteins that migrate toward the cathode in the pH 8.3 system. Figure 10C shows the results of the pH 6.1 system for aldolase, ferritin, thyroglobulin, a high-molecular-weight IgM and virus. Except for aldolase, the other four proteins, including IgM and virus, show migration toward both the anode and cathode. The same gel has been used to study the electrophoretic properties of a phage structure and a short peptide.

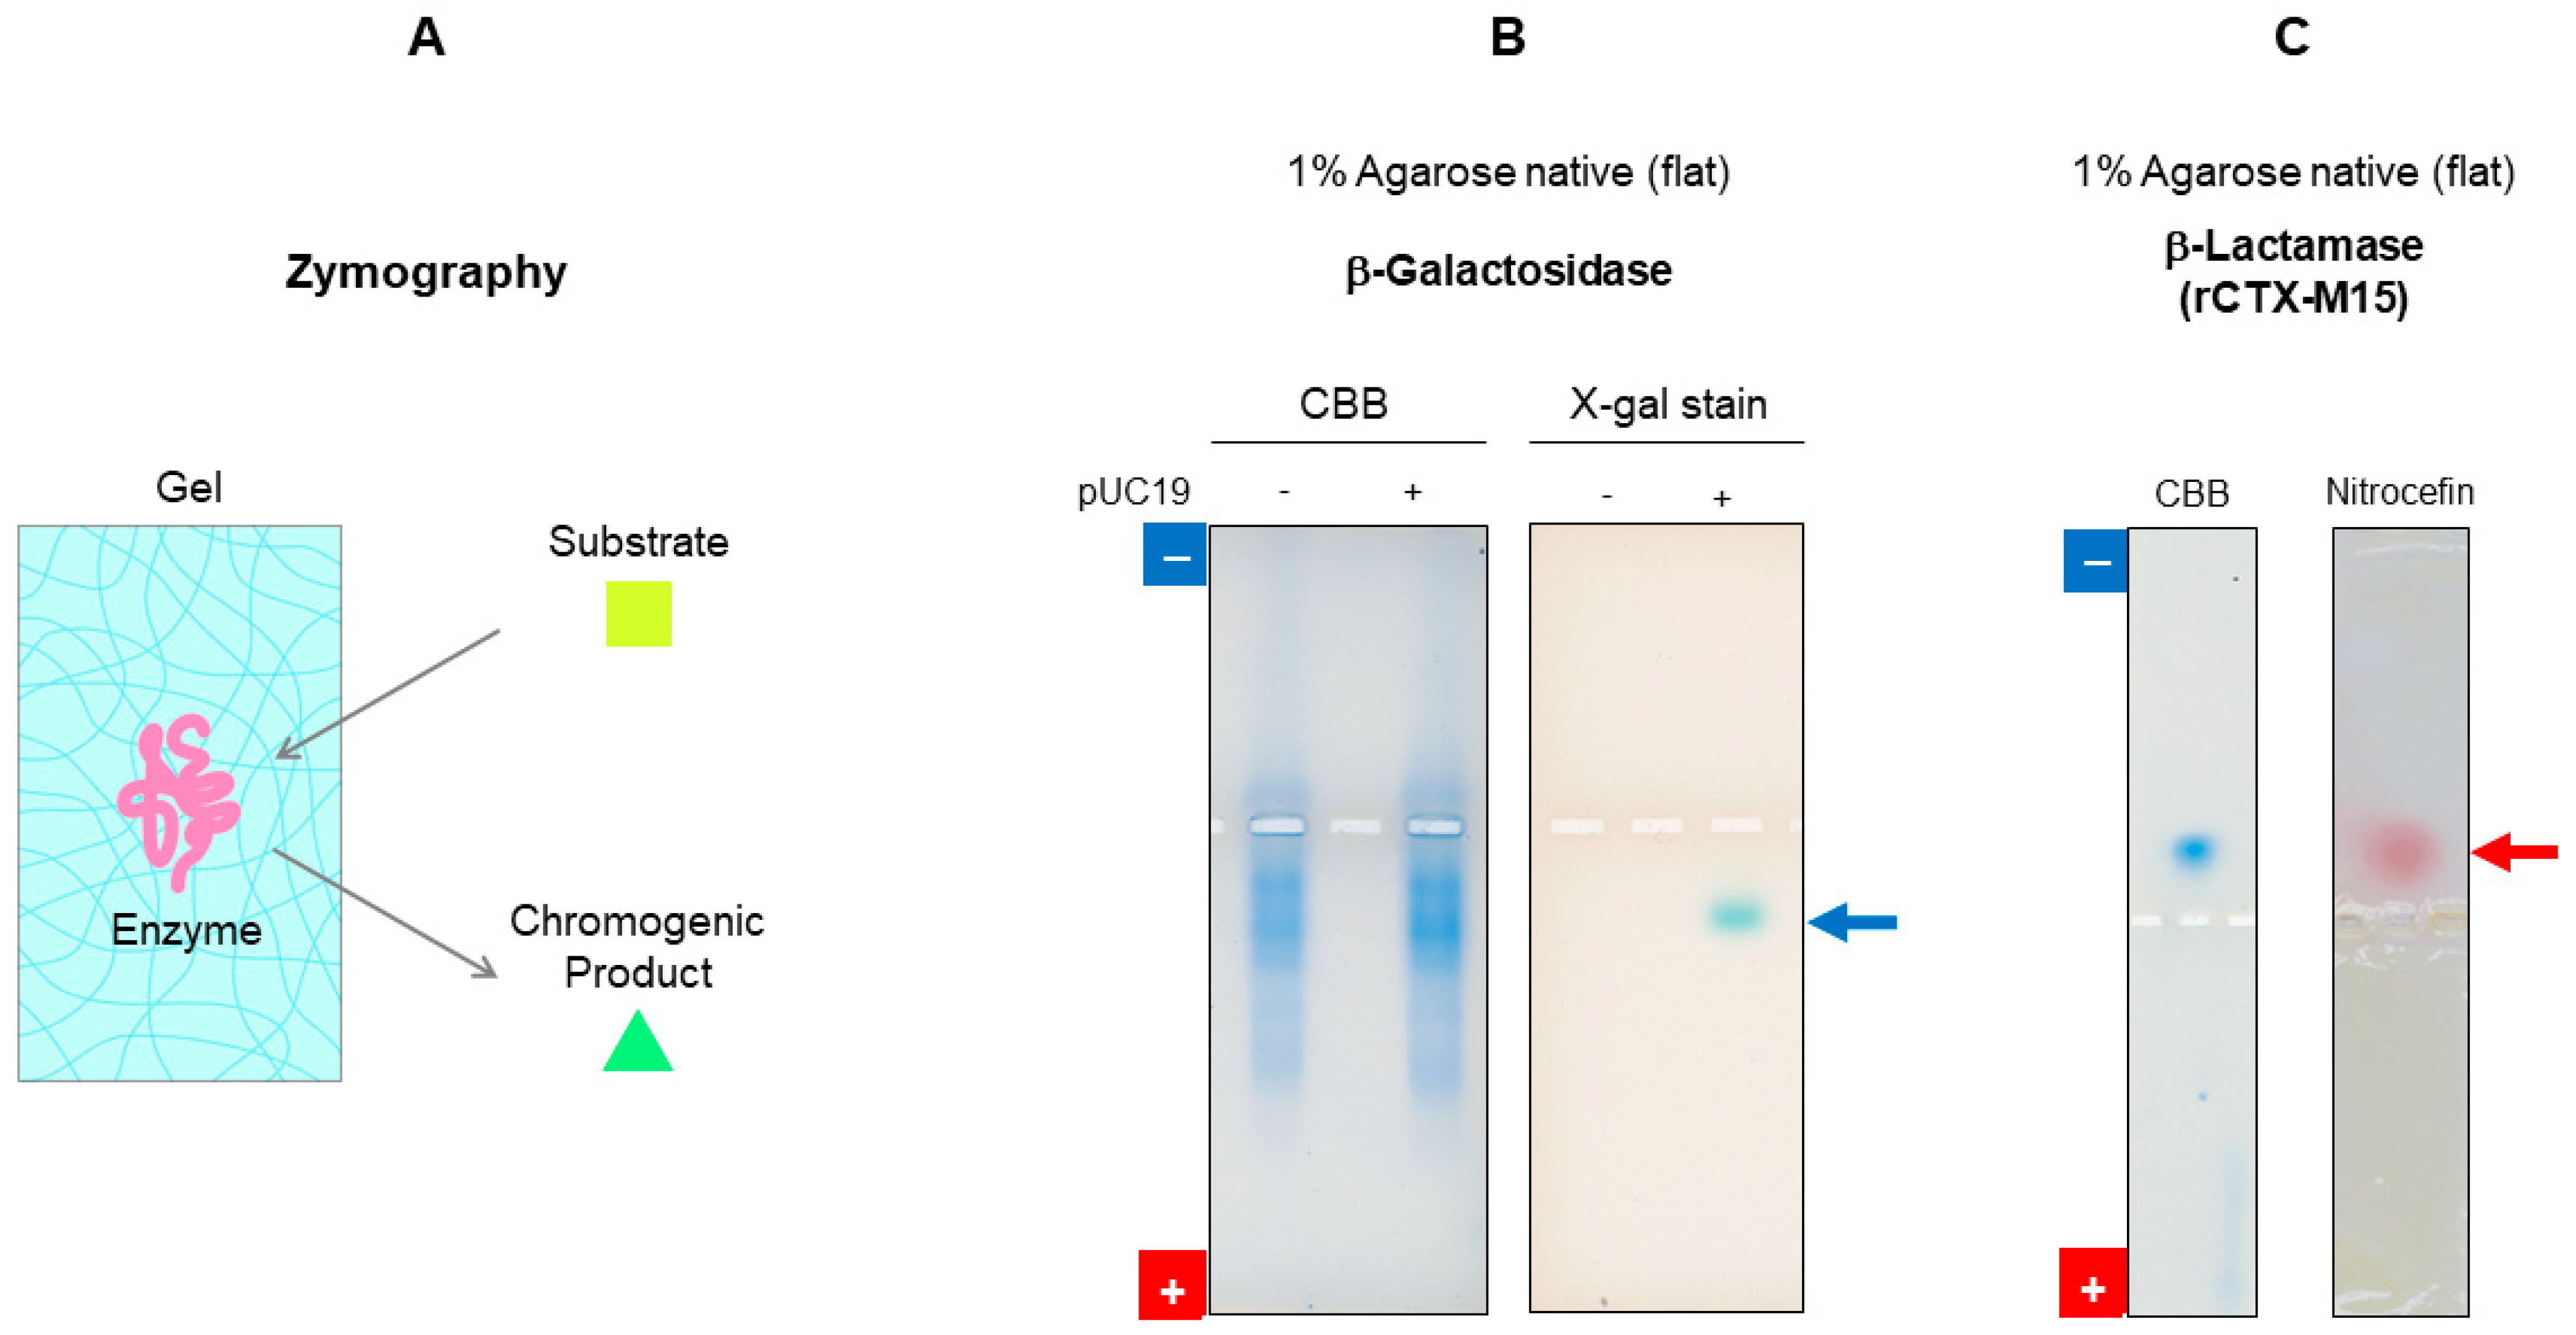
7.2.2. Activity Staining

There are a number of potential applications of agarose native gel electrophoresis for the functional assessment of proteins based on the porous nature of the gels. Zymography is one of them; it is based on the diffusion of the enzyme substrate to the gel and its reaction with the enzyme band on the gel. Chromogenic conversion of the substrate to the product by the enzyme on the gel leads to staining of the active protein band, as shown in Figure 11A [61,62,63]. Also shown in Figure 11B is the result of agarose native gel electrophoresis of enzymatically active β-galactosidase that reacts with its substrate, X-gal, in the gel to generate a band (shown by arrow) [64]. As another example of zymography, the result of active β-lactamase (recombinant CTX-M15) [65] is also shown in Figure 11C. The chromogenic cephalosporin substrate, nitrocefin, indicates the presence of β-lactamase activity by the appearance of a red color (shown by red arrow) [66].

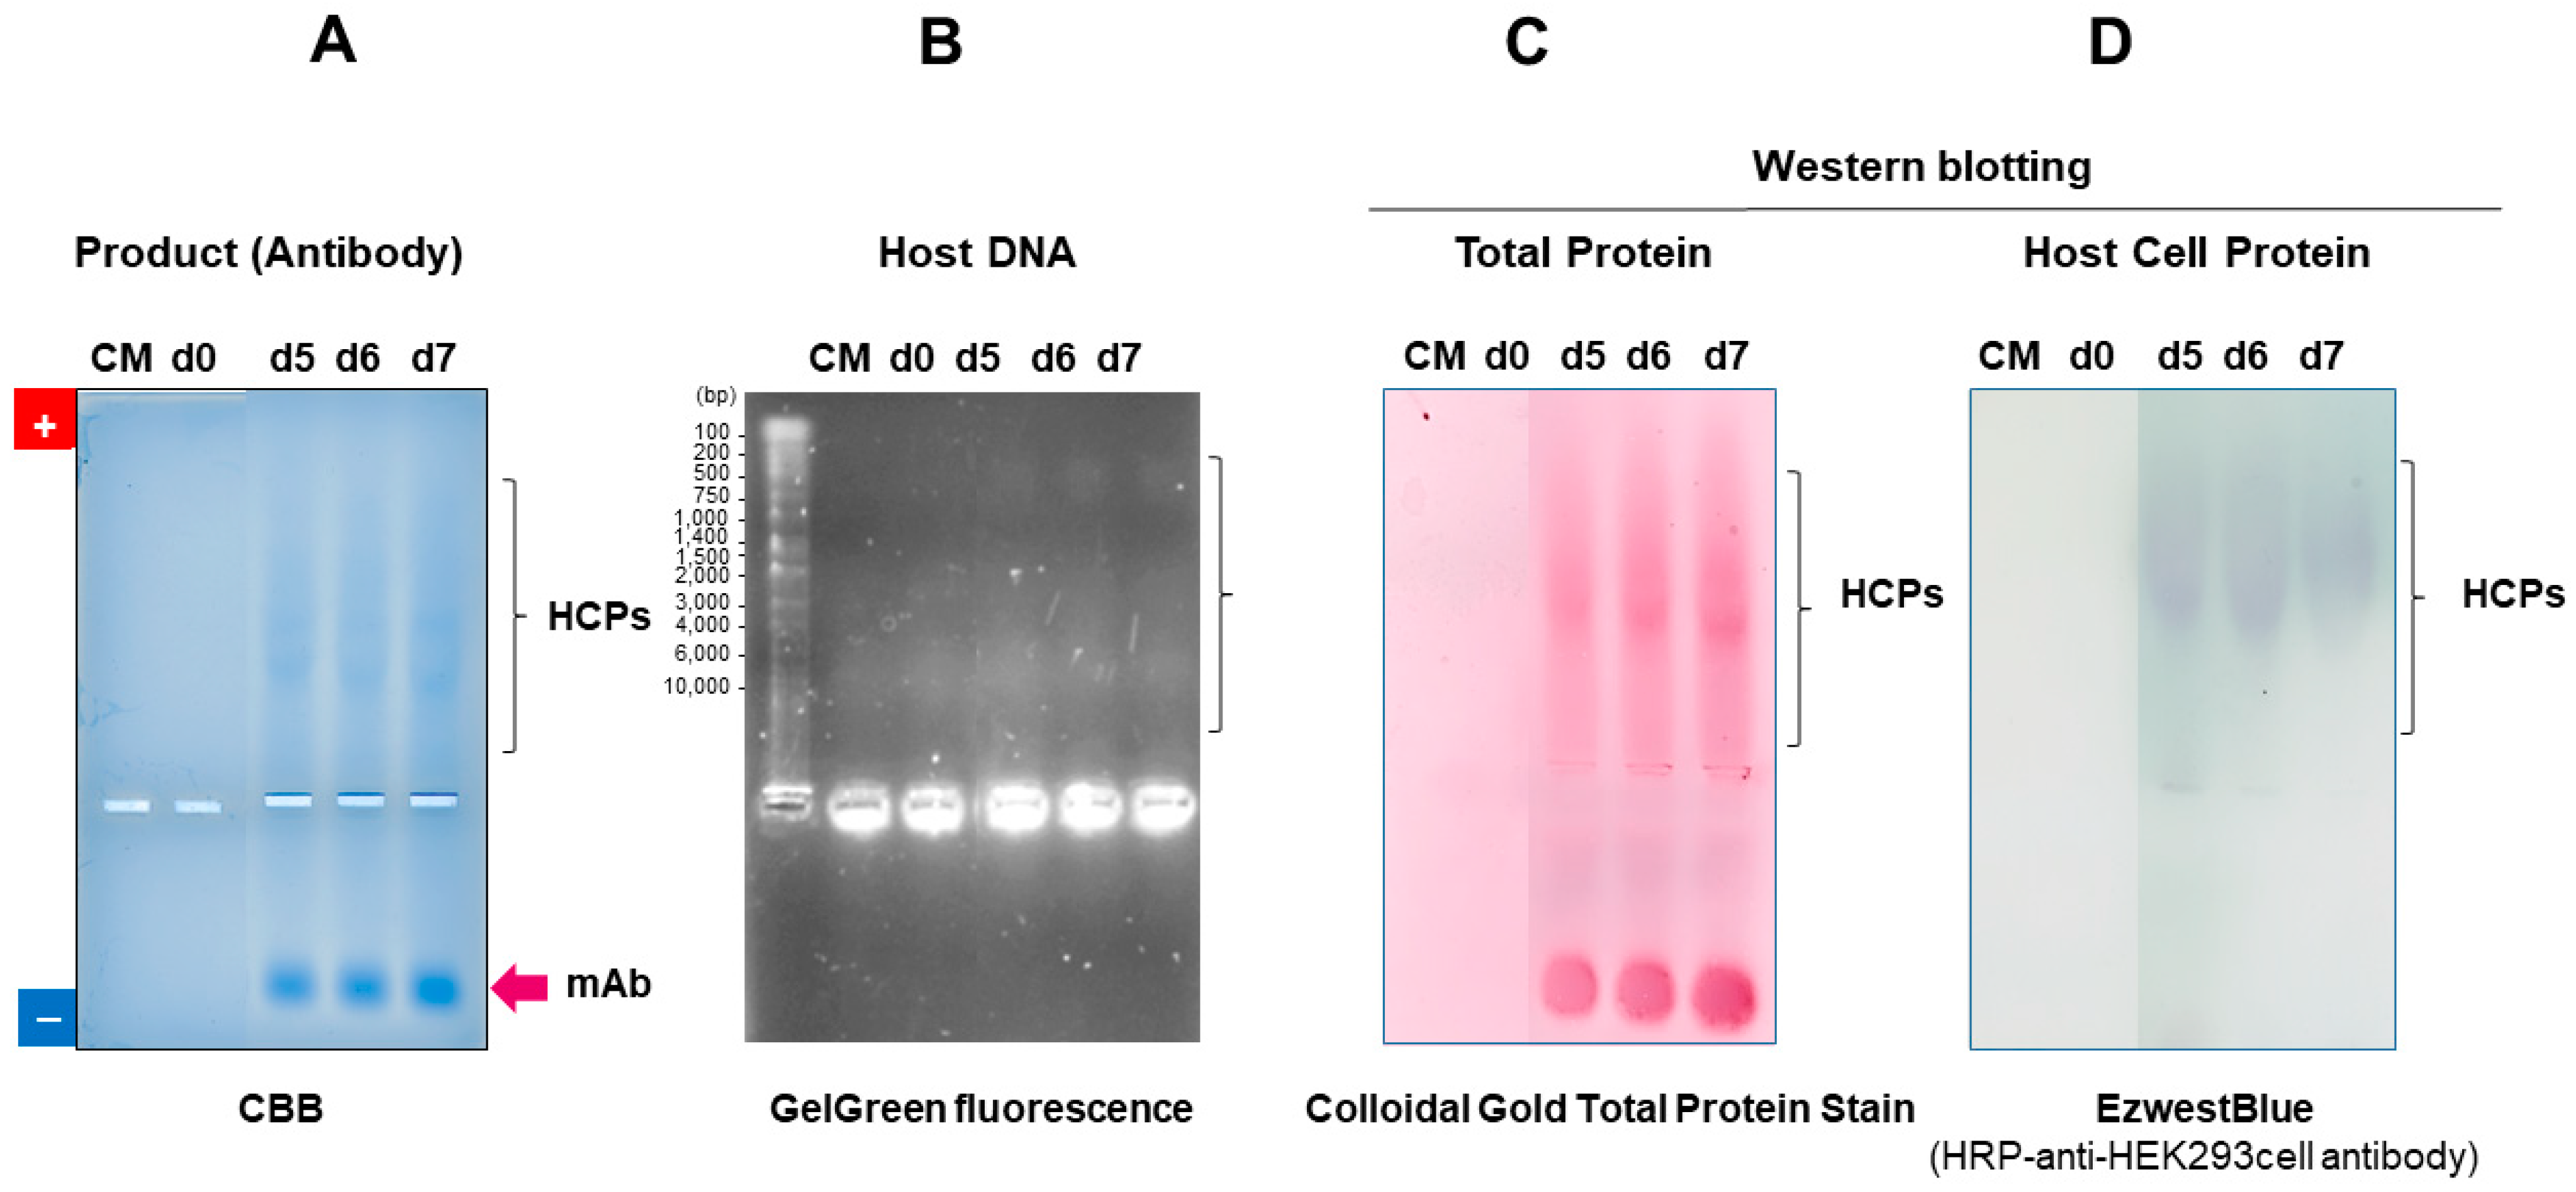
7.2.3. Detection of Contamination

Agarose native gel electrophoresis can be used to examine the expression of monoclonal antibodies. Figure 12 shows four different staining results of HEK293 cell culture supernatant expressing a recombinant mAb. One of four gels is stained with CBB (Figure 12A), where little staining of proteins is seen in the medium (no cells) and day-0 (d0) cell culture. On days 5, 6 and 7 (d5, d6, d7), a band of the mAb migrating toward the cathode is seen, while a smearing staining due to host cell proteins (HCPs) is seen migrating toward the anode, indicating the effective separation of the mAbs from contaminating proteins. The second gel is stained with GelGreen fluorescence for host DNA (Figure 12B). Little staining is observed in the culture supernatant (medium) and on d0, indicating that the cells are fully viable in d0 culture. At d5, d6 and d7, multiple bands (shown by arrow and bracket) are observed due to dead cells, corresponding to breached host cell DNA. Two separate blots from the native agarose gels are stained by Colloidal Gold Total Protein Stain for total proteins in the culture supernatant (Figure 12C) or anti-HEK293 cell antibody for HCPs (Figure 12D). As shown in Figure 12C, little protein staining is observed in the medium and d0 supernatant, while a band corresponding to the mAb and smearing staining are observed at d5, d6 and d7. The smearing band corresponds to the HEK293 HCPs, which are stained by horseradish peroxidase-conjugated anti-HEK293 antibody (Figure 12D). Thus, agarose native gel electrophoresis can be used to follow the purification of mAb from contaminants when expressed in HEK293 cells.

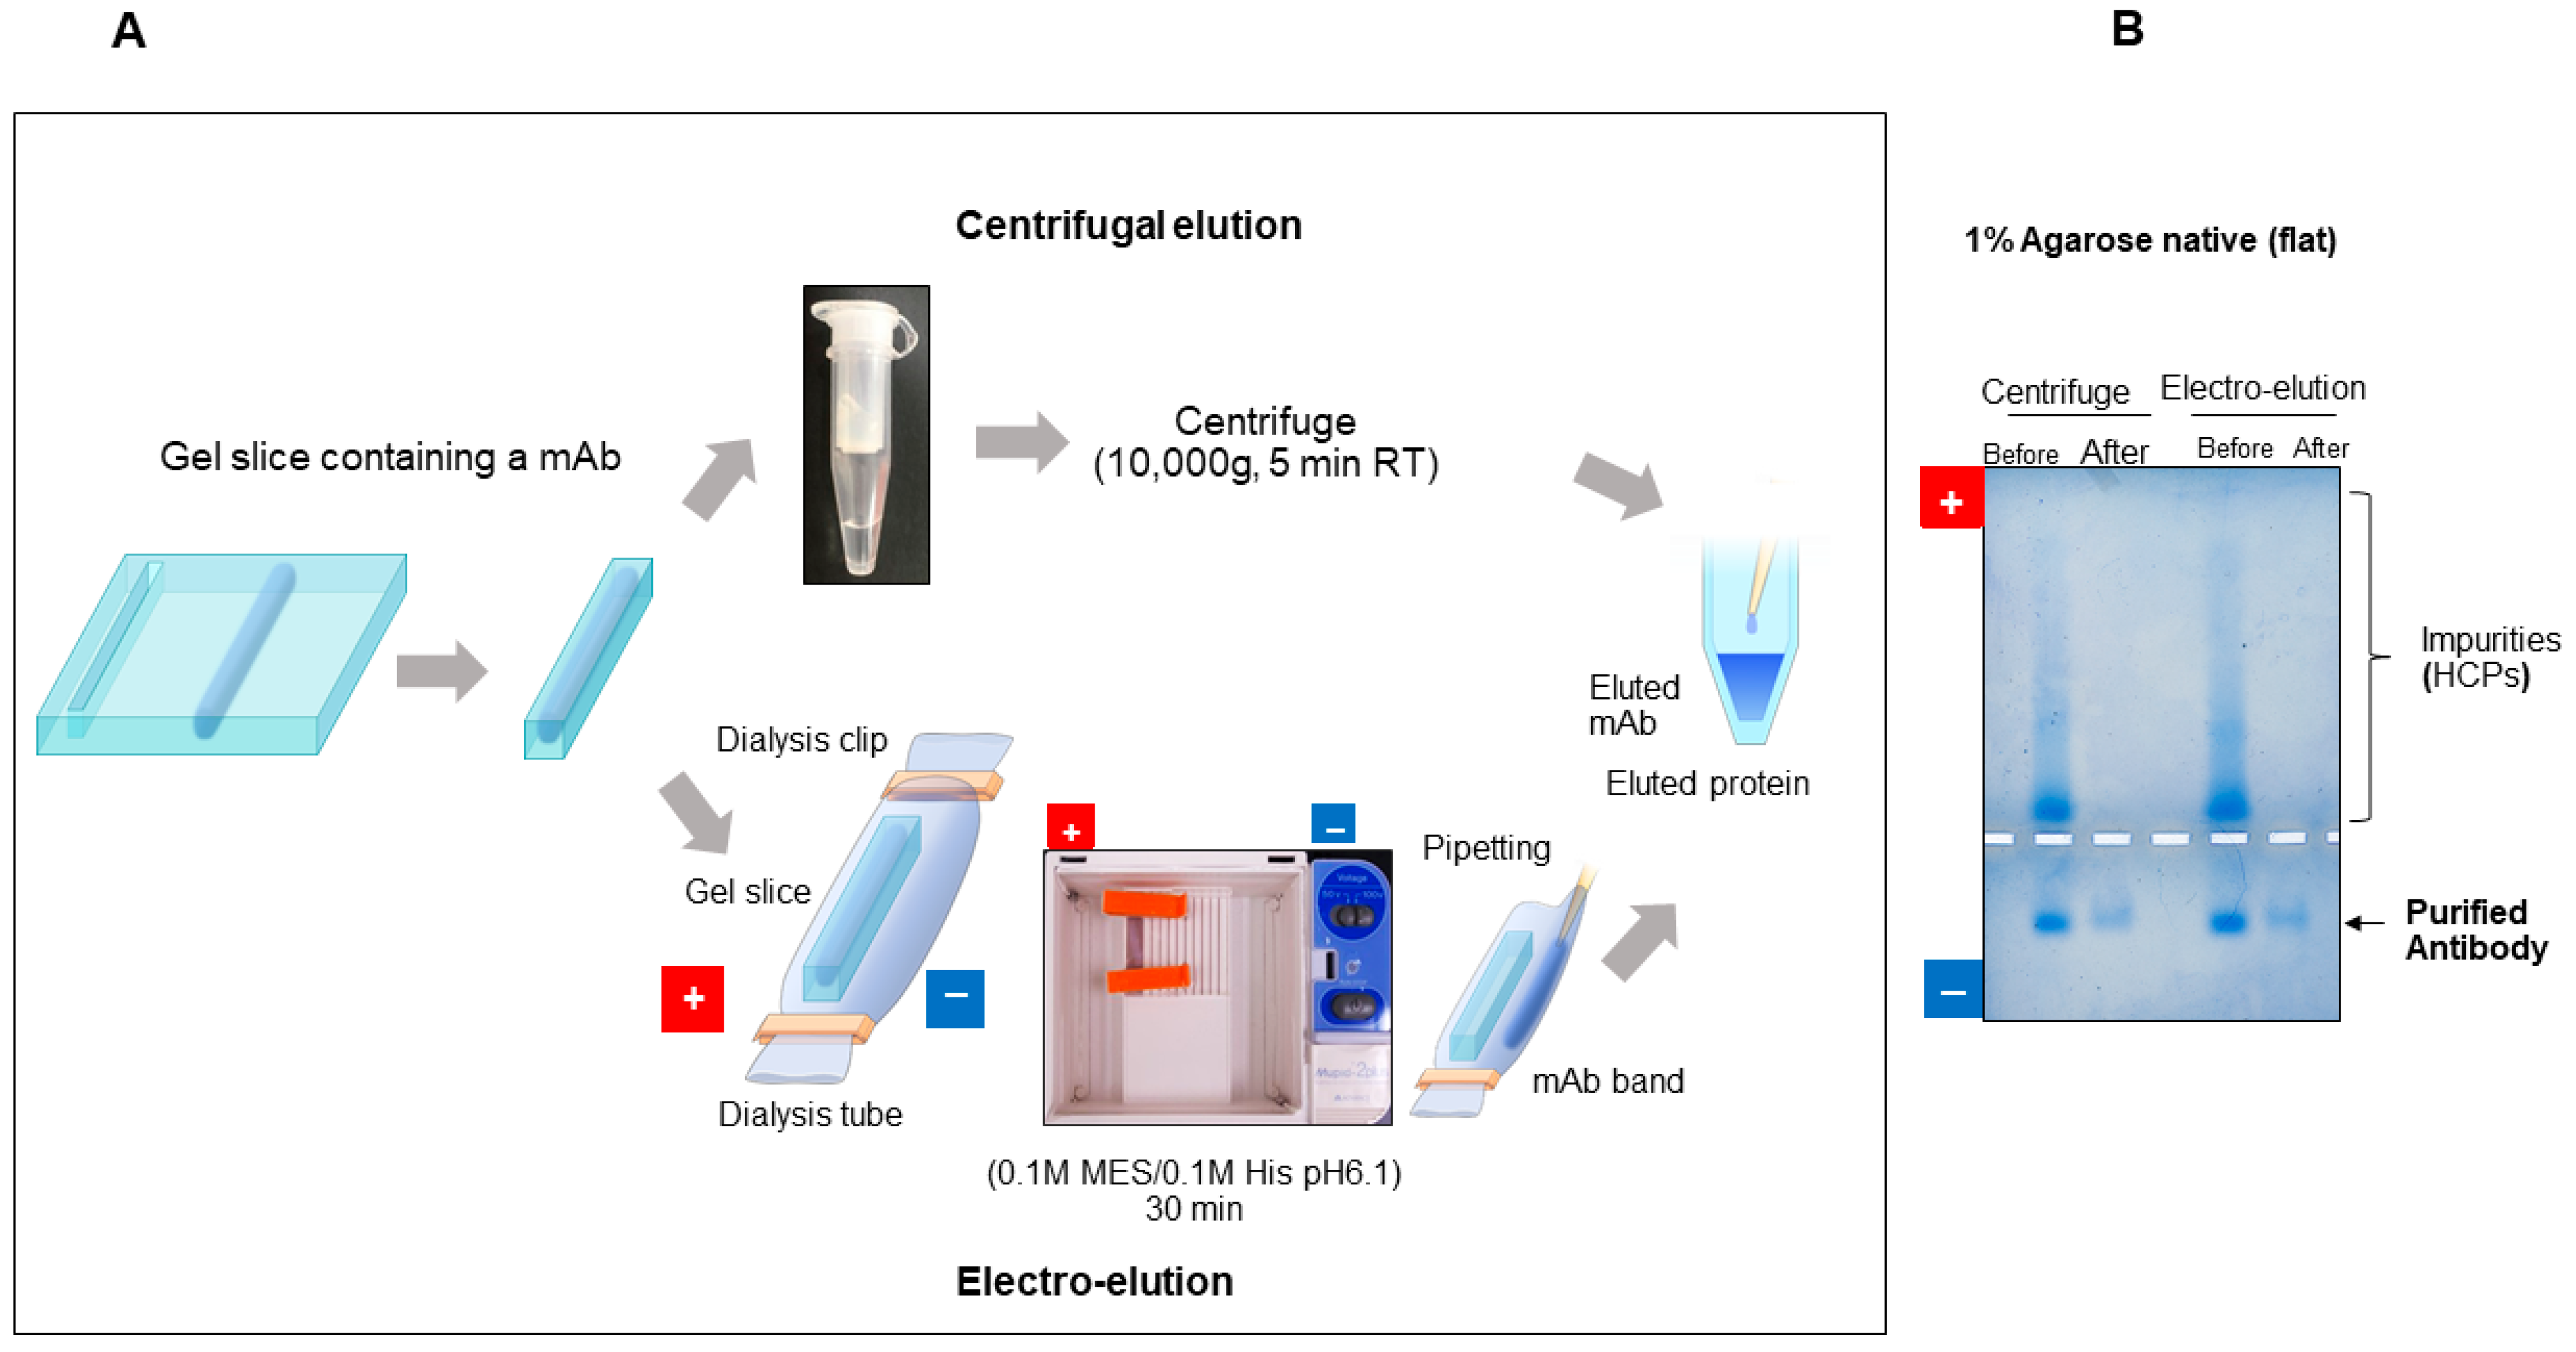
7.2.4. Purification of Protein by Gel Extraction

The porous nature of agarose gels makes extraction of protein bands easy. If extracted in the native form, there are many potential analyses that can be performed on the extracted proteins [67]. Such analyses may include a bioassay, structure analysis, antibody binding, etc. For example, a potential protocol to rapidly purify an antibody by preparative agarose native gel electrophoresis is shown in Figure 13A. After agarose gel electrophoresis of the HEK293 cell culture medium expressing a rabbit monoclonal antibody (mAb), the edge of the gel is stained by CBB to visualize the mAb band position. The corresponding position of the remaining unstained gel is then excised and transferred in a centrifugal filter to elute the mAb by centrifugation (upper panel). Alternatively, the corresponding slice containing the mAb is placed in a dialysis tube filled with a running buffer (0.1 M His/0.1 M MES) and eluted by electrophoresis (100 V, 30 min) (lower panel). In the latter case, the mAb is electrophoresed from the gel slice into the solution within the dialysis tubing. Figure 13B shows the results of agarose native gel electrophoresis of the mAb before and after purification by the preparative gel electrophoresis, showing that the recombinant antibody migrates toward the cathode while nucleic acids and a majority of the host cell proteins migrate toward the anode, and that both centrifugal elution and electro-elution can readily isolate the mAb from the crude mixture. By combining the methods of electrophoresis and elution from the gel, impurities can be easily removed, leading to the efficient purification of antibodies within 1 h. It can be applied as a simple and cost-effective purification method for various proteins. For example, the purification of antigens as native proteins can also be readily performed to generate conformation-specific antibodies by the immunization of small animals such as mice. There is a disc gel electrophoresis apparatus, in which protein bands elute out of the gel at the bottom. One of the difficulties in such apparatus is the Joule heat generated by the electric current during a long electrophoresis time. The described gel elution procedure using a horizontal (flat) gel (see Figure 7A) may be more effectively controlled in terms of heating.

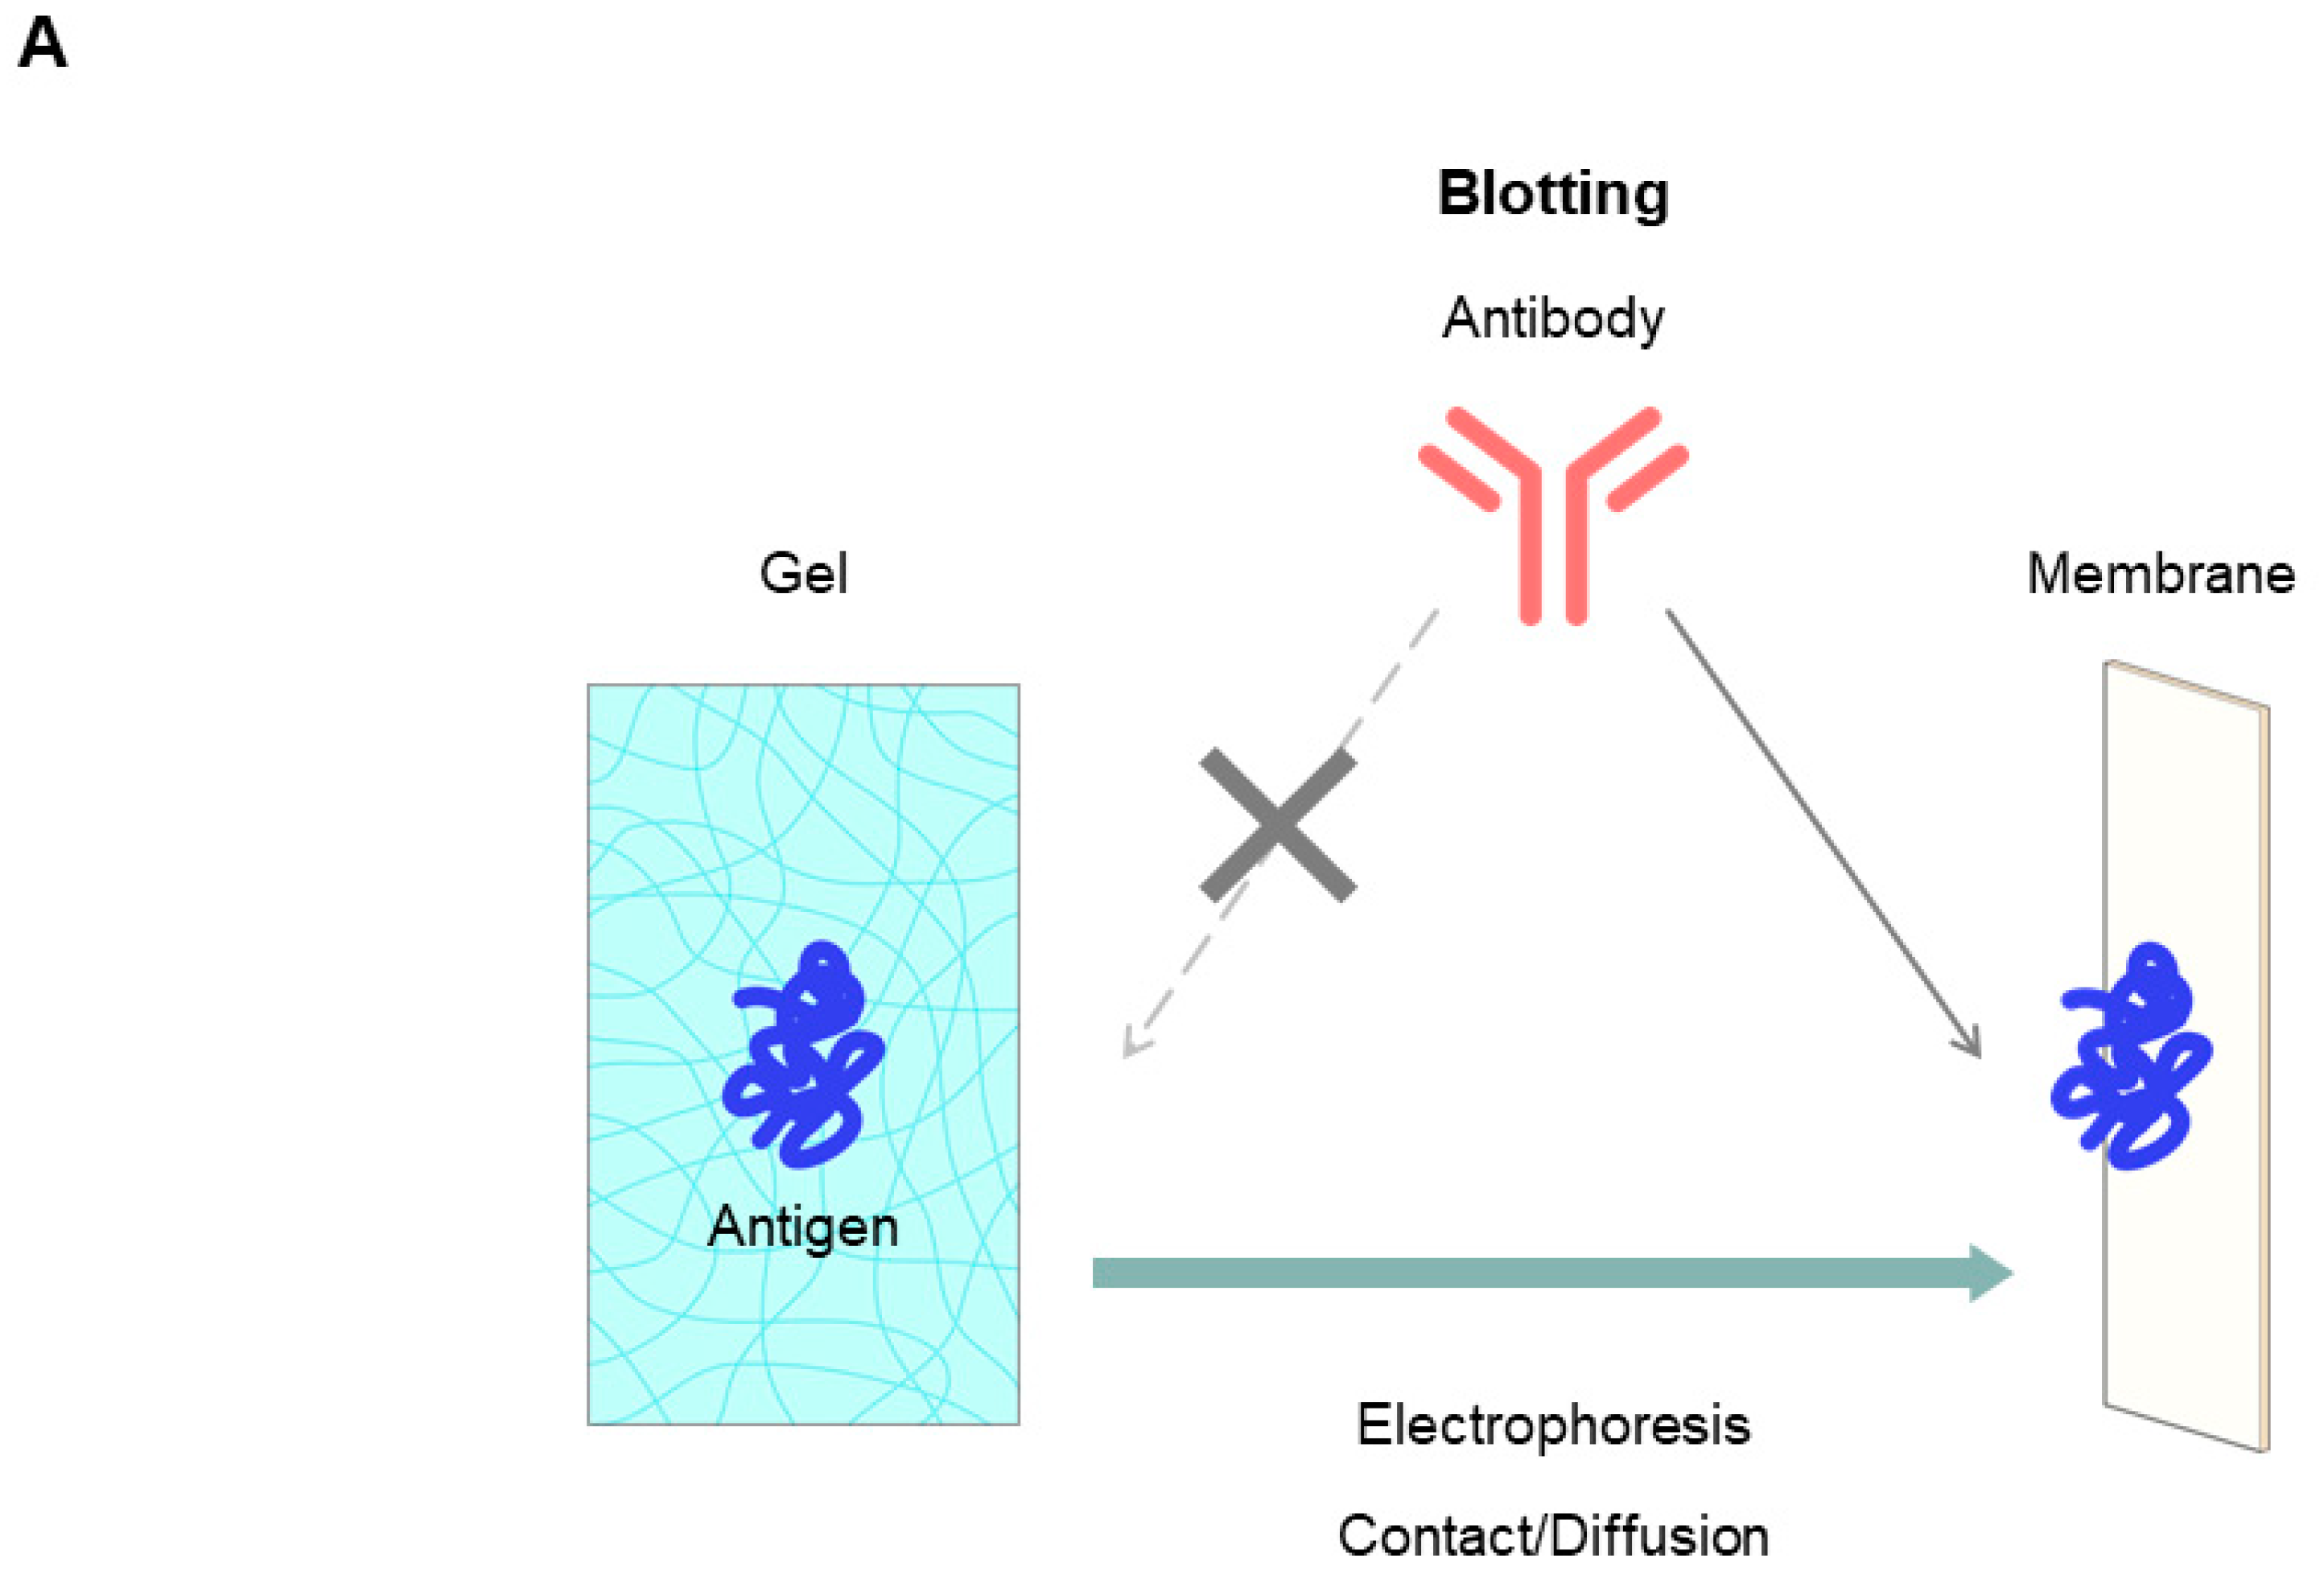
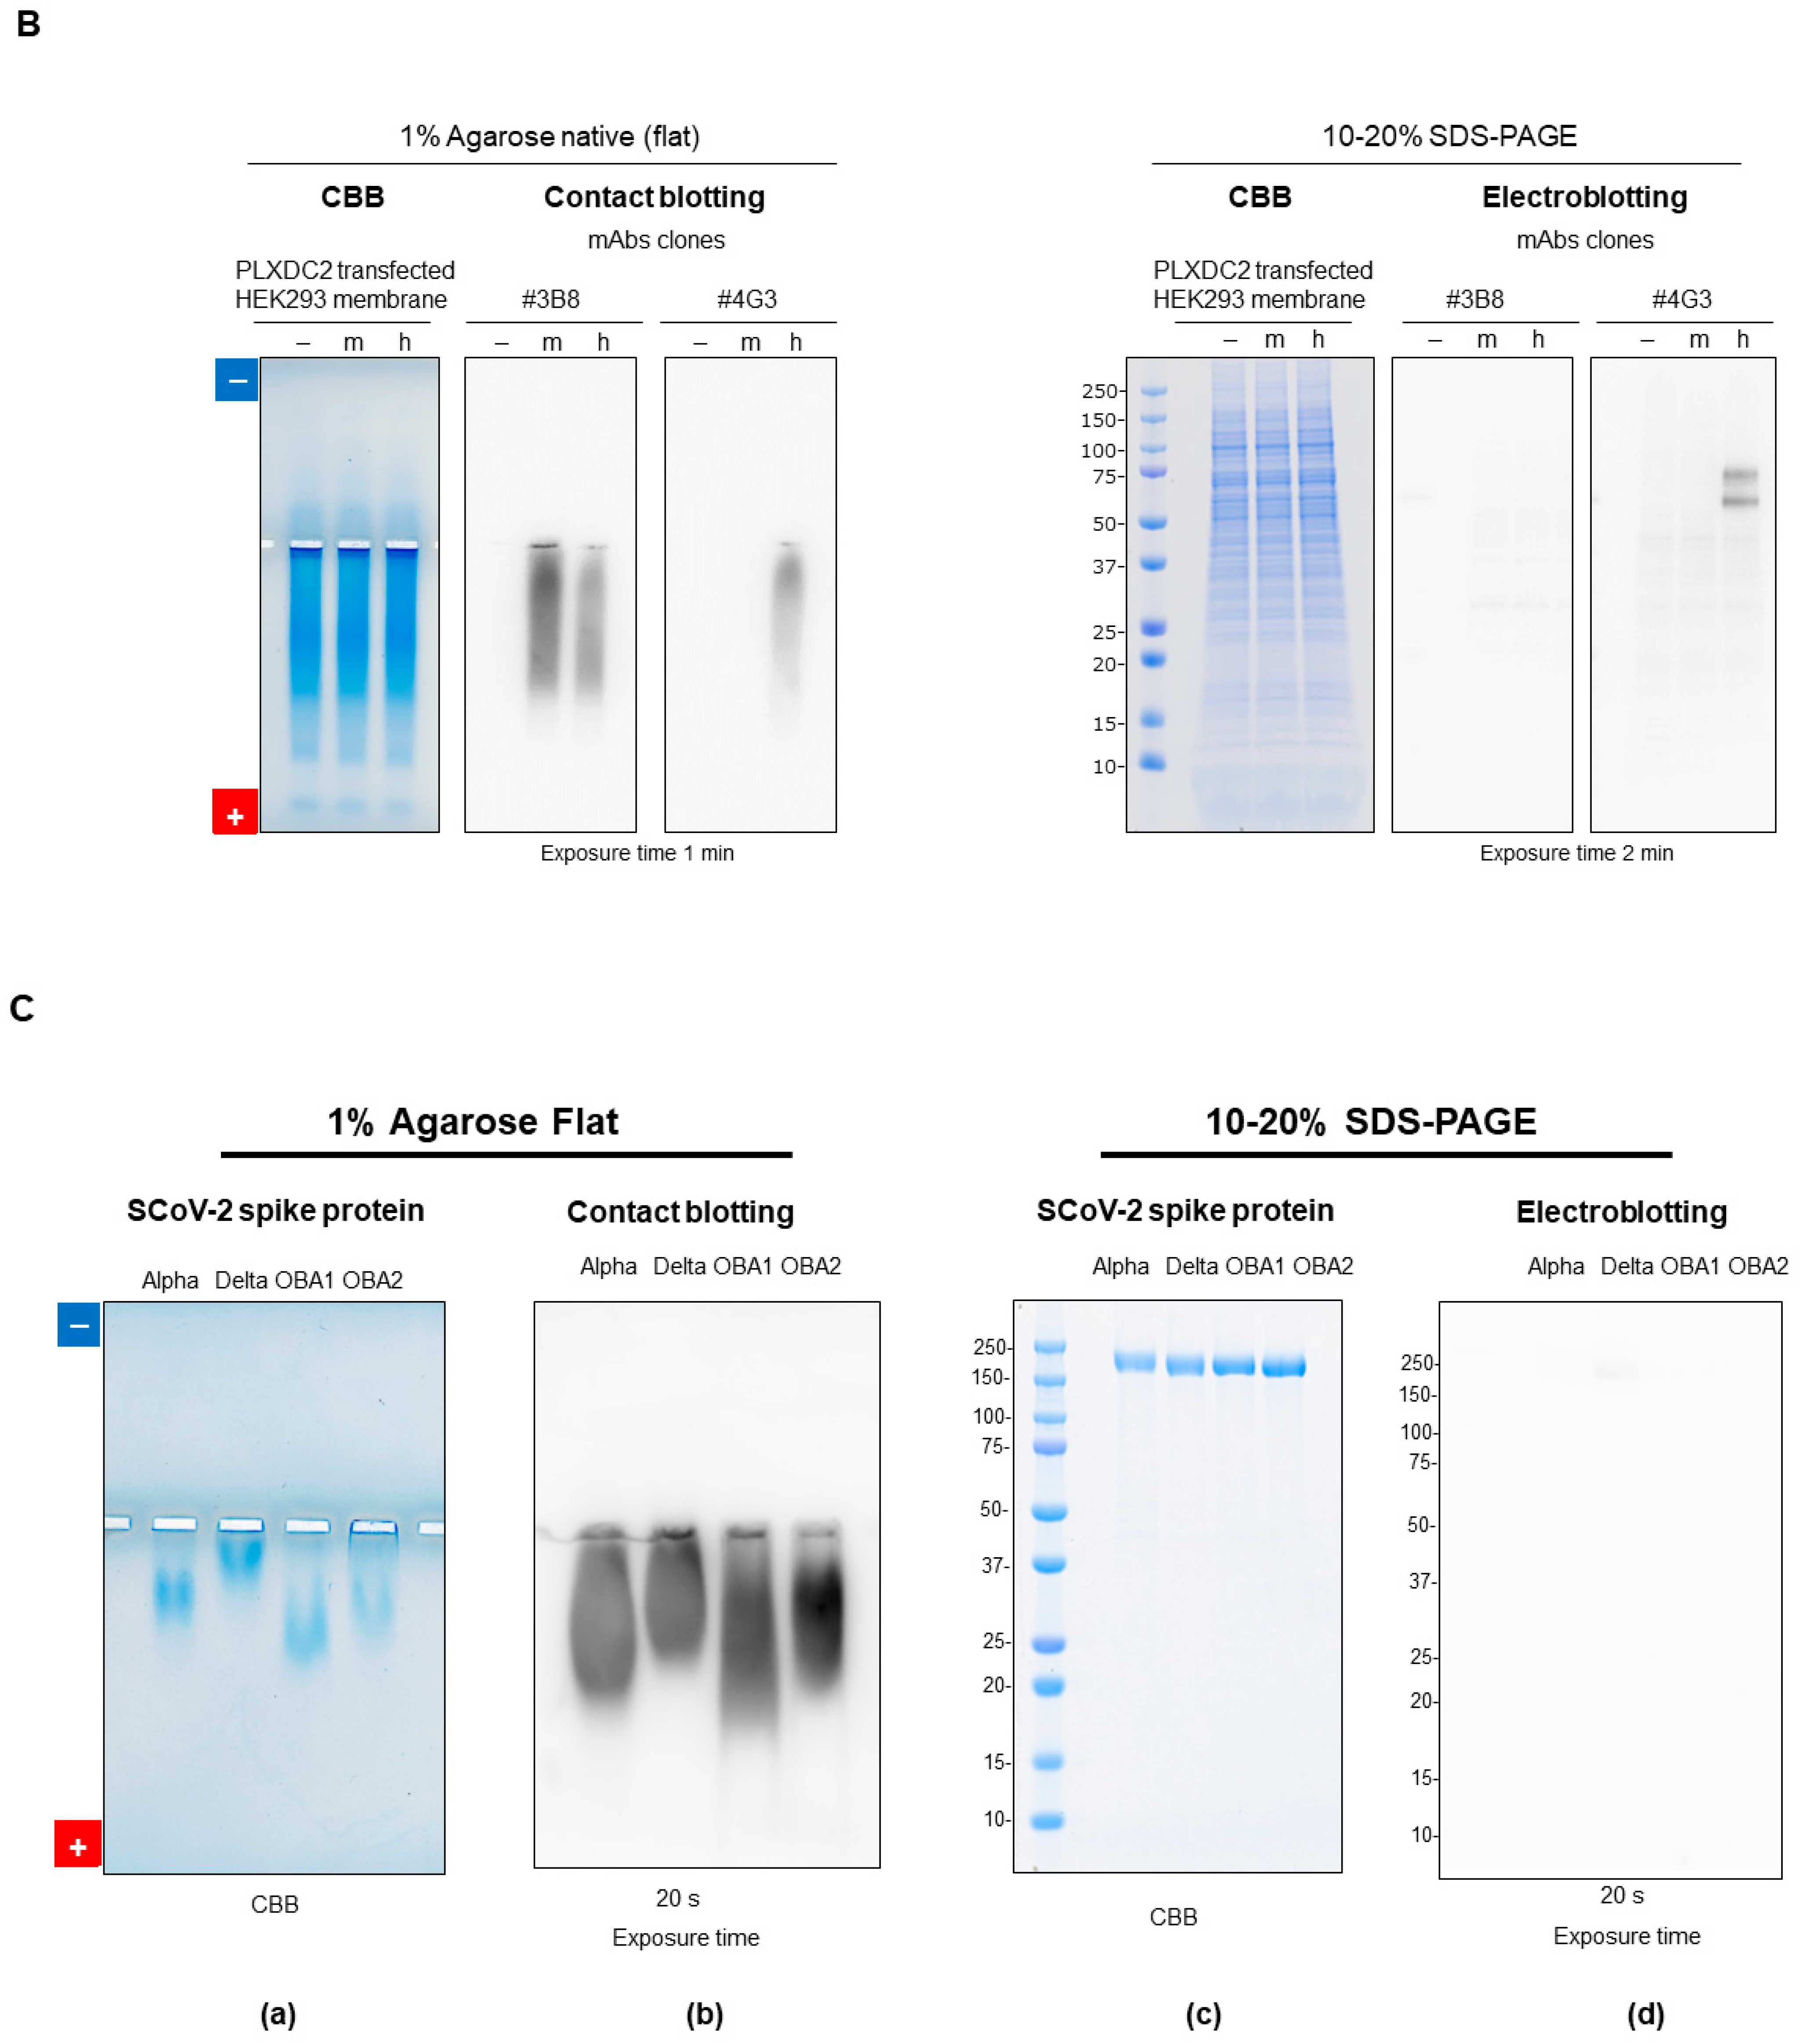
7.2.5. Native Western Blotting by Contact

Western blotting is one of the most important applications of gel electrophoresis [68,69,70]. Antibodies are commonly used to detect antigens separated by gel electrophoresis. As shown in Figure 14A, antigen proteins on the gel, even a porous agarose gel, are not readily accessible to a large antibody. Antigen proteins on the gel are, therefore, transferred onto a membrane (a technique called “blotting”), where antigen proteins are trapped on the surface of the membrane and become readily accessible to the antibody. We have shown that the simple contact of agarose gels with the membrane is sufficient for the proteins to diffuse onto the membrane due to the porosity of agarose gels [71,72,73]. Here, we show an example of contact blotting from agarose gel using the membrane fractions of HEK293 cells expressing a transmembrane PLXDC2 (plexin domain-containing protein 2) protein containing a plexin moiety of human or mouse origin. Figure 14B (left panel) shows the PLXDC2 protein antigen analyzed by agarose native gel electrophoresis and contact blotting. The CBB staining showed many bands on the acidic side of the gel regardless of the PLXDC2 expression. The PVDF membranes were probed by contact blotting by two monoclonal antibodies, #4G3 and #3B8, which were developed in-house to specifically bind to the antigen. While the #4G3 antibody detected only human antigen protein on contact blotting, the #3B8 antibody detected both human and mouse antigens, indicating that the #4G3 antibody is species-specific. Figure 14B (right panel) shows the CBB-stained SDS-PAGE gel, indicating that the patterns are similar whether the antigen was expressed or not. Figure 14B also shows the binding of these #4G3 and #3B8 antibodies to the SDS-denatured PLXDC2 antigen upon electroblotting of the SDS-PAGE gel, where the #4G3 antibody bound to the denatured human, but not to the denatured mouse, protein. Thus, the #4G3 antibody is conformation-indifferential: it binds to both native and denatured proteins. It is species-specific, binding only to the human protein. On the contrary, the #3B8 antibody showed no apparent binding to the SDS-denatured proteins, whether of human or mouse origin, consistent with its conformation-specific properties.
As another example of Western blotting, a SARS-CoV-2 spike protein was subjected to agarose native gel electrophoresis. The SARS-CoV-2 spike protein, a membrane protein in a coronavirus envelope, has a molecular weight of 133–139 kDa and forms a trimer of 400 kDa. We tested four variants of the spike protein: alpha, delta and omicron BA1.1.529 and BA2. Figure 14C(a) shows the Coomassie Brilliant Blue (CBB)-stained pattern of the agarose native gel electrophoresis of spike protein (1 µg/lane) expressed in and purified from HEK293 cells. The four variants migrated toward the anode, unexpectedly deviating from their theoretical isoelectric points (pIs): alpha (6.34), delta (6.53), omicron BA1.1.529 (6.93) and omicron BA2 (6.16). This deviation is likely due to glycosylation with sialic acid, lowering their pIs [74].
The agarose gel was contact blotted and stained with an anti-spike antibody. Figure 14C(b) shows the strong staining of the four antigens with a 20 s exposure, indicating that Western blot analysis with contact blotting resulted in strong signals for the spike antigen proteins of all four variants.
In contrast, Western blotting of SDS-PAGE gave a different result. As shown in Figure 14C(c), CBB staining produced an identical profile for the four variants due to their similar molecular sizes. This demonstrates that small differences in structural properties between the variants can be detected by agarose native gel electrophoresis, but not by SDS-PAGE. Interestingly, Western blotting of the SDS-PAGE gave no bands with a 20 s exposure (Figure 14C(d)), indicating that this particular anti-spike antibody cannot bind to or detect the four spike proteins in their denatured state, thus confirming its conformation specificity.
The advantage of this method is that the network structure of agarose gels is more porous than that of polyacrylamide gels, allowing proteins to be effectively transferred in their native structure without the use of SDS. This method may be useful not only for basic research in protein analysis but also for the evaluation and characterization of antibodies for diagnostic and therapeutic applications.

8. Conclusions

Polysaccharide gels have been used as a separating matrix for gel electrophoresis. We have described the properties of starch and agarose gels in comparison with polyacrylamide gels, all of which are routinely used for the electrophoretic analysis of proteins and nucleic acids. Among the polysaccharide gels, agarose gels are safe and have advantages for potential applications in the analysis of nucleic acid degradation and purification and the characterization of antibodies and the activity of enzymes separated by gel electrophoresis. As a perspective, we hope to find interest in using and further developing agarose-based electrophoresis for higher-resolution, more effective applications and the commercial development of the user-friendly method. In our experience, the agarose native gel electrophoresis system produces less-sharp bands than the commercial polyacrylamide-based electrophoresis system and requires some experience due to the need for the preparation of hand-made gels. We believe that any improvements in these areas of disadvantage could expand the application of this electrophoresis method. In addition, an increased size resolution of agarose gels would be highly appreciated.

Funding

We received no external funding.

Acknowledgments

We are grateful to the staff members of Abwiz Bio Inc. for useful advice and the discussion regarding rabbit monoclonal antibodies.

Conflicts of Interest

Tsutomu Arakawa was formerly affiliated with the for-profit company Alliance Protein Laboratories but currently has no conflicts of interest. M.N., C.S., Y.T., Y.K. and T.A. are employees of the for-profit company Kyokuto Pharmaceuticals. The authors declare that the research was conducted in the absence of any commercial or financial relationships that could be construed as a potential conflict of interest. The Abwiz Bio Inc. was not involved in the study design, collection, analysis, interpretation of data, the writing of this article or the decision to submit it for publication.

References

  1. Beaumont, M.; Tran, R.; Vera, G.; Niedrist, D.; Rousset, A.; Pierre, R.; Shastri, V.P.; Forget, A. Hydrogel-forming algae polysaccha rides: From seaweed to biomedical applications. Macromolecules 2021, 22, 1027–1052. [Google Scholar] [CrossRef]
  2. Tombs, M.P. Biotechnology of protein and polysaccharide gels. Biotechnol. Genet. Eng. Rev. 1997, 14, 337–363. [Google Scholar] [CrossRef] [PubMed]
  3. Yilmaz, S.U.; Agaoglu, N.B.; Manto, K.; Muftuoglu, M.; Özbek, U. Cosmic Whirl: Navigating the cosmic trail in DNA: H2AX phosphorylation and the enigma of uncertain significance variants. Genes 2024, 15, 724. [Google Scholar] [CrossRef]
  4. Weickert, P.; Dürauer, S.; Götz, M.J.; Li, H.Y.; Stingele, J. Electro-elution-based purification of covalent DNA-protein cross-links. Nat. Protoc. 2024. [Google Scholar] [CrossRef] [PubMed]
  5. Lewis, L.A. Electrophoresis of proteins. CRC. Crit. Rev. Clin. Lab. Sci. 1970, 1, 233–245. [Google Scholar] [CrossRef] [PubMed]
  6. Arakawa, T.; Niikura, T.; Kita, Y.; Akuta, T. Sodium dodecyl sulfate analogs as a potential molecular biology reagent. Curr. Issues Mol. Biol. 2024, 46, 621–633. [Google Scholar] [CrossRef] [PubMed]
  7. Cramer, D.A.; Franc, V.; Heidenreich, A.K.; Hook, M.; Adibzadeh, M.; Reusch, D.; Heck, A.J.R.; Haberger, M. Characterization of high-molecular weight by-products in the production of a trivalent bispecific 2 + 1 heterodimeric antibody. mAbs 2023, 15, 2175312. [Google Scholar] [CrossRef]
  8. Chi, M.C.; Lu, B.Y.; Huang, Y.F.; Wang, S.W.; Lin, M.G.; Wang, T.F. Effects of sodium dodecyl sulfate on the enzyme catalysis and conformation of a recombinant γ-glutamyltranspeptidase from Bacillus licheniformes. Protein J. 2023, 42, 64–77. [Google Scholar] [CrossRef] [PubMed]
  9. Rees, D.A. Structure, conformation, and mechanism in the formation of polysaccharide gels and networks. Advan. Carbohyd. Chem. Biochem. 1969, 24, 267–332. [Google Scholar] [CrossRef]
  10. Arnott, S.; Fulmer, A.; Scott, W.E.; Dea, I.; Moorhouse, R.; Rees, D.A. The agarose double helix and its function in agarose gel structure. J. Mol. Biol. 1974, 90, 269–284. [Google Scholar] [CrossRef]
  11. Maaloum, M.; Pernodet, N.; Tinland, B. Agarose gel structure using atomic force microscopy: Gel concentration and ionic strength effects. Electrophoresis 1998, 19, 1606–1610. [Google Scholar] [CrossRef] [PubMed]
  12. Sasuga, K.; Ishikawa, A.; Ito, M.; Amano, N.; Ishii, Y.; Kitagawa, Y.; Usui, M. Agar and agarose for electrophoresis. Chem. Times 2011, 4, 8–14. Available online: https://www.kanto.co.jp/dcms_media/other/backno7_pdf04.pdf (accessed on 11 October 2011). (In Japanese).
  13. Jiang, F.; Xu, X.W.; Chen, F.Q.; Weng, H.F.; Chen, J.; Ru, Y.; Xiao, Q.; Xiao, A.F. Extraction, Modification and Biomedical Application of Agarose Hydrogels: A Review. Mar Drugs. 2023, 21, 299. [Google Scholar] [CrossRef] [PubMed]
  14. Holmes, D.L.; Stellwagen, N.C. Estimation of polyacrylamide gel pore size from Ferguson plots of normal and anolamously migrating DNA fragments. I. Gels containing 3% N,N′-methylenebisacrylamide. Electrophoresis 1991, 12, 253–363. [Google Scholar] [CrossRef] [PubMed]
  15. Stellwagen, N.C. Electrophoresis of DNA in agarose gels, polyacrylamide gels, and in free solution. Electrophoresis 2009, 30, S185–S195. [Google Scholar] [CrossRef] [PubMed]
  16. Karathanos, V.T.; Saravacos, G.D. Porosity and pore size distribution of starch materials. J. Food Eng. 1993, 18, 259–280. [Google Scholar] [CrossRef]
  17. Wang, W.; Zhang, Y.; Liu, W. Bioinspired fabrication of high strength hydrogels from non-covalent interactions. Prog. Polymer Sci. 2017, 71, 1–25. [Google Scholar] [CrossRef]
  18. Guo, B.; Ma, P.X. Conducting polymers for tissue engineering. Biomacromolecules 2018, 19, 1764–1782. [Google Scholar] [CrossRef] [PubMed]
  19. Ho, T.C.; Chang, C.C.; Chan, H.P.; Chung, T.W.; Shu, C.W.; Chuang, K.P.; Duh, T.H.; Yang, M.H.; Tyan, Y.C. Hydrogels: Properties and applications in biomedicine. Molecules 2022, 27, 2902. [Google Scholar] [CrossRef]
  20. Liao, Q.; Kim, E.J.; Tang, Y.; Xu, H.; Yu, D.-G.; Song, W.; Kim, B.J. Rational design of hyper-crosslinked polymers for biomedical applications. J. Polymer Sci. 2024, 62, 1517–1535. [Google Scholar] [CrossRef]
  21. Kim, J.; Zhang, G.; Shi, M.; Suo, Z. Fracture, fatiue, and friction of polymers in which entanglements greatly out-number cross-links. Science 2021, 374, 212–216. [Google Scholar] [CrossRef] [PubMed]
  22. Belashova, T.A.; Velina, A.A.; Sysoev, E.I.; Velizhanina, M.E.; Zelinsky, A.A.; Galkin, A.P. Search and identification of amyloid proteins. Methods Protoc. 2023, 6, 16. [Google Scholar] [CrossRef] [PubMed]
  23. Li, C.; Arakawa, T. Agarose native gel electrophoresis. Int. J. Biol. Macromol. 2019, 140, 668–671. [Google Scholar] [CrossRef] [PubMed]
  24. Yanagisawa, M.; Watanabe, C.; Fujiwara, K. Single micrometer-sized gels: Unique mechanics and characters for application. Gels 2018, 4, 29. [Google Scholar] [CrossRef] [PubMed]
  25. Watanabe, C.; Kobori, Y.; Yamamoto, J.; Kinjo, M.; Yanagisawa, M. Quantitative analysis of membrane surface and small confinement effects on molecular diffusion. J. Phys. Chem. B 2020, 124, 1090–1098. [Google Scholar] [CrossRef] [PubMed]
  26. Yanagisawa, M. Cell-size space effects on phase separation of binary polymer blends. Biophys. Rev. 2022, 14, 1093–1103. [Google Scholar] [CrossRef] [PubMed]
  27. Minton, A.P. Simplified equilibrium model for exploring the combined influences of concentrations, aggregate shape, excluded volume, and surface adsorption upon aggregation propensity and distribution of globular macromolecules. J. Phys. Chem. B 2023, 127, 9303–9311. [Google Scholar] [CrossRef]
  28. Rivas, G.; Minton, A.P. Influence of nonspecific interactions on protein associations: Implications for biochemistry in vivo. Annu. Rev. Biochem. 2022, 91, 321–351. [Google Scholar] [CrossRef] [PubMed]
  29. Hoppe, T.; Minton, A.P. Non-specific interactions between macromolecular solutes in concentrated solution: Physico-chemical manifestations and biochemical consequences. Front. Mol. Biosci. 2019, 6, 10. [Google Scholar] [CrossRef]
  30. Tomioka, Y.; Nakagawa, M.; Sakuma, C.; Nagatoishi, S.; Tsumoto, K.; Arakawa, T.; Akuta, T. Ladder observation of bovine serum albumin by high resolution agarose native gel electrophoresis. Int. J. Biol. Macromol. 2022, 215, 512–520. [Google Scholar] [CrossRef]
  31. Sambrook, J.; Russel, D.W. Molecular Cloning: A Laboratory Manual, 3rd ed.; Cold Spring Harbor Laboratory Press: Cold Spring Harbor, NY, USA, 2001. [Google Scholar]
  32. Hayward, G.S.; Smith, M.G. The chromosome of bacteriophage T5. I. Analysis of the single-stranded DNA fragments by agarose gel electrophoresis. J. Mol. Biol. 1972, 63, 383–395. [Google Scholar] [CrossRef] [PubMed]
  33. Borst, P. Ethidium DNA agarose gel electrophoresis: How it started. IUBMB Life 2005, 57, 745–747. [Google Scholar] [CrossRef] [PubMed]
  34. Fried, M.; Crothers, D.M. Equilibria and kinetics of lac repressor-operator interactions by polyacrylamide gel electrophoresis. Nucleic Acids Res. 1981, 9, 6505–6525. [Google Scholar] [CrossRef] [PubMed]
  35. Garner, M.M.; Revzin, A. A gel electrophoresis method for quantifying the binding of proteins to specific DNA regions: Application to components of the Escherichia coli lactose operon regulatory system. Nucleic Acids Res. 1981, 9, 3047–3060. [Google Scholar] [CrossRef] [PubMed]
  36. Vossen, K.M.; Fried, M.G. Stability of lac repressor-operator complexes in a new agarose-based gel matrix. Nucleic Acids Res. 1995, 23, 2346–2347. [Google Scholar] [CrossRef] [PubMed]
  37. Calabrese, E.J.; Selby, P.B. Comet assay and hormesis. Environ. Pollut. 2024, 341, 122929. [Google Scholar] [CrossRef] [PubMed]
  38. Lu, Y.; Liu, Y.; Yang, C. Evaluating in vitro DNA damage using comet assay. J. Vis. Exp. 2017, 11, 56450. [Google Scholar] [CrossRef]
  39. Walsh, K.D.; Kato, T.A. Alkaline comet assay to detect DNA damage. Methods Mol. Biol. 2023, 2519, 65–72. [Google Scholar] [CrossRef] [PubMed]
  40. Ji, Y.; Karbaschi, M.; Abdulwahed, A.; Quinete, N.S.; Evans, M.D.; Cooke, M.S. A high-throughput comet assay approach for assessing cellular DNA damage. J. Vis. Exp. 2022, 183, e63559. [Google Scholar] [CrossRef]
  41. Ostling, O.; Johanson, K.J. Microelectrophoretic study of radiation-induced DNA damages in individual mammalian cells. Biochem. Biophys. Res. Commun. 1984, 123, 291–298. [Google Scholar] [CrossRef]
  42. Singh, N.P.; McCoy, M.T.; Tice, R.R.; Schneider, E.L. A simple technique for quantitation of low levels of DNA damage in individual cells. Exp. Cell Res. 1988, 175, 184–191. [Google Scholar] [CrossRef] [PubMed]
  43. Olive, P.L.; Banáth, J.P. The comet assay: A method to measure DNA damage in individual cells. Nat. Protoc. 2006, 1, 23–29. [Google Scholar] [CrossRef] [PubMed]
  44. Yasuhara, S.; Zhu, Y.; Matsui, T.; Tipirneni, N.; Yasuhara, Y.; Kaneki, M.; Rosenzweig, A.; Martyn, J.A.J. Comparison of comet assay, electron microscopy, and flow cytometry for detection of apoptosis. J. Histochem. Cytochem. 2003, 51, 873–885. [Google Scholar] [CrossRef] [PubMed]
  45. Collins, A.R. The comet assay for DNA damage and repair: Principles, applications, and limitations. Mol. Biotechnol. 2004, 26, 249–261. [Google Scholar] [CrossRef] [PubMed]
  46. Karlsson, H.L.; Di Bucchianico, S.; Collins, A.R.; Dusinska, M. Can the comet assay used reliably to detect nanoparticle-induced genotoxicity? Environ. Mol. Mutagen. 2015, 56, 82–96. [Google Scholar] [CrossRef] [PubMed]
  47. Tice, R.R.; Agurell, E.; Anderson, D.; Burlinson, B.; Hartmann, A.; Kobayashi, H.; Miyamae, Y.; Rojas, E.; Sasaki, Y.F. Single cell gel/comet assay: Guidelines for in vitro and in vivo genetic toxicology testing. Environ. Mol. Mutagen. 2000, 35, 206–221. [Google Scholar] [CrossRef]
  48. Fairbairn, D.W.; Olive, P.L.; O‘Neill, K.L. The Comet Assay: A comprehensive review. Mutat. Res. 1995, 339, 37–59. [Google Scholar] [CrossRef] [PubMed]
  49. Gajski, G.; Langie, S.; Zhanataev, A. Recent applications of the Comet Assay: A report from the International Comet Assay Workshop 2019. Toxicol. Lett. 2020, 333, 1–3. [Google Scholar] [CrossRef] [PubMed]
  50. Irvin-Barnwell, E.A.; Benson, K.M.; Lu, M.; Ragin, A.; Wheeler, J.; Hoffman, R. Environmental Toxins Found Historically in the Polycythemia Vera Cluster Area and their Potential for Inducing DNA Damage. Anal. Toxicol. 2021, 8, 551. [Google Scholar] [CrossRef]
  51. Azqueta, A.; Gutzkow, K.B.; Priestley, C.C.; Meier, S.; Walker, J.S.; Brunborg, G.; Collins, A.R. A comparative performance test of standard, medium- and high-throughput comet assays. Toxicol. In Vitro 2013, 27, 768–773. [Google Scholar] [CrossRef]
  52. Azqueta, A.; Collins, A.R. The essential comet assay: A comprehensive guide to measuring DNA damage and repair. Arch. Toxicol. 2013, 87, 949–968. [Google Scholar] [CrossRef] [PubMed]
  53. Brozovic, G.; Orsolic, N.; Knezevic, F.; Horvat, F.; Knezevic, A.; Benkovic, V.; Sakic, K.; Borojevic, N.; Dikic, D. The in vivo genotoxicity of cisplatin, isoflurane and halothane evaluated by alkaline comet assay in Swiss albino mice. J. Appl. Genet. 2011, 52, 355–361. [Google Scholar] [CrossRef]
  54. Gutzkow, K.B.; Langleite, T.M.; Meier, S.; Graupner, A.; Collins, A.R.; Brunborg, G. High-throughput comet assay using 96 minigels. Mutagenesis 2013, 28, 333–340. [Google Scholar] [CrossRef] [PubMed]
  55. Shaposhnikov, S.; Azqueta, A.; Henriksson, S.; Meier, S.; Gaivão, I.; Huskisson, N.H.; Smart, A.; Brunborg, G.; Nisson, M.; Collins, A.R. Twelve-gel slide format optimised for comet assay and fluorescent in situ hybridisation. Toxicol. Lett. 2010, 195, 31–34. [Google Scholar] [CrossRef] [PubMed]
  56. Harris, G.; Palosaari, T.; Magdolenova, Z.; Mennecozzi, M.; Gineste, J.M.; Saavedra, L.; Milcamps, A.; Huk, A.; Collins, A.R.; Dusinska, M.; et al. Iron oxide nanoparticle toxicity testing using high-throughput analysis and high-content imaging. Nanotoxicology 2015, 9 (Suppl. S1), 87–94. [Google Scholar] [CrossRef] [PubMed]
  57. Watson, C.; Ge, J.; Cohen, J.; Pyrgiotakis, G.; Engelward, B.P.; Demokritou, P. High-throughput screening platform for engineered nanoparticle-mediated genotoxicity using CometChip technology. ACS Nano 2014, 8, 2118–2133. [Google Scholar] [CrossRef]
  58. Li, J.; Beiser, A.; Dey, N.B.; Takeda, S.; Saha, L.K.; Hirota, K.; Parker, L.L.; Carter, M.; Arrieta, M.L.; Sobol, R.W. A high-throughput 384-well CometChip platform reveals a role for 3- methyladenine in the cellular response to etoposide-induced DNA damage. NAR Genom. Bioinform. 2022, 4, lqac065. [Google Scholar] [CrossRef] [PubMed]
  59. Li, C.; Akuta, T.; Nakagawa, M.; Sato, T.; Shibata, T.; Maruyama, T.; Okumura, C.J.; Kurosawa, Y.; Arakawa, T. Agarose native gel electrophoresis for characterization of antibodies. Int. J. Biol. Macromol. 2020, 151, 885–890. [Google Scholar] [CrossRef] [PubMed]
  60. Nakagawa, M.; Tomioka, Y.; Sakuma, C.; Kurosawa, Y.; Shibata, T.; Arakawa, T.; Akuta, T. Development of a novel two-dimensional gel electrophoresis protocol with agarose native gel electrophoresis. Electrophoresis 2023, 44, 1446–1460. [Google Scholar] [CrossRef]
  61. Wilkesman, J.; Kurz, L. Zymography principles. Methods Mol. Biol. 2017, 1626, 3–10. [Google Scholar] [CrossRef]
  62. Oloketuyi, S.; Annovi, G.; de Marco, A. Peroxidase zymograms obtained by agarose native gel electrophoresis have unmet resolution and completeness. Int. J. Biol. Macromol. 1984, 156, 869–873. [Google Scholar] [CrossRef] [PubMed]
  63. Choudhary, P.; Mishra, V.K.; Swarnakar, S. Zymography and reverse zymography for testing proteases and their inhibitors. Methods Mol. Biol. 2022, 2413, 107–120. [Google Scholar] [CrossRef]
  64. Sakuma, C.; Sato, T.; Shibata, T.; Nakagwa, M.; Kurosawa, Y.; Okumura, C.J.; Maruyama, T.; Arakawa, T.; Akuta, T. Western blotting analysis of proteins by agarose native gel electrophoresis. Int. J. Biol. Macromol. 2021, 166, 1106–1110. [Google Scholar] [CrossRef] [PubMed]
  65. Nishida, S.; Nakagawa, M.; Ouchi, Y.; Sakuma, C.; Nakajima, Y.; Shimizu, T.; Shibata, T.; Kurosawa, Y.; Maruyama, T.; Okumura, C.J.; et al. A rabbit monoclonalantibody-mediated lateral flow immunoassay for rapid detection of CTX-M extended-spectrum β-lactamase-producing Enterobacterales. Int. J. Biol. Macromol. 2021, 185, 317–323. [Google Scholar] [CrossRef] [PubMed]
  66. Yigit, H.; Anderson, G.J.; Biddle, J.W.; Steward, C.D.; Rasheed, J.K.; Valera, L.L.; McGowan, J.E.; Tenover, F.C. Carbapenem resistance in a clinical isolate of Enterobacter aerogenes is associated with decreased expression of OmpF and OmpC Porin Analogs. Antimicrob. Agents Chemother. 2001, 46, 3817–3822. [Google Scholar] [CrossRef] [PubMed]
  67. Kurien, B.T.; Scofield, R.H. Extraction of proteins from gels: A brief review. Methods Mol. Biol. 2012, 869, 403–405. [Google Scholar] [CrossRef] [PubMed]
  68. Sule, R.; Rivera, G.; Gomes, A.V. Western blotting (immunoblotting): History, theory, uses, protocol and problems. Biotechniques 2023, 75, 99–114. [Google Scholar] [CrossRef] [PubMed]
  69. Begum, H.; Murugesan, P.; Tangutur, A.D. Western blotting: A powerful staple in scientific and biomedical research. Biotechniques 2022, 73, 58–69. [Google Scholar] [CrossRef] [PubMed]
  70. Yasuoka, Y.; Izumi, Y.; Sands, J.M.; Kawahara, K.; Nonoguchi, H. Progress in the detection of erythropoietin in blood, urine, and tissue. Molecules 2023, 28, 4446. [Google Scholar] [CrossRef] [PubMed]
  71. Sakuma, C.; Nakagawa, M.; Tomioka, Y.; Maruyama, T.; Entzminger, K.; Fleming, J.K.; Shibata, T.; Kurosawa, Y.; Okumura, C.J.; Arakawa, T.; et al. Western blotting of native proteins from agarose gels. Biotechniques 2022, 72, 207–218. [Google Scholar] [CrossRef]
  72. Arakawa, T.; Nakagawa, M.; Tomioka, Y.; Sakuma, C.; Li, C.; Sato, T.; Shibata, Y.; Kurosawa, Y.; Akuta, T. Gel-electrophoresis based method for biomolecular interaction. Methods Cell Biol. 2022, 169, 67–95. [Google Scholar] [CrossRef] [PubMed]
  73. Akuta, T.; Maruyama, T.; Sakuma, C.; Nakagawa, M.; Tomioka, Y.; Entzminger, K.; Fleming, J.K.; Sato, R.; Shibata, T.; Kurosawa, Y.; et al. A new method to characterize conformation-specific antibody by a combination of agarose native gel electrophoresis and contact blotting. Antibodies 2022, 11, 36. [Google Scholar] [CrossRef] [PubMed]
  74. Pramanick, I.; Sengupta, N.; Mishra, S.; Pandey, S.; Girish, N.; Das, A.; Dutta, S. Conformational flexibility and structural varia bility of SARS-CoV2 S protein. Structure 2021, 29, 834–845. [Google Scholar] [CrossRef] [PubMed]
Figure 1. Comparison of size exclusion chromatography and gel electrophoresis. (A) SEC, (B) gel electrophoresis. The size of the arrow indicates the mobility of the macromolecule. In SEC, a larger macromolecule moves faster, while in electrophoresis, it moves slower. The migration positions in the SEC column and electrophoresis are shown in each panel.
Polysaccharides 05 00024 g001
Figure 2. Comparison of gel structures. (A) Agarose, (B) polyacrylamide, (C) starch. This is an original diagram drawn by us with reference to refs. [9,10,11,12,13,14,15,16].
Polysaccharides 05 00024 g002
Figure 3. Comparison of protein and agarose gel. (A) Protein gel is assumed to possess a negative charge (−). (B) Agarose gel is assumed to possess no charge.
Polysaccharides 05 00024 g003
Figure 4. Relation between the running pH of the gel electrophoresis and protein/nucleic acid charges. The running pH is set at pH 6.1.
Polysaccharides 05 00024 g004
Figure 5. The effects of gel pore size on the state of protein (BSA). Small cell effects lead to oligomerization (upper panel) or protein folding (lower panel).
Polysaccharides 05 00024 g005
Figure 6. Excluded volume of protein.
Polysaccharides 05 00024 g006
Figure 7. Digestion pattern of three plasmids by restriction enzyme. (A) Different formats of gel. (B) Digested plasmids were analyzed by agarose native gel electrophoresis. Digital image of 3 plasmid restriction digests run on a 1% agarose gel using TAE buffer, stained with fluorescence dye (GelGreen). The DNA size marker is a commercial ladder. The positions of the wells and directions of DNA migration are noted. These are our original data.
Polysaccharides 05 00024 g007
Figure 8. Schematic illustration of gel shift assay with pH 8.3 TAE (A) or pH 6.1 His/MES (B) buffer systems. Nucleic acid is titrated with a presumably very basic protein, whereas a better resolution of the complex may be expected for the pH 6.1 system. This is an original diagram drawn by us.
Polysaccharides 05 00024 g008
Figure 9. Comet assay. (A) Experimental scheme. (B) Typical data with intact and degraded/damaged DNA. This is an original diagram drawn by us with reference to refs. [37,38,39,40,41,42,43,44,45,46,47,48,49,50,51,52,53,54,55,56,57,58].
Polysaccharides 05 00024 g009aPolysaccharides 05 00024 g009b
Figure 10. Agarose native gel electrophoresis of various macromolecules. Electrophoresis of five different model proteins was performed using His/MES buffer at pH 6.1 (A) and Tris/Gly buffer at pH 8.3 (B). Additionally, electrophoresis of five high-molecular-weight proteins was conducted using His/MES buffer (C). These data were assembled and reorganized from ref. [60] and unpublished data.
Polysaccharides 05 00024 g010
Figure 11. Zymography of agarose native gel electrophoresis. (A) Schematic illustration of zymography. (B) ß-Galactosidase stained by the substrate, X-gal. C. ß-Lactamase stained by the substrate, nitrocefin. These data were assembled and reorganized from ref. [64] (B) and unpublished data (C).
Polysaccharides 05 00024 g011
Figure 12. Expression and purity analysis of HEK293 cell culture supernatant expressing mAb. One percent flat agarose gels at 100 V for 1 hr for protein analysis and for 30 min for DNA analysis: 7 μL of supernatant per lane and the cell culture media harvested at day 0 (d0) and day 7 (d7). Panel (A): CBB staining. The mAb and HCPs are indicated by arrow and bracket. Panel (B): gel stained with fluorescent GelGreen dye. DNA staining is indicated by arrow and bracket. Panel (C): blotted membrane stained with Colloidal Gold Total Protein Stain. Panel (D): immuno-stained blot for HCPs with anti-HEK293 cell antibody. These data were assembled and reorganized from ref. [64], where details are given.
Polysaccharides 05 00024 g012
Figure 13. Gel extraction of proteins. (A) Schematic illustration of gel extraction. (B) Purification of monoclonal antibodies using gel extraction method. Rabbit monoclonal antibodies were expressed and secreted in the medium using HEK293 cells. These antibodies were then purified using the gel extraction method and analyzed by agarose native gel electrophoresis. The negative control for this data is in the CM lane of Figure 12. Unpublished data are presented. This is an original diagram drawn by us.
Polysaccharides 05 00024 g013
Figure 14. Western blotting. (A) Schematic illustration of Western blotting. (B) HEK293 membrane fraction expressing human or mouse PLXDC2. (C) Recombinant S-CoV-2 alpha, delta, omicron BA1.1.529 or omicron BA2 spike protein (1 μg/lane) was loaded. The blot was stained by a neutralizing humanized mAb (Abwiz Bio Inc., San Diego, CA, USA, #G10 × A1) (1:5000) against S-CoV-2 spike protein. Left: agarose native gel electrophoresis. Agarose native gel electrophoresis was done at 100 V for 90 min. (a) CBB staining of agarose gel. (b) Detected antibody on contact blotting with 20 s exposure. Right: SDS-PAGE. SDS-PAGE (10–20% gradient gel, reducing condition) was run at 300 V for 35 min. (c) CBB staining of SDS-PAGE. (d) Detected by antibody on electroblotting with 20 s exposure. Details of this method are described in refs. [71,73]. Unpublished data are presented.
Polysaccharides 05 00024 g014aPolysaccharides 05 00024 g014b
Disclaimer/Publisher’s Note: The statements, opinions and data contained in all publications are solely those of the individual author(s) and contributor(s) and not of MDPI and/or the editor(s). MDPI and/or the editor(s) disclaim responsibility for any injury to people or property resulting from any ideas, methods, instructions or products referred to in the content.

