Article

Characterization of Structure and Morphology of Cellulose Lyocell Microfibers Extracted from PAN Matrix

1
A.V. Topchiev Institute of Petrochemical Synthesis, Russian Academy of Sciences, 29 Leninsky Prospect, 119991 Moscow, Russia
2
Federal State Autonomous Educational Institution of Higher Education “Moscow Polytechnic University”, Bolshaya Semyonovskaya Street 38, 107023 Moscow, Russia
3
Kurchatov Complex of Crystallography and Photonics, National Research Center “Kurchatov Institute”, Leninsky pr. 59, 119333 Moscow, Russia
*
Author to whom correspondence should be addressed.
Polysaccharides 2025, 6(1), 10; https://doi.org/10.3390/polysaccharides6010010
Submission received: 26 November 2024 / Revised: 9 January 2025 / Accepted: 31 January 2025 / Published: 3 February 2025

Abstract

:
Polymer matrices can be reinforced with cellulose fillers in a variety of geometric shapes. Depending on the morphology of the particles, the volume fraction of the composite additive may decrease, while the values of the elastic modulus may increase. Increasing the length while decreasing the width of the cellulose filler is an intriguing path in the development of composite additives and materials based on it. It is difficult to form thin continuous cellulose fibers, but this can be accomplished via the sea-island composite fiber manufacturing process. The creation of cellulose fibrils in polyacrylonitrile (PAN)/cellulose based systems happens during the spinning of the mixed solution. A selective solvent facilitates the isolation of cellulose fibrils. The structure of the isolated microfibers was investigated using X-ray diffraction, IR spectroscopy, SEM, and AFM. The structure of the resulting cellulose microfibers was compared to bacterial cellulose. It has been shown that composite fibers have a superposition pattern, while cellulose fibrils have a structure different from native cellulose and similar to Lyocell fibers (polymorph II). The crystallite sizes and crystallinity of regenerated cellulose were determined. The identified structural parameters for cellulose fibrils provide strength at the level of industrial hydrated cellulose fibers.

1. Introduction

In recent years, cellulose and its derivatives have been widely exploited as alternative materials in a variety of fields because macromolecule structural characteristics provide a number of sought-after unique polysaccharide properties [1]. Examples include low density, chemical resistance, thermal stability, high strength and rigidity, and biodegradability. The concept of H-bonds, suggested more than a century ago [2] and further expanded in later publications [2,3,4], easily explains the cellulose properties given here. The cellulose molecule contains several hydroxy groups that are responsible for the formation of intra- and intermolecular hydrogen bonds [5]. Intramolecular H-bonds connect neighboring glucopyranose units and provide chain rigidity, while intermolecular interactions achieve the integrity of parallel chains via intermolecular bonds.
One hydrogen bond has a relatively low energy; its destruction (formation) takes nanoseconds, whereas the simultaneous destruction of a system of bonds (for example, during the dissolution of cellulose) requires substantially more energy. The large number of hydroxy groups in cellulose determines the high total energy of hydrogen bonds. According to [4], while evaluating the importance of hydrogen bonds, it is important to evaluate the level at which these bonds are formed: molecular, intermolecular, fibrillar, boundary (between various phases), interfibrillar, fiber, and interfiber. The transition from one level to another is associated with the possibility of forming hydrogen bonds. Their number and position in space will affect the properties of the structure being formed. It is also important to consider the favored direction of these bonds in space [6], which makes it possible to disintegrate cellulose mechanically.
Plants [7,8], microorganisms, and animals are known to be the primary sources of cellulose, which determines its basic properties (degree of polymerization (DP), presence of impurities, crystallinity, etc.) [9]. If plant cellulose’s “companions” (lignin, hemicellulose, pectins, etc.) are always present [10], bacterial cellulose (BC) does not have these contaminants [11]. Plant lignocellulosic raw materials are pulped to produce cellulose with a high alpha fraction [12], whereas bacterial cellulose is produced by simply removing the bacteria and nutritional media from the system [13].
After impurities are removed, cellulose is a multi-level supermolecular structure whose major components are nanofibrils with diameters ranging from 20 to 200 A [14,15], which comprise 18 (24) cellulose chains, according to models [16,17]. These chains form ordered nanocrystallites and disordered amorphous regions (domains) [18]. The inclusion of lignin, hemicellulose, and other cellulose impurities may complicate its structural organization.
Bacterial cellulose is a network of intertwined fibrils. Bacterial cellulose fibrils have a lateral sizes ranging from 7 to 13 nm; when they unite, they form aggregates with a thickness of up to 150 nm, which then form ribbons with a thickness of up to 500 nm [19]. The tapes’ length substantially surpasses their thickness, reaching several micrometers [20]. The absence of inherent contaminants in bacterial cellulose and the structure formed during the synthesis process result in high crystallinity (up to 96%) [21]. Crystallinity values in plant cellulose rarely exceed 85%, and after chemical and mechanical treatment, structural modifications reduce the parameter to 50–60% [22].
The presence of crystalline and amorphous regions in cellulose allows for the production of nanocrystalline and microfibrillar cellulose through chemical and mechanical treatment [23,24,25]. The resultant particles have a variety of properties (rigidity, form factor, biodegradability, and so on) that influence their functional usage in the production of composite materials [26,27,28]. Bacterial cellulose is in high demand as a filler for composite materials due to its chemical purity and uniformity, high surface development, and low width when compared to tape length [29]. The morphology and form factor of particles have been thoroughly investigated utilizing methods such as optical, scanning, and atomic force microscopy [30,31,32].
The hydroxy groups of cellulose are known to be responsible for its hydrophilic properties, so introducing and uniformly distributing cellulose particles into synthetic matrices is a difficult task, especially when using bacterial cellulose due to the large surface area and entanglement of single ribbons. It is possible to circumvent the problems of introducing a filler with a high form factor and hydrophilicity into a synthetic matrix by preparing mixed solutions and spinning them into composite fibers with fibrillar morphology [33].
The solid-phase “dissolution” method [34], which uses N-methylmorpholine-N-oxide (NMMO) as a cellulose solvent, facilitates the production of mixed PAN-cellulose solutions over the whole concentration range. The unique interaction between cellulose and PAN (covalent bonding) causes the anomalous behavior of the viscosity of mixed solutions, specifically a deviation from the logarithmic rule of viscosity additivity.
The deformation of mixed solutions with high PAN content promotes fibrillar morphology, with the dispersed phase being a cellulose solution in NMMO. Even after the stress is gone, the fibrils that have developed are stable. Vinogradov and coauthors [33] describe how fibrils arise when molecules of the dispersed medium contact with cellulose, which acts as a dispersed phase. Following the coagulation of the formed fibers in contact with the precipitant (water), the fibrillar morphology is fixed and represents cellulose fibrils in the bulk of the PAN matrix. The matrix polymer is selectively removed via dissolving with the aprotic solvents DMSO or DMF. With this type of selective dissolution, PAN is totally removed from the system, and the cellulose fibrils may partially swell but not dissolve.
After isolation, cellulose microfibers have a diameter of no more than 1–2 microns and a length equal to the length of the original composite precursor. The elastic modulus of isolated microfibers is around 30 GPa; in comparison, the predicted maximum elastic modulus values for cellulose range from 120 to 250 GPa [35,36]. Achieving theoretical values of the elastic modulus is complicated by the formed supramolecular structure of cellulose, which consists of a crystalline and amorphous phase and may contain various types of defects. Elastic modulus values in cellulose decrease with increasing moisture content. For particles of thermomechanical pulp (100% spruce), the values are 49 ± 40 kPa [37]. The elastic modulus of microcrystalline cellulose is 25 ± 4 GPa [38], while isolated microfibrils from Lyocell fiber with a diameter of 170 nm have a modulus of 93 GPa [39], exceeding Kroon-Batenburg’s modulus values for regenerated cellulose (89 GPa) [40]. The modulus values of nanocrystalline cellulose range from 8 to 57 GPa in the transverse direction and 67 to 200 GPa in the longitudinal direction [41].
Thus, cellulose nano- and microparticles can have both a developed surface and rigidity. The utilization of such particles as composite additives is a potential approach. The effectiveness of employing such particles can be determined by comparing the structural and mechanical properties of the filler to the final composite material.
Previous research demonstrated that cellulose microfibers formed in mixed solutions with PAN in NMMO can be isolated from the matrix. Such microfibers have mechanical properties comparable to industrial cellulose fibers like Lyocell.
The strength of individual microfibers reaches 350 MPa. The elastic modulus for microfibers is higher than that of PAN and composite fibers and reaches 32 GPa. Lyocell, composite fibers, and microfibers have close deformation characteristics; the elongation values do not surpass 8% [42].
Therefore, we assume that the structure of microfibers formed under non-standard conditions should be similar to Lyocell fibers. In light of the foregoing, the goal of this study was to investigate the structural and morphological characteristics of cellulose microfibers extracted from a PAN matrix via selective dissolution using XRD, SEM, and AFM. The microfiber structure data were compared to literature-based models that link supramolecular organization to cellulose mechanical characteristics.

2. Materials and Methods

2.1. Production of Test Specimens

The procedure described in [33,43,44] was used to manufacture composite fibers made of PAN and cellulose. A PAN ternary copolymer with the following composition: 93.9% acrylonitrile, 5.8% methyl acrylate, 0.3% methyl sulfonic acid (Mw = 85,000 g/mol) with an average particle size of 50 μm (Good Fellow, Huntingdon, UK). Cellulose from the Baikal Pulp and Paper Mill (Baykalsk, Russia) with DP = 600, moisture content ~8%, and mass content in the dry residue of α-cellulose ~92% was pre-ground to a powder condition (particle size no larger than 250 μm). Mixed solutions were prepared using the common solvent N-methylmorpholine-N-oxide (NMMO) (Tm = 100–120 °C; water content < 10%; Demochem (Shanghai, China)). Propyl gallate (Sigma-Aldrich, St. Louis, MO, USA) was used as an antioxidant and added at a concentration of 0.5% (on polymer mass) during the solid-phase activation process.
Mixed solutions were prepared on a HAAKE Minilab II twin-screw laboratory mixer (Thermo Fisher Scientific, Waltham, MA, USA), at a temperature of 120 °C and a screw rotation speed of 100 rpm. The composite fibers were formed using a dry-jet wet process on a Rheoscope 1000 viscometer (CEAST, Pianezza, Italy) with a winding device at 110–120 °C. Lyocell fibers were spun from cellulose solutions in NMMO using the above-mentioned method.
The morphology of solutions and fibers was studied using polarization microscopy (Boetius microscope, VEB Kombinat Nadema, Dresden, Germany and Biomed 6PO microscope (Biomed Co., Moscow, Russia) equipped with a ToupTek E3ISPM5000 camera (ToupTek Photonics Co., Hangzhou, China)).
PAN is highly soluble in polar aprotic solvents, and thus, the cellulose phase was isolated using dimethyl sulfoxide (DMSO) (Chimmed, Moscow, Russia). The resulting composite fibers were immersed in DMSO for 24 h at room temperature. Next, a new solvent was used. The procedure was repeated at least three times. After removing the PAN with DMSO, the cellulose fibers were washed with water.

2.2. Characterization of Cellulose Microfibers

Fourier Transforms Infrared Spectroscopy (FT-IR)

IR spectra of the fibers were recorded on a HYPERION-2000 IR (Bruker, Billerica, USA) microscope coupled with an IFS-66 v/s Bruker IR Fourier spectrometer (crystal-Ge, scan 50, resolution 2 cm−1, range 4000–600 cm−1). The attenuated total reflectance method was used. Software—Opus (7.5).

2.3. Scanning Electron Microscope (SEM)

The morphology and microstructure of the surfaces of dried gel-films of bacterial cellulose G. hansenii GH-1/2008 and the resulting microfibers were studied by low-voltage scanning electron microscopy (SEM) using a field emission scanning electron-ion microscope Scios FEI (Thermo Fisher Scientific, Waltham, USA) at an accelerating voltage of less than 1 keV in Optiplan mode.

2.4. X-Ray Diffraction (XRD)

XRD patterns of the bacterial cellulose, microfibers, and PAN powder were carried out on an X-ray powder diffractometer MiniFlex 600 (Rigaku, Tokyo, Japan) with CuKα radiation. The diffraction peaks were recorded within the angle range 2θ from 3 to 40° with step 0.01° and a scanning speed of 1° per min. Phases were identified using the ICDD PDF-2 (2014) and Crystallography Open Databases.
Fink and coauthors [45] described a method for assessing the crystallinity index (CrI) and crystallite sizes. The crystallinity of cellulose was assessed using the Segal method [46]:
CrI = 100 × (I200 − IAM)/I200
The crystallite size was calculated based on the Scherrer equation:
τ = Kλ/(β cosθ),
where K is a constant of 0.89, τ is the crystallite size, λ is the X-ray wavelength (0.154 nm), β is the full-width of the reflection at half-maximum (FWHM), and 2θ is the angular position of the reflection [47].

2.5. Atomic Force Microscopy

The morphology of the samples was studied by atomic force microscopy in intermittent contact mode using an NTEGRA Prima device (NT-MDT Spectrum Instruments, Zelenograd, Russia) using HA_FM silicon cantilevers (Kapella LLC, Moscow, Russia). AFM studies of the surface of the samples were carried out under controlled conditions of the TRACKPORE ROOM-05 measuring complex, cleanliness class 5 ISO (100), maintaining a humidity of 40 ± 1% and a temperature of 22 ± 0.05 °C.

3. Results

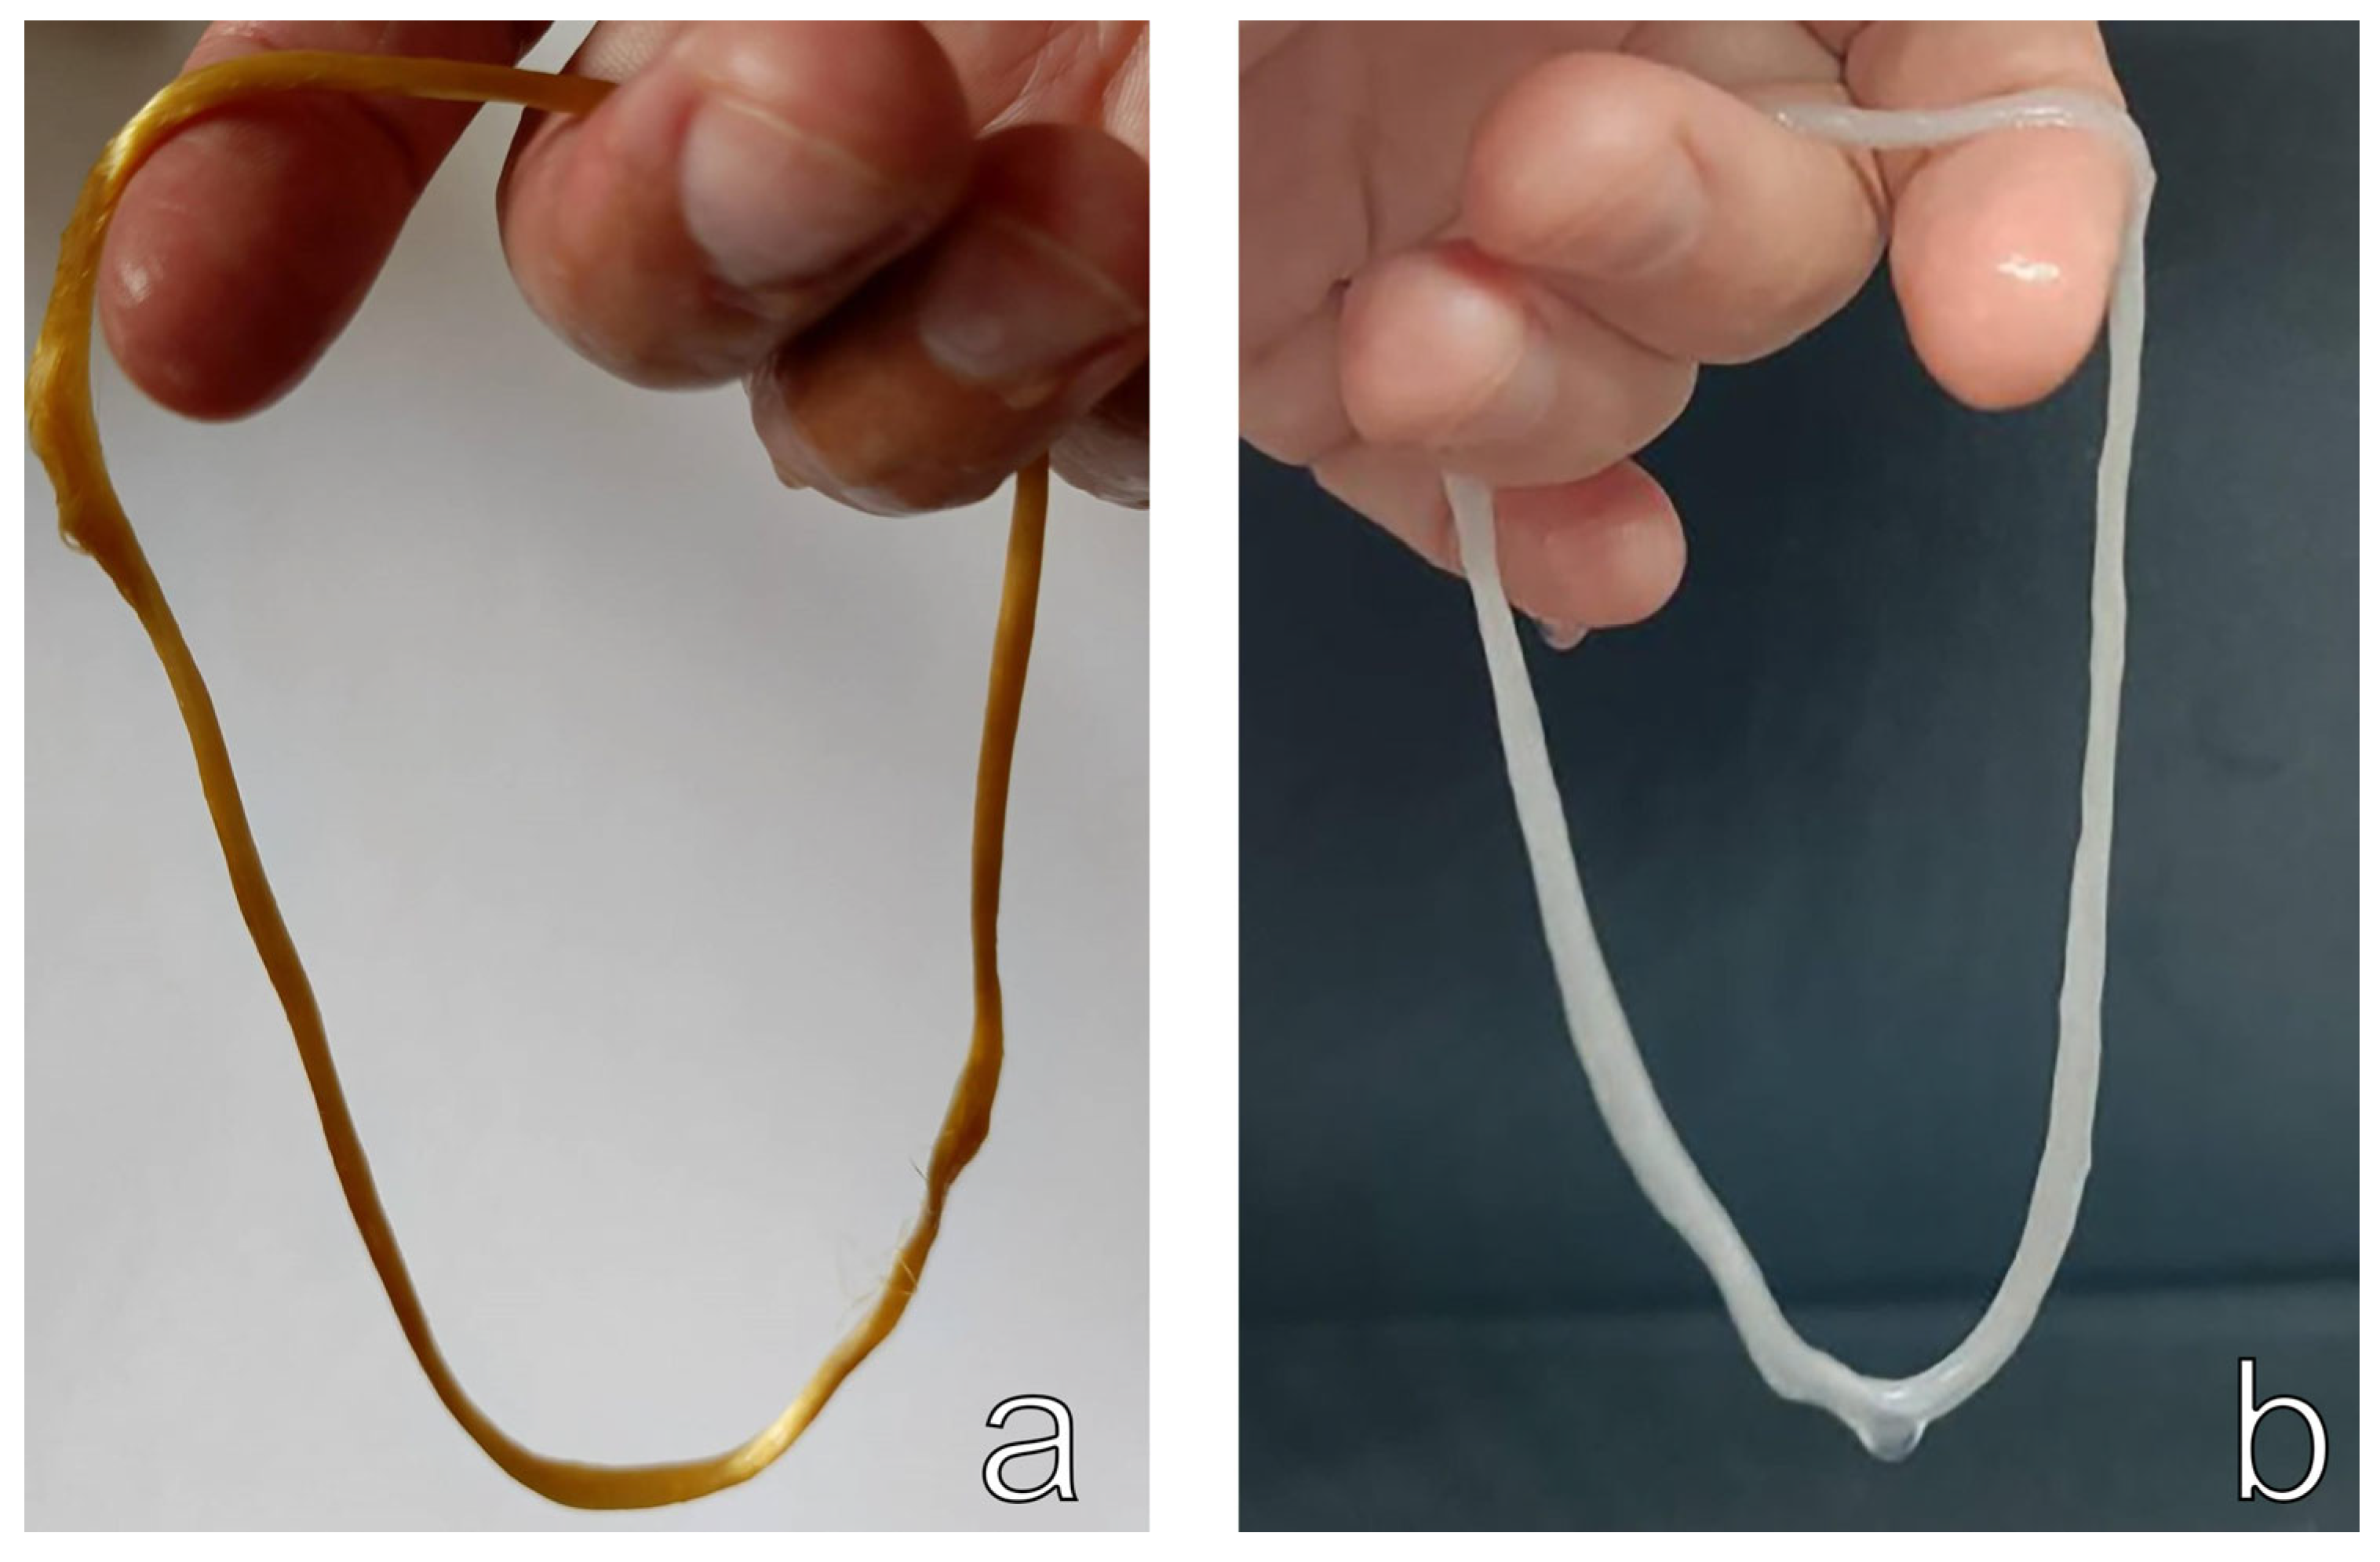
3.1. Production of Cellulose Microfibers

To better understand the emerging structure and morphology in cellulose microfibers, we shall first provide a quick overview of their preparation. Mixed solutions were formed using the dry-jet wet method through a single-channel die with a diameter of 500 μm and 5 mm in capillary length. The solution exited the capillary and entered an air gap 10–15 cm high. The solution was then directed through an aqueous precipitation bath to the receiving shaft. After receiving a skein of freshly spun fibers with the solvent partially removed, the fibers were immersed in water to completely remove the NMMO. The washed fibers (Figure 1a) were dried without tension at room conditions.
Composite fibers have a light brown color, which occurs due to chemical reactions in PAN at high temperatures. The resulting fibers are flexible and do not break when bent repeatedly.
To selectively remove PAN, composite fibers with a diameter of less than 20 μm were immersed in DMSO. After being isolated, the cellulose microfibers were washed with water. Figure 1b shows photograph of the obtained cellulose microfiber skein.
Cellulose microfibers separated from composite fibers have the characteristic white hue of cellulose. Microfibers retain large amounts of moisture and behave like bacterial cellulose, which has a high water retention capacity of 80.4 g/g. Water is retained in nanoporous capillaries, fibrils, and on the surface of bacterial cellulose by attaching to its hydroxy groups [48]. The weight (water) loss for wet cellulose microfibers produced under room conditions was more than 95%, which is slightly less than that of bacterial cellulose [49].
If bacterial cellulose forms spatial networks (3D network), isolated microfibers produce a structure along the spinning axis (Figure 2).
It was discovered that the cellulose phase, having transitioned from a heterogeneous solution to the fibrils generated during the spinning process following the removal of PAN, takes the shape of extended microfibers. The diameter of the microfibers is substantially less than their length and varies slightly along the fiber. In water, never-dried microfibers are easily separated from one another. Crossed polaroids show a cellulose fiber-like glow, indicating the formation of a supramolecular structure and the presence of organized regions in the microfibers.
Cellulose microfibers are characterized by a large number of hydroxyl groups on their surface. When drying these microfibers, active interaction occurs between these functional groups. As a result of this interaction, the microfibers agglomerate and form bundles. The diameter of the resulting bundles depends on the number of original microfibers and their diameter. When rewetting, microfibers do not always separate from one another.

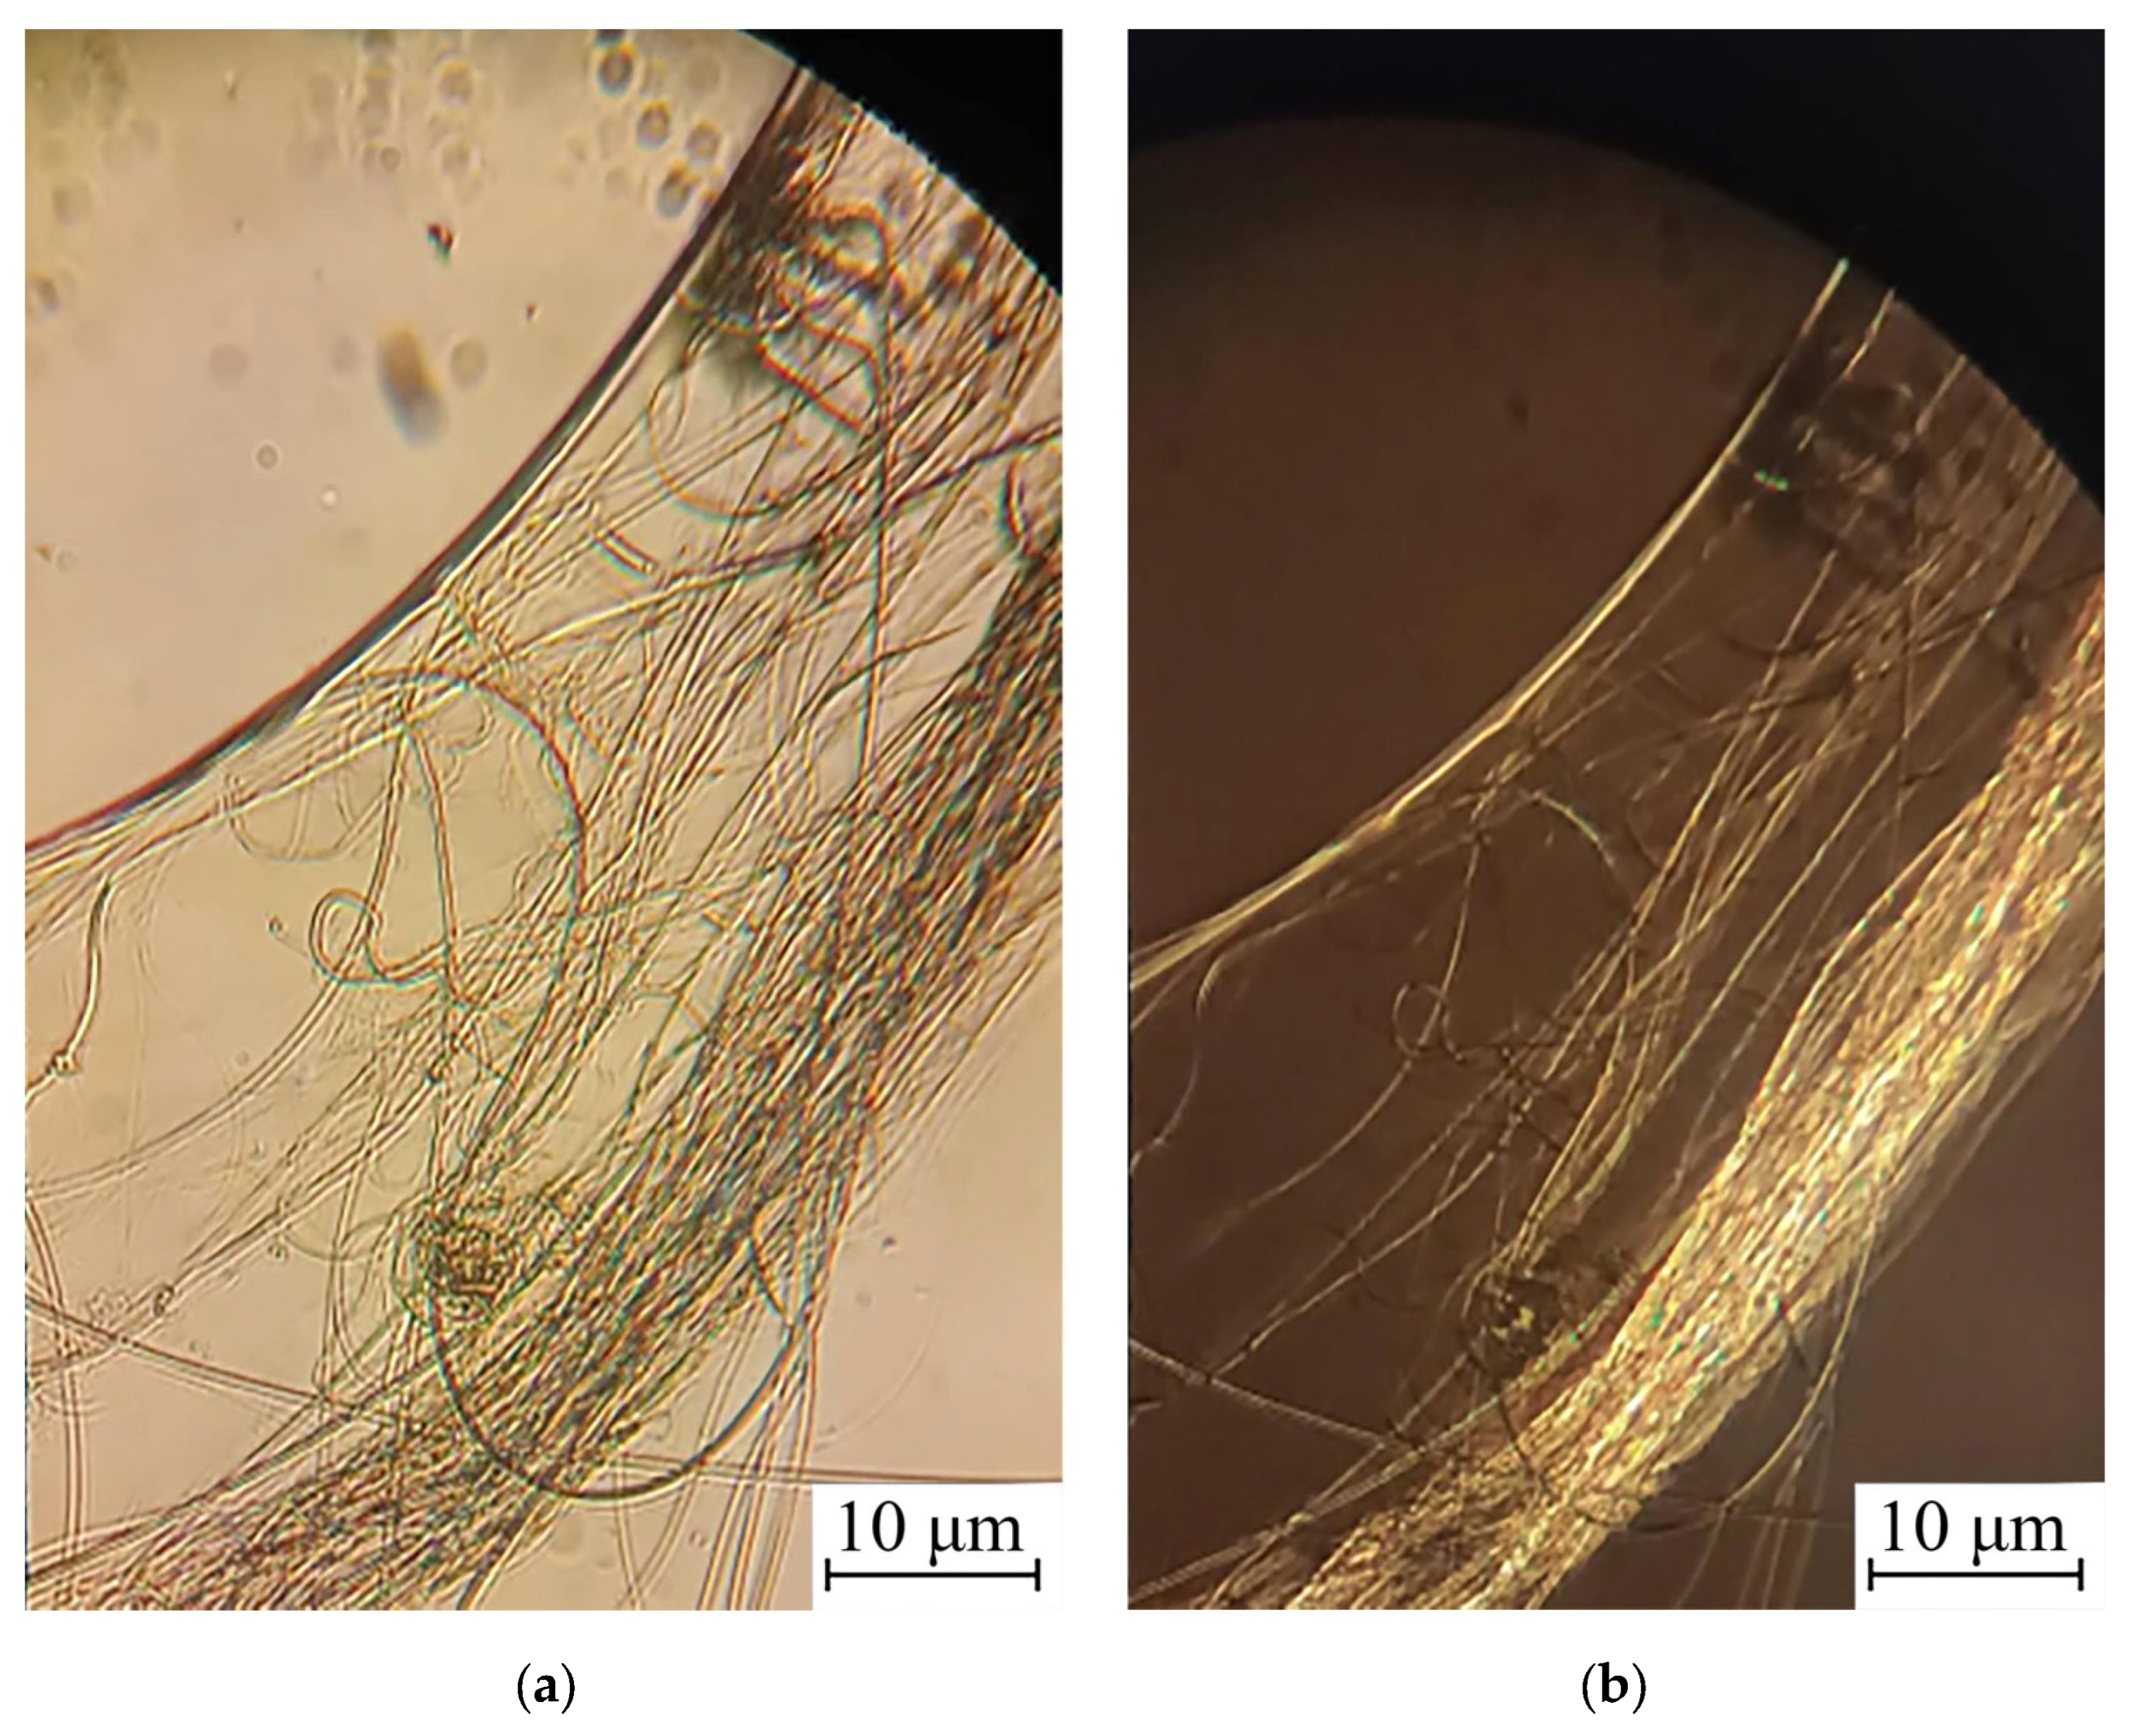
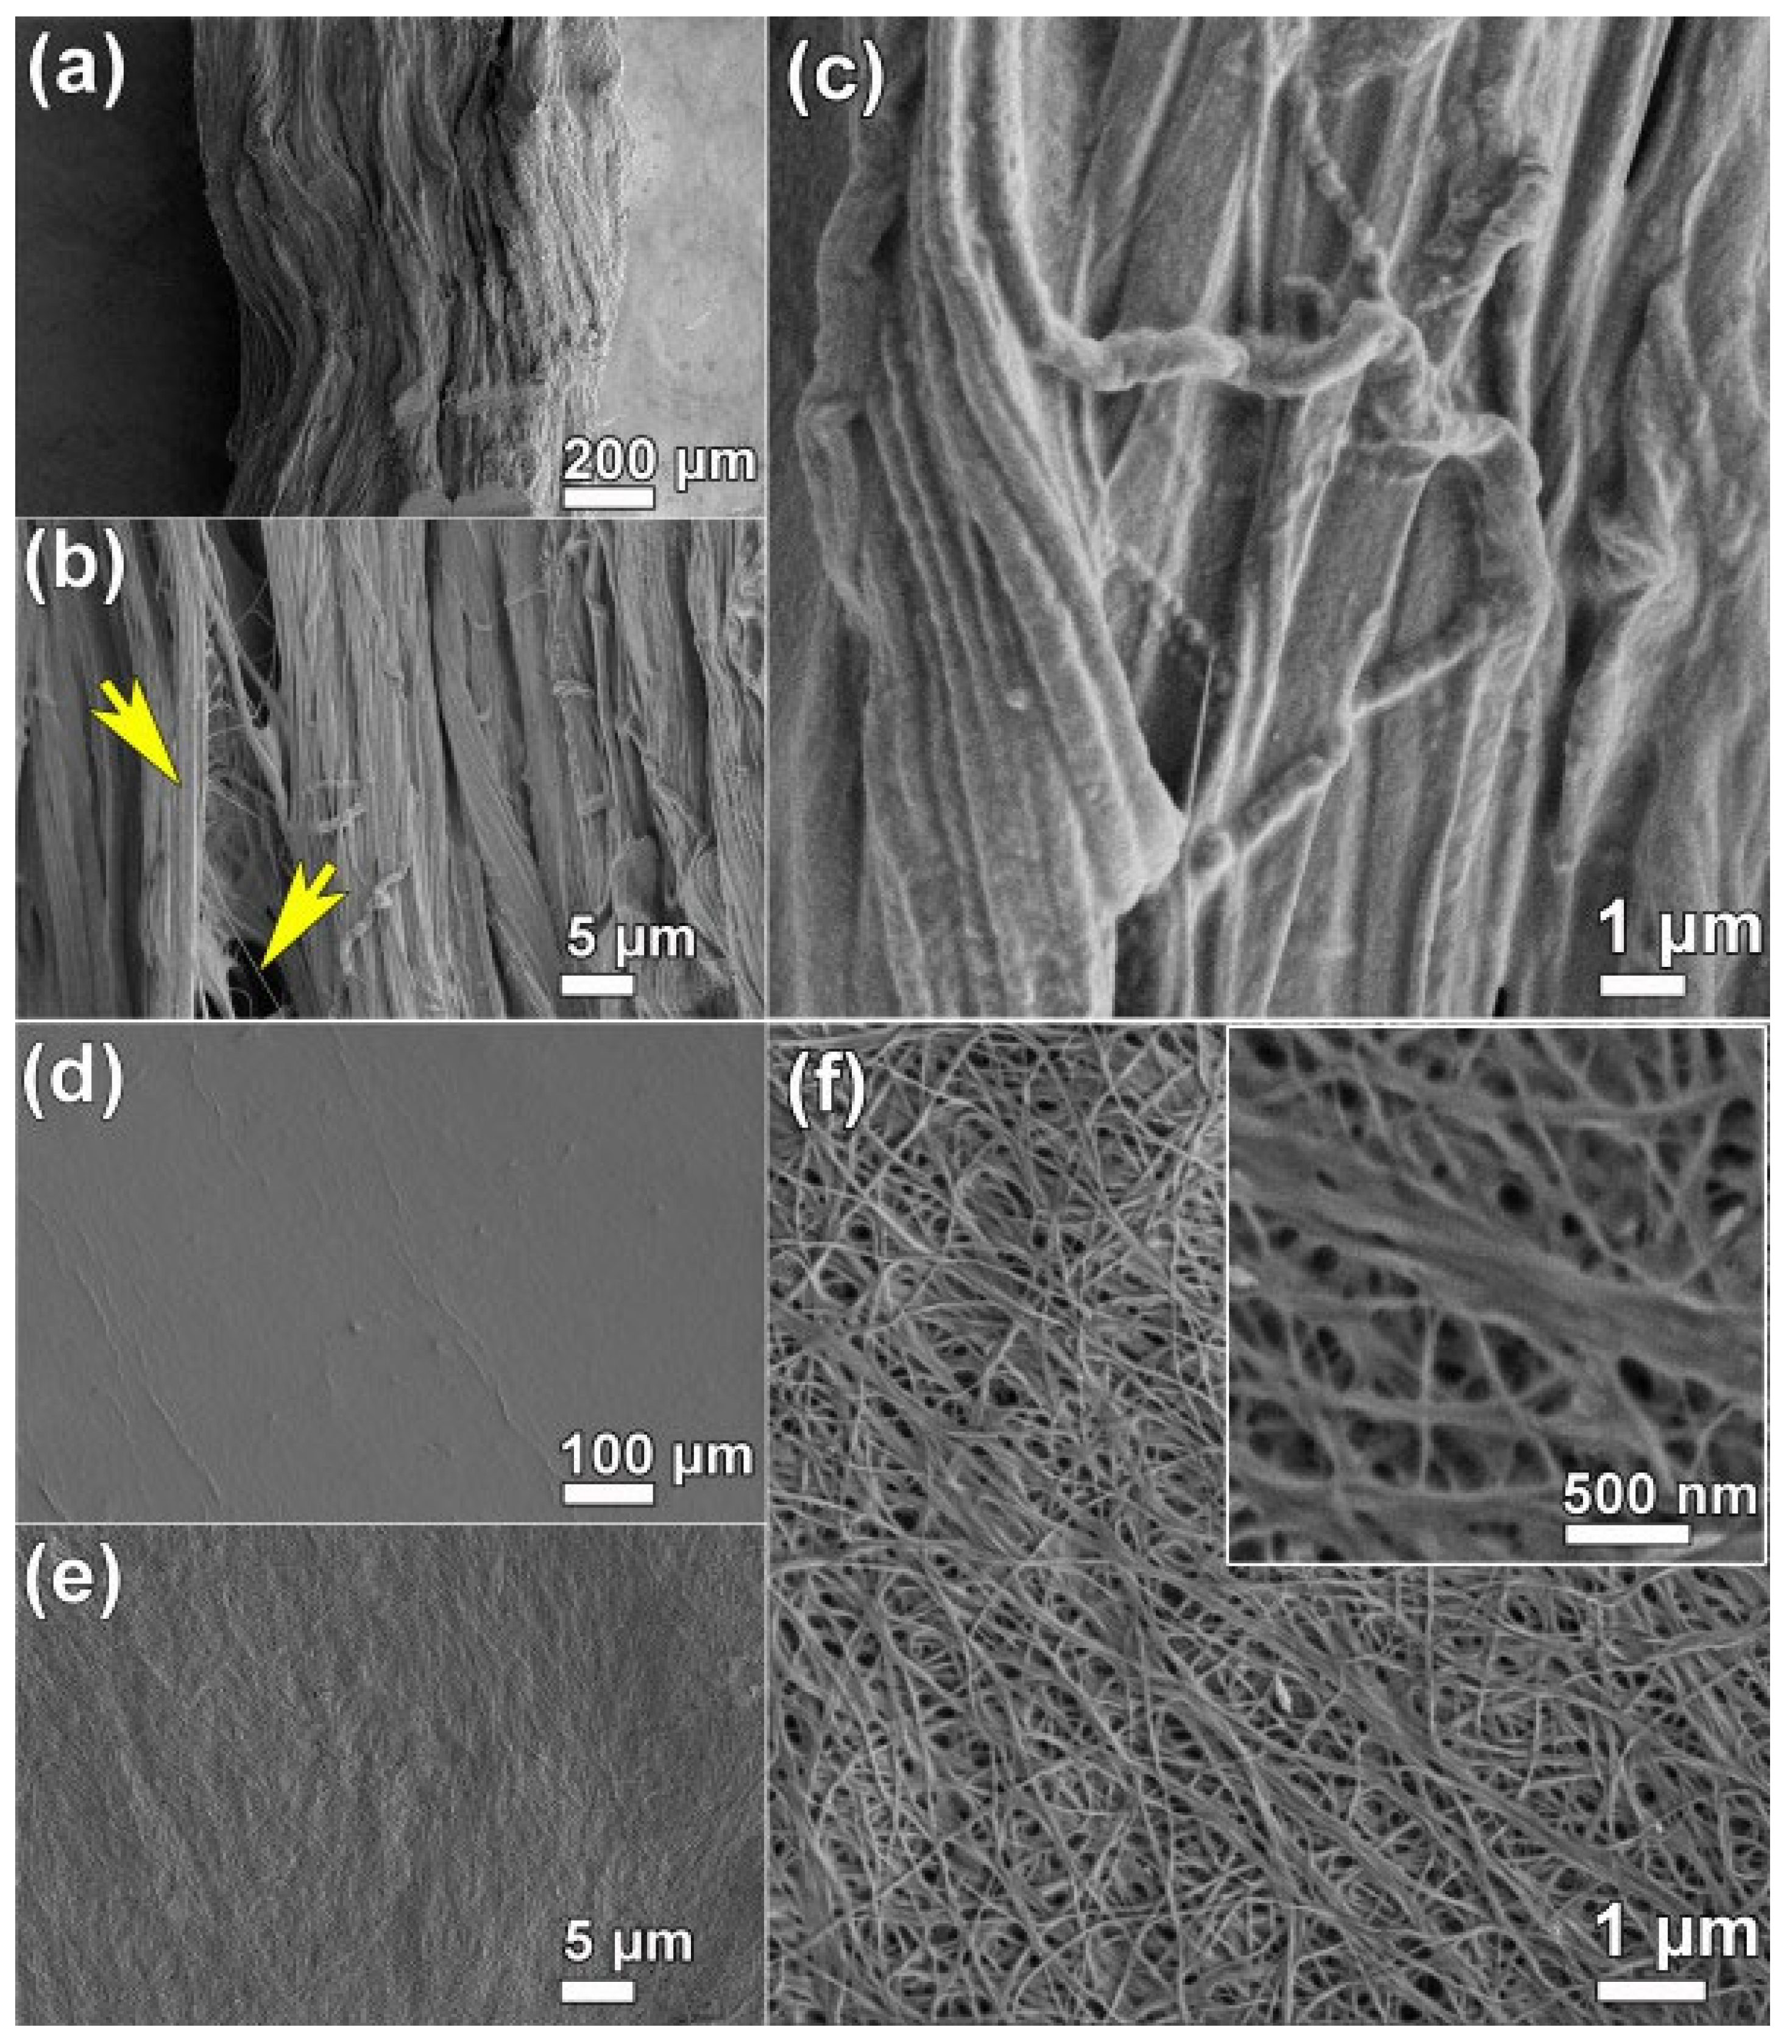
3.2. Morphological Studies

The morphology of cellulose microfibers and a comparative sample of bacterial cellulose was studied in more detail using scanning electron microscopy (Figure 3).
It is known that bacteria generate thin ribbons that intertwine to form a chaotic three-dimensional network during the cellulose production process [50]. Bacterial cellulose ribbons are usually no thicker than 100 nm. The ribbons comprise fibrils with an average diameter of 7–8 nm that can aggregate into what are known as packs. Ribbons can exceed 100 μm in length, which is many orders of magnitude longer than their diameters [51]. At high magnifications, it is possible to observe crystallites with a length of up to 10 nm.
The spatial organization of bacterial cellulose, namely the 3D structure and isolated cellulose microfibers, can be close in the case when the microfibers undergo liquid processing in a free state. In this case, single microfibers can intertwine and create a three-dimensional mesh. When microfibers are processed in a fixed condition, the majority of them have a preference laying direction (parallel to the composite fiber’s winding (fiber direction)), facilitating the controlled creation of a morphological pattern for the released microfibers.
We previously demonstrated that composite fibers based on PAN and cellulose (composite additive) have a complex surface morphology that differs from Lyocell and PAN fibers [33]. Bicomponent fibers have a non-smooth, defective morphological profile.
Microfibers in a wet state have an average diameter of up to 1–2 microns. Less fine microfibers probably belong to areas of a higher draw ratio of the composite fiber. During the drying process, microfibers can aggregate to create more complicated spatial structures, such as ribbons. The stability of the formed monolithic structures is ensured by the formed system of hydrogen bonds. In Figure 3b, the objects of disintegration of cellulose microfibers are clearly visible: a monolithic structure of “glued” parallel microfibers and randomly placed single microfibers at the rupture site.
Unlike wood cellulose, bacterial cellulose does not contain symbiotic plant components such as lignin, hemicellulose, fats and resins. The only component that can complicate the morphology of bacterial cellulose is bacterial cell residue, which are typically removed with aqueous-alkaline solutions or surfactants [52]. Even after repeated treatments, bacterial cellulose retains a high level of crystallinity and DP [53,54]. Although bacterial cellulose has a more uniform chemical composition and an orderly supramolecular structure, the numerous physical interactions between ribbons and meshes dictate the strength of the BC films.

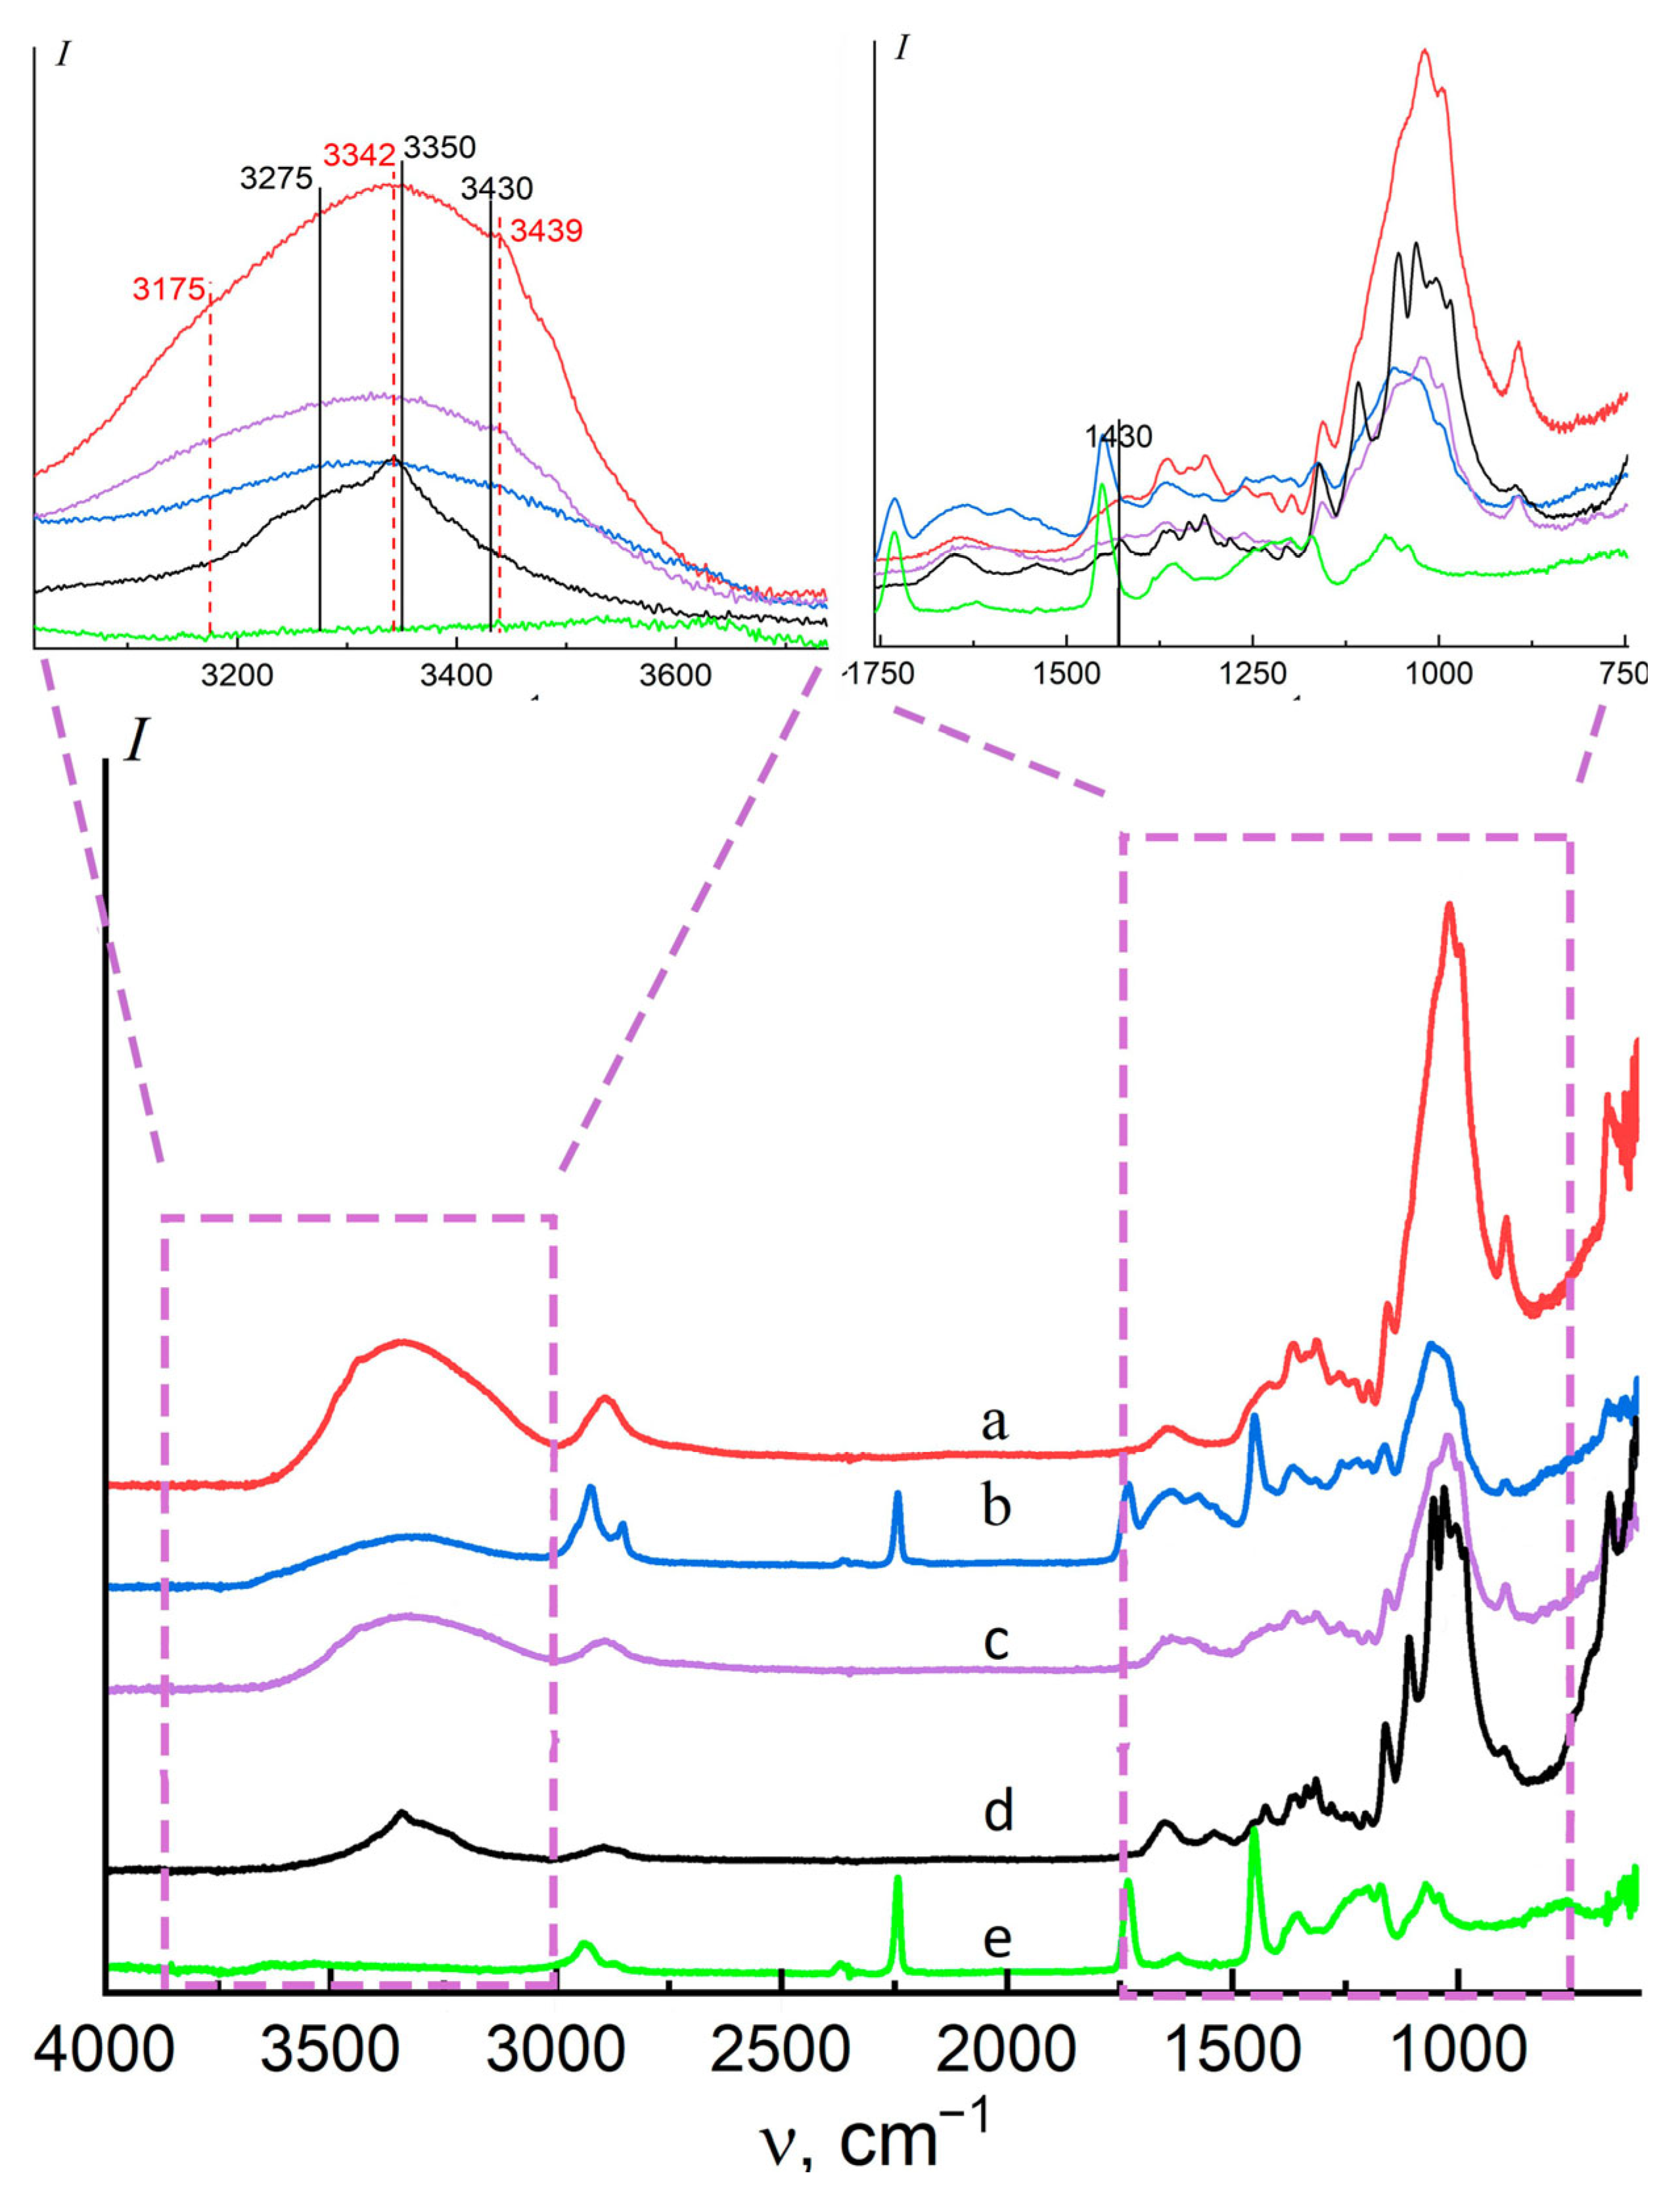
3.3. Fourier Transform Infrared Spectroscopy (FT-IR)

As previously stated, cellulose’s hydroxy groups participate in the formation of hydrogen bonds, as crystalline and amorphous regions. The chemical structure and structural properties of the isolated microfibers, composite, and Lyocell fibers were evaluated using IR spectroscopy (Figure 4).
The figure shows spectra covering the absorption region 4000–600 cm−1. The variety of configurations of cellulose molecules causes a strong broadening of bands in the IR spectra. For these spectra, we select two regions: the first (1750–850 cm−1) describing the structure of cellulose according to Nelson and O’Connor [55], and the second, the region 3660–2800 cm−1. According to [56,57], the bands in the region of 3600–3000 cm−1 correspond to OH groups involved in the formation of hydrogen bonds in cellulose and its satellites (Figure 4). The band at 3620 cm−1 corresponds to OH groups that are not involved in the formation of hydrogen bonds.
In the structure of cellulose I, three types of hydrogen bonds are possible (two intramolecular -O2 -H..O6′, O3′ -H..O5, and one intermolecular -O6′ -H...O3″). These bonds correspond to spectral bands at 3430, 3350, and 3275 cm−1 [58]. After the regeneration of cellulose from solutions, the intensity of the bands characteristic of polymorph I decreases, and in the spectra, one can find bands characteristic of polymorph II—3439, 3342, and 3175 cm−1 stretching vibrations of hydroxy groups (-OH stretching hydrogen bonds) [59].
The IR spectrum of the composite fiber sample (70% PAN-30% cellulose) (Figure 4b) also contains a band in the region of 2240 cm−1 (stretching vibrations -C≡N), characteristic of polyacrylonitrile.
According to [56], a characteristic feature of the transition of cellulose from conformation I to II is a drop in the intensity of the band at 1430 cm−1 (CH2), which shifts to lower frequencies (1420 cm−1). Its intensity can be used to calculate the degree of crystallinity of cellulose (LOI (lateral order index) (I1430(1420)/I893) [60]. The intensity of the band at 893 cm−1 (C-C-H) is associated with the proportion of the amorphous phase in cellulose. The highest LOI values are observed for microfibers; for bacterial cellulose, the values are slightly inferior to microfibers; and finally, for Lyocell fibers, the values are the smallest and amount to 0.38, which means less lateral ordering of cellulose macromolecules.
Nelson and O’Connor proposed using the ratio of the 1373 cm−1 and 2900 cm−1 bands to determine the total crystallinity index (TCI) of cellulose [60]. The identified values for bacterial cellulose were the highest, whereas the values for microfibers and Lyocell fibers were nearly identical. The hydrogen bond intensity (HBI) of cellulose (3350 cm−1/1337 cm−1) correlated with the crystalline phase and the degree of regularity of intermolecular interactions. Oh and coauthors [61] describe chain mobility and the length of molecular bonds. Lyocell fibers have the highest HBI index (1.03), while bacterial cellulose has the lowest (0.69), implying that the system will have the lowest order in hydrated cellulose fibers and the greatest in bacterial cellulose [62].
A different pattern was seen for composite fibers having 70% PAN and 30% cellulose compared to the cellulose spectrum. The spectrum contains the main bands of PAN, for example, 2244 cm−1 corresponding to the nitrile groups of PAN. In the presence of NMMO at temperature, the intensity of the band may decrease, and a new band at 2195 cm−1 appears in the spectrum, which is associated with the conjugation of nitrile groups [63]. After the selective removal of PAN with DMSO, the band does not appear in microfiber spectra, indicating that the matrix polymer has been completely removed.

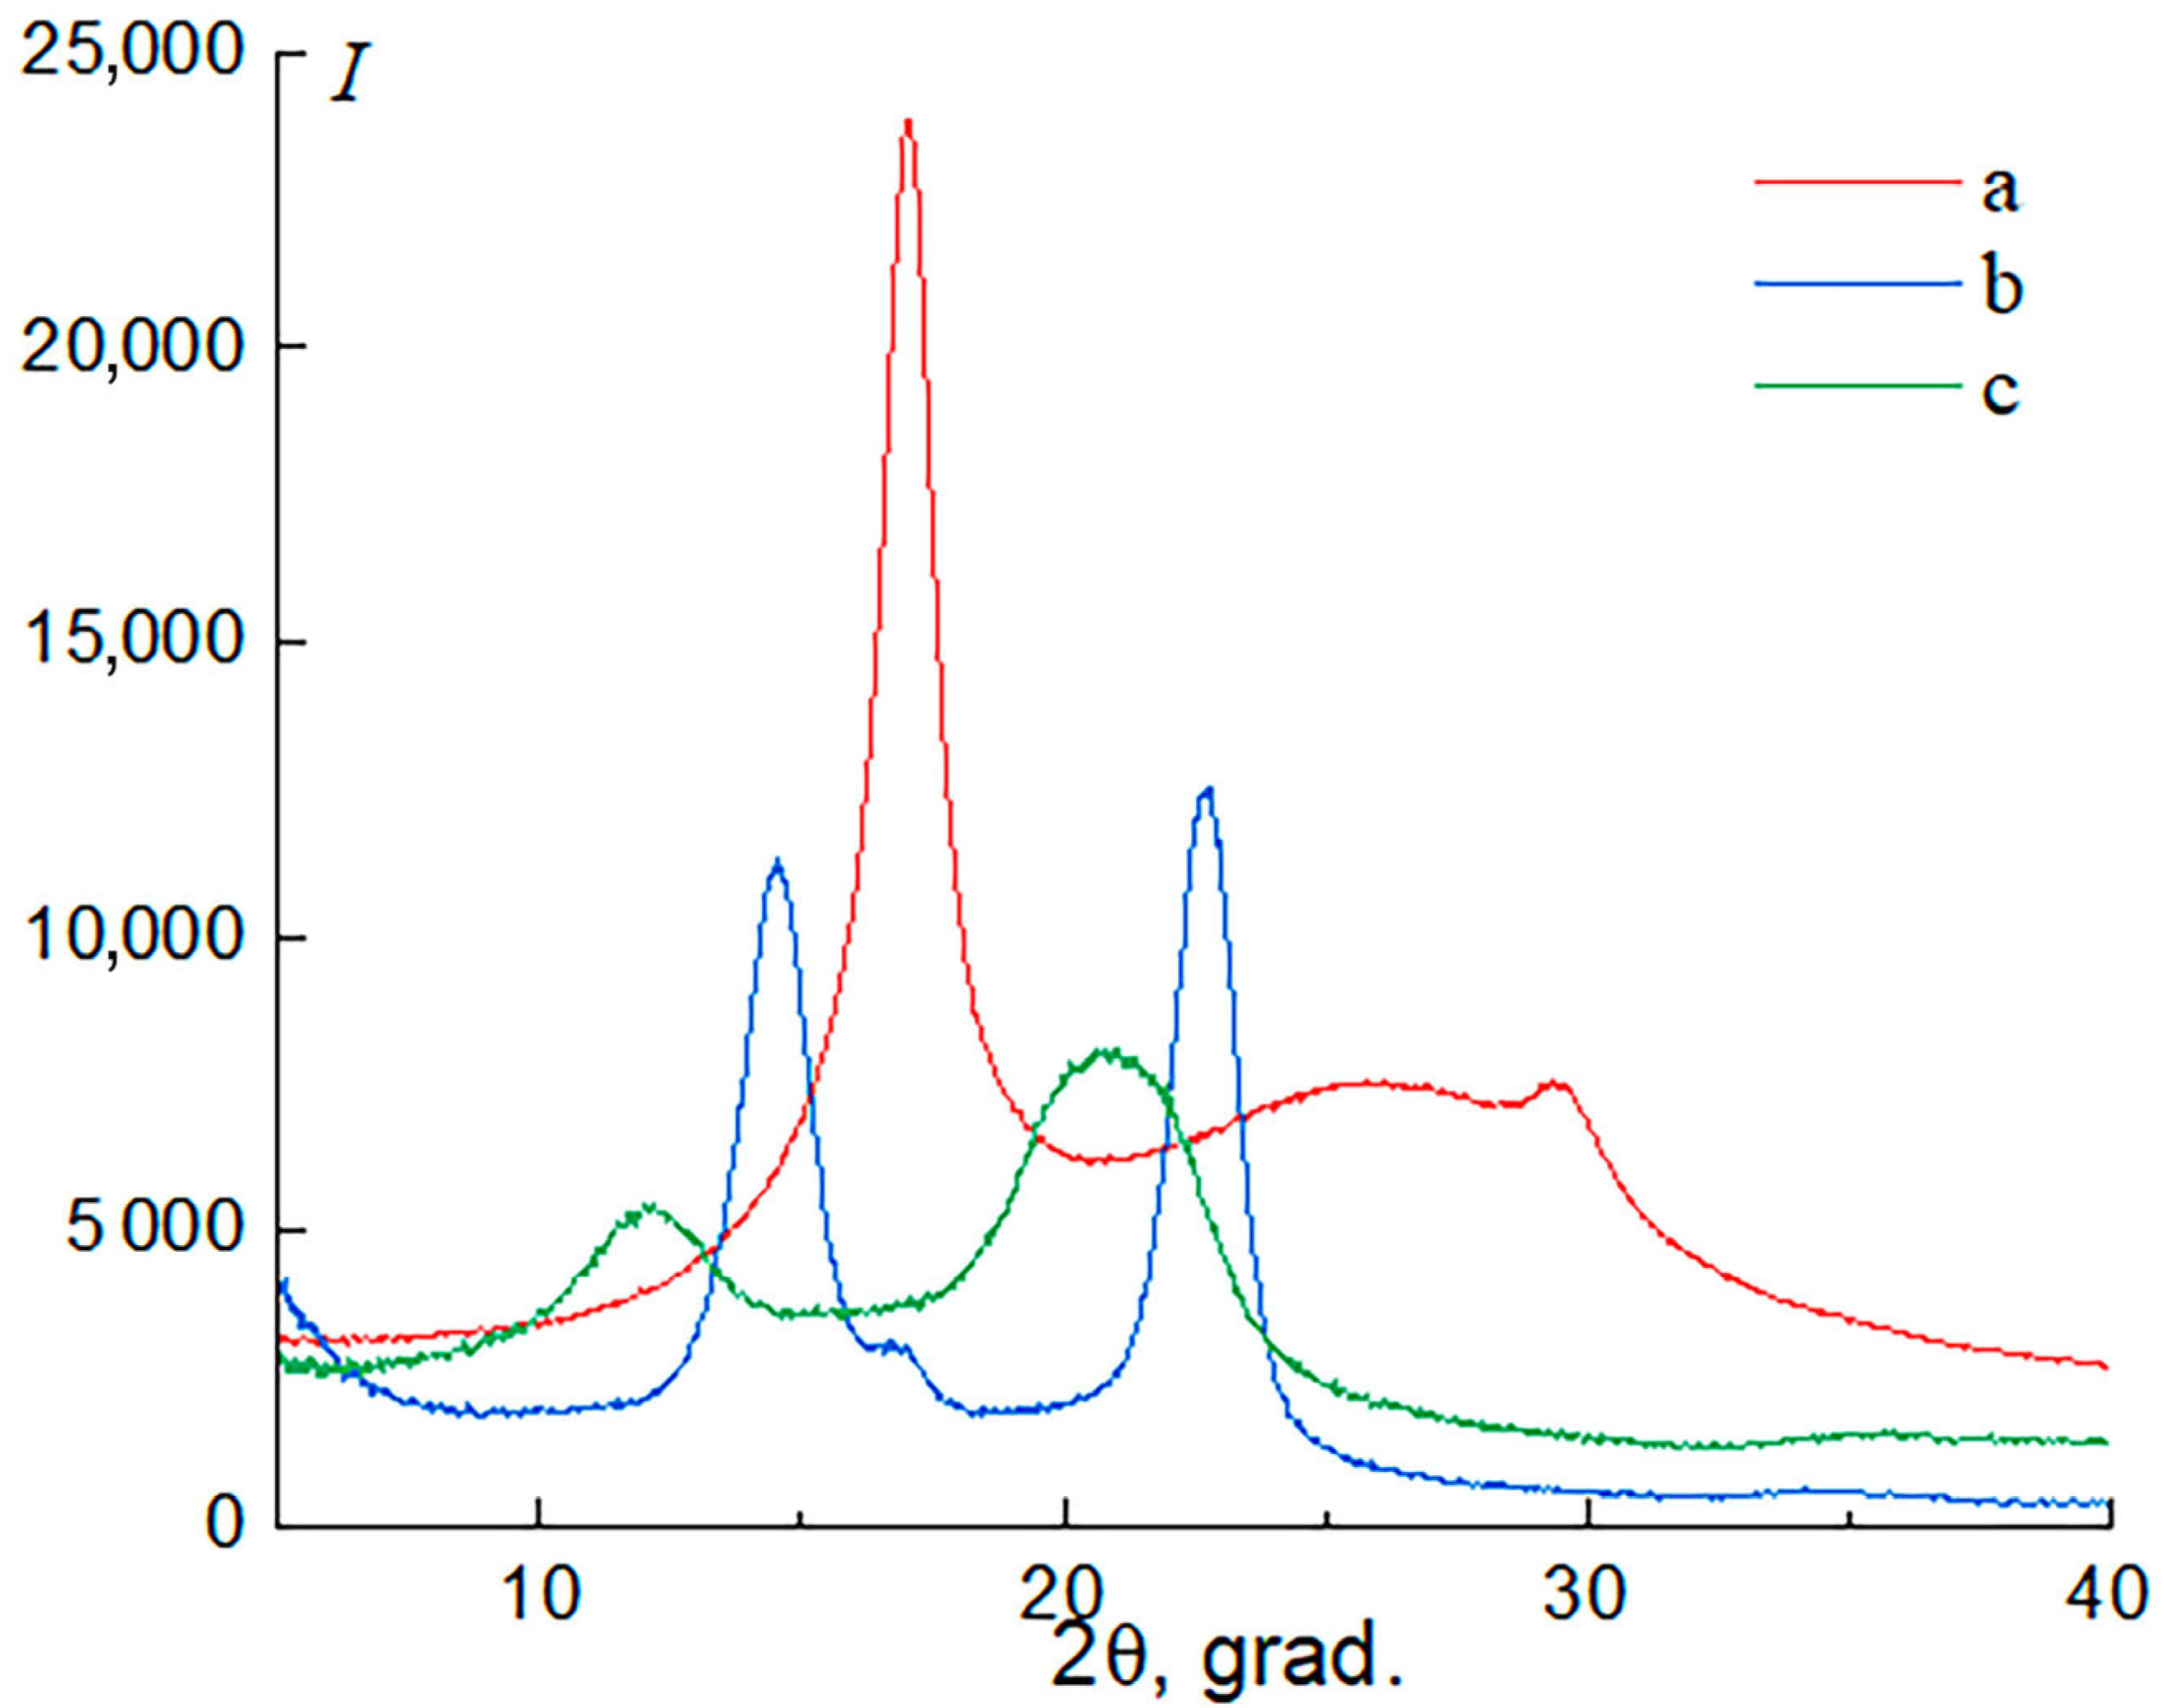
3.4. X-Ray Diffraction (XRD)

Spectroscopic investigations show that microfibers form a supramolecular structure similar to Lyocell fibers and differ from bacterial cellulose. Microfibers and bacterial cellulose are attractive due to their small cross-sectional dimensions. As a result, when PAN is selectively dissolved in composite fibers, it is highly likely that it will be removed. This treatment may result in structural changes in cellulose, which can be assessed using the X-ray diffraction method. The structures of bacterial cellulose, PAN powder, and isolated microfibers are presented in Figure 5.
It is well known that the structures of native and regenerated cellulose differ, as do their diffraction patterns. For bacterial cellulose, three reflections were observed in the diffraction pattern in the region 2θ~14.5°, ~16.6°, and ~22.7°, which corresponds to the crystallographic planes (100), (010), and (110) for cellulose Iα and (1–10), (110), and (200) for cellulose Iβ, respectively [64,65]. The difference in height of the 100 and 010 peaks is the result of preferred orientation that is a very common finding in BC, in which it is expected that the cellulose Iα structure is dominant, which could be evaluated by two equatorial d-spacings [66].
In the process of spinning composite fibers and removing PAN with a selective solvent, cellulose microfibers are formed, for which a different pattern from native cellulose is observed in the diffraction pattern. The main reflections are located in the regions of diffraction angles 2θ~12.1°, ~20.1°, and ~21.5°, which, according to [67], correspond to the structure of regenerated cellulose (polymorph II). Reflection characteristics of PAN are not found in cellulose microfiber diffraction patterns, which correlates with IR spectroscopy data and sample mass estimations before and after the selective removal of PAN.
An assessment of the crystallinity index of cellulose I using the Segal method revealed that for bacterial cellulose, it is about 86%, and the crystallinity index of cellulose II using the method described by Azubuike and coauthors [68] for microfibers—54%. The Segal method frequently yields a higher crystallinity index than other methods [69]. The crystallinity index, calculated using the peak area method described by Makarov and coauthors [64] is also higher for bacterial cellulose (77%) compared to microfibers (41%). The revealed crystallinity values for cellulose microfibers are 40% higher than for viscose fibers and are close to the values for industrial Lyocell fibers [70].
Eichhorn and Young [38] used the Voigt model to estimate the elastic modulus of microcrystalline cellulose, where the theoretical modulus values for 100% crystalline cellulose 128 GPa and the elastic modulus data for amorphous polymers are 5 GPa [71,72]. In the linear elastic region, the bending rigidity is highly anisotropic and dependent on the bending direction in terms of crystallographic plane [73]. X-ray diffraction determined the crystallinity index of microcrystalline cellulose to be 48.5 ± 1.1%, with an elastic modulus of 25 ± 4 GPa. The crystallinity index and elastic modulus values for microcrystalline cellulose were somewhat higher than those obtained for cellulose microfibers isolated from PAN. According to the Reuss model, the elastic modulus of cellulose microfibers ranges from 8 to 13 GPa depending on the method used to calculate the degree of crystallinity; the Voight model yields the widest range of elastic modulus values (55–70 GPa); and the McCullough model yields the closest values to the real experiment (18–30 GPa). The deviation from the observed values of the elastic modulus of the data calculated using the Voigt and Reuss models is explained by the presence of amorphous and crystalline regions in cellulose and their structural organization [74].
The Scherrer equation [47] was used to estimate the crystallite size of cellulose microfibers, resulting in 33 Å. Crystallite sizes are smaller than viscose fibers (35–38 Å) and somewhat lower than Lyocell fibers (35 Å) [64,75]. This suggests that removing PAN from composite fibers does not significantly affect the crystallite size. Bacterial cellulose typically has crystallites of 65 Å, nearly twice the size of microfibers [76]. According to [77], randomly oriented crystallites with a square cross-section would have similar peak intensities in the region 2θ~14.5°, ~16.6° (cellulose I), and 2θ~12.1°, ~20.1° (cellulose II). With a greater intensity of one of the peaks, the cross-sectional shape will change to a rectangular shape. Comparing the peak intensities in the diffraction patterns, it can be assumed that for bacterial cellulose the crystallites will have a rectangular shape with a larger side difference compared to microfibers.

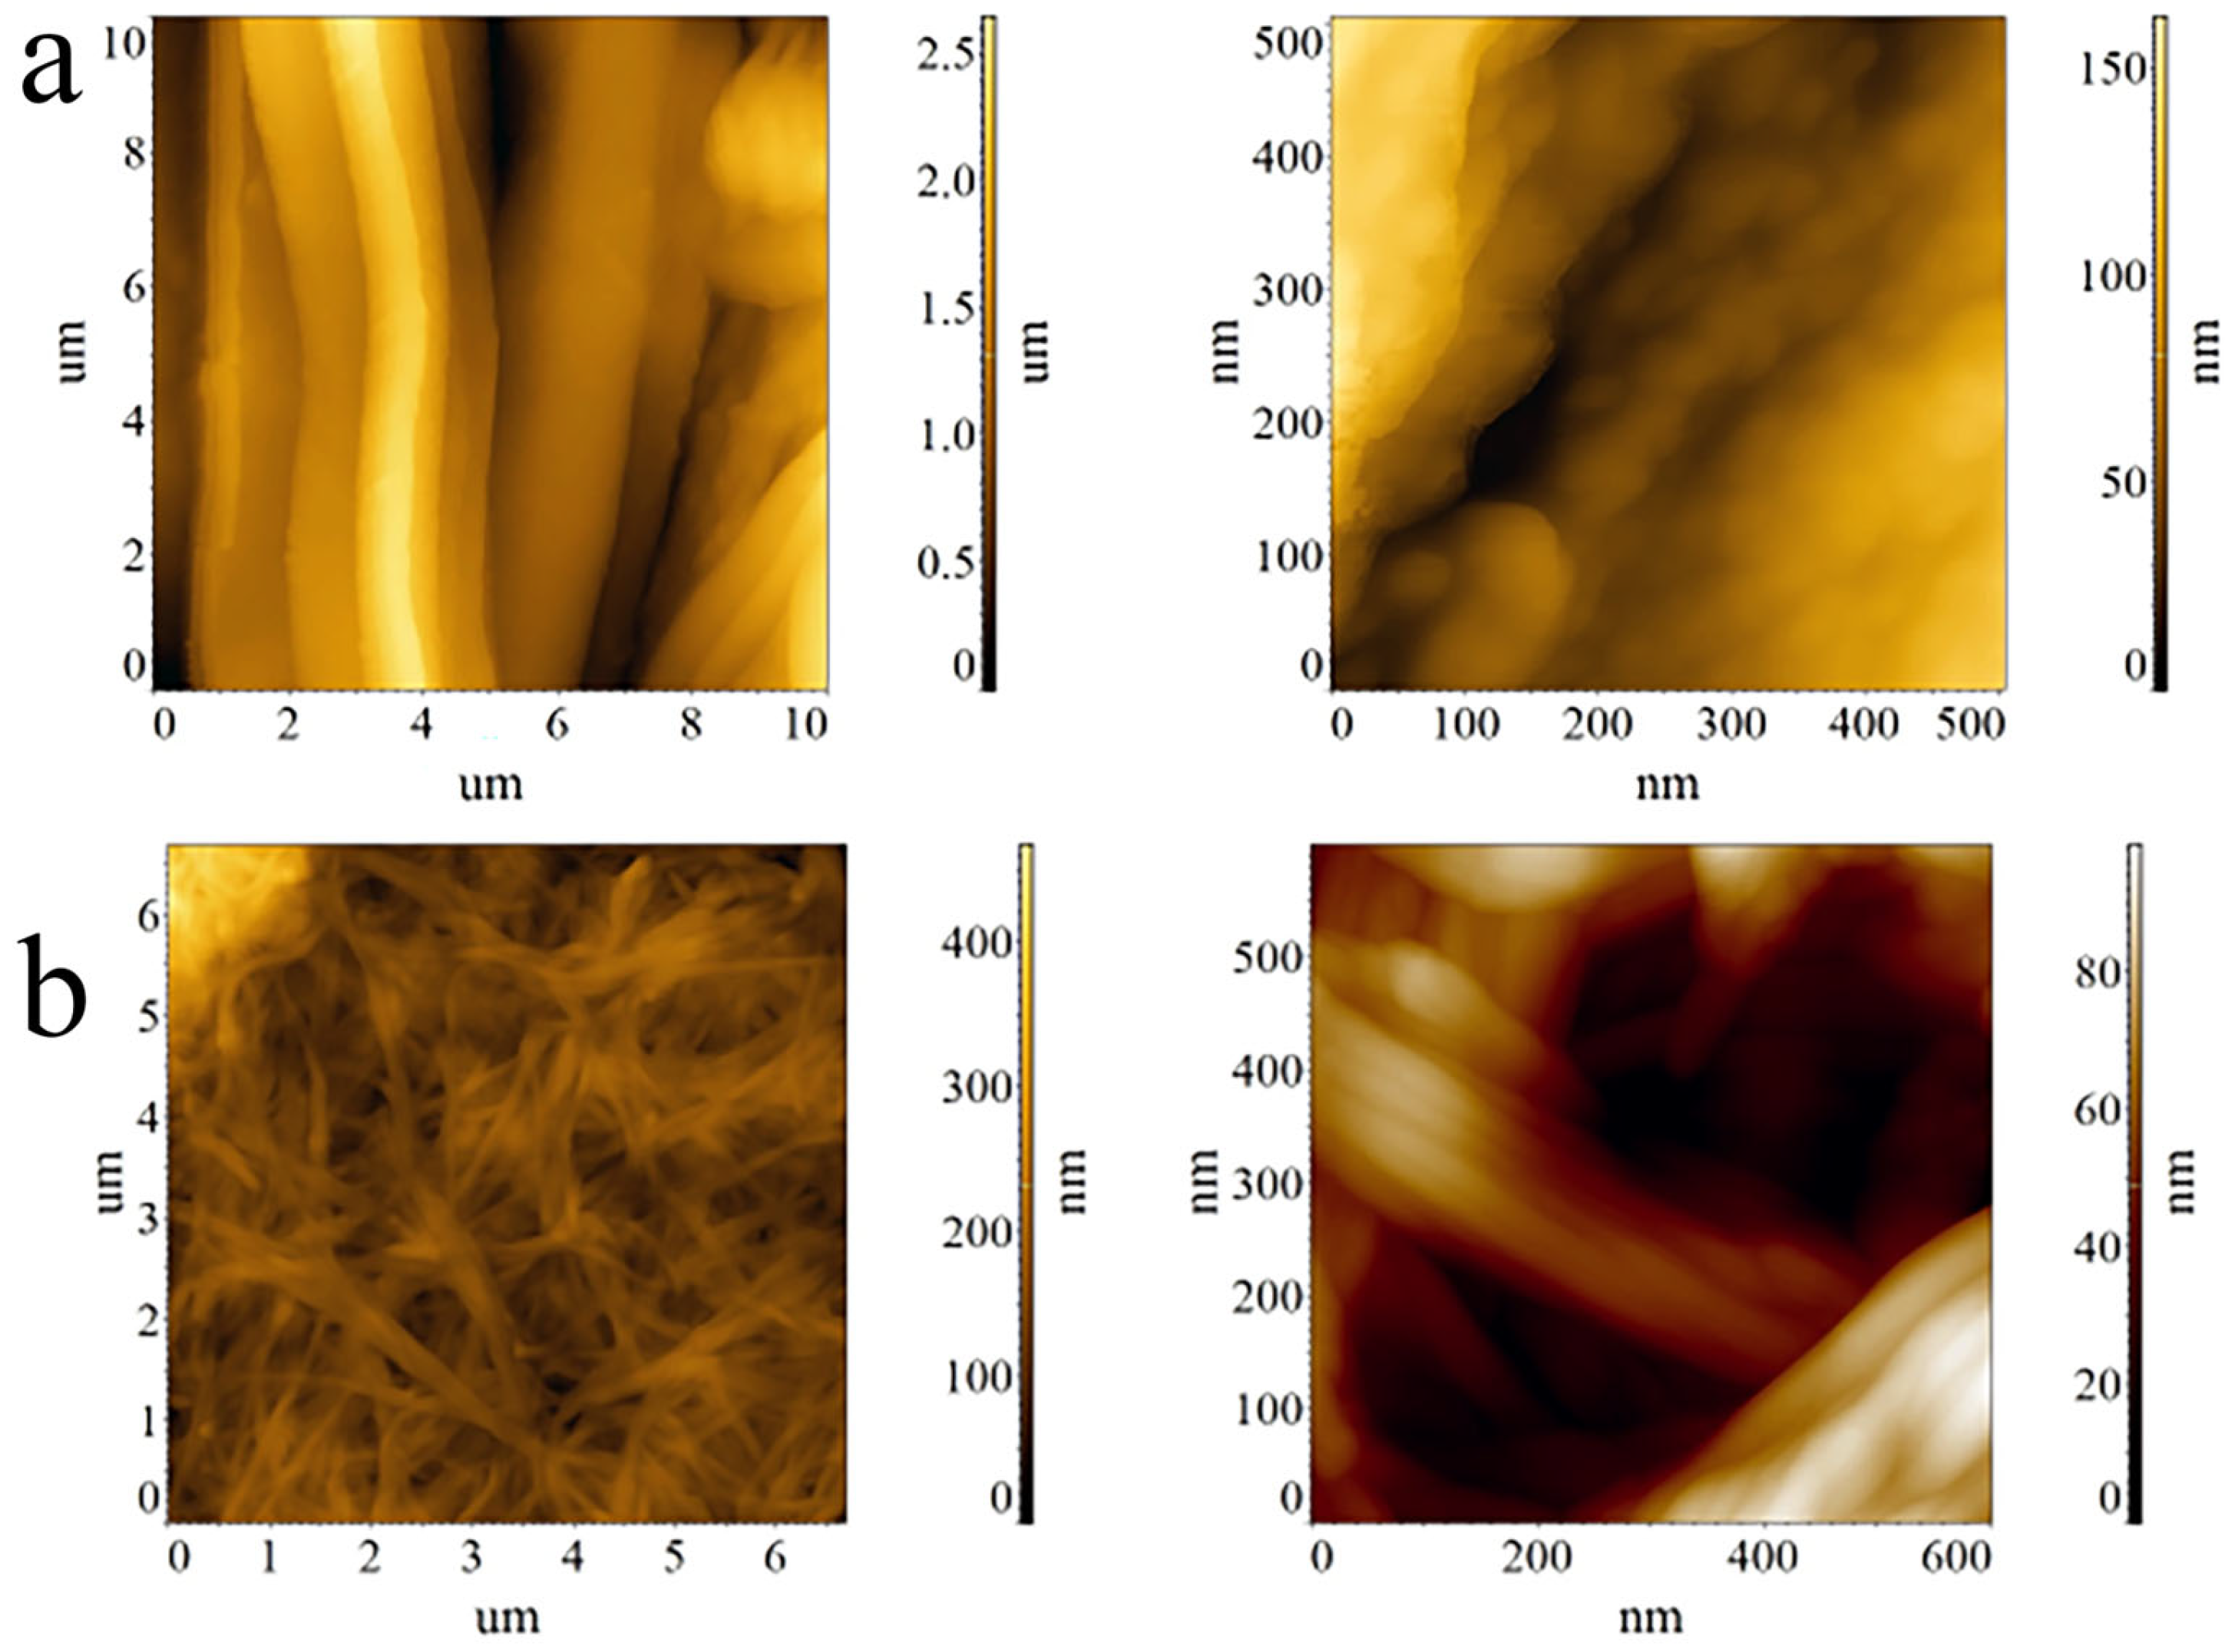
3.5. AFM Investigations of Cellulose Microfibers and Bacterial Cellulose

In contrast to optical and scanning microscopy, the use of atomic force microscopy (AFM) allows one to overcome a number of limits placed on the study of microfiber morphology while still obtaining information about the mechanical characteristics of the material being studied. Figure 6 shows topographic maps of cellulose microfibers.
The first comparison of topographic maps for microfibers and bacterial cellulose indicates a basic difference: bacterial cellulose is represented by a network that cannot be identified as preferentially oriented. Microfibers, on the other hand, are orientated in a single direction that corresponds to the direction of composite fiber formation (fiber axis). Bacterial cellulose tapes have a much smaller diameter than microfibers, for which the thickness reaches 1–2 microns. The high form-factor of microfibers and tapes stands out among the maps shown. Higher magnifications reveal differences in cellulose’s supramolecular architecture. Microfiber surfaces are rough at the nanoscale, whereas bacterial cellulose surfaces are smoother.
As can be seen from the topographic maps, individual microfibrils with of bacterial cellulose with average diameters up to 20 nm are not observed. Microfibrils elongated along ribbons represent bacterial cellulose, while microfibers have a granular (round) shape (size of around 50–100 nm) morphology. The observed variation in supramolecular structure might be explained by the conditions of bacterial cellulose production, as well as the formation and release of microfibers from composite fibers during selective dissolution.

4. Conclusions

For the first time, the structure and morphology of the cellulose phase obtained by dry-jet wet spinning of PAN/cellulose solutions followed by the selective removal of the synthetic polymer matrix was studied using IR spectroscopy, XRD, SEM, AFM, and optical microscopy. The cellulose phase comprises microfibers with a diameter of up to 2 μm (a considerable number of submicron-sized fibers are detected), and their length is expected to be indefinite when selecting spinning conditions. In the future, changing the spinning conditions and the ratio of co-components may allow us to achieve not only smaller diameters of microfibers, but also a narrower size distribution (uniformity). SEM and AFM methods can be used to study the cross-sections of the fibers obtained. A large number of submicron microfibers assures a developed microfiber surface as well as the availability of cellulose hydroxy groups, both of which contribute to high moisture retention, which is desirable in medical material manufacture. Despite the co-precipitation of cellulose and PAN phases, which would seem to lead to deposition under softer conditions, the structure of the resulting cellulose microfibers is similar to Lyocell fibers. Thus, scanning microscopy results show that the surface morphology of microfibers is dense and nearly homogenous, with no delamination, major fluctuations in thickness along the fibers, inclusions, cracks, chips, or other forms of defects. Atomic force microscopy, on the other hand, reveals a more complicated morphology: microfibers consist of globules of comparable microfibrils that are 100 nm or longer and an order of magnitude thinner. A comparison of the degree of crystallinity and crystallite sizes, assessed using various methods revealed that for microfibers, the obtained values are close to the parameters of Lyocell fibers, while being significantly inferior to the values for bacterial cellulose, both in crystallinity by tens of percent and in crystallite size by half. Thus, despite the unique conditions for cellulose microfibril coagulation, their structure is identical to hydrated cellulose fibers, confirming the concept proposed concerning the structural organization of microfibers.

Author Contributions

Conceptualization, I.M., E.P. and M.V.; methodology, I.M., E.P. and M.V.; validation, I.M., E.P., M.V., Y.G., S.L., P.G. and N.A.; formal analysis, I.M., E.P., M.V., N.A., Y.G., S.L., P.G., G.M., D.K. and R.G.; investigation, E.P., M.V., N.A., I.M., S.L., P.G., G.M., D.K. and R.G.; resources, E.P. and M.V.; data curation, I.M.; writing—original draft preparation, I.M.; writing—review and editing, I.M., E.P., M.V., Y.G., S.L., P.G. and N.A.; visualization, E.P. and M.V.; supervision, I.M. All authors have read and agreed to the published version of the manuscript.

Funding

The work was carried out at the expense of the Russian Science Foundation grant No. 20-19-00194, https://rscf.ru/project/20-19-00194/, accessed on 10 December 2024, within the State Program of TIPS RAS and within the framework of the State assignment of the National Research Center “Kurchatov Institute” in terms of conducting structural research.

Institutional Review Board Statement

Not applicable.

Data Availability Statement

The data used to support the findings of this study are included within the article.

Conflicts of Interest

The authors declare no conflicts of interest.

References

  1. Aleshina, L.A.; Mikhailina, A.A.; Lugovskaya, L.A. Structure of the coniferous bleached cellulose in the different states. For. Bull. 2015, 2, 107–114. Available online: https://rucont.ru/efd/416762 (accessed on 10 December 2024).
  2. Gibb, B.C. The centenary (maybe) of the hydrogen bond. Nat. Chem. 2020, 12, 665–667. [Google Scholar] [CrossRef] [PubMed]
  3. Pauling, L. The Nature of the Chemical Bond; Cornell University Press: Ithaca, NY, USA, 1960; p. 644. [Google Scholar]
  4. Wohlert, M.; Benselfelt, T.; Wågberg, L.; Furó, I.; Berglund, L.A.; Wohlert, J. Cellulose and the role of hydrogen bonds: Not in charge of everything. Cellulose 2022, 29, 1–23. [Google Scholar] [CrossRef]
  5. Liyanage, S.; Acharya, S.; Parajuli, P.; Shamshina, J.L.; Abidi, N. Production and Surface Modification of Cellulose Bioproducts. Polymers 2021, 13, 3433. [Google Scholar] [CrossRef]
  6. Jeffrey, G.A.; Saenger, W. Hydrogen Bonding in Biological Structures; Springer: Berlin/Heidelberg, Germany, 1994; p. 569. [Google Scholar] [CrossRef]
  7. Baskakov, S.A.; Baskakova, Y.V.; Kabachkov, E.N.; Kichigina, G.A.; Kushch, P.P.; Kiryukhin, D.P.; Krasnikova, S.S.; Badamshina, E.R.; Vasil’ev, S.G.; Soldatenkov, T.A.; et al. Cellulose from Annual Plants and Its Use for the Production of the Films Hydrophobized with Tetrafluoroethylene Telomers. Molecules 2022, 27, 6002. [Google Scholar] [CrossRef]
  8. Makarov, I.S.; Golova, L.K.; Vinogradov, M.I.; Egorov, Y.E.; Kulichikhin, V.G.; Mikhailov, Y.M. New Hydrated Cellulose Fiber Based on Flax Cellulose. Russ. J. Gen. Chem. 2021, 91, 1807–1815. [Google Scholar] [CrossRef]
  9. Tarchevsky, J.A.; Marchenko, G.N. Cellulose: Biosynthesis and Structure; Springer: Berlin/Heidelberg, Germany, 1991; p. 322. [Google Scholar] [CrossRef]
  10. Korchagina, A.A.; Gismatulina, Y.A.; Budaeva, V.V.; Zolotukhin, V.N.; Bychin, N.V.; Sakovich, G.V. Miscanthus × Giganteus var. KAMIS as a new feedstock for cellulose nitrates. J. Sib. Fed. Univ. Chem. 2020, 13, 565–577. [Google Scholar] [CrossRef]
  11. Makarov, I.S.; Golova, L.K.; Vinogradov, M.I.; Levin, I.S.; Gromovykh, T.I.; Arkharova, N.A.; Kulichikhin, V.G. Cellulose Fibers from Solutions of Bacterial Cellulose in N-Methylmorpholine N-Oxide. Fibre Chem. 2019, 51, 175–181. [Google Scholar] [CrossRef]
  12. Miri, M.; Ghasemian, A.; Resalati, H.; Zeinaly, F. Total chlorine-free bleaching of Populus deltoides kraft pulp by oxone. Int. J. Carbohydr. Chem. 2015, 2015, 381242. [Google Scholar] [CrossRef]
  13. Gromovykh, T.I.; Feldman, N.B.; Tikhonova, O.A.; Lutsenko, S.V.; Timashev, P.S.; Bardakova, K.N.; Churbanov, S.N.; Kiselyova, O.I.; Kraeva, M.N.; Grinevich, A.S. Elaboration of a bacterial cellulose matrix for the immobilisation of Escherichia coli cell. Int. J. Nanotechnol. 2018, 15, 288–300. [Google Scholar] [CrossRef]
  14. Colvin, J.R. The size of the cellulose microfibril. JCB 1963, 17, 105–109. [Google Scholar] [CrossRef] [PubMed]
  15. Song, B.; Zhao, S.; Shen, W.; Collings, C.; Ding, S.-Y. Direct Measurement of Plant Cellulose Microfibril and Bundles in Native Cell Walls. Front. Plant Sci. 2020, 11, 479. [Google Scholar] [CrossRef] [PubMed]
  16. Newman, R.H.; Hill, S.J.; Harris, P.J. Wide-angle x-ray scattering and solid-state nuclear magnetic resonance data combined to test models for cellulose microfibrils in mung bean cell walls. Plant Physiol. 2013, 163, 1558–1567. [Google Scholar] [CrossRef] [PubMed]
  17. Wang, T.; Hong, M. Solid-state NMR investigations of cellulose structure and interactions with matrix polysaccharides in plant primary cell walls. J. Exp. Bot. 2016, 67, 503–514. [Google Scholar] [CrossRef]
  18. Ioelovich, M. Nanostructured cellulose: Review. BioRes 2008, 3, 1403–1418. [Google Scholar] [CrossRef]
  19. Fink, H.P.; Purz, H.; Bohn, A.; Kunze, J. Structural investigations of bacterial cellulose. Macromol. Symp. 1997, 120, 207–217. [Google Scholar] [CrossRef]
  20. Nicolas, W.J.; Ghosal, D.; Tocheva, E.I.; Meyerowitz, E.M.; Jensen, G.J. Structure of the Bacterial Cellulose Ribbon and Its Assembly-Guiding Cytoskeleton by Electron Cryotomography. J. Bacteriol. 2021, 203, e00371-20. [Google Scholar] [CrossRef]
  21. Park, S.; Baker, J.-O.; Himmel, M.-E.; Parilla, P.-A.; Johnson, D.-K. Cellulose crystallinity index: Measurement techniques and their impact on interpreting cellulose performance. Biotechnol. Biofuels 2010, 3, 10. [Google Scholar] [CrossRef]
  22. Frone, A.N.; Chiulan, I.; Panaitescu, D.M.; Nicolae, C.A.; Ghiurea, M.; Galan, A.-M. Isolation of cellulose nanocrystals from plum seed shells, structural and morphological characterization. Mater. Lett. 2017, 194, 160–163. [Google Scholar] [CrossRef]
  23. Trache, D.; Tarchoun, A.F.; Derradji, M.; Hamidon, T.S.; Masruchin, N.; Brosse, N.; Hussin, M.H. Nanocellulose: From Fundamentals to Advanced Applications. Front. Chem. 2020, 8, 392. [Google Scholar] [CrossRef]
  24. Mao, J.; Abushammala, H.; Brown, N.; Laborie, M.-P. Comparative Assessment of Methods for Producing Cellulose I Nanocrystals from Cellulosic Sources. ACS Symp. Ser. 2017, 1251, 19–53. [Google Scholar] [CrossRef]
  25. Lavoine, N.; Desloges, I.; Dufresne, A.; Bras, J. Microfibrillated cellulose—Its barrier properties and applications in cellulosic materials: A review. Carbohydr. Polym. 2012, 90, 735–764. [Google Scholar] [CrossRef] [PubMed]
  26. da Silva Maradini, G.; Oliveira, M.P.; da Silva Guanaes, G.M.; Passamani, G.Z.; Carreira, L.G.; Boschetti, W.T.; Monteiro, S.N.; Pereira, A.C.; de Oliveira, B.F. Characterization of Polyester Nanocomposites Reinforced with Conifer Fiber Cellulose Nanocrystals. Polymers 2020, 12, 2838. [Google Scholar] [CrossRef] [PubMed]
  27. Feng, K.; Dong, C.; Gao, Y.; Jin, Z. A Green and Iridescent Composite of Cellulose Nanocrystals with Wide Solvent Resistance and Strong Mechanical Properties. ACS Sustain. Chem. Eng. 2021, 9, 6764–6775. [Google Scholar] [CrossRef]
  28. Taheri, H.; Mastali, M.; Falah, M.; Abdollahnejad, Z.; Ghiassi, B.; Perrot, A.; Kawashima, S. Microfibrillated cellulose as a new approach to develop lightweight cementitious composites: Rheological, Mechanical, and microstructure perspectives. CBM 2022, 342, 128008. [Google Scholar] [CrossRef]
  29. Ul-Islam, M.; Khan, S.; Ullah, M.W.; Park, J.K. Bacterial cellulose composites: Synthetic strategies and multiple applications in bio-medical and electro-conductive fields. Biotechnol. J. 2015, 10, 1847–1861. [Google Scholar] [CrossRef]
  30. Cheng, Q.; Wang, S.; Han, Q. Novel process for isolating fibrils from cellulose fibers by high-intensity ultrasonication. II. Fibril characterization. J. Appl. Polym. Sci. 2010, 115, 2756–2762. [Google Scholar] [CrossRef]
  31. Lahiji, R.R.; Xu, X.; Reifenberger, R.; Raman, A.; Rudie, A.; Moon, R.J. Atomic Force Microscopy Characterization of Cellulose Nanocrystals. Langmuir 2010, 26, 4480–4488. [Google Scholar] [CrossRef]
  32. Parvej, M.S.; Wang, X.; Jiang, L. AFM based nanomechanical characterization of cellulose nanofibril. J. Compos. Mater. 2020, 54, 1–7. [Google Scholar] [CrossRef]
  33. Vinogradov, M.I.; Golova, L.K.; Makarov, I.S.; Bondarenko, G.N.; Levin, I.S.; Arkharova, N.A.; Kulichikhin, V.G. Transformation of Specific Dispersion Interactions between Cellulose and Polyacrylonitrile in Solutions into Covalent Interactions in Fibers. Materials 2023, 16, 5843. [Google Scholar] [CrossRef]
  34. Golova, L.K.; Borodina, O.E.; Kuznetsova, L.K.; Lyubova, T.A.; Krylova, T.B. The Solid-Phase MMO Process. Fibre Chem. 2000, 32, 243–251. [Google Scholar] [CrossRef]
  35. Meyer, K.H.; Lotmar, W. Sur l’élasticité de la cellulose. (Sur la constitution de la partie cristallisée de la cellulose IV). Helv. Chim. Acta 1936, 19, 68–86. [Google Scholar] [CrossRef]
  36. Diddens, I.; Murphy, B.; Krisch, M.; Muller, M. Anisotropic Elastic Properties of Cellulose Measured Using Inelastic X-ray Scattering. Macromolecules 2008, 41, 9755. [Google Scholar] [CrossRef]
  37. Hellwig, J.; Durán, V.L.; Pettersson, T. Measuring elasticity of wet cellulose fibres with AFM using indentation and a linearized Hertz model. Anal. Methods 2018, 10, 3820–3823. [Google Scholar] [CrossRef]
  38. Eichhorn, S.; Young, R. The Young’s modulus of a microcrystalline cellulose. Cellulose 2001, 8, 197–207. [Google Scholar] [CrossRef]
  39. Cheng, Q.; Wang, S. A method for testing the elastic modulus of single cellulose fibrils via atomic force microscopy. Compos. A Appl. Sci. Manuf. 2008, 39, 1838–1843. [Google Scholar] [CrossRef]
  40. Kroon-Batenburg, L.M.J.; Kroon, J.; Northolt, M.G. Chain modulus and intramolecular hydrogen bonding in native and regenerated cellulose fibers. Polym. Commun. 1986, 27, 290–292. [Google Scholar]
  41. Moud, A.A. Cellulose Nanocrystals Examined by Atomic Force Microscopy: Applications and Fundamentals. ACS Food Sci. Technol. 2022, 2, 1789–1818. [Google Scholar] [CrossRef]
  42. Makarov, I.; Vinogradov, M.; Golubev, Y.; Palchikova, E.; Kulanchikov, Y.; Grishin, T. Development of Cellulose Microfibers from Mixed Solutions of PAN-Cellulose in N-Methylmorpholine-N-Oxide. Polymers 2024, 16, 1869. [Google Scholar] [CrossRef]
  43. Makarov, I.S.; Golova, L.K.; Kuznetsova, L.K.; Shlyakhtin, A.V.; Nifantiev, I.E.; Kulichikhin, V.G. Method for Preparing a Solution of Acrylonitrile-Based Copolymer in n-Methylmorpholine-n-Oxide. RF Patent 2541473, 13 June 2013. [Google Scholar]
  44. Golova, L.K.; Romanov, V.V.; Lunina, O.B.; Platonov, V.A.; Papkov, S.P.; Khorozova, O.D.; Yakshin, V.V.; Belasheva, T.P.; Sokira, A.N. Method for Producing Solution for Spinning Fibers. RF Patent 1645308, 30 April 1991. [Google Scholar]
  45. Fink, H.P.; Hofmann, D.; Philipp, B. Some aspects of lateral chain order in cellulosics from X-ray scattering. Cellulose 1995, 2, 51–70. [Google Scholar] [CrossRef]
  46. Segal, L.; Creely, J.J.; Martin, A.E.; Conrad, C.M. An Empirical Method for Estimating the Degree of Crystallinity of Native Cellulose Using the X-Ray Diffractometer. Text. Res. J. 1959, 29, 786–794. [Google Scholar] [CrossRef]
  47. Scherrer, P. Bestimmung der Größe und der inneren Struktur von Kolloidteilchen mittels Röntgenstrahlen. Nachr. Ges. Wiss. Gottingen Math.-Phys. Kl. 1918, 1918, 98–100. Available online: http://eudml.org/doc/59018 (accessed on 10 December 2024).
  48. Pogorelova, N.A.; Chernigova, S.V.; Rogachev, E.A. Morphological features of the structure of bacterial cellulose and nanocomposites based on it for the manufacture of modern wound dressings. Vestnik Omskogo GAU 2019, 4, 131–141. [Google Scholar]
  49. Pavlov, I.N.; Kuznetsov, P.S.; Shilov, A.I. Study of the process of freeze drying of bacterial nanocellulose. Polzunovsky Vestn. 2020, 4, 88–94. [Google Scholar] [CrossRef]
  50. Bolgova, A.L.; Shevtsov, A.V.; Arkharova, N.A.; Karimov, D.N.; Makarov, I.S.; Gromovykh, T.I.; Klechkovskaya, V.V. Microstructure of Gel Films of Bacterial Cellulose Synthesized under Static Conditions of Cultivation of the Gluconacetobacter hansenii GH-1/2008 Strain on Nutrient Media with Different Carbon Sources. Crystallogr. Rep. 2023, 68, 607–614. [Google Scholar] [CrossRef]
  51. Choi, S.M.; Shin, E.J. The Nanofication and Functionalization of Bacterial Cellulose and Its Applications. Nanomaterials 2020, 10, 406. [Google Scholar] [CrossRef]
  52. Skvortsova, Z.N.; Gromovykh, T.I.; Grachev, V.S.; Traskin, V.Y. Physicochemical Mechanics of Bacterial Cellulose. Colloid. J. 2019, 81, 366–376. [Google Scholar] [CrossRef]
  53. Watanabe, K.; Tabuchi, M.; Morinaga, Y.; Yoshinaga, F. Structural Features and Properties of Bacterial Cellulose Produced in Agitated Culture. Cellulose 1998, 5, 187. [Google Scholar] [CrossRef]
  54. Czaja, W.; Romanovicz, D.; Brown, R.M. Structural investigations of microbial cellulose produced in stationary and agitated culture. Cellulose 2004, 11, 3. [Google Scholar] [CrossRef]
  55. Nelson, M.L.; O’Connor, R.T. Relation of Certain Infrared Bands to Cellulose Crystallinity and Crystal Lattice Type. Part II. A New Infrared Ratio for Estimation of Crystallinity in Celluloses I and II. J. Appl. Polym. Sci. 1964, 8, 1325–1341. [Google Scholar] [CrossRef]
  56. Bazarnova, N.G.; Karpova, E.V.; Katrakov, I.B.; Markin, V.I.; Mikushina, I.V.; Ol’khov, Y.A.; Khudenko, S.V. Methods for the study of wood and its derivatives. Benefit. Baranul. Alt. State Univ. 2002, 160. [Google Scholar]
  57. Kadimaliev, D.; Kezina, E.; Telyatnik, V.; Revin, V.; Parchaykina, O.; Syusin, I. Residual Brewer’s yeast biomass and bacterial cellulose as an alternative to toxic phenol-formaldehyde binders in production of pressed materials from waste wood. BioRes 2015, 10, 1644–1656. [Google Scholar] [CrossRef]
  58. Ivanova, N.V. Mathematical processing of the IR spectrum of cellulose. J. Appl. Spectrosc. 1989, 51, 301–306. [Google Scholar] [CrossRef]
  59. Carrillo, F.; Colom, X.; Sunol, J.J.; Saurina, J. Structural FTIR analysis and thermal characterization of lyocell and viscose-type fibres. Eur. Polym. J. 2004, 40, 2229–2234. [Google Scholar] [CrossRef]
  60. Nelson, M.L.; O’Connor, R.T. Relation of certain infrared bands to cellulose crystallinity and crystal lattice type. Part I. Spectra of lattice types I, II, III and amorphous cellulose. J. Appl. Polym. Sci. 1964, 8, 1311–1324. [Google Scholar] [CrossRef]
  61. Oh, S.Y.; Yoo, D.I.; Shin, Y.; Seo, G. FTIR analysis of cellulose treated with sodium hydroxide and carbon dioxide. Carbohydr. Res. 2005, 340, 417–428. [Google Scholar] [CrossRef]
  62. Nada, A.-A.M.A.; Kamel, S.; El-Sakhawy, M. Thermal behaviour and infrared spectroscopy of cellulose carbamates. Polym. Degrad. Stab. 2000, 70, 347–355. [Google Scholar] [CrossRef]
  63. Kulichikhin, V.; Golova, L.; Makarov, I.; Bondarenko, G.; Makarova, V.; Ilyin, S.; Skvortsov, I.; Berkovich, A. Solutions of acrylonitrile copolymers in N-methylmorpholine-Noxide: Structure, properties, fiber spinning. Eur. Polym. J. 2017, 92, 326–337. [Google Scholar] [CrossRef]
  64. Makarov, I.S.; Smyslov, A.G.; Palchikova, E.E.; Vinogradov, M.I.; Shandryuk, G.A.; Levin, I.S.; Arkharova, N.A.; Kulichikhin, V.G. Nonwoven materials based on natural and artificial fibers. Cellulose 2024, 31, 1927–1940. [Google Scholar] [CrossRef]
  65. Lee, C.M.; Gu, J.; Kafle, K.; Catchmark, J.; Kim, S.H. Cellulose produced by Gluconacetobacter xylinus strains ATCC 53524 and ATCC 23768: Pellicle formation, post-synthesis aggregation and fiber density. Carbohydr. Polym. 2015, 133, 270–276. [Google Scholar] [CrossRef]
  66. Wada, M.; Okano, T.; Sugiyama, J. Allomorphs of native crystalline cellulose I evaluated by two equatoriald-spacings. J. Wood Sci. 2001, 47, 124–128. [Google Scholar] [CrossRef]
  67. Kaplan, D.L. Biopolymers from Renewable Resources; Springer: Berlin/Heidelberg, Germany, 1998; p. 420. [Google Scholar] [CrossRef]
  68. Azubuike, C.P.; Rodríguez, H.; Okhamafe, A.O.; Rogers, R.D. Physicochemical properties of maize cob cellulose powders reconstituted from ionic liquid solution. Cellulose 2012, 19, 425–433. [Google Scholar] [CrossRef]
  69. Salem, K.S.; Kasera, N.K.; Rahman, M.A.; Jameel, H.; Habibi, Y.; Eichhorn, S.J.; French, A.D.; Pal, L.; Lucia, L.A. Comparison and assessment of methods for cellulose crystallinity determination. Chem. Soc. Rev. 2023, 52, 6417–6446. [Google Scholar] [CrossRef] [PubMed]
  70. Kreze, T.; Strnad, S.; Stana-Kleinschek, K.; Ribitsch, V. Influence of aqueous medium on mechanical properties of conventional and new environmentally friendly regenerated cellulose fibers. Mater. Res. Innov. 2001, 4, 107–114. [Google Scholar] [CrossRef]
  71. Sakurada, I.; Nukushina, Y.; Ito, T. Experimental determination of the elastic modulus of crystalline regions of oriented polymers. J. Polym. Sci. 1962, 57, 651–660. [Google Scholar] [CrossRef]
  72. Young, R.J.; Lovell, P.A. Introduction to Polymers, 2nd ed.; Chapman & Hall: London, UK, 1991; p. 443. [Google Scholar] [CrossRef]
  73. Chen, P.; Ogawa, Y.; Nishiyama, Y.; Ismail, A.E.; Mazeau, K. Linear, Non-Linear and Plastic Bending Deformation of Cellulose Nanocrystals. Phys. Chem. Chem. Phys. 2016, 18, 19880–19887. [Google Scholar] [CrossRef]
  74. Ganster, J.; Fink, H.-P.; Fraatz, J.; Nywlt, M. Relation between structure and elastic constants of man-made cellulosic fibres: I. a two phase anisotropic model with contiguity parameter. Acta Polymer. 1994, 45, 312–318. [Google Scholar] [CrossRef]
  75. Jiang, G.; Huang, W.; Li, L.; Wang, X.; Pang, F.; Zhang, Y.; Wang, H. Structure and properties of regenerated cellulose fibers from different technology processes. Carbohydr. Polym. 2012, 87, 2012–2018. [Google Scholar] [CrossRef]
  76. Tsouko, E.; Kourmentza, C.; Ladakis, D.; Kopsahelis, N.; Mandala, I.; Papanikolaou, S.; Paloukis, F.; Alves, V.; Koutinas, A. Bacterial Cellulose Production from Industrial Waste and by-Product Streams. Int. J. Mol. Sci. 2015, 16, 14832–14849. [Google Scholar] [CrossRef]
  77. French, A.D.; Cintrón, M.S. Cellulose polymorphy, crystallite size, and the segal crystallinity index. Cellulose 2013, 20, 583–588. [Google Scholar] [CrossRef]
Figure 1. Photograph of 70% PAN-30% cellulose fiber washed from NMMO (a) and photograph of isolated cellulose microfiber skein (b).
Polysaccharides 06 00010 g001
Figure 2. Photographs of cellulose fibers in transmitted light (a) and crossed polaroids (b).
Polysaccharides 06 00010 g002
Figure 3. SEM images of cellulose microfibers (ac) and bacterial cellulose (df). The bunch of parallel microfibers and separate microfiber are marked with arrows (b).
Polysaccharides 06 00010 g003
Figure 4. IR spectra of Lyocell fibers (a), composite fibers (70% PAN-30% cellulose) (b), microfibers (c), bacterial cellulose (d), and PAN (e).
Polysaccharides 06 00010 g004
Figure 5. Diffraction patterns of PAN powder (a), bacterial cellulose (b), and isolated microfibers (c).
Polysaccharides 06 00010 g005
Figure 6. Topographic map of cellulose microfibers (a) and bacterial cellulose (b).
Polysaccharides 06 00010 g006
Disclaimer/Publisher’s Note: The statements, opinions and data contained in all publications are solely those of the individual author(s) and contributor(s) and not of MDPI and/or the editor(s). MDPI and/or the editor(s) disclaim responsibility for any injury to people or property resulting from any ideas, methods, instructions or products referred to in the content.

