Article

Effects of Ethanol Feeding in Early-Stage NAFLD Mice Induced by Western Diet

1
Department of Internal Medicine I, University Clinic, 53127 Bonn, Germany
2
Translational Hepatology, Department of Internal Medicine I, University Clinic Frankfurt, 60590 Frankfurt, Germany
3
Center of Basic Research, Biomedical Research Foundation of the Academy of Athens (BRFAA), 11527 Athens, Greece
4
Department of Gastroenterology and Hepatology, Sdr. Boulevard 29, 5000 Odense C, Denmark
5
Institute of Clinical Research, Faculty of Health Sciences, University of Southern Denmark, Winsløwparken 19, 5000 Odense C, Denmark
6
Department of Pathology, Odense University Hospital, J. B. Winsløws Vej 15, 5000 Odense, Denmark
7
European Foundation for the Study of Chronic Liver Failure-EF Clif, 08021 Barcelona, Spain
*
Author to whom correspondence should be addressed.
Livers 2021, 1(1), 27-39; https://doi.org/10.3390/livers1010003
Submission received: 29 December 2020 / Revised: 15 February 2021 / Accepted: 18 February 2021 / Published: 21 February 2021
(This article belongs to the Special Issue Hepatic Fibrosis: From Pathogenesis to Clinical Management)

Abstract

:
Background: The prevalence of metabolic liver diseases is increasing and approved pharmacological treatments are still missing. Many animal models of nonalcoholic fatty liver disease (NAFLD) show a full spectrum of fibrosis, inflammation and steatosis, which does not reflect the human situation since only up to one third of the patients develop fibrosis and nonalcoholic steatohepatitis (NASH). Methods: Seven week old C57Bl/J mice were treated with ethanol, Western diet (WD) or both. The animals’ liver phenotypes were determined through histology, immunohistochemistry, Western blotting, hepatic triglyceride content and gene expression levels. In a human cohort of 80 patients stratified by current alcohol misuse and body mass index, liver histology and gene expression analysis were performed. Results: WD diet and ethanol-treated animals showed severe steatosis, with high hepatic triglyceride content and upregulation of fatty acid synthesis. Mild fibrosis was revealed using Sirius-red stains and gene expression levels of collagen. Inflammation was detected using histology, immunohistochemistry and upregulation of proinflammatory genes. The human cohort of obese drinkers showed similar upregulation in genes related to steatosis, fibrosis and inflammation. Conclusions: We provide a novel murine model for early-stage fatty liver disease suitable for drug testing and investigation of pathophysiology.

1. Introduction

Despite public health efforts, the prevalence of chronic liver diseases (CLD) is still increasing, causing an important health care burden, especially in Europe and the United States [1,2]. Importantly, the distribution of the etiology of CLD is changing: vaccines for hepatitis B virus are widely available and direct antiviral agents were introduced for chronic hepatitis C virus infections, leading to a decrease in their prevalence [1]. By contrast, metabolic liver diseases are increasing due to overnutrition and overuse of alcohol [1]. Concomitantly, prevalence of type 2 diabetes and obesity, both important risk factors in patients with CLD, are increasing [2].
Nonalcoholic fatty liver disease (NAFLD) covers a broad spectrum of severity from simple steatosis to nonalcoholic steatohepatitis (NASH) with or without fibrosis [3], and up to 30% of patients progress and develop significant liver fibrosis [4].
In many patients, alcohol consumption represents an important cofactor of the pathogenesis of CLD. This is especially relevant since alcohol is widely socially accepted and easy to access, especially in Europe [1,5]. Emerging evidence supports the fact that the strict separation of alcoholic and nonalcoholic liver disease is no longer justifiable, suggesting a novel entity of metabolic dysfunction-associated liver disease (MAFLD) [6]. Given these facts, there is an urgent need for preclinical models covering both a nutritive and alcoholic etiology with mild to moderate liver fibrosis for elucidating pathogenic mechanisms, screening for new therapeutic options and developing diagnostic tools in this new entity.
Recently, we established a carbon tetrachloride-based animal model of alcoholic liver disease (ALD), which develops significant fibrosis [7]. To better acknowledge concomitant alcoholic and metabolic liver disease, we want to investigate the role of ethanol in NAFLD mice. Therefore, we used the combination of ethanol administration with Western diet (WD) to induce early-stage NAFLD in wild-type mice within seven weeks. Moreover, we aimed to validate animal data in a human cohort of early-stage ALD.

2. Materials and Methods

2.1. Human Liver Samples

The patients participated in a prospectively conducted diagnostic study between April 2013 and June 2017 at Odense University Hospital, Region of Southern Denmark [8,9]. We selected 80 patients with liver histology and mRNA expression of profibrotic markers. The study was performed in accordance with the Declaration of Helsinki and approved by the ethics committee of the Region of Southern Denmark (ethical ID S-20120071, S-20160021). The inclusion criteria were self-reported past or present alcohol consumption above 36 grams per day for men, and 24 grams per day for women, for at least one year, and age 18 to 75 years. We excluded patients with decompensated liver disease, severe alcoholic hepatitis or liver disease of etiologies other than alcohol. We also excluded patients with cancer or severe comorbidity with an estimated survival below six months. We performed all baseline investigations on the same week, after participants signed the informed consent form. We conducted routine liver blood tests, measured weight and height, which is provided in Table 1.

2.2. Human Liver Histology

We performed a percutaneous liver biopsy with a 17-G Menghini suction needle, fixed it with formalin, embedded it in paraffin and stained it with Sirius-red, as reported previously [8]. We only included biopsies of adequate quality, defined as either containing regeneration noduli or with a length of >10 mm and including >5 portal tracts. One pathologist (SD) staged the biopsies for fibrosis according to Kleiner and also scored, according to the NAFLD activity score, for steatosis (0–3), lobular inflammation (0–3) and ballooning (0–2) [10]. Human histology data are provided in Table 1.

2.3. Animal Experimentation

Twelve-week old male wild-type (C57Bl6/J) mice were purchased from (Charles River Laboratories Research Model and Services Germany GmbH, Sulzfeld, Germany). In total, 38 mice in two different badges were used. The experiments were performed twice. Animals were provided a Western diet (WD) enriched in fat and cholesterol, or normal diet for seven weeks (Figure 1A). Diets and water were provided ad libitum (details on provided diets can be found in Supplementary Table S1). WD and normal diet-fed mice were randomized into subgroups of five individuals, whether to add 16% of ethanol to the drinking water or not. Mice were acclimatized to ethanol by stepwise increases of ethanol concentration during three weeks, providing 4, 8 and 16%, respectively. Mice were sacrificed after seven weeks of treatment and the cadavers’ bodies and livers were weighted. Age- and injury-matched controls were used in all experiments. Every experiment was performed in accordance with the German Animal-Protection Law and the Guidelines of the Animal Care facility at our University (Haus für experimentelle Therapie, Bonn, Germany), and approved by the North Rhine-Westphalian State Agency for Nature, Environment, and Consumer Protection (LANUV, Germany; File Reference LANUV NRW, 84-02.04.2015.A491).

2.4. Real-Time PCR

Quantitative polymerase chain reaction (qPCR) in animal tissue was performed as described previously [7]. In brief, total RNA was isolated with ReliaPrep™ RNA Miniprep Systems (Promega, Madison, WI, USA) from shock-frozen liver samples following the ReliaPrep™ RNA Cell Miniprep System protocol. cDNA was synthesized by ImProm-II Reverse Transcription System (Promega, Madison, WI, USA). Amplification by qPCR was performed on the 7300 Real-Time PCR System (Applied Biosystems, Foster City, CA, USA) using commercial TaqMan® gene expression assays by Applied Biosystems according to the manufacturer’s protocol. Each qPCR analysis included duplicate wells and appropriate control reactions. The expression of each gene of interest was calculated by the delta-delta Ct method according to Livak KJ and Schmittgen TD [11]. Gene amplification was normalized against 18s rRNA expression in each sample and expression gene levels are shown as relative expression units by comparing to the control group. The complete list of gene expression assays is shown in Supplementary Table S2. Total RNA from human tissue was isolated from liver biopsies embedded in Tissue-Tek® optimal cutting temperature (O.C.T.) compound (Sakura, Alphen aan den Rijn, The Netherlands) using peqGold TriFast (peqLab, VWR, Radnor, PA, USA) following the manufacturer’s instructions. RT-PCR reactions were performed with PrimeScript RT Reagent Kit with gDNA Eraser (Takara, Shimogyo-Ku, Japan). Gene-specific primers were designed for each gene using Primer3 software (Supplementary Table S3). Gene relative abundance was assessed by RT-PCR using KAPA SYBR Fast Master Mix (Kapa Biosystems, Basel, Switzerland) on a Roche (LC480) system. Again, the relative expression was calculated by the delta Ct (2−DCt) method [11]. All data were normalized to the 18S endogenous reference gene.

2.5. Hepatic Triglyceride Content

Hepatic triglyceride content was analyzed as described previously [12]. The amount was measured photometrically from homogenized snap-frozen liver samples using TG liquicolor mono kit (Human Diagnostics, Wiesbaden, Germany) according to the manufacturer’s instructions, as published elsewhere [13].

2.6. Western Blotting

Protein levels were analyzed by Western blot as previously described [7]. Snap-frozen liver tissues were homogenized and diluted. Their protein amounts were measured with the DC assay kit (Bio-Rad, Munich, Germany). Forty micrograms of protein specimen were subjected to SDS-PAGE under reducing conditions (10% gels) and proteins were blotted on nitrocellulose membranes. The membranes were blocked and incubated with primary antibodies against either srebp-1c (ab28481, Abcam, Cambridge, United Kingdom) or scd-1 (2794, Cell Signalling Technology, Danvers, MA, USA). Glyceraldehyde-3-phosphate dehydrogenase (GAPDH) served as an endogenous control (sc-47724, Santa Cruz Biotechnology, Santa Cruz, CA, USA). Finally, membranes were incubated with the corresponding secondary antibody, and blots were developed using enhanced chemiluminescence. Protein quantification was performed by ImageJ (V.1.51j8, NIH, Bethesda, MD, USA) and the results were corrected for GAPDH levels.

2.7. Histological Staining Methodology and Quantification

Oil red O staining. For detection of fat accumulation in the liver, 10 μm thick sections of liver samples embedded in O.C.T. compound were cut using a cryostat. Sections were dehydrated overnight, washed with 60% isopropyl alcohol and stained with Oil red O (3%) followed by counterstaining with hematoxylin, as described previously [13]. To detect collagen fibers, paraffin-embedded sections (2–3 μm) were treated with 0.1% Sirius-red F3B in saturated picric acid (Chroma, Münster, Germany), as described previously [13]. Paraffin-embedded sections (2–3 μm) were also stained with hematoxylin-eosin (H&E) for detection of cellular ballooning, as described previously. Immunohistochemical staining for F4/80 were performed in paraffin-embedded sections (2–3 μm). The sections were incubated with a rat-anti-F4/80 (clone BM8; BMA Dianova, Hamburg, Germany). Thereafter, biotinylated rabbit-antirat (Biozol, Eching, Germany) secondary antibodies were used respectively. Finally, sections were counterstained with hematoxylin. Histological stains were captured with a Nikon Digital Sight DS-Vi1 (Chiyoda, Tokyo, Japan). Oil red O and Sirius red staining and F4/80 immunohistochemistry were quantified via open source ImageJ software (V.1.51j8, NIH, Bethesda, MD, USA) using macros for automatized quantification and color detection. Macros are provided in Supplementary Materials 1–3 [14]. Quantification was expressed as percentage of positively stained area. A minimum of ten high power fields were captured for analysis.

2.8. Measurement of Serum Metabolites and Enzymes

Blood was collected immediately after animal sacrifice, centrifuged and serum was stored at −80 °C until analysis. Serum levels of alanine transaminase (ALT) were measured with the Reflotron Plus blood analysis system (Roche Diagnostics, Mannheim, Germany). Serum levels of triglycerides were analyzed with the TG liquicolor mono kit (Human Diagnostics, Wiesbaden, Germany), according to the manufacturer’s protocol.

2.9. Statistical Analysis

Statistical analyses were performed using Prism V.5.0 (GraphPad, San Diego, CA, USA) and SPSS V26 (IBM, Armonk, New York, NY, USA). Data were expressed as mean ± standard error of the mean, and comparisons between two groups were realized by nonparametric t-tests based on Mann-Whitney U calculation, unless otherwise specified. p-Values below 0.05 (*) were considered statistically significant.

3. Results

3.1. WD and Ethanol Feeding Led to Increase of Body and Liver Weight

Twelve week-old mice were treated for seven weeks either with ethanol or Western diet or a combination of both. After seven weeks of treatment, ethanol-fed mice did not change body weight (Table 2). WD feeding alone led to an increase of body weight, but ethanol as a cofactor decreased body weight compared to WD back to baseline (Table 2). Neither ethanol feeding nor WD feeding altered liver weight, but the combination of ethanol and WD led to a significant increase of liver weight (Table 2). Liver-to-body weight ratio was calculated, demonstrating that WD feeding led to a decreased liver-to-body weight ratio but, with ethanol as a cofactor, liver to-body weight ratio was significantly increased (Figure 1B). Briefly, ethanol did decrease liver and body weight but increased liver weight in WD-fed animals.

3.2. WD and Ethanol Feeding Led to An. Increase of Serum ALT, But No Change in Triglycerides

As serological disease markers, we analyzed serum levels of transaminases. For ALT, no change was observed if ethanol was fed alone. WD treatment led to a decrease of serum ALT in our animals. If ethanol and WD were administered concomitantly, we observed a significant increase in serum ALT, indicating hepatic damage in our mice (Figure 1C). For serum triglycerides, no differences were revealed in the serum, indicating that metabolic dysfunction was not induced within the experimental period, although an increasing trend can be identified in the combination group (Figure 1D).

3.3. WD and Ethanol Feeding Led to Significant Liver Steatosis Comparable to Humans

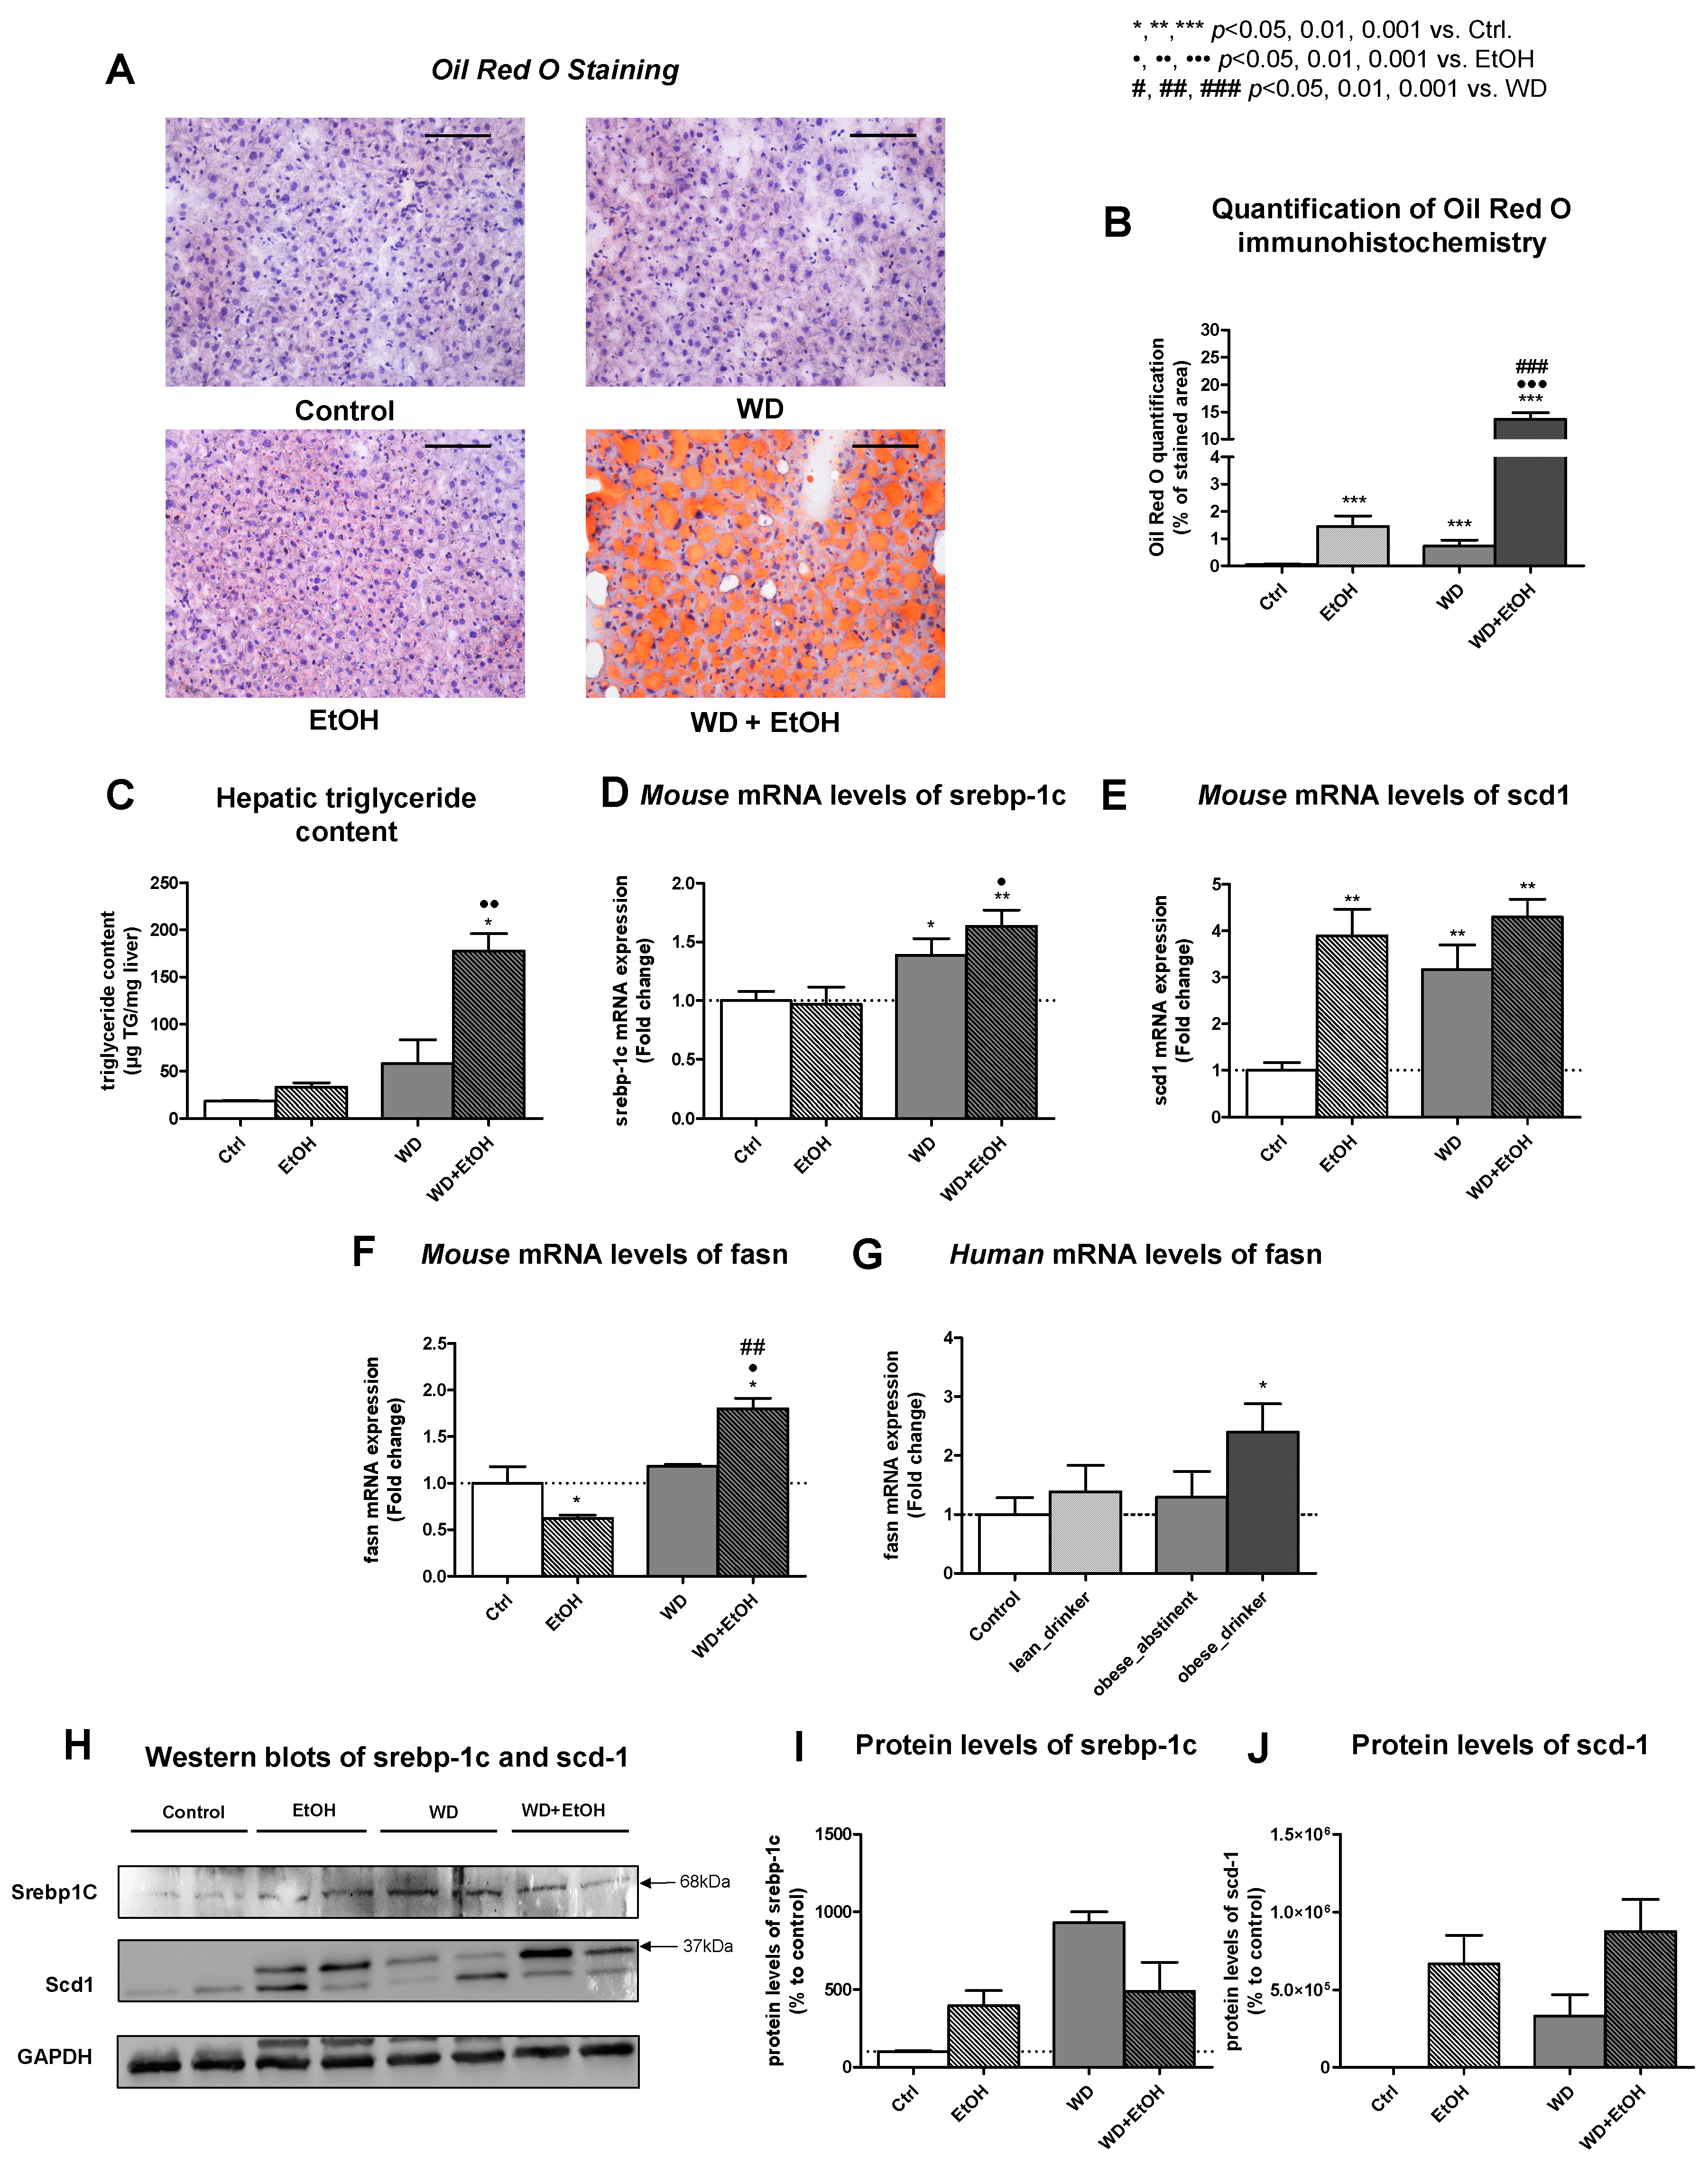
We then assessed steatosis through histological staining and biochemical measurement of hepatic triglycerides. Oil red O staining revealed that both ethanol and WD treatment alone only induced mild hepatic steatosis, but the combination of WD and ethanol led to severe macrovesicular steatosis (Figure 2A). This finding was confirmed through quantification of the positively stained area (Figure 2B). Measurement of triglycerides in mice livers revealed that the highest triglyceride levels were found in WD with ethanol-treated mice (Figure 2C). Treatment with either ethanol or WD alone led to no statistically significant increase of hepatic triglycerides (Figure 2C). Gene expression analysis of sterol regulatory element-binding protein 1 (srebp-1c) showed upregulation in the WD-fed group, but not if ethanol was fed alone. The highest expression levels were observed in the WD and ethanol group (Figure 2D). Interestingly, mRNA expression levels of stearoyl-CoA desaturase-1 (scd-1) showed an upregulation in all animals with the highest levels in animals fed with either ethanol or both ethanol and WD, indicating different mechanisms of steatosis development (Figure 2E). Gene expression analysis of fatty acid synthase (fasn) revealed a downregulation in ethanol-fed animals and no alteration in WD-fed animals (Figure 2F). The highest and most significantly increased gene expression levels of fasn were measured in WD and ethanol-fed mice (Figure 2F). Severe hepatic steatosis was induced in WD and ethanol-treated mice after seven weeks, whereas WD feeding and ethanol treatment only induced mild steatosis. This pattern was also observed in the human cohort. The group of lean drinker and obese abstinent patients showed less elevation of hepatic fasn levels, while patients in the obese drinker group did express significantly elevated levels (Figure 2G). Finally, we confirmed our findings from the gene expression analysis in mice through protein level analyses. In our Western blots of srebp-1c and scd-1, we confirmed the trends identified in the gene expression analysis (Figure 2H). We saw an upregulation for ethanol and ethanol with WD-fed mice. Highest protein levels were observed in the WD group (Figure 2I). For scd-1, we saw higher levels for ethanol-fed mice. Again, highest protein levels were identified in the ethanol + WD group (Figure 2J).

3.4. WD and Ethanol Feeding Promoted Fibrosis Similar to Human Disease

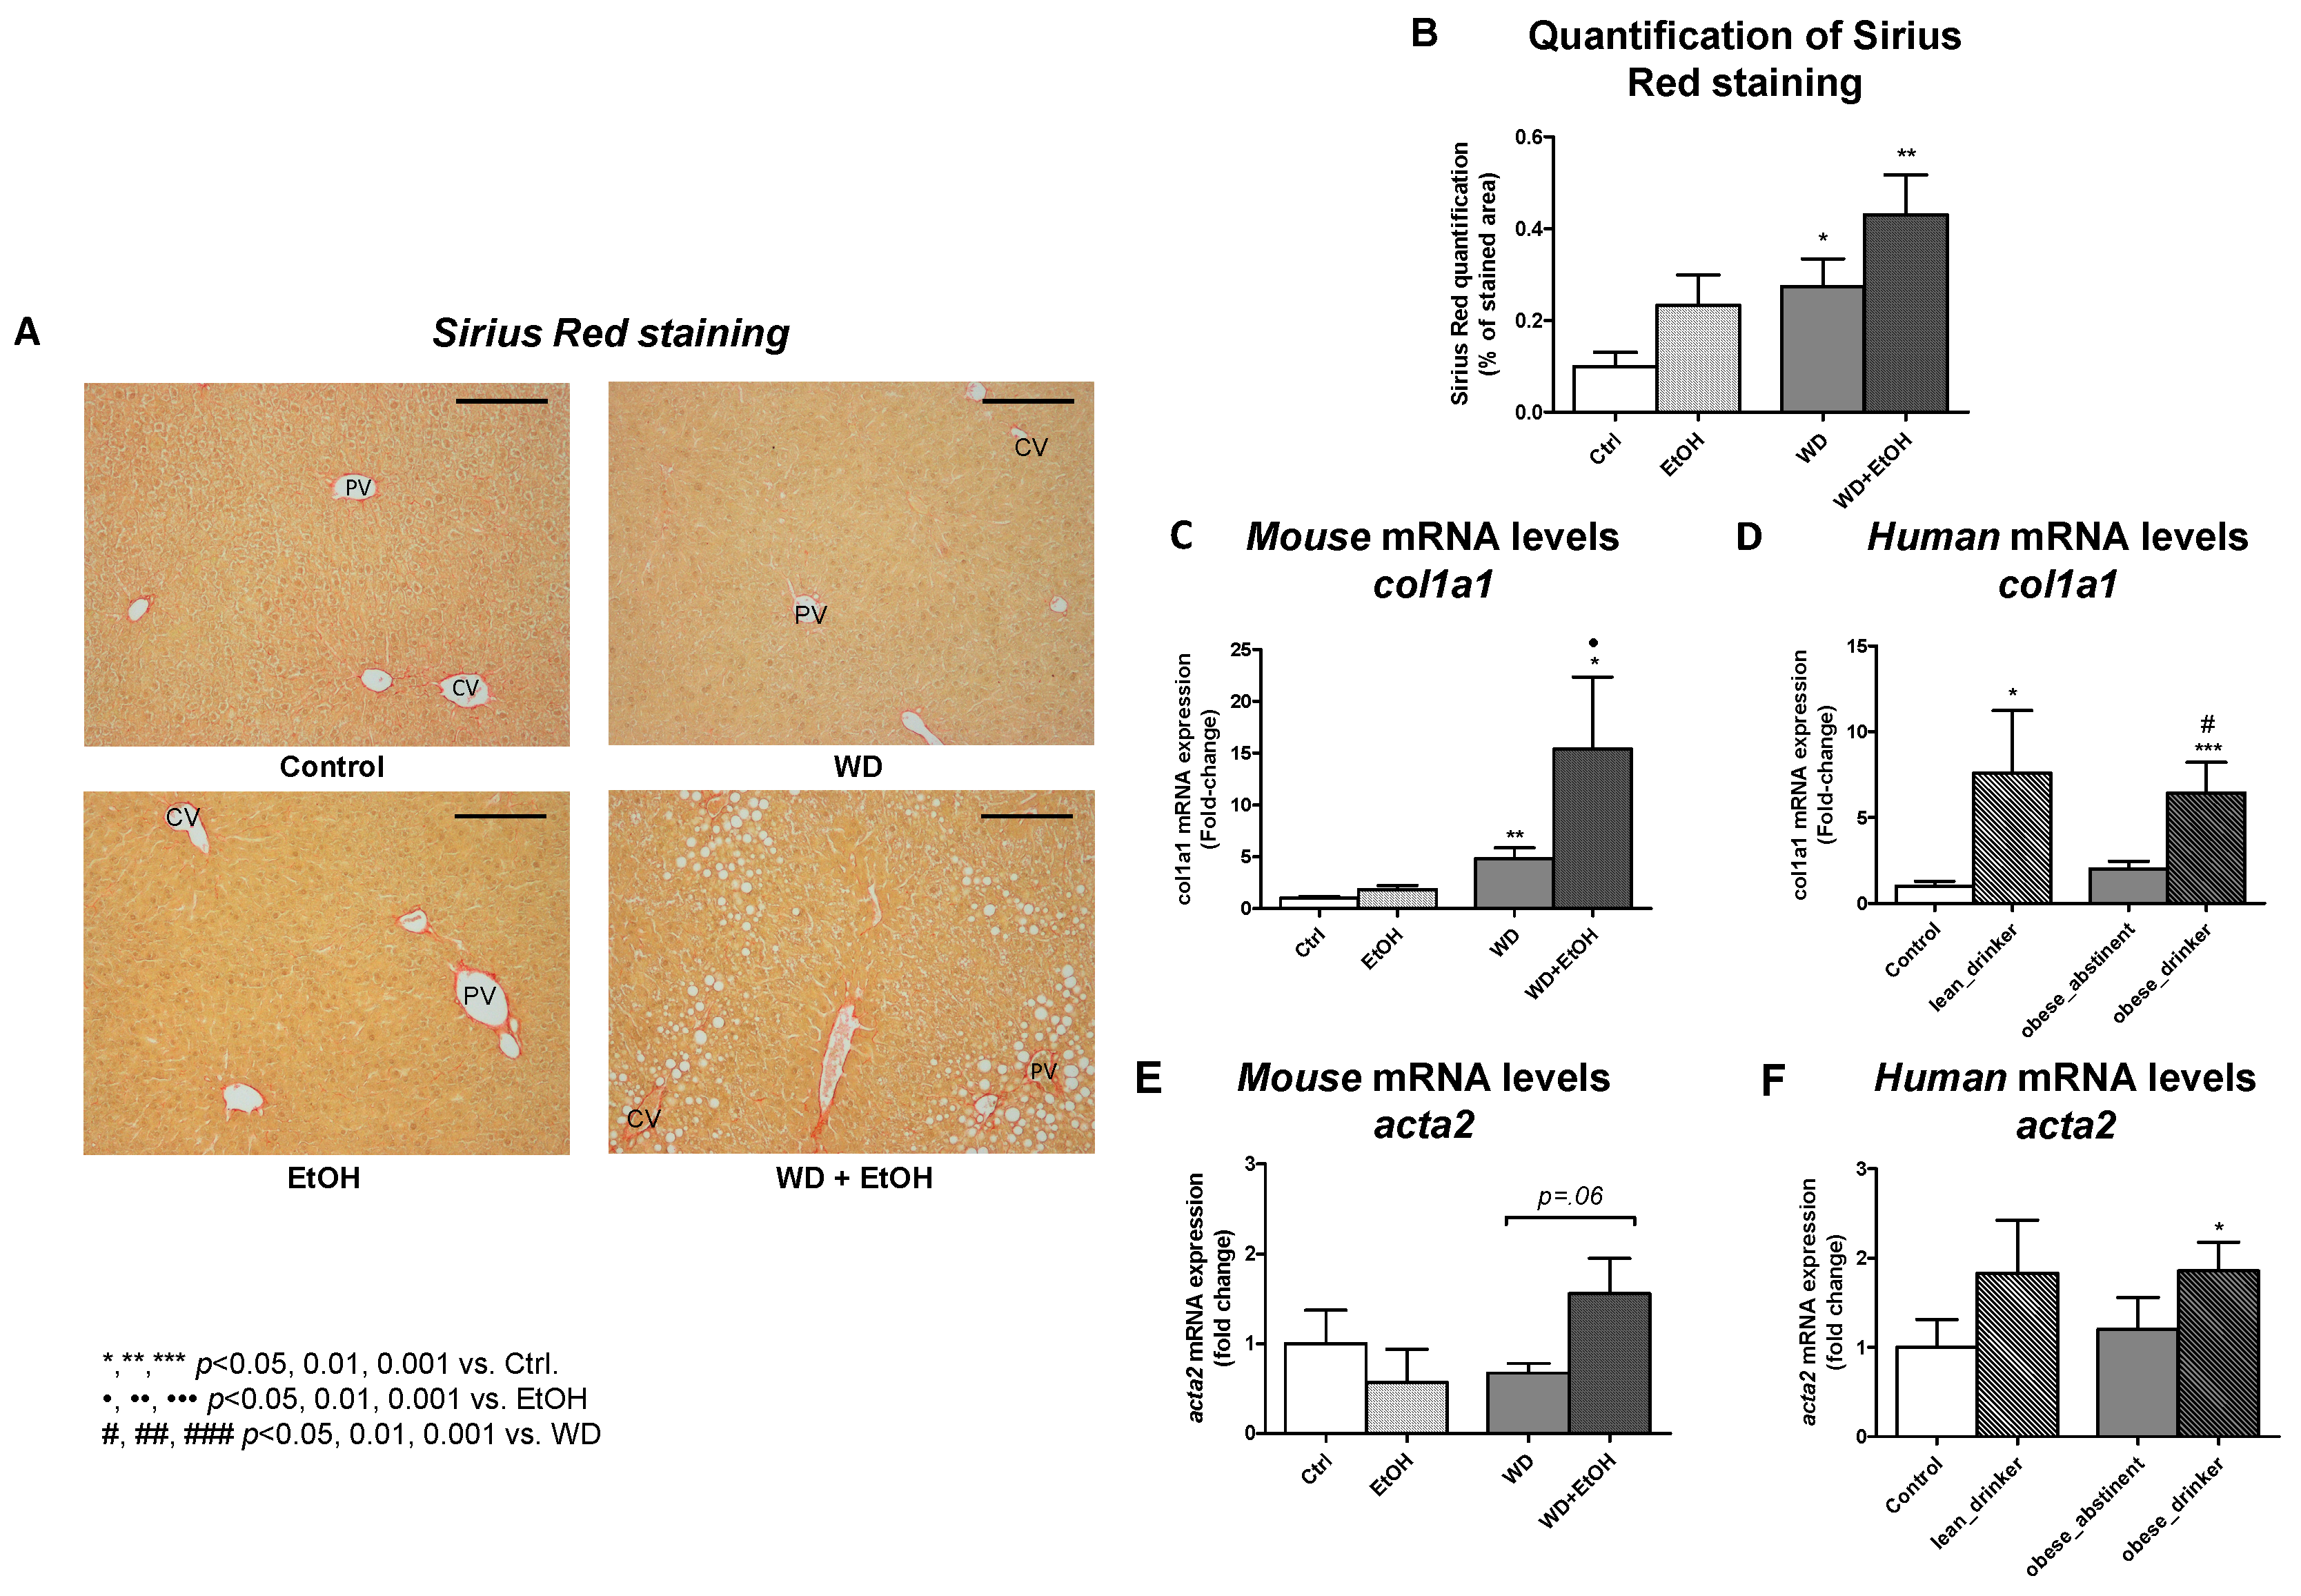
Sirius-red staining was used to investigate fibrosis development. Ethanol alone did not induce liver fibrosis, but WD with ethanol administration induced the strongest increase in the amount of perisinusoidal collagen in the stains (Figure 3A,B). We then performed RT-PCR for collagen type I alpha 1 (col1a1). We observed an upregulation in both the WD and the ethanol-fed group, but the highest values were again observed in the group of ethanol and WD-fed animals (Figure 3C). In our human cohorts, col1a1 was increased in the drinker groups, with the clearest difference in the obese drinker group (Figure 3D). Hepatic gene expression of actin alpha 2 (acta2) showed a not significant, increasing trend in the WD and ethanol group (Figure 3E), which was confirmed in the human cohort (Figure 3F).

3.5. WD and Ethanol Feeding Increased Liver Inflammation

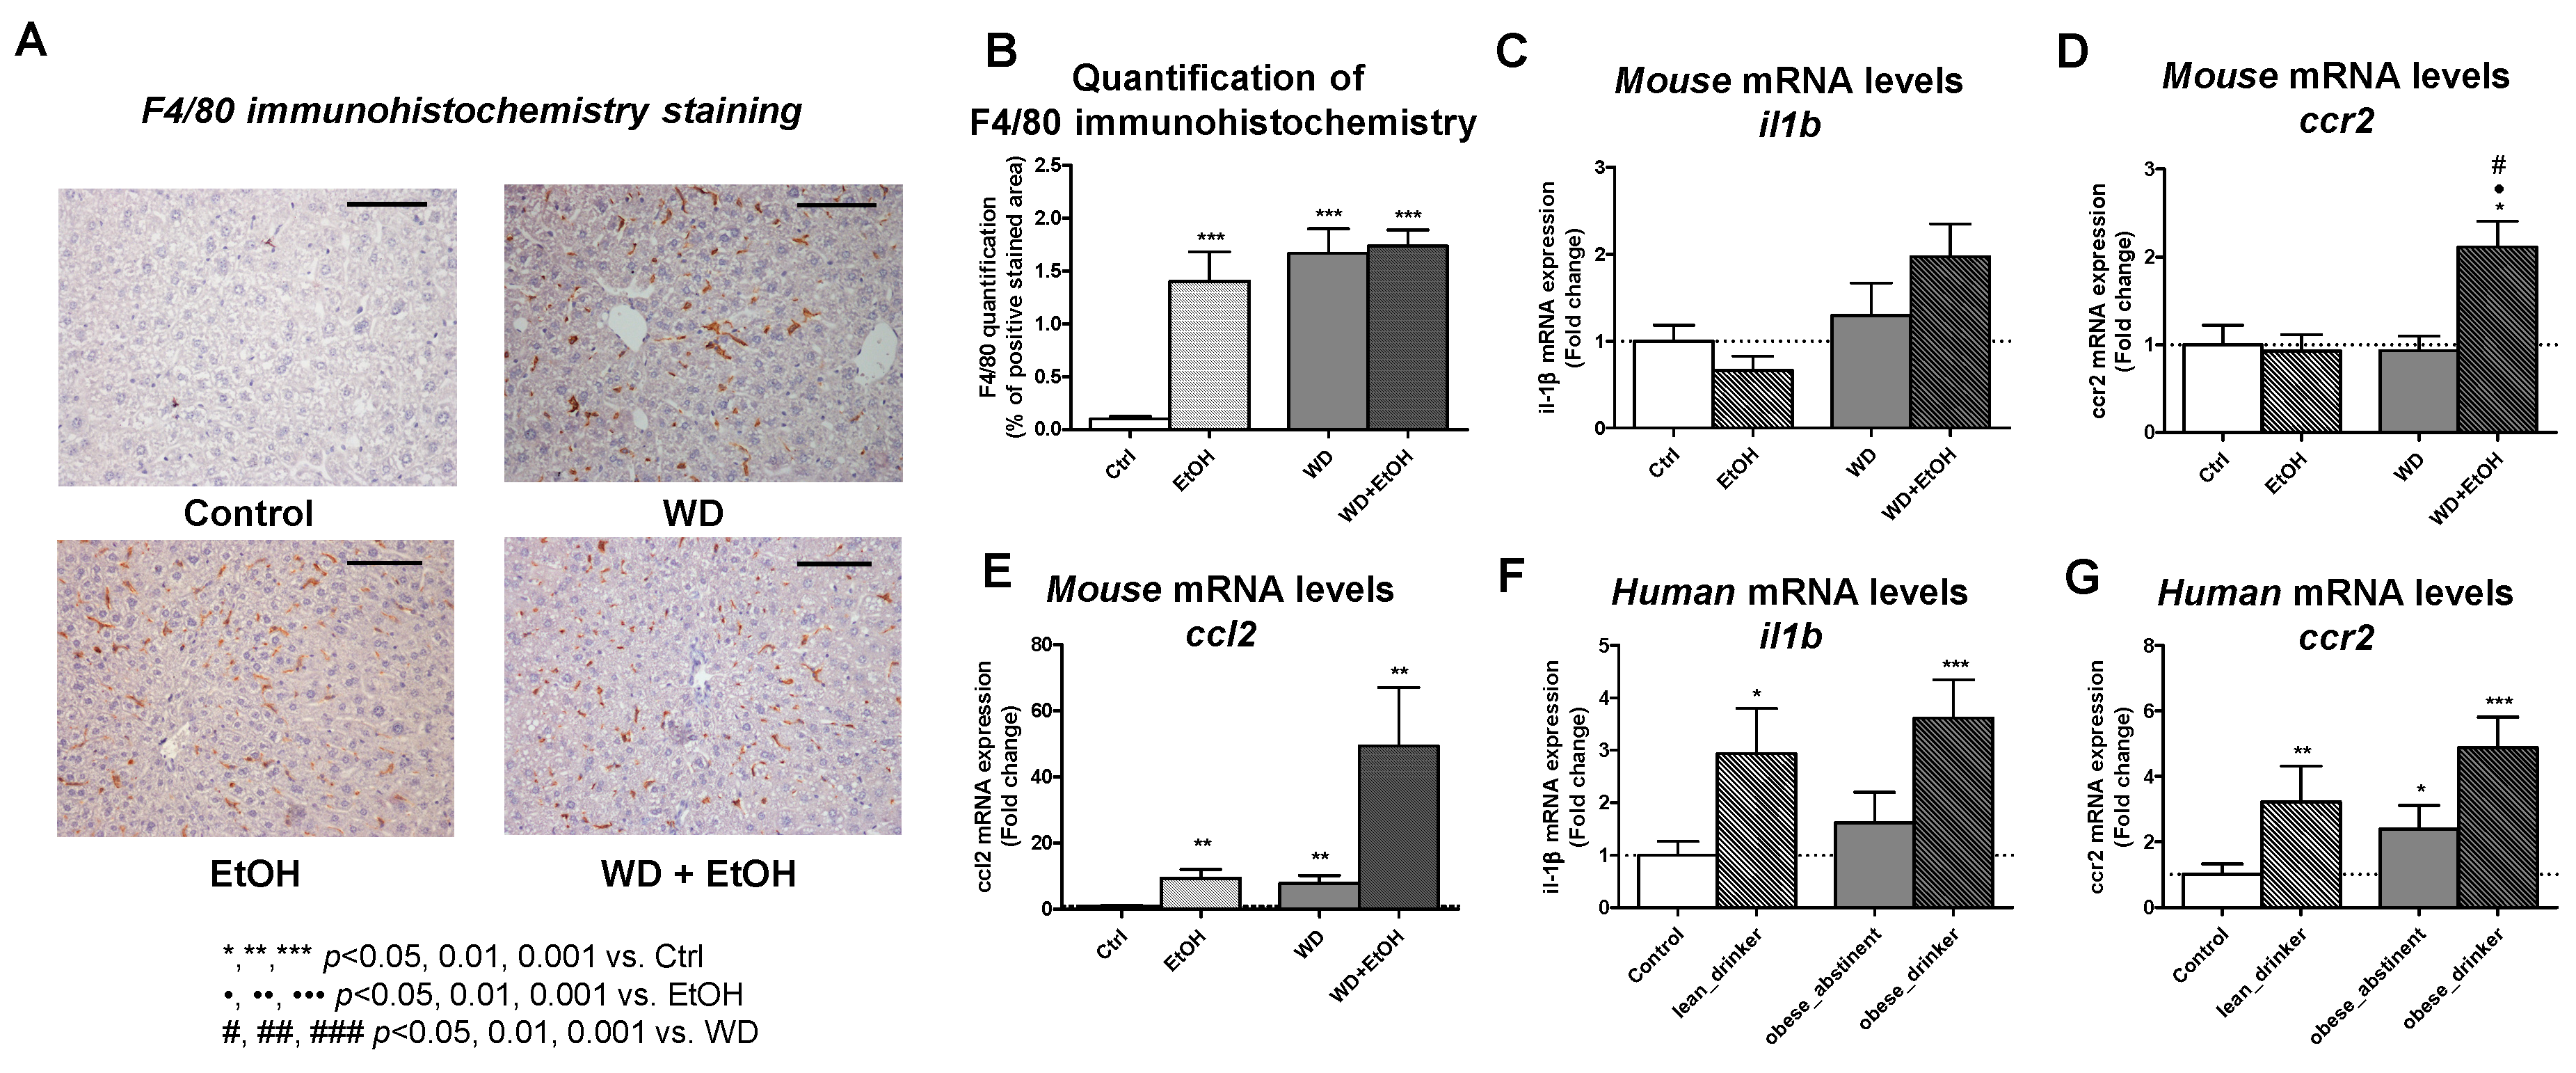
To fully assess the animals’ liver phenotypes, we then checked for liver inflammation in our models. Firstly, F4/80 immunohistochemistry was performed in murine livers. Higher abundance of positively stained cells were observed in treated animals compared to controls (Figure 4A). This was confirmed through the staining quantification, which showed a significant upregulation in all treated animals, with the highest values in mice treated with the combination of ethanol and WD (Figure 4B). We investigated gene expression levels of cytokines in our models. When ethanol or WD were provided alone, interleukin 1 beta (il1b) remained unchanged, with a trend towards increase in WD and ethanol cofed mice (Figure 4C). While WD and ethanol feeding alone did not lead to a change of expression of C-C chemokine receptor type 2 (ccr2), its combination led to a significant increase (Figure 4D). Gene expression of CC-Chemokin-Ligand-2 (ccl2) was upregulated in ethanol and WD-fed mice, and upregulation was strongly increased in mice treated with both WD and ethanol. (Figure 4E). Briefly, WD was not able to induce upregulation of hepatic inflammatory marker mRNA levels, but ethanol as a cofactor did increase its expression (Figure 4C–E). In our human cohort, il1b expression levels were increased in ethanol-related groups lean drinker and obese drinker, but not in the obese abstinent group (Figure 4F). For ccr2, lean abstinent and obese abstinent groups showed higher expressions compared to the control group, but the highest values were observed in the obese drinker group (Figure 4G). For liver patients presenting obesity and alcohol misuse in their medical history, inflammatory genes were upregulated compared to the other group of patients (Figure 4F,G).

4. Discussion

In this study, we analyzed effects of ethanol in WD-fed mice and characterized a new murine early-stage fatty liver disease model that developed histological and gene expression features of early metabolic liver disease via simultaneous ethanol and WD feeding for only seven weeks. Mice showed hepatomegaly, severe steatosis and mild inflammation and fibrosis. Our model further showed a similar gene expression profile in humans affected by early-stage liver disease. These features potentially render the model suitable to investigate pathogenic mechanisms and for testing biomarkers and novel therapeutic strategies.
Recently, awareness has emerged that the steatosis component of metabolic liver disease is mostly driven by both ethanol consumption and diet [15,16]. This group was probably underrepresented in previous models because of the distinct attribution into models for alcoholic and nonalcoholic fatty liver disease [17]. In daily clinical practice, alcohol consumption drives disease progression in obese patients with fatty liver disease [18]. This fact is often neglected in animal models exclusively fed with WD or similar formulas. Large cohort analyses revealed that alcohol consumption, even within the acceptable limit for the diagnosis of NAFLD, negatively affects the severity of chronic liver disease in patients with metabolic syndrome [19]. Overall, data on alcohol consumption mostly rely on anamnestic data, but are probably underestimated in cohort analyses [20]. We therefore believe that our model mirrors a realistic setting, since ethanol was coadministered within the experimental period. Moreover, the use of wild-type mice in our model contributed to a natural injury development since genetic modifications were not applied.
Chronic ethanol consumption is likely to drive hepatic steatosis. This was demonstrated in several previous studies. It has been recently reported that ethanol drives liver steatosis in mice suffering from hepatitis B virus infection [21]. The role of ethanol within the pathophysiology of NAFLD is currently poorly understood and seems to induce different dose-dependent effects. Bucher et al. recently showed that low-dose ethanol-feeding (2%) in high fat diet-treated mice may attenuate NAFLD through downregulation of proinflammatory and profibrotic genes, as well as restoration of mitochondrial function [22]. Our data indicate that higher amounts of ethanol coadministration (16%) in WD-fed animals led to synergistic development of steatosis as shown by Oil Red O staining and measurement of hepatic triglycerides. In our WD + ethanol-fed mice, we could show upregulation of scd-1, a key enzyme of lipid metabolism, which seems to modulate susceptibility to obesity, insulin resistance, diabetes and hyperlipidemia [23]. A recent study similarly showed increased hepatic steatosis and inflammatory markers in high fat diet and ethanol cofeeding [24]. Further studies are urgently needed to elucidate the pathogenic mechanisms displayed by ethanol in metabolic liver disease.
Our data showed increase of liver fat content if ethanol was coadministered. This finding supports clinical evidence, since steatosis is one of the hallmarks of ALD [25]. A widely used model for chronic ALD is the Lieber-DeCarli model, which has been known for over 50 years [26]. However, it only induces mild steatosis and fibrosis without inflammation. Many of the currently existing murine ALD models reflect advanced disease stages. Our model might fill in the gap between models for simple steatosis and models including ethanol combined with CCl4 mimicking alcoholic steatohepatitis with severe fibrosis [27,28,29,30]. The present model acknowledges the fact that many patients suffering from metabolic liver disease do not develop significant fibrosis, which is only observed in around 30% [4].
Our model further included perisinusoidal fibrosis, which is another advantage since many models lack this hallmark of metabolic liver disease [26,31,32]. The development of F1 fibrosis within a short time frame of seven weeks reflects the usual progression of human early stage of liver disease. Patients with mere steatosis can develop fibrosis, which justifies the need for monitoring [33,34]. To date, laboratory tests show the poorest accuracy of noninvasive diagnostic methods for early-stage liver fibrosis [35]. For further strategies, a model with beginning fibrosis may be helpful in developing and testing novel biomarkers for liver fibrosis. The computer-based detection of fibrosis we used in this study reduces the influence of interobserver variation when classifying fibrosis to distinct stages using semiquantitative scales (F1–F4).
Applicability to the human situation is crucial when using animal models. Therefore, cross-validation in human disease of the animal model is required [36]. We confirmed the phenotype of our animal model in a patient cohort of obese drinkers on a gene transcript level, using well-established and validated key genes for alcoholic and metabolic liver disease within the human ALD cohort [37,38,39]. Nowadays, an increasing number of publications is emerging, indicating the need of a new nomenclature for metabolic liver disease, as the term NAFLD might be misleading. Suggested names like “fatty liver disease” and “metabolic dysfunction-associated fatty liver disease” (MAFLD) have recently been proposed in order to better illustrate the phenotype of these patients [40,41,42]. The here-proposed WD-ethanol model attempts to mimic the pathophysiological complexity of the disease.
In summary, the present study offers a new protocol for inducing metabolic liver disease in mice, including elevated transaminases, severe hepatic steatosis and mild fibrosis induced by WD and ethanol feeding. Our data indicates different mechanisms of steatosis development depending on the provided etiology. To date, this is the first animal study that focuses on the newly defined entity of MAFLD. The main advantages of this model are the wildtype-based approach, technically easy performance and rapid induction within a time period of only seven weeks, making it resource saving. It represents an early-stage liver disease model covering the two most abundant etiologies in humans, namely overnutrition and alcohol consumption. Based on the proposed protocol, WD and ethanol-fed mice could provide a helpful murine model for fatty liver disease research.

5. Conclusions

This study provides a novel murine model for early-stage liver disease including severe liver steatosis, mild fibrosis and inflammation based on the combination of Western diet and ethanol feeding. Herein, we studied effects of ethanol-feeding on the development of hepatic steatosis. We compared the liver phenotype of our animals to a human cohort of early-stage fatty liver disease, stratified via body mass index (BMI) and current alcohol consumption.

Supplementary Materials

The following are available online at https://www.mdpi.com/2673-4389/1/1/3/s1, Table S1: Ingredients of diets, Table S2: TaqMan® gene expression assays, Table S3: Gene identity, accession number and forward and reverse primers used for RT-PCR analysis of relative gene expression of human liver tissue, Material S1: Computer Code for Quantification of Sirius Red Staining, Material S2: Computer Code for Quantification of Oil Red O Staining, Material S3: Computer Code for Quantification of F4/80 Staining.

Author Contributions

Conceptualization, A.K. and J.T.; methodology, M.J.B., C.O., S.K., R.S., E.A., A.K. and J.T.; formal analysis, M.J.B., S.G., S.K., F.E.U., V.F., S.D., C.O., S.T., L.E.; investigation, M.J.B., S.G., V.I.P., S.K., E.A., A.K., J.T., L.E.; data curation, M.J.B., D.N.R., R.S., M.T., A.K.; writing—original draft preparation, M.J.B.; software M.J.B., R.S.; writing—review and editing, M.J.B., S.G., D.N.R., S.K., R.S., F.E.U., S.D., V.I.P., M.T., C.O., V.F., S.T., E.A., A.K., J.T.; visualization, M.J.B., C.O., R.S.; supervision, A.K., J.T.; project administration, E.A., A.K., J.T.; funding acquisition, M.J.B., E.A., A.K., J.T. All authors have read and agreed to the published version of the manuscript.

Funding

This research was funded by European Union’s Horizon 2020 research and innovation program’s GALAXY study, grant number 668031. J.T. was supported by the Deutsche Forschungsgemeinschaft, grant number SFB TRR57 and CRC1382, Cellex Foundation, LIVERHOPE, grant number 731875, European Union’s Horizon 2020 research and innovation program’s (MICROB-PREDICT, grant number 825694 and DECISION, grant number 84794) and University Hospital Bonn BONFOR program, grant number O-107.0120 (stipend for M.J.B.).

Acknowledgments

All authors are very grateful to Gudrun Hack and Silke Bellinghausen for their excellent technical assistance.

Conflicts of Interest

The authors declare no conflict of interest. The funders had no role in the design of the study; in the collection, analyses, or interpretation of data; in the writing of the manuscript, or in the decision to publish the results.

References

  1. Blachier, M.; Leleu, H.; Peck-Radosavljevic, M.; Valla, D.-C.; Roudot-Thoraval, F. The Burden of Liver Disease in Europe: A Review of Available Epidemiological Data. J. Hepatol. 2013, 58, 593–608. [Google Scholar] [CrossRef] [Green Version]
  2. Younossi, Z.M.; Stepanova, M.; Younossi, Y.; Golabi, P.; Mishra, A.; Rafiq, N.; Henry, L. Epidemiology of Chronic Liver Diseases in the USA in the Past Three Decades. Gut 2020, 69, 564–568. [Google Scholar] [CrossRef]
  3. Friedman, S.L.; Neuschwander-Tetri, B.A.; Rinella, M.; Sanyal, A.J. Mechanisms of NAFLD Development and Therapeutic Strategies. Nat. Med. 2018, 24, 908–922. [Google Scholar] [CrossRef] [PubMed]
  4. Singh, S.; Allen, A.M.; Wang, Z.; Prokop, L.J.; Murad, M.H.; Loomba, R. Fibrosis Progression in Nonalcoholic Fatty Liver vs. Nonalcoholic Steatohepatitis: A Systematic Review and Meta-Analysis of Paired-Biopsy Studies. Clin. Gastroenterol. Hepatol. 2015, 13, 643–654e9. [Google Scholar] [CrossRef] [Green Version]
  5. WHO|Global Status Report on Alcohol and Health. 2018. Available online: http://www.who.int/substance_abuse/publications/global_alcohol_report/gsr_2018/en/ (accessed on 17 April 2020).
  6. Eslam, M.; Newsome, P.N.; Sarin, S.K.; Anstee, Q.M.; Targher, G.; Romero-Gomez, M.; Zelber-Sagi, S.; Wong, V.W.-S.; Dufour, J.-F.; Schattenberg, J.M.; et al. A New Definition for Metabolic Dysfunction-Associated Fatty Liver Disease: An International Expert Consensus Statement. J. Hepatol. 2020, 73, 202–209. [Google Scholar] [CrossRef]
  7. Brol, M.J.; Rösch, F.; Schierwagen, R.; Magdaleno, F.; Uschner, F.E.; Manekeller, S.; Queck, A.; Schwarzkopf, K.; Odenthal, M.; Drebber, U.; et al. Combination of CCl4 with Alcoholic and Metabolic Injuries Mimics Human Liver Fibrosis. Am. J. Physiol. Gastrointest. Liver Physiol. 2019, 317, G182–G194. [Google Scholar] [CrossRef] [PubMed]
  8. Thiele, M.; Detlefsen, S.; Møller, L.S.; Madsen, B.S.; Hansen, J.F.; Fialla, A.D.; Trebicka, J.; Krag, A. Transient and 2-Dimensional Shear-Wave Elastography Provide Comparable Assessment of Alcoholic Liver Fibrosis and Cirrhosis. Gastroenterology 2016, 150, 123–133. [Google Scholar] [CrossRef] [PubMed]
  9. Thiele, M.; Madsen, B.S.; Hansen, J.F.; Detlefsen, S.; Antonsen, S.; Krag, A. Accuracy of the Enhanced Liver Fibrosis Test vs. FibroTest, Elastography, and Indirect Markers in Detection of Advanced Fibrosis in Patients With Alcoholic Liver Disease. Gastroenterology 2018, 154, 1369–1379. [Google Scholar] [CrossRef] [PubMed] [Green Version]
  10. Kleiner, D.E.; Brunt, E.M.; Van Natta, M.; Behling, C.; Contos, M.J.; Cummings, O.W.; Ferrell, L.D.; Liu, Y.-C.; Torbenson, M.S.; Unalp-Arida, A.; et al. Design and Validation of a Histological Scoring System for Nonalcoholic Fatty Liver Disease. Hepatology 2005, 41, 1313–1321. [Google Scholar] [CrossRef] [PubMed]
  11. Schmittgen, T.D.; Livak, K.J. Analyzing Real-Time PCR Data by the Comparative C(T) Method. Nat. Protoc. 2008, 3, 1101–1108. [Google Scholar] [CrossRef]
  12. Trebicka, J.; Racz, I.; Siegmund, S.V.; Cara, E.; Granzow, M.; Schierwagen, R.; Klein, S.; Wojtalla, A.; Hennenberg, M.; Huss, S.; et al. Role of Cannabinoid Receptors in Alcoholic Hepatic Injury: Steatosis and Fibrogenesis Are Increased in CB2 Receptor-Deficient Mice and Decreased in CB1 Receptor Knockouts. Liver Int. 2011, 31, 860–870. [Google Scholar] [CrossRef] [PubMed]
  13. Schierwagen, R.; Maybüchen, L.; Zimmer, S.; Hittatiya, K.; Bäck, C.; Klein, S.; Uschner, F.E.; Reul, W.; Boor, P.; Nickenig, G.; et al. Seven Weeks of Western Diet in Apolipoprotein-E-Deficient Mice Induce Metabolic Syndrome and Non-Alcoholic Steatohepatitis with Liver Fibrosis. Sci. Rep. 2015, 5, 12931. [Google Scholar] [CrossRef] [PubMed]
  14. Rasband, W.S. ImageJ, V.1.51j8; U.S. National Institutes of Health: Bethesda, MD, USA, 1997.
  15. Eslam, M.; Sanyal, A.J.; George, J. International Consensus Panel MAFLD: A Consensus-Driven Proposed Nomenclature for Metabolic Associated Fatty Liver Disease. Gastroenterology 2020, 158, 1999–2014.e1. [Google Scholar] [CrossRef] [PubMed]
  16. Israelsen, M.; Juel, H.B.; Detlefsen, S.; Madsen, B.S.; Rasmussen, D.N.; Larsen, T.R.; Kjærgaard, M.; Jo Fernandes Jensen, M.; Stender, S.; Hansen, T.; et al. Metabolic and Genetic Risk Factors Are the Strongest Predictors of Severity of Alcohol-Related Liver Fibrosis. Clin. Gastroenterol. Hepatol. 2020. [Google Scholar] [CrossRef]
  17. Polyzos, S.A.; Mantzoros, C.S. Making Progress in Nonalcoholic Fatty Liver Disease (NAFLD) as We Are Transitioning from the Era of NAFLD to Dys-Metabolism Associated Fatty Liver Disease (DAFLD). Metabolism 2020, 111, 154318. [Google Scholar] [CrossRef] [PubMed]
  18. Mahli, A.; Hellerbrand, C. Alcohol and Obesity: A Dangerous Association for Fatty Liver Disease. Dig. Dis. 2016, 34 (Suppl. 1), 32–39. [Google Scholar] [CrossRef] [Green Version]
  19. Åberg, F.; Helenius-Hietala, J.; Puukka, P.; Färkkilä, M.; Jula, A. Interaction between Alcohol Consumption and Metabolic Syndrome in Predicting Severe Liver Disease in the General Population. Hepatology 2018, 67, 2141–2149. [Google Scholar] [CrossRef] [Green Version]
  20. Stockwell, T.; Zhao, J.; Sherk, A.; Rehm, J.; Shield, K.; Naimi, T. Underestimation of Alcohol Consumption in Cohort Studies and Implications for Alcohol’s Contribution to the Global Burden of Disease. Addiction 2018, 113, 2245–2249. [Google Scholar] [CrossRef] [PubMed]
  21. Li, Z.-M.; Kong, C.-Y.; Zhang, S.-L.; Han, B.; Zhang, Z.-Y.; Wang, L.-S. Alcohol and HBV Synergistically Promote Hepatic Steatosis. Ann. Hepatol. 2019, 18, 913–917. [Google Scholar] [CrossRef]
  22. Bucher, S.; Begriche, K.; Catheline, D.; Trak-Smayra, V.; Tiaho, F.; Coulouarn, C.; Pinon, G.; Lagadic-Gossmann, D.; Rioux, V.; Fromenty, B. Moderate Chronic Ethanol Consumption Exerts Beneficial Effects on Nonalcoholic Fatty Liver in Mice Fed A High-Fat Diet: Possible Role of Higher Formation of Triglycerides Enriched in Monounsaturated Fatty Acids. Eur. J. Nutr. 2020, 59, 1619–1632. [Google Scholar] [CrossRef]
  23. Flowers, M.T.; Ntambi, J.M. Role of Stearoyl-Coenzyme A Desaturase in Regulating Lipid Metabolism. Curr. Opin. Lipidol. 2008, 19, 248–256. [Google Scholar] [CrossRef] [Green Version]
  24. Gopal, T.; Kumar, N.; Perriotte-Olson, C.; Casey, C.A.; Donohue, T.M.; Harris, E.N.; Talmon, G.; Kabanov, A.V.; Saraswathi, V. Nanoformulated SOD1 Ameliorates the Combined NASH and Alcohol-Associated Liver Disease Partly via Regulating CYP2E1 Expression in Adipose Tissue and Liver. Am. J. Physiol.-Gastrointest. Liver Physiol. 2020, 318, G428–G438. [Google Scholar] [CrossRef] [PubMed]
  25. Seitz, H.K.; Bataller, R.; Cortez-Pinto, H.; Gao, B.; Gual, A.; Lackner, C.; Mathurin, P.; Mueller, S.; Szabo, G.; Tsukamoto, H. Alcoholic Liver Disease. Nat. Rev. Dis. Primers 2018, 4, 16. [Google Scholar] [CrossRef]
  26. Lieber, C.S.; Jones, D.P.; Decarli, L.M. Effects of Prolonged Ethanol Intake: Production of Fatty Liver Despite Adequate Diets. J. Clin. Investig. 1965, 44, 1009–1021. [Google Scholar] [CrossRef] [Green Version]
  27. Xu, M.-J.; Cai, Y.; Wang, H.; Altamirano, J.; Chang, B.; Bertola, A.; Odena, G.; Lu, J.; Tanaka, N.; Matsusue, K.; et al. Fat-Specific Protein 27/CIDEC Promotes Development of Alcoholic Steatohepatitis in Mice and Humans. Gastroenterology 2015, 149, 1030–1041.e6. [Google Scholar] [CrossRef] [Green Version]
  28. Chang, B.; Xu, M.-J.; Zhou, Z.; Cai, Y.; Li, M.; Wang, W.; Feng, D.; Bertola, A.; Wang, H.; Kunos, G.; et al. Short- or Long-Term High-Fat Diet Feeding plus Acute Ethanol Binge Synergistically Induce Acute Liver Injury in Mice: An Important Role for CXCL1. Hepatology 2015, 62, 1070–1085. [Google Scholar] [CrossRef] [Green Version]
  29. Zhou, Z.; Xu, M.-J.; Cai, Y.; Wang, W.; Jiang, J.X.; Varga, Z.V.; Feng, D.; Pacher, P.; Kunos, G.; Torok, N.J.; et al. Neutrophil-Hepatic Stellate Cell Interactions Promote Fibrosis in Experimental Steatohepatitis. Cell. Mol. Gastroenterol. Hepatol. 2018, 5, 399–413. [Google Scholar] [CrossRef] [PubMed] [Green Version]
  30. Khanova, E.; Wu, R.; Wang, W.; Yan, R.; Chen, Y.; French, S.W.; Llorente, C.; Pan, S.Q.; Yang, Q.; Li, Y.; et al. Pyroptosis by Caspase11/4-Gasdermin-D Pathway in Alcoholic Hepatitis in Mice and Patients. Hepatology 2018, 67, 1737–1753. [Google Scholar] [CrossRef] [Green Version]
  31. Leclercq, I.A.; Farrell, G.C.; Schriemer, R.; Robertson, G.R. Leptin Is Essential for the Hepatic Fibrogenic Response to Chronic Liver Injury. J. Hepatol. 2002, 37, 206–213. [Google Scholar] [CrossRef]
  32. Takahashi, Y.; Soejima, Y.; Fukusato, T. Animal Models of Nonalcoholic Fatty Liver Disease/Nonalcoholic Steatohepatitis. World J. Gastroenterol. 2012, 18, 2300–2308. [Google Scholar] [CrossRef]
  33. Schuppan, D.; Surabattula, R.; Wang, X.Y. Determinants of Fibrosis Progression and Regression in NASH. J. Hepatol. 2018, 68, 238–250. [Google Scholar] [CrossRef] [PubMed]
  34. European Association for the Study of the Liver (EASL); European Association for the Study of Diabetes (EASD); European Association for the Study of Obesity (EASO). EASL-EASD-EASO Clinical Practice Guidelines for the Management of Non-Alcoholic Fatty Liver Disease. J. Hepatol. 2016, 64, 1388–1402.
  35. Xiao, G.; Zhu, S.; Xiao, X.; Yan, L.; Yang, J.; Wu, G. Comparison of Laboratory Tests, Ultrasound, or Magnetic Resonance Elastography to Detect Fibrosis in Patients with Nonalcoholic Fatty Liver Disease: A Meta-Analysis. Hepatology 2017, 66, 1486–1501. [Google Scholar] [CrossRef] [PubMed]
  36. Denayer, T.; Stöhr, T.; Van Roy, M. Animal Models in Translational Medicine: Validation and Prediction. New Horiz. Transl. Med. 2014, 2, 5–11. [Google Scholar] [CrossRef] [Green Version]
  37. Hurrell, T.; Kastrinou-Lampou, V.; Fardellas, A.; Hendriks, D.F.G.; Nordling, Å.; Johansson, I.; Baze, A.; Parmentier, C.; Richert, L.; Ingelman-Sundberg, M. Human Liver Spheroids as A Model to Study Aetiology and Treatment of Hepatic Fibrosis. Cells 2020, 9, 964. [Google Scholar] [CrossRef] [Green Version]
  38. Liu, B.; Jiang, S.; Li, M.; Xiong, X.; Zhu, M.; Li, D.; Zhao, L.; Qian, L.; Zhai, L.; Li, J.; et al. Proteome-Wide Analysis of USP14 Substrates Revealed Its Role in Hepatosteatosis via Stabilization of FASN. Nat. Commun. 2018, 9, 4770. [Google Scholar] [CrossRef] [Green Version]
  39. Rein-Fischboeck, L.; Haberl, E.M.; Pohl, R.; Feder, S.; Liebisch, G.; Krautbauer, S.; Buechler, C. Variations in Hepatic Lipid Species of Age-Matched Male Mice Fed A Methionine-Choline-Deficient Diet and Housed in Different Animal Facilities. Lipids Health Dis. 2019, 18, 172. [Google Scholar] [CrossRef] [PubMed] [Green Version]
  40. Fouad, Y.; Waked, I.; Bollipo, S.; Gomaa, A.; Ajlouni, A.; Attia, D. What’s in A Name? Renaming “NAFLD’’ to “MAFLD”. Liver Int. 2020, 40, 1254–1261. [Google Scholar] [CrossRef] [PubMed] [Green Version]
  41. Balmer, M.L.; Dufour, J.-F. Non-Alcoholic Steatohepatitis—From NAFLD to MAFLD. Ther. Umsch. 2011, 68, 183–188. [Google Scholar] [CrossRef]
  42. Singh, A.; Kumar, A.; Singh, S.; Dhaliwal, A.J.S.; Lopez, R.; Noureddin, M.; Alkhouri, N. Trends of Awareness of Non-Alcoholic Fatty Liver Disease, Alcoholic Liver Disease and Both Fatty Liver Diseases (BAFLD) Using National Health and Nutrition Examination Survey: 836. Am. J. Gastroenterol. 2018, 113, S465. [Google Scholar] [CrossRef]
Figure 1. Experimental setup and serological disease markers. (A) Setup of in vivo experiments in C57Bl/6 mice showing the time period of experiment, number of used animals and provided treatment. (B) Effects of ethanol, Western diet (WD) and ethanol + WD feeding on liver-to-body weight ratio. (C) Serum alanine transaminase (ALT) levels of ethanol, WD and ethanol + WD-treated mice and (D) serum triglyceride levels of ethanol, WD and ethanol + WD-treated mice. Results are expressed as mean ± standard error of the mean (SEM); * p < 0.05, ** p < 0.01 and *** p < 0.001 for treated vs. control mice, p < 0.05, ●● p < 0.01 and ●●● p < 0.001 for treated vs. ethanol-treated mice, # p < 0.05, ## p < 0.01 and ### p < 0.001 for treated vs. WD-fed mice. Abbreviations: WD—Western diet, EtOH—ethanol, ALT—alanine transaminase
Livers 01 00003 g001
Figure 2. Steatosis assessment. Oil Red O Staining (A) with its quantification (B) of ethanol, WD and ethanol + WD treated mice. The scale bar is 200µm. (C) Effects of ethanol, WD and ethanol + WD feeding on hepatic triglyceride content. mRNA expression levels of steatosis marker genes srebp-1c (D), scd-1 (E) and fasn (F) of livers from mice. (G) mRNA expression levels of fasn of livers from humans. (H) Protein expression of srebp-1c and scd-1 of livers from mice and its quantification (I,J). Results are expressed as mean ± standard error of the mean (SEM); * p < 0.05, ** p < 0.01 and *** p < 0.001 for treated vs. control mice or humans respectively, p < 0.05, ●● p < 0.01 and ●●● p < 0.001 for treated vs. ethanol-treated mice, # p < 0.05, ## p < 0.01 and ### p < 0.001 for treated vs. WD-fed mice.
Livers 01 00003 g002
Figure 3. Fibrosis assessment. Sirius Red staining (A) with its quantification (B) of ethanol, WD and ethanol + WD treated mice. The scale bar is 100 µm. (C) mRNA expression levels of col1a1 of livers from mice. (D) mRNA expression levels of col1a1 of livers from humans. (E) mRNA expression levels of acta2 of livers from mice. (F) mRNA expression levels of acta2 of livers from humans. Results are expressed as mean ± standard error of the mean (SEM); * p < 0.05, ** p < 0.01 and *** p < 0.001 for treated vs. control mice or humans respectively, p < 0.05, ●● p < 0.01 and ●●● p < 0.001 for treated vs. ethanol-treated mice, # p < 0.05, ## p < 0.01 and ### p < 0.001 for treated vs. WD-fed mice.
Livers 01 00003 g003
Figure 4. Inflammation assessment. F4/80 immunohistochemistry (A) and its quantification (B) of ethanol, WD and ethanol + WD treated mice. The scale bar is 200µm. mRNA expression levels of (C) il1b, (D) ccr2 and (E) ccl2 of livers from mice. mRNA expression levels of (F) il1b and (G) ccr2 of livers from humans. Results are expressed as mean ± standard error of the mean (SEM); * p < 0.05, ** p < 0.01 and *** p < 0.001 for treated vs. control mice or humans respectively, p < 0.05, ●● p < 0.01 and ●●● p < 0.001 for treated vs. ethanol-treated mice, # p < 0.05, ## p < 0.01 and ### p < 0.001 for treated vs. WD-fed mice.
Livers 01 00003 g004
Table 1. Characteristics of patients: Lean abstinents = control group (Ctrl), lean drinkers (LD), obese abstinents (OA), and obese drinkers (OD).
CharacteristicCtrl
(n = 30)
LD
(n = 11)
OA
(n = 18)
OD
(n = 21)
p Value
Data at liver biopsy
Body mass index, kg/m2, mean ± SD23.07 ± 2.0321.53 ± 3.3429.48 ± 4.1730.67 ± 3.220.000 *
HbA1c, mM, mean ± SD36.4 ± 5.532.4 ± 6.536.1 ± 7.434.7 ± 7.50.178
Histological score, mean ± SD
Kleiner Fibrosis Stage 1.47 ± 1.452.00 ± 1.342.22 ± 1.522.23 ± 1.070.129
NAS Steatosis Grade0.27 ± 0.0581.45 ± 1.040.22 ± 0.551.41 ± 0.910.000 *
NAS Inflammation Grade1.00 ± 1.112.27 ± 1.741.50 ± 1.392.73 ± 1.49 0.001 *
Table providing patients’ characteristics at inclusion, stratified by overweight and current alcohol misuse. Data are presented as mean ± standard deviation. p values were calculated with Kruskal-Wallis Test. p values below 0.05 were considered statistically significant (*). Abbreviations: HbA1c—glycated hemoglobin; NAS—NAFLD Activity Score.
Table 2. Characteristics of control Mice (Ctrl) and those treated with ethanol (EtOH), Western Diet (WD) or both (WD/EtOH).
CharacteristicCtrl
(n = 5)
EtOH
(n = 5)
WD
(n = 5)
WD/EtOH
(n = 5)
p Value
Data at sacrifice
Body weight, g, mean ± SD27.3 ± 1.226.6 ± 1.229.1 ± 1.0026.8 ± 1.840.050 *
Liver weight, g, mean ± SD1.41 ± 0.131.40 ± 0.081.37 ± 0.111.65 ± 0.280.097
Table providing animals’ body and liver weight after seven weeks of treatment at the date of sacrifice at the age of 19 weeks. Data are presented as mean ± standard deviation. p Values were calculated with Kruskal-Wallis Test. p-Values below 0.05 (*) were considered statistically significant.
Publisher’s Note: MDPI stays neutral with regard to jurisdictional claims in published maps and institutional affiliations.