Article

Protein Catabolism and the Dysregulation of Energy Intake-Related Hormones May Play a Major Role in the Worsening of Malnutrition in Hospitalized Cirrhotic Patients

1
Department of Experimental Medicine, Sapienza University of Rome, 00161 Rome, Italy
2
Department of Translational and Precision Medicine, Sapienza University of Rome, 00161 Rome, Italy
*
Author to whom correspondence should be addressed.
Livers 2022, 2(3), 158-170; https://doi.org/10.3390/livers2030014
Submission received: 27 June 2022 / Revised: 28 July 2022 / Accepted: 2 August 2022 / Published: 18 August 2022

Abstract

:
Malnutrition in cirrhotic patients is extremely common and has a multifactorial aetiology, whose constitutive elements have not been completely elucidated yet. Protein depletion is particularly important and an imbalance of hormones regulating hunger and satiety may be an important additive factor. The diagnosis and treatment of malnutrition are extremely important since malnutrition is associated with higher complication rates and mortality. Our observational study aimed to study protein status and energy intake-related hormone levels in a cohort of hospitalized cirrhotic patients. We enrolled 50 hospitalized and clinically stable cirrhotic patients and assessed their nutritional status with anthropometric measurements and nitrogen balance. In a subgroup of 16 patients and 10 healthy controls, circulating ghrelin and leptin levels were studied. We observed that 60% of our patients were malnourished on the basis of the mid-arm muscle circumference values; the recorded daily protein intake was tendentially insufficient (mean protein intake of 0.7 ± 0.5 g protein/kg vs. recommended intake of 1.2–1.5 g of protein/kg/die). Cirrhotic patients had lower circulating levels of both ghrelin and leptin compared to healthy controls. In conclusion, hospitalized cirrhotic patients face a catabolic state and an imbalance in hormones regulating food intake and satiety, and these elements may play a major role in the genesis and/or the worsening of malnutrition.

1. Introduction

Malnutrition is extremely common in cirrhotic patients, especially in the advanced stages of liver disease. It has been estimated that its prevalence varies between 20 and 90% [1,2,3,4], and this quite wide range reflects the difficulties in its assessment, the heterogeneity of the methods and the different clinical stages of liver disease, since the prevalence of malnutrition increases as liver function gets worse [2,5]. It is characterized by a progressive loss of muscle mass and strength [6,7], thereby configuring a condition of sarcopenia [8]. Malnutrition in liver cirrhosis recognizes a multifactorial aetiology that includes low energy intake (mainly due to loss of appetite and early satiety for low stomach compliance), gastrointestinal symptoms [9,10] and the metabolic impairment typical of liver disease [11,12]. Malnutrition is independent of the aetiology of cirrhosis [13,14]. On the other hand, it may lead to different patterns of fat and lean mass loss [1,15].
The assessment of nutritional status is extremely important because malnutrition is associated with a higher rate of complications [16,17], such as infections [18] and hepatic encephalopathy [19,20] that may lead to a substantial increase in the length of hospitalization and, consequently, health costs [18]. It also leads to a worse outcome after liver transplant and longer staying in intensive care units [3,21] and it is associated with higher and early mortality [22,23], so it can be considered a negative prognostic factor. Sarcopenia itself is predictive of longer hospital stays after liver transplantation [24], mortality [7,23,25] and hepatic encephalopathy [19,20,26] and it is associated with a higher risk of perioperative bacterial infections after liver transplantation [24], so that it has been proposed to be included in the MELD staging [27].
The nutritional assessment in cirrhosis is challenging because of the alterations in body composition typical of liver disease, such as fluid retention that affect the use of traditional methods. Direct methods for measuring body composition and the muscle area, such as DEXA [3,28] and CT [28,29], are not always applicable in daily clinical practice. On the contrary, anthropometric measurements are reliable non-invasive and cost-effective bedside tools, widely used in clinical practice and for research aims [5,28,30,31]. The mid-arm muscle circumference (MAMC) gives a quick evaluation of the muscle mass. Tests aimed to recognize precocious strength alterations have high sensitivity to evaluate the presence of malnutrition [3,32]. The handgrip strength test (HG) is widely recognized as a reliable and easy-to-access bedside tool to evaluate muscle function [1,3,30,31,33]. Muscle function tests have been associated with waitlist mortality, so they may be preferred to muscle mass evaluation with CT [34].
Nitrogen balance estimates the protein metabolism of a patient, and it is negative because of reduced protein intake or increased nitrogen excretion, due to protein catabolism for inadequate energy intake. Diet should guarantee the appropriate intake of essential amino acids to allow protein synthesis, but in cirrhotic patients, both protein and energy intake are often insufficient. In addition, cirrhotic patients are prone to a catabolic state [11,12] because of the metabolic impairment of the liver, whose glycogen storage is compromised.
Ghrelin and leptin are two protein hormones that play a key role in regulating energy intake and hunger and satiety sensations. Ghrelin is mainly produced by the neuroendocrine cells of the stomach [35,36,37]. Its plasmatic level rises before meals and falls about an hour later [38,39], reflecting its function of stimulating appetite, food-seeking behavior and food assumption [40,41]. Leptin is mainly produced in the adipose tissue by the expression of the ob gene [42]. Its function is to reduce appetite and stimulate energy expenditure [43], so its levels rise after meals to induce satiety. Plasma ghrelin and leptin levels have been studied in cirrhotic patients in recent years, for the possible implications with nutritional status [44,45,46,47,48], but results are not univocal.
The study was aimed at investigating the nutritional status of a cohort of hospitalized cirrhotic patients, focusing on muscle mass and strength using tools widely available in routine clinical practice and its relationship with nitrogen balance and plasma ghrelin and leptin levels.

2. Materials and Methods

2.1. Patients

We enrolled 70 cirrhotic patients, hospitalized in the Gastroenterology Unit at the University Hospital Umberto I Policlinic, Rome. In total, 20 of them were excluded because of inaccurate 24-h urine collection, for a final sample of 50 cirrhotic patients. The diagnosis of liver cirrhosis was established histologically or on the basis of its clinical, laboratory, endoscopic or imaging features, or both. The severity of liver disease was assessed according to the Child-Pugh and the Model for End-Stage Liver Disease scores [49].
Patients with insulin-dependent diabetes mellitus, tense ascites, concomitant acute complications (such as gastrointestinal bleeding, hepatic encephalopathy, hepatorenal syndrome or acute kidney failure) and patients with low compliance were excluded. Patients with clinically evident ascites and fluid retention were enrolled after treatment (paracentesis or diuretic therapy) and patients admitted for acute events were included after the resolution of the acute episodes.
This study was approved by the Ethics Committee of the Sapienza University of Rome (RIF.CE: 5068) and informed consent was obtained from all subjects. The investigation conformed to the principles outlined in the Declaration of Helsinki.

2.2. Anthropometric Measurements and Definition of Malnutrition

Bodyweight was expressed in kilograms (kg) and obtained in the morning, in a fasting state, with subjects wearing light clothing and without shoes, using the same calibrated scale. Height was measured with an altimeter, without shoes, and expressed in centimeters (cm). Body mass index (BMI) was calculated with the formula weight (kg)/height(m)2. Mid-arm circumference (MAC) was measured with an inextensible tape on the non-dominant arm, at the midpoint between the acromion and olecranon. Skin folds were measured using a skinfold caliper Harpenden (John Bull British Indicator Ltd., England) on the non-dominant arm, flexed at a 90-degree angle, at the midpoint between the acromion and olecranon. The average value of three consecutive measurements was recorded. All measurements were obtained by the same operator to minimize variability. The mid-arm muscle circumference (MAMC) was calculated with the following formula:
MAMC (cm) = MAC − π TSF (cm)
where TSF = triceps skin fold thickness and π = 3.14.
Malnutrition was defined when MAMC was below the 5th percentile of a population matched for age and sex [50].

2.3. Muscle Function Evaluation

Handgrip strength test was performed with a Jamar dynamometer (Sammons Preston Rolyan Inc., Chicago, IL, USA). Patients were seated, with the elbow of the non-dominant arm flexed at a 90-degree angle and the wrist in a neutral position. A triplicate assessment was performed, and the average value was recorded. All measurements were obtained by the same operator to minimize variability.

2.4. Nitrogen Balance Evaluation

The urine nitrogen excretion was evaluated on the 24-h urine collection on the same day as the diet evaluation, and the urine assays were performed in the central laboratory of the hospital. Patients were encouraged to eat freely. To assess their protein intake, we recorded their food intake, and the 24-h protein intake was calculated on the basis of the tables of the National Institute of Nutrition, the program Winfood and the reported bromatological composition for packed food. Nitrogen balance was calculated with the following formula:
Nbal = [protein intake (mg)/6.25] − Urine Urea Nitrogen (mg) − 5 mg/kg − 12 mg/kg
That takes into account the excretion with the feces (estimated at 12 mg/kg) [51,52,53,54] and the other miscellaneous sources of loss, as sweat, skin desquamation, hair and nail growth, respiration and salivary losses (estimated in 5 mg/kg) [55,56].

2.5. Ghrelin and Leptin Assays

We measured fasting plasma ghrelin and leptin level in a subgroup of 16 cirrhotic patients, randomly chosen among our enrolled cirrhotic patients, and 10 healthy volunteers enrolled among health professionals, matched for age, sex, weight and BMI. All blood samples were drawn from a peripheral vein at 8:00–9:00 a.m. after overnight fasting; the blood samples for the detection of ghrelin were immediately treated with Aprotinin (Phoenix Pharmaceuticals, Inc., Burlingame, CA, USA). All samples were separated by centrifugation at 4 °C and stored at −80 °C until assay. Plasma total ghrelin concentrations were measured by a commercially available EIA kit (Phoenix Pharmaceuticals, Inc., Burlingame, CA, USA). Plasma leptin levels were measured by a commercially available ELISA kit (DRG International, Inc., Springfield, NJ, USA). Each sample was measured in triplicate.

2.6. Statistical Analysis

All continue values are reported as means ± SD or percentage. p values < 0.05 were considered as significant. Shapiro-Wilk test has been used to assess normal distribution, and data were compared using Student t-test or Mann-Whitney u-test, and Chi-square test. The correlation among variables was obtained using two-tailed Pearson and Spearman correlation. Statistical analyses were performed using SPSS version 25 (IBM software, Chicago, IL, USA) and GraphPad Prism 8.0 software package (GraphPad Software, Inc., La Jolla, CA, USA).

3. Results

3.1. Characteristics of the Population

The characteristics of our patients are reported in Table 1. More than half of the patients were malnourished, according to a MAMC below the 5° percentile.
The differences in the anthropometric parameters and muscle function among nourished and malnourished patients are summarized in Table 2. Among malnourished patients, 85% were in the condition of advanced liver disease (CHILD B or C).

3.2. Nitrogen Balance

Spontaneous protein intake and nitrogen balance are reported in Table 3.
Protein intake, expressed in g/kg, did not differ among patients with and without protein malnutrition (p = 0.44), and it was lower than 1.2 g/kg, as guidelines suggest for cirrhotic patients, to be increased to 1.5 g/kg for malnourished/sarcopenic cirrhotic patients [1,57]. The amount of protein intake was not influenced by the severity of the liver disease.
Nitrogen balance presented with great variability among subjects, but anyway most patients had a negative balance. Nitrogen balance was not influenced by gender or nutritional status.

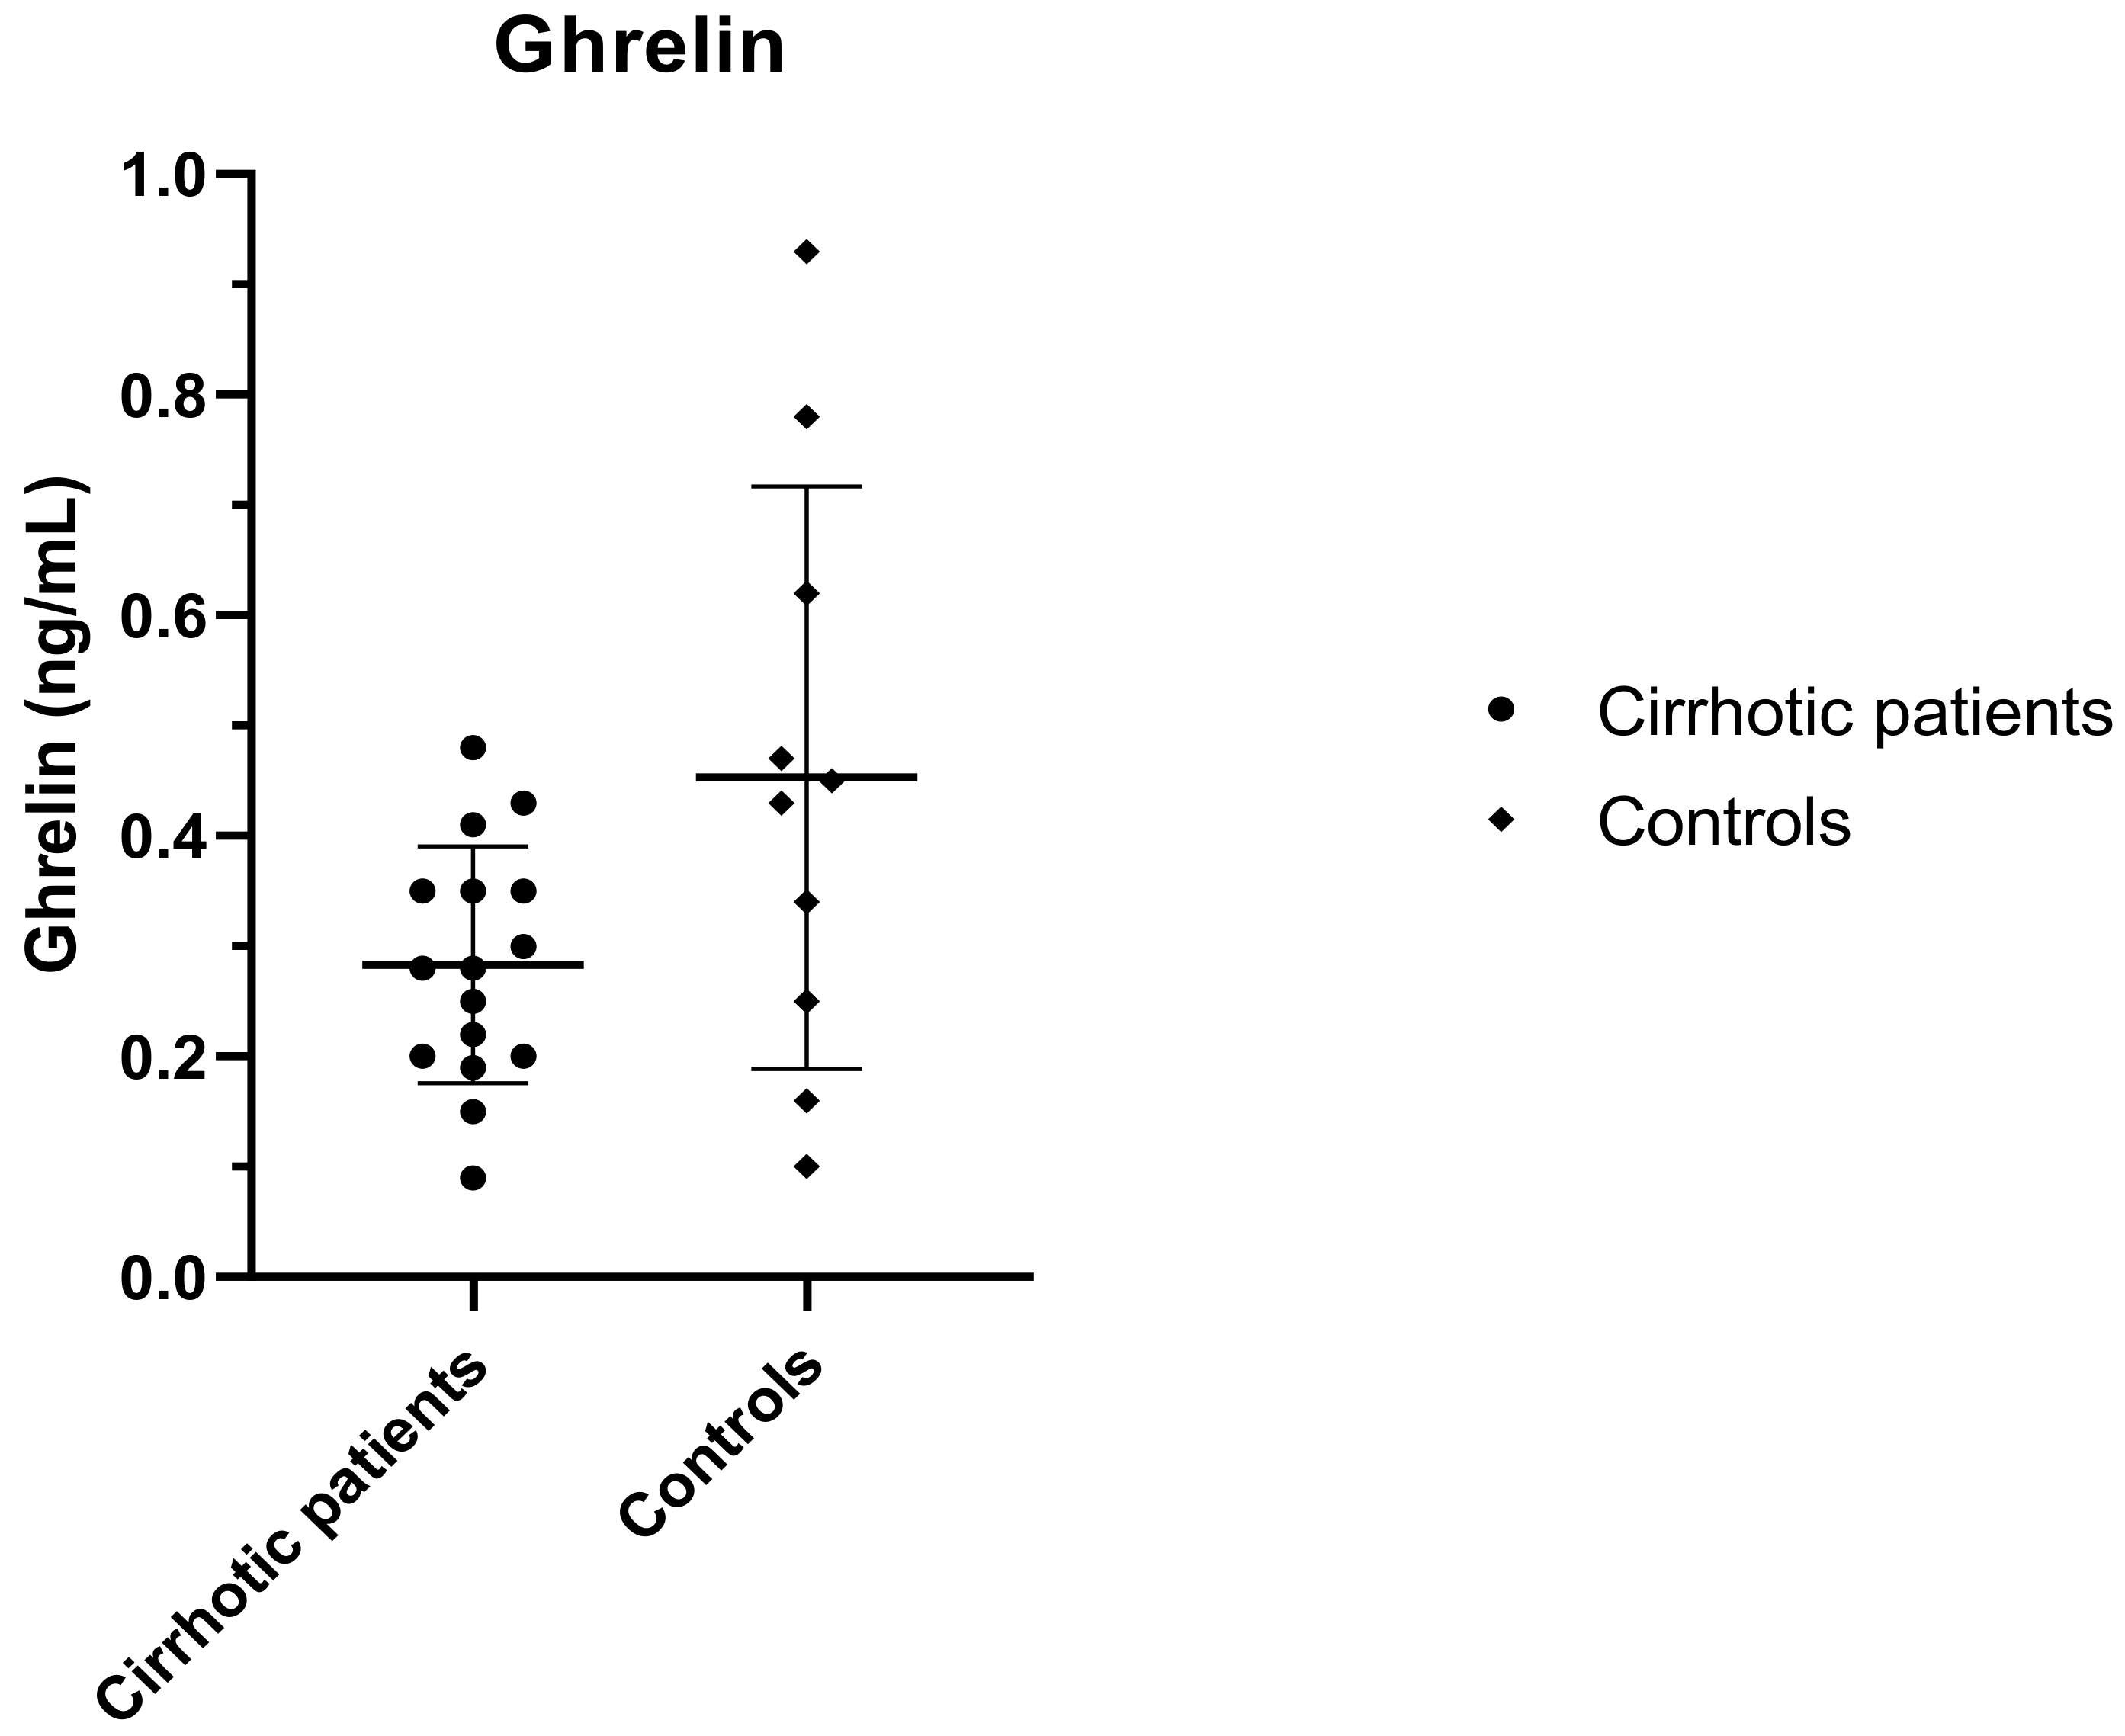
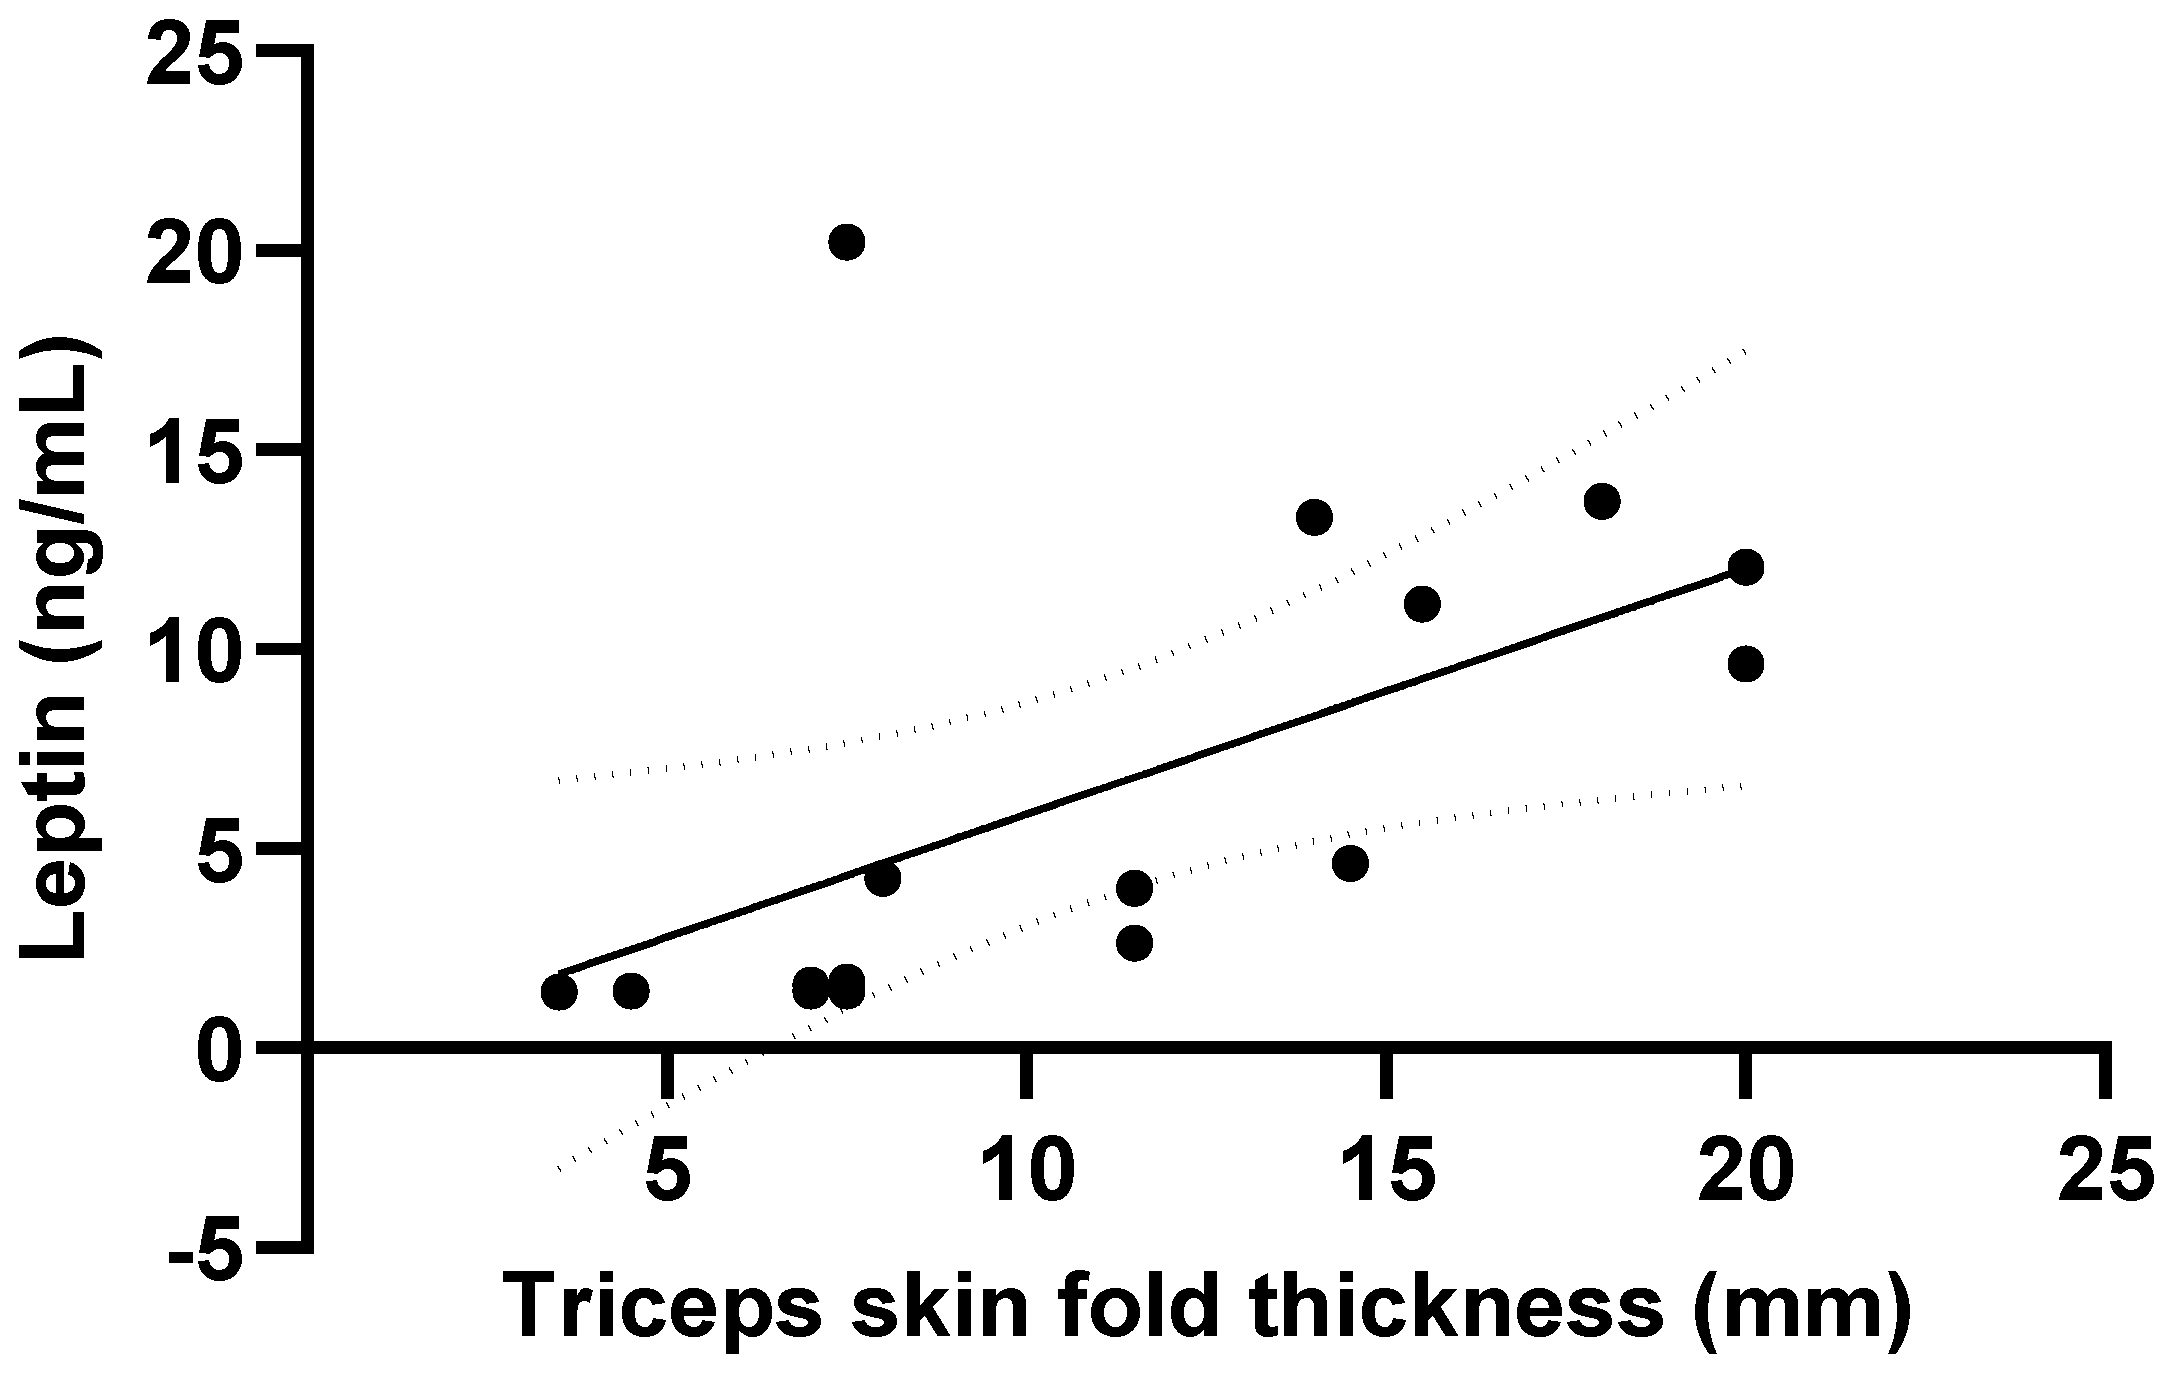
3.3. Ghrelin and Leptin

The healthy controls were matched to the patients by gender, age and BMI. The average age was 56 ± 12 years and the average BMI was 24.1 ± 2.6 kg/m2.
The liver function tests of the healthy controls were all normal.
The cirrhotic subgroup reflected our entire cohort: there were no statistical differences in terms of age, BMI, skinfold thickness, HG, nitrogen balance and CHILD value in comparison with other cirrhotic patients.
In this cirrhotic subgroup, the average HG was 22.8 ± 10 kg, the average MAC was 26.78 ± 3.05 cm and the average triceps skinfold thickness and biceps skinfold thickness were respectively 11 ± 5.3 and 5.9 ± 3.6 mm.
The characteristics of the subpopulation of cirrhotic patients are described below. The etiology of the liver disease was alcoholic (four patients), HCV (four patients), alcohol plus HCV (two patients), HBV and HDV (one patient), autoimmunity (two patients), hemochromatosis plus alcohol (one patient), NASH (one patient) or cryptogenic (one patient). Patients with alcoholic cirrhosis had been abstinent for ≥1 month at inclusion (15/16 patients had been abstinent for ≥6 months). Patients had been admitted to the hospital because of ascites and fluid overload (25%), jaundice (12%), gastrointestinal hemorrhage (18%), interventional procedure (19%) or other reasons (anemia, fever, severe insomnia due to IFN and ribavirin therapy, worsening of general condition). All patients had undergone upper GI endoscopy, which showed the presence of esophageal varices in six patients, congestive gastropathy in three patients and both in two patients. The average MELD value was 15.8 ± 7.9.
Within this group, eight patients were malnourished (six men and two women) and eight were well-nourished (four men and four women).
Plasma ghrelin levels were lower in cirrhotic patients compared to healthy volunteers (p < 0.09) (Figure 1). Ghrelin levels were not affected by nutritional status nor severity of liver disease (Child–Pugh Class C and MELD ≥ 15) but correlated with nitrogen balance (p = 0.049, r = 0.55).
Leptin levels in cirrhotic patients were significantly lower than controls (p = 0.02) (Figure 2). Leptin levels in cirrhotic patients were directly correlated to triceps and biceps skinfold thickness (p < 0.001; r = 0.76 and r = 0.85) (Figure 3), BMI (p = 0.002; r = 0.70) and MAMC (p = 0.48; r = 0.50) and were not affected by the severity of the liver disease.
We did not observe statistically different ghrelin and leptin levels comparing nourished and malnourished cirrhotic patients.

4. Discussion and Conclusions

We defined nutritional status with MAMC, which is based on anthropometric measurements that are reliable, cost-effective, and easy to manage in a clinical context. In our population, 60% of the subjects were malnourished, and this percentage is in line with the literature. Almost 80% of our cohort was in an advanced stage of liver disease (Child B and C). We did not find any significant difference in nutritional status among different etiologies of liver disease or the degree of hepatic dysfunction, as other authors observed [13,14,58]. This result may be explained by our inclusion criteria, which excluded patients presenting with hepatic encephalopathy, tense ascites or with acute and severe conditions. In our cohort, BMI was always in the normal-weight range or mildly elevated, probably because of fluid retention, even if not clinically detectable. This confirms once more that BMI cannot be used as a reliable marker of nutritional status in cirrhotic patients. Muscle mass and function are extremely important for the prognosis of cirrhosis. HG has been found to predict poor outcomes better than other malnutrition methods, such as Subjective Global Assessment (SGA) and anthropometry [32], so it has been proposed for predicting survival among patients awaiting liver transplantation [3]. Some of our non-malnourished male patients already had an HG below the tenth percentile, which is a proposed reliable cut-off [59], confirming that muscle function reduction often precedes mass loss.
The nutritional status is directly related to caloric intake and nitrogen balance. Campillo et al. [60] reported that the spontaneous caloric and protein intake tended to be reduced in parallel with the worsening of the liver disease in their cohort of 396 cirrhotic hospitalized patients, and similarly, Huynh et al. [61] observed that caloric and protein intake was significantly reduced in malnourished patients in their cohort of 231 hospitalized cirrhotic patients. We observed that the amount of protein intake was similar in our cohort, no matter the nutritional status and gender, and it was about 0.72 g/kg. Therefore, the protein intake pro kg resulted broadly insufficient considering the current ESPEN guidelines, which recommend a daily intake of 1.2 g/kg of protein in non-malnourished patients with compensated cirrhosis, and 1.5 g/kg to replenish malnourished and/or sarcopenic cirrhotic patients [1]. Anyway, we can assume that, similar to what was reported in other studies [56,62], the reduction in protein intake was also related to hospitalization per se, which is associated with the worsening of clinical conditions, anxiety, pain, changes in hours and habits and low palatability of the diet provided by the hospital. A Danish study [62] found that, in a cohort of 830 malnourished hospitalized patients, only 2.6% of them had an adequate protein intake. This was related to nausea and other cancer-related symptoms that are similar to the symptoms experienced by cirrhotic patients. In these cases, spontaneous food intake is decreased and giving supplements should be considered. Nitrogen balance is a dynamic score that tends to overestimate intake and underestimate losses [53,63]. We observed a wide range of results, with a strong tendency towards the catabolic state in most of our patients, independently of gender, nutritional status and Child–Pugh score. The negative balance is to be ascribed to low protein intake and higher protein catabolism, with consequent high nitrogen excretion. It is known that cirrhotic patients need an increased intake of protein to achieve neutral/positive nitrogen balance [30,64,65,66,67]. Nitrogen balance is strictly related to the protein intake on the day of the evaluation; we chose for each clinically stable patient a “normal” day during hospitalization, so we are confident it can reliably reflect the average balance during hospitalization. On the basis of our results, the majority of hospitalized cirrhotic patients are in a condition of protein catabolism. In addition, it is known from the literature that a time frame from 5 to more than 14 days is necessary to completely modify the nitrogen balance [63,68], so the majority of our patients, who entered the ward less than 10 days before our enrollment, probably faced a condition of protein catabolism in the outpatient setting, and in this study, we did not see the worsening of the situation due to hospitalization in its full power. These data are interesting because they highlight that non-malnourished patients are already facing a silent condition of muscle mass depletion. Therefore, a hospital stay may represent a time of important depletion of muscle mass and strength, which is difficult to regain and can worsen their clinical condition.
For what concerns ghrelin and leptin levels, much evidence suggests that their secretion is impaired in cirrhosis, and both hormones have been proposed as markers of malnutrition in cirrhosis [44,69,70], and therefore a possible prognostic factor for survival [69]. Similarly to other authors [71], we observed that cirrhotic patients had lower plasma ghrelin levels compared to healthy controls. The reduction of ghrelin levels after 12 h of fasting suggests an alteration of the secretion of the hormone, whose production should increase in the case of a negative energy balance to stimulate food consumption. The reduced ghrelin secretion could represent a possible cause of anorexia [71], causing the reduction of food-seeking behavior and food intake in cirrhotic patients, and therefore could be considered among the causes of malnutrition in cirrhotic patients. Ghrelin levels have been observed to remain lower after an oral glucose tolerance test [47,71]. We did not find any significant correlation between ghrelin levels and the severity of liver disease, similar to other authors [44,48]. Other studies observed no significant differences in fasting ghrelin levels between cirrhotic patients and controls [44,47,48] or between nourished and malnourished patients [70]. A trend of increased levels along the anorexia/hunger scale was observed [48], but the results are not concordant [70]. Some authors observed a negative correlation between ghrelin levels and leptin levels [44,46], so that their physiologic action as counterparts was preserved [44,72]. On the other hand, other authors observed high ghrelin levels in cirrhotic patients [46,69,72,73,74,75], especially in Class C of Child–Pugh [46,69,72,75]. Higher ghrelin levels were also observed post-prandially [74], while other authors observed a preserved post-prandial response [73]. The high ghrelin levels, which remain ineffective, are possibly related to a desensitization of the hypothalamic ghrelin receptors [69] and were hypothesized to be a compensatory mechanism [48,69], related to a condition of ghrelin resistance, which may explain the anorexia and the catabolic state of cirrhotic patients [73].
Plasma leptin levels were significantly lower in our cohort of cirrhotic patients with respect to healthy controls, as was found by other authors [72,76,77]. Rieger et al. [76] studied patients affected by primary biliary cirrhosis, and similarly to us and other authors [70,78], he did not observe any correlation with the severity of the liver disease. Women tend to have higher leptin levels than men [78,79,80,81]. We observed that malnourished women have a significant reduction in circulating leptin compared to well-nourished women, and this could be explained by the important reduction in fat mass that malnourished female patients face [30]. Some authors observed that high leptin levels were peculiar to cirrhotic women in their cohort, but when expressed per kilogram of fat mass, all cirrhotic patients had higher leptin levels compared to controls [79]. On the contrary, Rachakonda et al. [70] observed reduced levels of leptin in malnourished cirrhotic patients but did not find any differences between men and women. On the contrary, other authors found no differences between cirrhotic patients and controls [78,80], or differences related to gender and the etiology of liver disease [77] and others found high leptin levels in cirrhotic patients [47,79,81,82], especially in Child C patients [81]. Onodera Kana et al. [78] studied the 24-h profile of leptin in cirrhotic patients and observed that its level was similar to diabetic subjects in the early morning. Then the profile of leptin changed significantly in cirrhosis and a significant increase was observed before midday meal, and this persisted until the middle of the night. The cause is not clear. It may be related to a reduction in the clearance of leptin or to an alteration in the circadian rhythm. Similarly to other authors [70,78], we observed a significant correlation between the circulating levels of leptin and triceps skinfold thickness, as the depletion of fat mass deposits determines a significant reduction of the production sites of leptin. Ockenga et al. [45] observed similar levels of free leptin in cirrhotic patients and controls, but bound leptin was higher in cirrhotic patients and positively correlated with energy expenditure. Celinski et al. [74] observed that ghrelin and leptin were higher in cirrhotic patients both in fasting conditions and post-prandially with respect to the healthy controls. Kalaitzakis et al. [47] found that leptin levels were higher in cirrhotic patients with respect to the controls, while ghrelin levels were non-significantly lower in cirrhotic patients, and their post-prandial response was altered. The pathophysiological role of adipokines in liver cirrhosis is still unclear; they are released from adipose tissue deposits, and both increased and reduced adipose tissue deposits play a role in disease progression [83]. The reduction in leptin production should indirectly determine, as it happens in physiological conditions, a stronger seeking for food to restore energy homeostasis, but this does not happen in the real setting, probably due to the other mechanisms at the basis of malnutrition in cirrhosis. At the same time, hyperleptinemia, which was observed in other studies, could also be involved in the genesis of malnutrition, considering its role in inducing satiety. We observed that both ghrelin and leptin are reduced in cirrhotic patients; therefore, their balance in regulating hunger and satiety was lost. We preliminarily studied hunger and satiety in a subgroup of our cohort using a visual analogue scale. The results were quite wide, but anyway, most patients had low levels of hunger before lunch and reported no hunger following the meal and 2 h later, and most of them were satiated but often nonsatisfied. These results reflect the alterations in satiety and hunger perceptions in these patients.
One limitation of our study is related to the definition of malnutrition according to anthropometric parameters that are dependent on the operator. Anyway, to avoid interpersonal differences, all the measurements were taken by the same operator. We deliberately chose to use tools widely available in routine clinical practice to replicate an average hospital clinical setting. Another limitation was the small number of patients we evaluated for ghrelin and leptin levels, and just in fasting conditions. Hospitalized cirrhotic patients often have more advanced liver disease and are more likely to be catabolic. The comparison with a control group of non-hospitalized cirrhotic patients would ideally provide very interesting information, but a strong limitation would be that important data and the collection of some biological samples would be demanded from the patients in their home setting. Nitrogen balance evaluation, for example, would be affected by the reliability of the dietary recall and the accuracy of urine collection. As a strong point, we evaluated the nitrogen balance in a considerable number of hospitalized cirrhotic patients, obtaining precious information about the protein depletion that patients face during hospitalization.
In conclusion, protein depletion is strongly prevalent in hospitalized cirrhotic patients, and hospitalization can be considered a worsening event for nutritional status, as documented by the negative nitrogen balance in most patients. Muscle depletion accompanies muscle function reduction, easily evaluated at the bedside by the Handgrip Strength Test. Similarly to other authors, we observed that ghrelin and leptin levels are altered in cirrhotic patients, and these disruptions may play a role in the reduction of caloric intake. These data must encourage nutritional support for cirrhotic patients during hospitalization, even for the well-nourished ones, to prevent the development of sarcopenia. Further studies are warranted to elucidate the complex hormonal modifications that accompany liver cirrhosis, potentially worsening the nutritional status and therefore the prognosis of the patients.

Author Contributions

Conceptualization, E.G. and M.M.; methodology, E.G. and M.M.; investigation, E.G.; data curation, E.G. and M.M.; writing—original draft preparation, E.G.; writing—review and editing, L.G. and M.M. All authors have read and agreed to the published version of the manuscript.

Funding

This research was funded by the Italian Ministry of Education, University and Research PRIN 2017 and PRIN 2020, grants numbers 2017RS5M44_002, 2017L8Z2EM_005 and 2020NCKXBR_002. The funders had no role in the study design; decision to publish; or preparation of the manuscript.

Institutional Review Board Statement

The study was conducted according to the guidelines of the Declaration of Helsinki, and approved by the Ethics Committee of Sapienza University, Umberto I university policlinic.

Informed Consent Statement

Informed consent was obtained from all subjects involved in the study.

Data Availability Statement

The data presented in this study are available on request from the corresponding author.

Conflicts of Interest

The authors declare no conflict of interest.

References

  1. Plauth, M.; Bernal, W.; Dasarathy, S.; Merli, M.; Plank, L.D.; Schütz, T.; Bischoff, S.C. ESPEN guideline on clinical nutrition in liver disease. Clin. Nutr. 2019, 38, 485–521. [Google Scholar] [CrossRef]
  2. Cheung, K.; Lee, S.S.; Raman, M. Prevalence and mechanisms of malnutrition in patients with advanced liver disease, and nutrition management strategies. Clin. Gastroenterol. Hepatol. 2012, 10, 117–125. [Google Scholar] [CrossRef] [PubMed]
  3. Daphnee, D.K.; John, S.; Vaidya, A.; Khakhar, A.; Bhuvaneshwari, S.; Ramamurthy, A. Hand grip strength: A reliable, reproducible, cost-effective tool to assess the nutritional status and outcomes of cirrhotics awaiting liver transplant. Clin. Nutr. ESPEN 2017, 19, 49–53. [Google Scholar] [CrossRef]
  4. McFarlane, M.; Hammond, C.; Roper, T.; Mukarati, J.; Ford, R.; Burrell, J.; Gordon, V.; Burch, N. Comparing assessment tools for detecting undernutrition in patients with liver cirrhosis. Clin. Nutr. ESPEN 2018, 23, 156–161. [Google Scholar] [CrossRef]
  5. Carvalho, L.; Parise, E.R. Evaluation of nutritional status of nonhospitalized patients with liver cirrhosis. Arq. Gastroenterol. 2006, 43, 269. [Google Scholar] [CrossRef] [PubMed]
  6. Dasarathy, S. Consilience in sarcopenia of cirrhosis. J. Cachexia Sarcopenia Muscle 2012, 3, 225–237. [Google Scholar] [CrossRef]
  7. Hanai, T.; Shiraki, M.; Nishimura, K.; Ohnishi, S.; Imai, K.; Suetsugu, A.; Takai, K.; Shimizu, M.; Moriwaki, H. Sarcopenia impairs prognosis of patients with liver cirrhosis. Nutrition 2015, 31, 193–199. [Google Scholar] [CrossRef]
  8. Cruz-Jentoft, A.J.; Bahat, G.; Bauer, J.; Boirie, Y.; Bruyère, O.; Cederholm, T.; Cooper, C.; Landi, F.; Rolland, Y.; Sayer, A.A.; et al. Sarcopenia: Revised European consensus on definition and diagnosis. Age Aging 2019, 48, 16–31. [Google Scholar] [CrossRef] [PubMed]
  9. Williams, R.; O’Brien, A. Nutrition in end-stage liver disease: Principles and practice. Gastroenterology 2008, 134, 1729–1740. [Google Scholar]
  10. Kalaitzakis, E.; Simrén, M.; Olsson, R.; Henfridsson, P.; Hugosson, I.; Bengtsson, M.; Björnsson, E. Gastrointestinal symptoms in patients with liver cirrhosis: Associations with nutritional status and health-related quality of life. Scand. J. Gastroenterol. 2006, 41, 1464–1472. [Google Scholar] [CrossRef]
  11. Owen, O.E.; Reichle, F.A.; Mozzoli, M.A.; Kreulen, T.; Patel, M.S.; Elfenbein, I.B.; Golsorkhi, M.; Chang, K.H.; Rao, N.S.; Sue, H.S.; et al. Hepatic, gut, and renal substrate flux rates in patients with hepatic cirrhosis. J. Clin. Investig. 1981, 68, 240–252. [Google Scholar] [CrossRef] [PubMed]
  12. Owen, O.E.; Trapp, V.E.; Reichard, G.A.; Mozzoli, M.A.; Moctezuma, J.; Paul, P.; Skutches, C.L.; Boden, G. Nature and quantity of fuels consumed in patients with alcoholic cirrhosis. J. Clin. Investig. 1983, 72, 1821–1832. [Google Scholar] [CrossRef] [PubMed]
  13. Caregaro, L.; Alberino, F.; Amodio, P. Malnutrition in alcoholic and virus-related cirrhosis. Am. J. Clin. Nutr. 1996, 63, 602–609. [Google Scholar] [CrossRef]
  14. Lautz, H.U.; Selberg, O.; Körber, J.; Bürger, M.; Müller, M.J. Protein-caloric malnutrition in liver cirrhosis. Clin. Investig. 1992, 70, 478–486. [Google Scholar] [CrossRef]
  15. Sarin, S.K.; Dhingra, N.; Bansal, A. Dietary and nutrition abnormalities in alcoholic liver disease: A comparison with chronic alcoholics without liver disease. Am. J. Gastroenterol. 1997, 92, 777–783. [Google Scholar]
  16. Sinclair, M.; Gow, P.J.; Grossmann, M.; Angus, P.W. Sarcopenia in cirrhosis—Etiology, implications and potential therapeutic interventions. Aliment. Pharmacol. Ther. 2016, 43, 765–777. [Google Scholar] [CrossRef]
  17. Dunn, M.A.; Josbeno, D.A.; Tevar, A.D.; Rachakonda, V.; Ganesh, S.R.; Schmotzer, A.R.; Kallenborn, E.A.; Behari, J.; Landsittel, D.P.; DiMartini, A.F.; et al. Frailty as Tested by Gait Speed is an Independent Risk Factor for Cirrhosis Complications that Require Hospitalization. Am. J. Gastroenterol. 2016, 111, 1768–1775. [Google Scholar] [CrossRef]
  18. Merli, M.; Lucidi, C.; Giannelli, V.; Giusto, M.; Riggio, O.; Falcone, M.; Ridola, L.; Attili, A.F.; Venditti, M. Cirrhotic patients are at risk for health care-associated bacterial infections. Clin. Gastroenterol. Hepatol. 2010, 8, 979–985.e1. [Google Scholar] [CrossRef] [PubMed]
  19. Lattanzi, B.; D’Ambrosio, D.; Merli, M. Hepatic Encephalopathy and Sarcopenia: Two Faces of the Same Metabolic Alteration. J. Clin. Exp. Hepatol. 2019, 9, 125–130. [Google Scholar] [CrossRef] [PubMed]
  20. Nardelli, S.; Lattanzi, B.; Torrisi, S.; Greco, F.; Farcomeni, A.; Gioia, S.; Merli, M.; Riggio, O. Sarcopenia Is Risk Factor for Development of Hepatic Encephalopathy After Transjugular Intrahepatic Portosystemic Shunt Placement. Clin. Gastroenterol. Hepatol. 2017, 15, 934–936. [Google Scholar] [CrossRef]
  21. Merli, M.; Giusto, M.; Gentili, F.; Novelli, G.; Ferretti, G.; Riggio, O.; Corradini, S.G.; Siciliano, M.; Farcomeni, A.; Attili, A.F.; et al. Nutritional status: Its influence on the outcome of patients undergoing liver transplantation. Liver Int. 2010, 30, 208–214. [Google Scholar] [CrossRef] [PubMed]
  22. Srivastava, S.; Maharshi, S.; Sharma, B.C. Malnutrition in cirrhosis increases morbidity and mortality. J. Gastroenterol. Hepatol. 2015, 30, 1507–1513. [Google Scholar]
  23. Ishizu, Y.; Ishigami, M.; Kuzuya, T.; Honda, T.; Hayashi, K.; Ishikawa, T.; Hirooka, Y.; Goto, H. Low skeletal muscle mass predicts early mortality in cirrhotic patients with acute variceal bleeding. Nutrition 2017, 42, 87–91. [Google Scholar] [CrossRef] [PubMed]
  24. Montano-Loza, A.J.; Meza-Junco, J.; Baracos, V.E.; Prado, C.M.; Ma, M.; Meeberg, G.; Beaumont, C.; Tandon, P.; Esfandiari, N.; Sawyer, M.B.; et al. Severe muscle depletion predicts postoperative length of stay but is not associated with survival after liver transplantation. Liver Transplant. 2014, 20, 640–648. [Google Scholar] [CrossRef]
  25. Kaido, T.; Tamai, Y.; Hamaguchi, Y.; Okumura, S.; Kobayashi, A.; Shirai, H.; Yagi, S.; Kamo, N.; Hammad, A.; Inagaki, N.; et al. Effects of pretransplant sarcopenia and sequential changes in sarcopenic parameters after living donor liver transplantation. Nutrition 2017, 33, 195–198. [Google Scholar] [CrossRef] [PubMed]
  26. Chang, K.V.; de Chen, J.; Wu, W.T.; Huang, K.C.; Lin, H.Y.; Han, D.S. Is sarcopenia associated with hepatic encephalopathy in liver cirrhosis? A systematic review and meta-analysis. J. Formos. Med. Assoc. 2018, 118, 833–842. [Google Scholar] [CrossRef]
  27. van Vugt, J.L.A.; Alferink, L.J.M.; Buettner, S.; van den Berg, A.P.; Metselaar, H.J.; Jzermans, J.N.M.I. A model including sarcopenia surpasses the MELD score in predicting waiting list mortality in cirrhotic liver transplant candidates: A competing risk analysis in a national cohort. J. Hepatol. 2018, 68, 707–714. [Google Scholar] [CrossRef] [PubMed]
  28. Giusto, M.; Lattanzi, B.; Albanese, C.; Galtieri, A.; Farcomeni, A.; Giannelli, V.; Lucidi, C.; Di Martino, M.; Catalano, C.; Merli, M. Sarcopenia in liver cirrhosis: The role of computed tomography scan for the assessment of muscle mass compared with dual-energy X-ray absorptiometry and anthropometry. Eur. J. Gastroenterol. Hepatol. 2015, 27, 328–334. [Google Scholar] [CrossRef]
  29. Anand, A.C. Nutrition and Muscle in Cirrhosis. J. Clin. Exp. Hepatol. 2017, 7, 340–357. [Google Scholar] [CrossRef]
  30. European Association for the Study of the Liver. EASL Clinical Practice Guidelines on nutrition in chronic liver disease. J. Hepatol. 2019, 70, 172–193. [Google Scholar] [CrossRef]
  31. Marr, K.J.; Shaheen, A.A.; Lam, L.; Stapleton, M.; Burak, K.; Raman, M. Nutritional status and the performance of multiple bedside tools for nutrition assessment among patients waiting for liver transplantation: A Canadian experience. Clin. Nutr. ESPEN 2017, 17, 68–74. [Google Scholar] [CrossRef]
  32. Álvares-Da-Silva, M.R.; da Silveira, T.R. Comparison between handgrip strength, subjective global assessment, and prognostic nutritional index in assessing malnutrition and predicting clinical outcome in cirrhotic outpatients. Nutrition 2005, 21, 113–117. [Google Scholar] [CrossRef] [PubMed]
  33. Sharma, P.; Rauf, A.; Matin, A.; Agarwal, R.; Tyagi, P.; Arora, A. Handgrip Strength as an Important Bed Side Tool to Assess Malnutrition in Patient with Liver Disease. J. Clin. Exp. Hepatol. 2017, 7, 16–22. [Google Scholar] [CrossRef] [PubMed]
  34. Wang, C.W.; Feng, S.; Covinsky, K.E.; Hayssen, H.; Zhou, L.Q.; Yeh, B.M.; Lai, J.C. A comparison of muscle function, mass, and quality in liver transplant candidates: Results from the functional assessment in liver transplantation study. Transplantation 2016, 100, 1692–1698. [Google Scholar] [CrossRef] [PubMed]
  35. Tanaka-Shintani, M.; Watanabe, M. Distribution of ghrelin-immunoreactive cells in human gastric mucosa: Comparison with that of parietal cells. J. Gastroenterol. 2005, 40, 345–349. [Google Scholar] [CrossRef] [PubMed]
  36. Ariyasu, H.; Takaya, K.; Tagami, T.; Ogawa, Y.; Hosoda, K.; Akamizu, T.; Suda, M.; Koh, T.; Natsui, K.; Toyooka, S.; et al. Stomach is a major source of circulating ghrelin, and feeding state determines plasma ghrelin-like immunoreactivity levels in humans. J. Clin. Endocrinol. Metab. 2001, 86, 4753–4758. [Google Scholar] [CrossRef]
  37. Date, Y.; Kojima, M.; Hosoda, H.; Sawaguchi, A.; Mondal, M.S.; Suganuma, T.; Matsukura, S.; Kangawa, K.; Nakazato, M. DGhrelin, a novel growth hormone-releasing acylated peptide, is synthesized in a distinct endocrine cell type in the gastrointestinal tracts of rats and humans. Endocrinology 2000, 141, 4255–4261. [Google Scholar] [CrossRef]
  38. Cummings, D.E.; Purnell, J.Q.; Frayo, R.S.; Schmidova, K.; Wisse, B.E.; Weigle, D.S. A Preprandial Rise in Plasma Ghrelin Levels Suggests a Role in Meal Initiation in Humans. Diabetes 2001, 50, 1714–1719. [Google Scholar] [CrossRef]
  39. Tschöp, M.; Wawarta, R.; Riepl, R.L.; Friedrich, S.; Bidlingmaier, M.; Landgraf, R.; Folwaczny, C. Post-prandial decrease of circulating human ghrelin levels. J. Endocrinol. Investig. 2001, 24, RC19–RC21. [Google Scholar] [CrossRef] [PubMed]
  40. Wren, A.M.; Small, C.J.; Ward, H.L.; Murphy, K.G.; Dakin, C.L.; Taheri, S.; Kennedy, A.R.; Roberts, G.H.; Morgan, D.G.A.; Ghatei, M.A.; et al. The Novel Hypothalamic Peptide Ghrelin Stimulates Food Intake and Growth Hormone Secretion. Endocrinology 2000, 141, 4325–4328. [Google Scholar] [CrossRef]
  41. DeBoer, M.D.; Zhu, X.X.; Levasseur, P.; Meguid, M.M.; Suzuki, S.; Inui, A.; Taylor, J.E.; Halem, H.A.; Dong, J.Z.; Datta, R.; et al. Ghrelin treatment causes increased food intake and retention of lean body mass in a rat model cancer cachexia. Endocrinology 2000, 148, 3004–3012. [Google Scholar] [CrossRef] [PubMed]
  42. Friedman, J.M.; Halaas, J.L. Leptin and the regulation of body weight in mammals. Nature 1998, 395, 763–770. [Google Scholar] [CrossRef]
  43. Ahima, R.S.; Osei, S.Y. Leptin signaling. Physiol. Behav. 2004, 81, 223–241. [Google Scholar] [CrossRef]
  44. Takahashi, H.; Kato, A.; Onodera, K.; Suzuki, K. Fasting plasma ghrelin levels reflects malnutrition state in patients with liver cirrhosis. Hepatol. Res. 2006, 34, 117–123. [Google Scholar] [CrossRef] [PubMed]
  45. Ockenga, J.; Bischoff, S.C.; Tillmann, H.L.; Rifai, K.; Widjaja, A.; Böker, K.H.; Manns, M.P.; Brabant, G. Elevated Bound Leptin Correlates with Energy Expenditure in Cirrhotics. Gastroenterology 2000, 119, 1656–1662. [Google Scholar] [CrossRef] [PubMed]
  46. El-Shehaby, A.M.; Obaia, E.M.; Alwakil, S.S.; Hiekal, A.A. Total and acylated ghrelin in liver cirrhosis: Correlation with clinical and nutritional status. Scand. J. Clin. Lab. Investig. 2010, 70, 252–258. [Google Scholar] [CrossRef] [PubMed]
  47. Kalaitzakis, E.; Bosaeus, I.; Öhman, L.; Björnsson, E. Altered postprandial glucose, insulin, leptin, and ghrelin in liver cirrhosis: Correlations with energy intake and resting energy expenditure. Am. J. Clin. Nutr. 2007, 85, 808–815. [Google Scholar] [CrossRef]
  48. Marchesini, G.; Bianchi, G.; Lucidi, P.; Villanova, N.; Zoli, M.; de Feo, P. Plasma ghrelin concentrations, food intake, and anorexia in liver failure. J. Clin. Endocrinol. Metab. 2004, 89, 2136–2141. [Google Scholar] [CrossRef]
  49. Kamath, P.S.; Kim, W.R. The model for end-stage liver disease (MELD). Hepatology 2007, 45, 797–805. [Google Scholar] [CrossRef]
  50. Frisancho, R. New norms of upper limb fat and muscle areas for assessment of nutritional status. Am. J. Clin. Nutr. 1981, 34, 2540–2545. [Google Scholar] [CrossRef]
  51. FAO/WHO. Ad Hoc Expert Committee on Energy and Protein Requirements; WHO Technical Report Series No. 522. World Health Organization: Geneva, Switzerland, 1973. [Google Scholar]
  52. Cecile, D.T.B. Criteria and significance of dietary protein sources in humans. Summary of the workshop with recommendations. J. Nutr. 2000, 130, 1868S–1873S. [Google Scholar]
  53. Tessari, P. Nitrogen Balance and Protein Requirements: Definition and Measurements. In Cachexia and Wasting a Modern Approach; Springer: Milano, Italy, 2007; pp. 73–79. [Google Scholar]
  54. Bodwell, C.E.; Schuster, E.M.; Kyle, E.; Brooks, B.; Womack, M.; Steele, P.; Ahrens, R. Obligatory urinary and fecal nitrogen losses in young women, older men, and young men and the factorial estimation of adult human protein requirements. Am. J. Clin. Nutr. 1979, 32, 2450–2459. [Google Scholar] [CrossRef] [PubMed]
  55. Rand, W.M.; Pellett, P.L.; Young, V.R. Meta-analysis of nitrogen balance studies for estimating protein requirements in healthy adults. Am. J. Clin. Nutr. 2003, 77, 109–127. [Google Scholar] [CrossRef]
  56. Gaillard, C.; Alix, E.; Boirie, Y.; Berrut, G.; Ritz, P. Are elderly Hospitalized patients getting enough protein? JAGS 2008, 56, 1045–1049. [Google Scholar] [CrossRef] [PubMed]
  57. Bischoff, S.C.; Bernal, W.; Dasarathy, S.; Merli, M.; Plank, L.D.; Schütz, T.; Plauth, M. ESPEN Guideline ESPEN practical guideline: Clinical nutrition in liver disease. Clin. Nutr. 2020, 39, 3533–3562. [Google Scholar] [CrossRef] [PubMed]
  58. Merli, M. Utritional status in cirrhosis. Italian Multicentre Cooperative Project on Nutrition in Liver Cirrhosis. J. Hepatol. 1994, 21, 317–325. [Google Scholar]
  59. Luna-Heredia, E.; Martín-Peña, G.; Ruiz-Galiana, J. Handgrip dynamometry in healthy adults. Clin. Nutr. 2005, 24, 250–258. [Google Scholar] [CrossRef]
  60. Campillo, B.; Richardet, J.P.; Scherman, E.; Bories, P.N. Evaluation of Nutritional Practice in Hospitalized Cirrhotic Patients: Result of a prospective study. Nutrition 2003, 19, 515–521. [Google Scholar] [CrossRef]
  61. Huynh, D.K.; Selvanderan, S.P.; Harley, H.A.J.; Holloway, R.H.; Nguyen, N.Q. Nutritional care in hospitalized patients with chronic liver disease. World J. Gastroenterol. 2015, 21, 12835–12842. [Google Scholar] [CrossRef]
  62. Leistra, E.; Willeboordse, F.; Visser, M.; Weijs, P.J.; Haans-van den Oord, A.; Oostenbrink, J.; Evers, A.M.; Kruizenga, H.M. Predictors for achieving protein and energy requirements in undernourished hospital patients. Clin. Nutr. 2011, 30, 484–489. [Google Scholar] [CrossRef]
  63. Millward, D.J.; Roberts, S.B. Protein Requirements of Older Individuals. Nutr. Res. Rev. 2005, 9, 67. [Google Scholar] [CrossRef]
  64. Horst, D.; Grace, N.D.; Conn, H.O.; Schiff, E.; Schenker, S.; Viteri, A.; Law, D.; Atterbury, C.E. Comparison of dietary protein with an oral, branched chain-enriched amino acid supplement in chronic portal-systemic encephalopathy: A randomized controlled trial. Hepatology 1984, 4, 279–287. [Google Scholar] [CrossRef] [PubMed]
  65. Nielsen, K.; Kondrup, J.; Martinsen, L.; Stilling, B.; Wikman, B. Nutritional assessment and adequacy of dietary intake in hospitalized patients with alcoholic liver cirrhosis. Br. J. Nutr. 1993, 69, 665–679. [Google Scholar] [CrossRef] [PubMed]
  66. Swart, G.R.; van den Berg, J.W.O.; van Vuure, J.K.; Rietveld, T.; Wattimena, D.L.; Frenkel, M. Minimum protein requirements in liver cirrhosis determined by nitrogen balance measurements at three levels of protein intake. Clin. Nutr. 1989, 8, 329–336. [Google Scholar] [CrossRef]
  67. Nielsen, K.; Kondrup, J.; Martinsen, L.; Døssing, H.; Larsson, B.; Stilling, B.; Jensen, M.G. Long-term oral refeeding of patients with cirrhosis of the liver. Br. J. Nutr. 2005, 74, 557. [Google Scholar] [CrossRef] [PubMed]
  68. Pupim, L.B.; Martin, C.J.; Ikizler, T.A. Assessment of protein and energy nutritional status, Nutritional Management of Renal Disease, 3rd ed.; Academic Press: Cambridge, MA, USA, 2013. [Google Scholar]
  69. Elbadri, A.; Esmat, S.; Abosaif, N.; Morsi, A.; Shaker, O. Study of serum ghrelin changes and its correlation with malnutrition in liver cirrhosis in Egypt. Clin. Res. Hepatol. Gastroenterol. 2011, 35, 638–643. [Google Scholar] [CrossRef]
  70. Rachakonda, V.; Borhani, A.A.; Dunn, M.A.; Andrzejewski, M.; Martin, K.; Behari, J. Serum leptin is α biomarker of malnutrition in decompensated cirrhosis. PLoS ONE 2016, 11, e0159142. [Google Scholar] [CrossRef]
  71. Diz-Lois, M.T.; Garcia-Buela, J.; Suarez, F.; Sangiao-Alvarellos, S.; Vidal, O.; Cordido, F. Fasting and postprandial plasma ghrelin levels are decreased in patients with liver failure previous to liver transplantation. Endocrine 2009, 35, 467–476. [Google Scholar] [CrossRef]
  72. Ataseven, H.; Bahcecioglu, I.H.; Kuzu, N.; Yalniz, M.; Celebi, S.; Erensoy, A.; Ustundag, B. The Levels of Ghrelin, Leptin, TNF-α, and IL-6 in Liver Cirrhosis and Hepatocellular Carcinoma due to HBV and HDV Infection. Mediat. Inflamm. 2006, 2006, 078380. [Google Scholar] [CrossRef]
  73. Ataseven, H.; Bahcecioglu, I.H.; Kuzu, N.; Yalniz, M.; Celebi, S.; Erensoy, A.; Ustundag, B. Dysregulation of plasma ghrelin in alcoholic cirrhosis. Clin. Endocrinol. 2010, 73, 323–329. [Google Scholar]
  74. Celinski, K.; Konturek, P.C.; Slomka, M.; Cichoz-Lach, H.; Gonciarz, M.; Bielanski, W.; Reiter, R.J.; Konturek, S.J. Altered basal and postprandial plasma melatonin, gastrin, ghrelin, leptin and insulin in patients with liver cirrhosis and portal hypertension without and with oral administration of melatonin or tryptophan. J. Pineal Res. 2009, 46, 408–414. [Google Scholar] [CrossRef] [PubMed]
  75. Tacke, F.; Brabant, G.; Kruck, E.; Horn, R.; Schöffski, P.; Hecker, H.; Manns, M.P.; Trautwein, C. Ghrelin in chronic liver disease. J. Hepatol. 2003, 38, 447–454. [Google Scholar] [CrossRef]
  76. Rieger, R.; Oertelt, S.; Selmi, C.; Invernizzi, P.; Podda, M.; Gershwin, M.E. Decreased serum leptin levels in Primary biliary cirrhosis: A link between metabolism and autoimmunity? Ann. N. Y. Acad. Sci. 2005, 1051, 211–217. [Google Scholar] [CrossRef]
  77. Greco, A.V.; Mingrone, G.; Favuzzi, A.; Capristo, E.; Gniuli, D.; Addolorato, G.; Brunani, A.; Cavagnin, F.; Gasbarrini, G. Serum leptin levels in post-hepatitis liver cirrhosis. J. Hepatol. 2000, 33, 38–42. [Google Scholar] [CrossRef]
  78. Onodera, K.; Kato, A.; Suzuki, K. Serum leptin concentrations in liver cirrhosis: Relationship to the severity of liver dysfunction and their characteristic diurnal profiles. Hepatol. Res. 2001, 21, 205–212. [Google Scholar] [CrossRef]
  79. McCullough, A.J.; Bugianesi, E.; Marchesini, G.; Kalhan, S.C. Gender-dependent alterations in serum leptin in alcoholic cirrhosis. Gastroenterology 1998, 115, 947–953. [Google Scholar] [CrossRef]
  80. Testa, R.; Franceschini, R.; Giannini, E.; Cataldi, A.; Botta, F.; Fasoli, A.; Tenerelli, P.; Rolandi, E.; Barreca, T. Serum leptin levels in patients with viral chronic hepatitis or liver cirrhosis. J. Hepatol. 2000, 33, 33–37. [Google Scholar] [CrossRef]
  81. Bolukbas, F.F.; Bolukbas, C.; Horoz, M.; Gumus, M.; Erdogan, M.; Zeyrek, F.; Yayla, A.; Ovunc, O. Child-Pugh classification dependent alterations in serum leptin levels among cirrhotic patients: A case controlled study. BMC Gastroenterol. 2004, 4, 23. [Google Scholar] [CrossRef]
  82. Lin, S.Y.; Wang, Y.Y.; Sheu, W.H.-H. Increased serum leptin concentrations correlate with soluble tumour necrosis factor receptor levels in patients with cirrhosis. Clin. Endocrinol. 2002, 57, 805–811. [Google Scholar] [CrossRef]
  83. Buechler, C.; Haberl, E.M.; Rein-Fischboeck, L.; Aslanidis, C. Adipokines in liver cirrhosis. Int. J. Mol. Sci. 2017, 18, 1392. [Google Scholar]
Figure 1. Plasma circulating ghrelin levels (ng/mL) in cirrhotic patients and healthy controls.
Livers 02 00014 g001
Figure 2. Plasma circulating leptin levels (ng/mL) in cirrhotic patients and healthy controls.
Livers 02 00014 g002
Figure 3. Correlation among triceps skinfold thickness and plasma leptin levels (p < 0.001; r = 0.76).
Livers 02 00014 g003
Table 1. General characteristics of the patients (n = 50).
Mean ± SD
Age (years)58.9 ± 10.8
Female/Male (%)30/70
Etiology of liver disease (%):
Alcohol/HCV/HCV + Alcohol/Crypto/Other31/29/18/10/12
Reason for the hospitalization (%):
Ascites/Bleeding/HE/Interventional procedure/Other36/8/12/12/32
Child Class (%):
A/B/C
21/50/29
MELD16.1 ± 6.9
MELD > 15 (%)52
HG (kg)23.1 ± 9.1
HG < 10° percentile (%)37.5
BMI (kg/m2)23.9 ± 3.7
MAMC (mm)21.6 ± 3.6
MAMC < 5° percentile (%)60
MELD: model for end-stage liver disease; HG: handgrip strength Test; BMI: body mass index; MAMC: mid-arm muscle circumference.
Table 2. Anthropometric data and muscle function of cirrhotic patients divided by nutritional status (malnutrition defined for MAMC < 5° percentile).
Nourished
(n = 20)
Malnourished
(n = 30)
p
Weight (kg)74.3 ± 14.0 64.8 ± 10.8<0.05
BMI (kg/m2)25.7 ± 3.8 22.1 ± 2.8<0.001
Triceps skin fold thickness (mm)13.4 ± 7.17.0 ± 3.3<0.001
Biceps skin fold thickness (mm)7.4 ± 6.04.2 ± 2.0<0.05
HG (kg)23.5 ± 10.122.7 ± 8.3n.s.
HG < 10° percentile (%)20.055.0<0.05
BMI: body mass index; HG: handgrip strength test. Values expressed in mean ± SD.
Table 3. Protein intake, urinary nitrogen excretion and nitrogen balance in cirrhotic patients divided by nutritional status (malnutrition defined for MAMC <5° percentile).
Nourished
(n = 20)
Malnourished
(n = 30)
p
Dietary Protein intake (g/kg)0.7 ± 0.40.8 ± 0.6n.s.
Urinary nitrogen (g/24 h)11.1 ± 6.014.1 ± 8.5n.s.
Nitrogen balance (g)−6.1 ± 5.2−7.5 ± 10.7n.s.
Values expressed in mean ± SD.
Publisher’s Note: MDPI stays neutral with regard to jurisdictional claims in published maps and institutional affiliations.

