Article

Useful Predictor for Exacerbation of Esophagogastric Varices after Hepatitis C Virus Eradication by Direct-Acting Antivirals

1
Department of Gastroenterology, Mazda Hospital, Mazda Motor Corporation, Hiroshima 735-8585, Japan
2
Department of Gastroenterology, Graduate School of Biomedical and Health Science, Hiroshima University, Hiroshima 734-8551, Japan
3
Department of Gastroenterology, Hiroshima Prefectural Hospital, Hiroshima 734-8530, Japan
*
Authors to whom correspondence should be addressed.
Livers 2024, 4(3), 352-363; https://doi.org/10.3390/livers4030025
Submission received: 4 June 2024 / Revised: 12 July 2024 / Accepted: 23 July 2024 / Published: 30 July 2024
(This article belongs to the Special Issue Liver Fibrosis: Mechanisms, Targets, Assessment and Treatment)

Abstract

:
To clarify the risk factors for the aggravation of esophagogastric varices (EGVs) after hepatitis C virus (HCV) eradication with direct-acting antiviral (DAA) therapy, we enrolled 167 consecutive patients with HCV-related compensated cirrhosis who achieved a sustained virological response (SVR) after DAA therapy. During a median of 69 months, EGVs were aggravated in 42 (25%) patients despite SVR. The cumulative 1-, 3-, 5-, and 10-year aggravated EGV rates were 7%, 23%, 25%, and 27%, respectively. Multivariate analysis identified a platelet count < 11.0 × 10⁴/μL, LSM ≥ 18.0 kPa, total bile acid ≥ 33.0 μmol/L, and a diameter of left gastric vein (LGV) ≥ 5.0 mm at HCV eradication as independent risk factors for EGV aggravation post-SVR. In groups that met all of these risks, the cumulative EGV aggravation rates at 1, 3, and 5 years were 27%, 87%, and 91%, respectively. However, none of the patients who had only one or none of the risk factors experienced EGV aggravation. Platelet count, LSM, total bile acid, and diameter of LGV at HCV eradication were associated with aggravated EGV post-SVR. EGVs tend to worsen as two or more of these risk factors increase.

1. Introduction

The achievement of sustained virological response (SVR) in patients with chronic hepatitis C virus (HCV) infection reduces the risk of progressing to liver decompensation and hepatocellular carcinoma (HCC), leading to improved survival [1]. Hepatic function in patients with SVR could gradually recover with a long-term maintenance of normalized hepatic enzyme levels and a regression of hepatic liver necrosis, inflammation, and fibrosis [2]. Portal hypertension is a major consequence of cirrhosis and is responsible for its most severe complications, including ascites, bleeding from esophagogastric varices (EGVs), and portosystemic encephalopathy. SVR achievement by direct-acting antiviral (DAA) therapy was reported to decrease portal venous pressures [3,4,5,6,7], which is expected to reduce the risk of portal hypertension in liver cirrhosis patients with HCV infection.
However, if portal hypertension or EGVs have already developed prior to DAA therapy, or if collateral vessels are dilated, symptoms associated with portal hypertension might be difficult to improve even if SVR is achieved. We have previously reported that patients with HCV-related cirrhosis who had already developed collateral vessels may experience an aggravation of EGVs or develop portosystemic encephalopathy after they achieve SVR [8]. Tsuji et al. also reported that even if SVR was achieved with DAA therapy, patients with HCV-related compensated cirrhosis who had already developed portosystemic shunt showed little improvement in liver function [9]. Therefore, careful follow-up is necessary for liver cirrhosis patients with portal hypertension even after achieving SVR. On the other hand, risk factors for complications associated with worsening portal hypertension after SVR remain unclear.
In portal hypertension, it is important to evaluate the status of portal venous pressure, and hepatic venous pressure gradient (HVPG) is used as an estimate [10]. However, the measurement of HVPG is invasive. Therefore, we decided to use non-invasive testing to elucidate the risk factors for worsening portal hypertension after SVR in HCV-related cirrhosis patients. In the present study, in addition to liver stiffness, platelet count, and diameter of portosystemic collateral vessels, we also analyzed autotaxin and bile acid levels as liver fibrosis markers. In particular, although autotaxin has recently been reported as a new liver fibrosis marker that increases from the early stage of fibrosis and has a high diagnostic ability [11], there are few reports on the relationship between bile acid and complications in portal hypertension.
In this study, we retrospectively analyzed the risk factors for worsening portal hypertension in patients with HCV-related cirrhosis after eradicating HCV.

2. Materials and Methods

2.1. Patients

We enrolled 167 patients with HCV-related cirrhosis who achieved SVR following DAA therapy at Hiroshima University Hospital between May 2010 and March 2020. Patients whose serum HCV RNA was undetectable 24 weeks after the end of DAA therapy (EOT) were diagnosed as SVR. All patients underwent regular surveillance via liver function tests, ultrasonography, dynamic computed tomography (CT), and endoscopic examinations. All patients provided written informed consent to participate in the study in accordance with the ethical guidelines of the Declaration of Helsinki and with a program approved by the ethics committee of Hiroshima University Hospital (Approval No. E-873).

2.2. Clinical and Laboratory Assessments

This study included patients with compensated cirrhosis. Cirrhosis was assessed based on liver imaging tests or prior liver biopsy showing F4. Patients with Child–Pugh class A scores without a history of decompensated events were considered to have compensated cirrhosis, and patients with Child–Pugh class B or C or patients with a history of decompensated events were considered to have decompensated cirrhosis. This study did not include patients with decompensated cirrhosis. Laboratory assessment was performed before treatment and at 24 weeks, and 1, 2, and 3 years after the EOT. In addition to general biochemical tests, autotaxin and bile acids were also included, and the albumin–bilirubin (ALBI) score and fibrosis-4 (FIB-4) index, which serve as surrogate markers of hepatic spare ability and liver fibrosis, respectively, were calculated as previously reported [12,13].

2.3. Measurement of Liver Stiffness

We measured the severity of liver stiffness measurement (LSM) before DAA therapy, at 24 weeks (SVR achievement), and 1, 2, and 3 years after DAA therapy using vibration-controlled transient elastography (VCTE). Patients were placed in a supine position with the right hand at the most abducted position for scanning the right lobe of the liver [14]. When at least 10 valid measurements were obtained with valid measurements at ≥60% and an interquartile range of <30%, such measurements were considered valid and the median value of these measurements was used for analysis.

2.4. Endoscopic Examination for Assessing EGVs

We evaluated the endoscopic findings of EGVs based on the classification of the Japanese Society for Portal Hypertension and Esophageal Varices [15]. The different forms (F) of EGVs were classified as follows: F0 was treated and completely treated, with no varices; F1 was straight and relatively thin; F2 was beaded and moderately thick; and F3 was thick, nodular, or mass-like. There are three types of red color (RC) sign: red wale marking, cherry red spot, and hematocystic spot. RC1 was observed only in one-line varices, RC2 was observed between RC1 and RC3, and RC3 was observed in all circumferential varices. Endoscopy was performed within 6 months before starting antiviral therapy and was evaluated at least once during each following year. Compared with baseline findings on follow-up endoscopy, a worsening of F and RC signs was defined as an aggravation of EGVs. The endoscopy results were confirmed by two expert endoscopists.

2.5. CT Examination for Portal Hypertension

All patients underwent CT examination 24 weeks after EOT achievement. CT was performed in the high-quality scanning mode. We focused on the left gastric vein (LGV) and splenorenal shunt as portosystemic collateral vessels, and these vessels were evaluated by dynamic CT, measuring the vessel diameter and recording the widest part of the vessel in all cases in this study.

2.6. Statistical Analysis

Continuous variables were expressed as median and range. Continuous variables were analyzed using the Mann–Whitney U-test. Aggravated EGVs were calculated using the Kaplan–Meier method, and differences between groups were assessed using a log-rank test. Multivariate analysis was performed using a Cox proportional hazard model with a stepwise selection of variables or two logistic regression analyses. Receiver operating characteristic curves were used to determine the cutoff values for predicting the aggravated EGV-related events in the patients. All statistical analyses were performed using IBM SPSS version 23.0 and p < 0.05 was considered significant.

3. Results

3.1. Baseline Characteristics of the Patients

The baseline characteristics of the 167 patients are shown in Table 1. The present study included 82 men and 85 women, with a median age of 74 (range 48–90) years. The median FIB-4 index was 5.98 (range 3.27–26.09), the ALBI score was –2.56 (range −3.43 to −1.28), and the LSM was 18.9 kPa (range 5.6–44.2). Before initiating DAA therapy, 51 of 167 (31%) patients had complications due to EGVs, classified as F1 in 42 (25%) patients and F2 in 9 (5%) patients. The RC sign was not observed in any of the patients with EGVs.

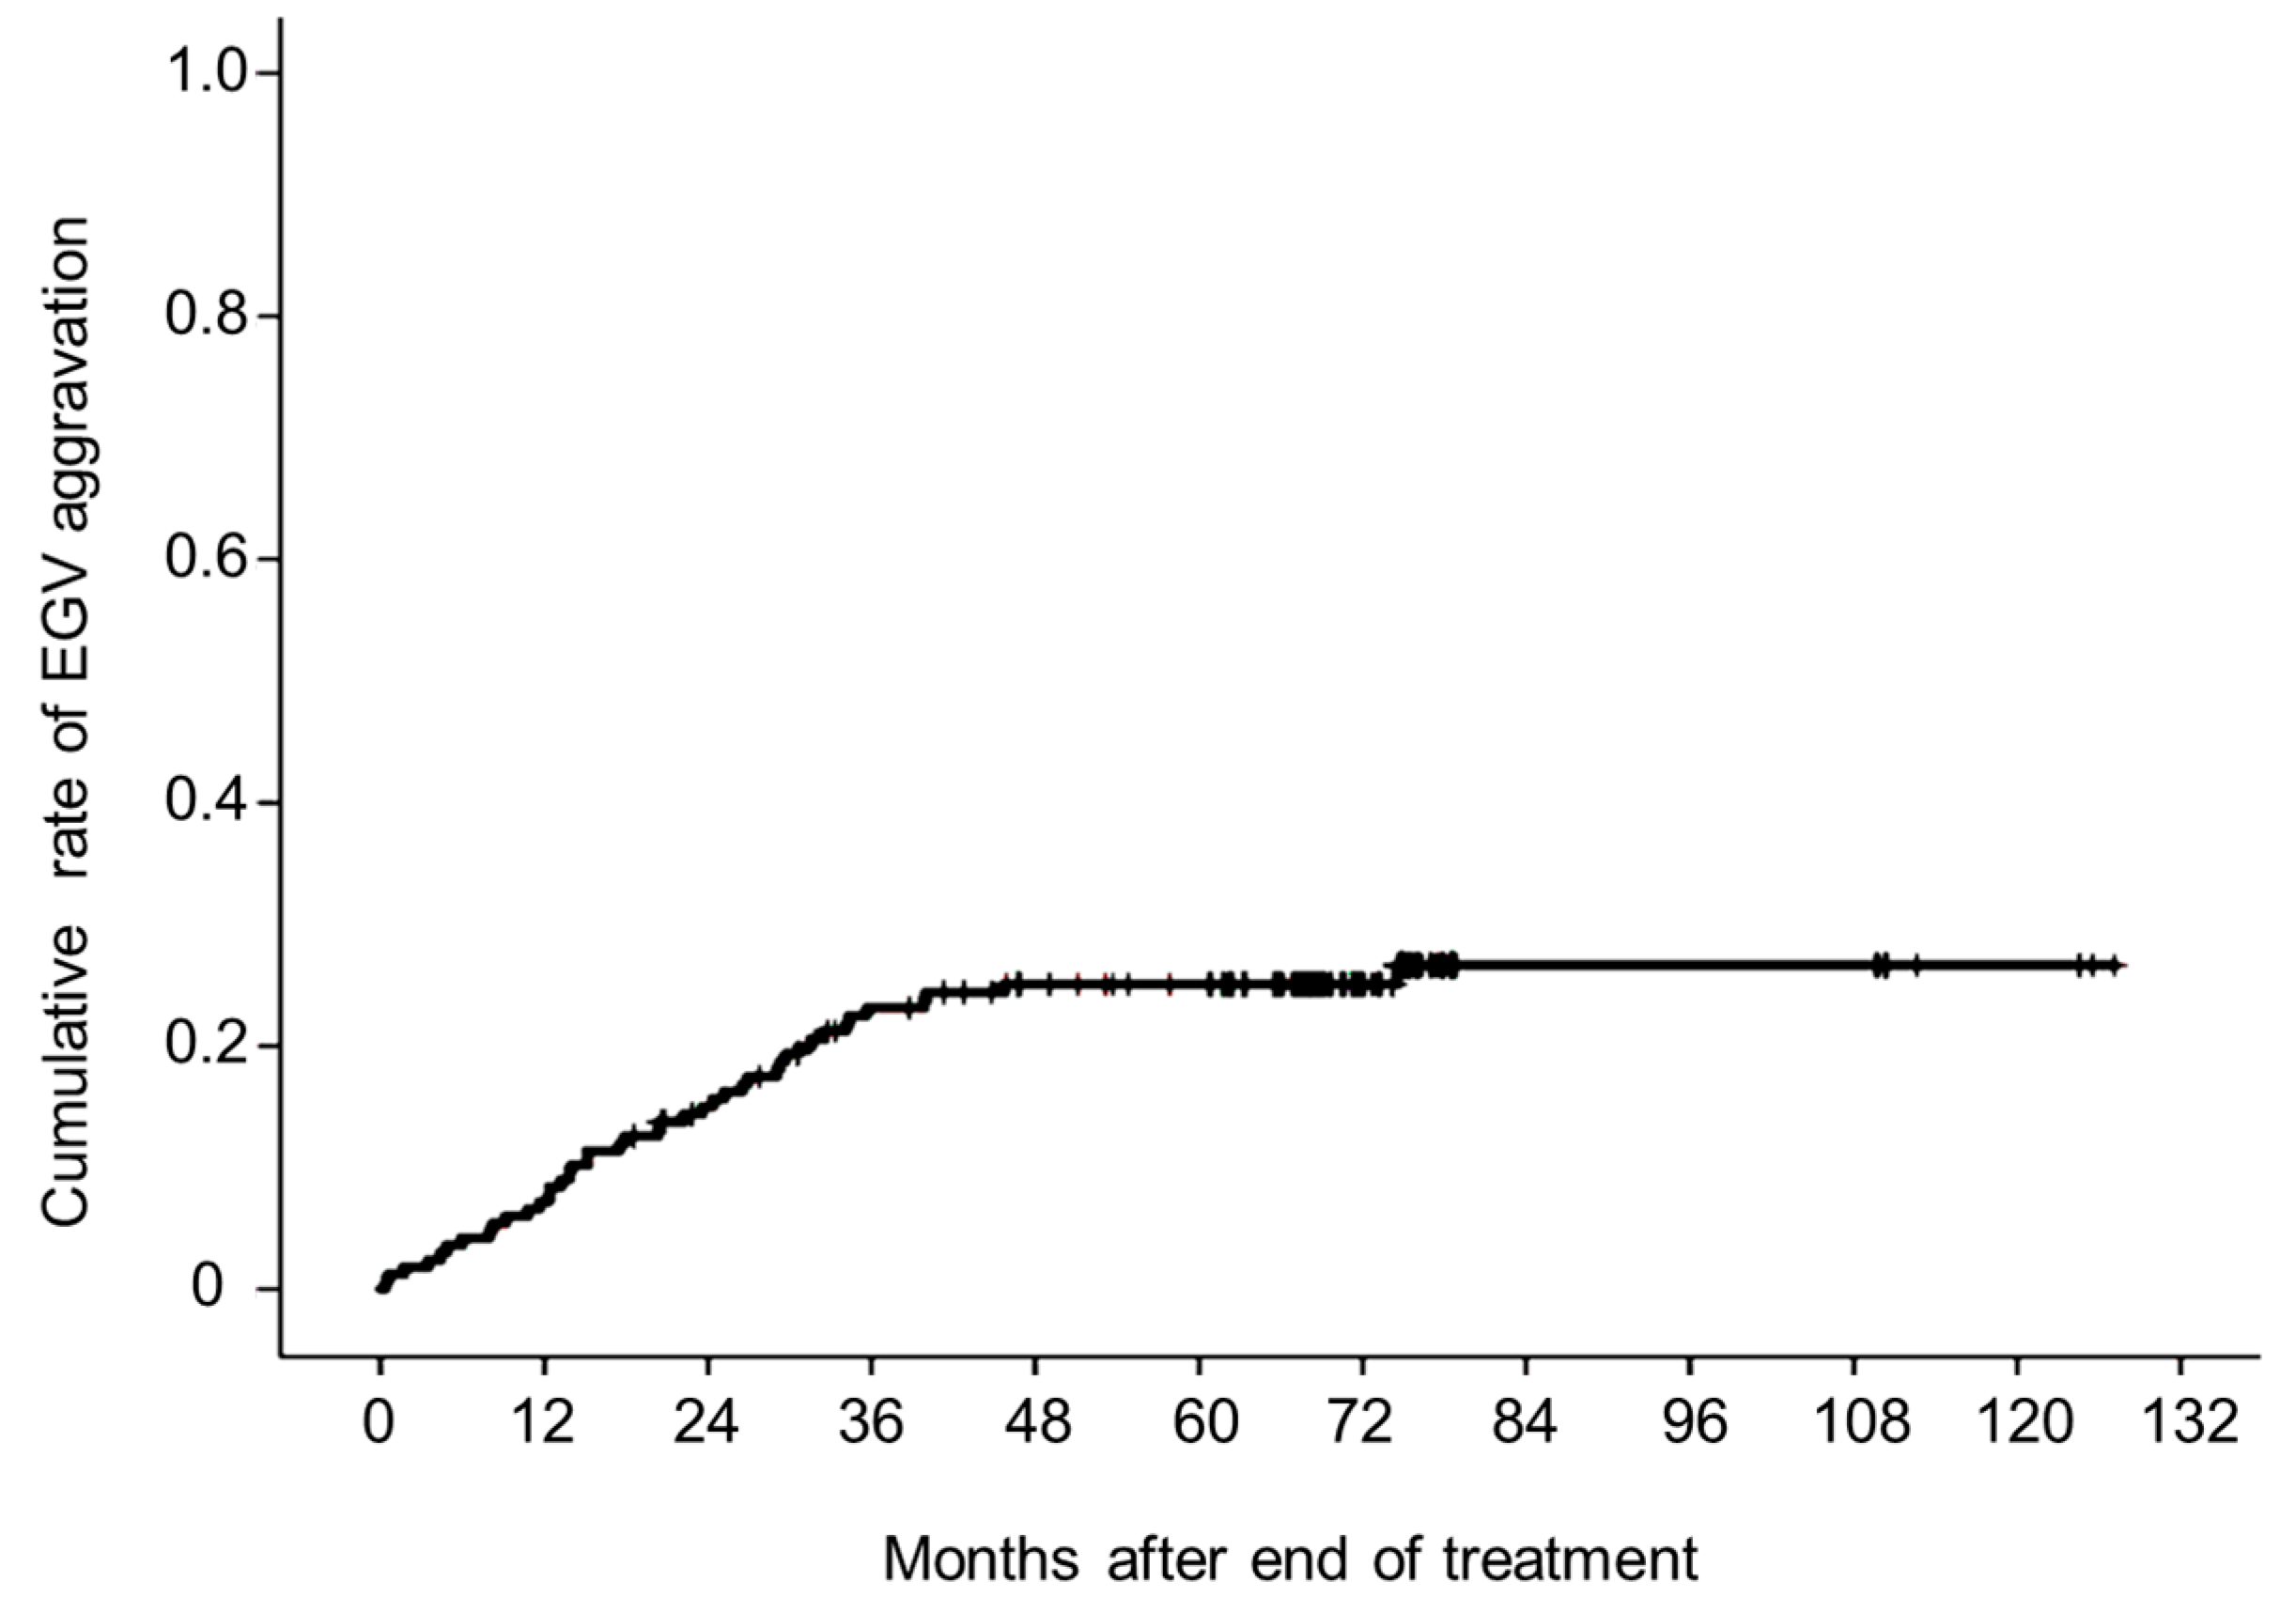
3.2. Aggravated EGVs after Eradicating HCV

During the median follow-up period of 69 (range 3–127) months, EGVs were aggravated in 42 (25%) patients despite achieving SVR. Twelve patients increased from F0 to F1, two patients from F0 to F3, seventeen patients from F1 to F2 or had an appearance of the RC sign, seven patients from F1 to F3 or had an appearance of the RC sign, and four patients from F2 to F3 or had an appearance of the RC sign. The cumulative 1-, 3-, 5-, and 10-year aggravation rates of EGVs were 7%, 23%, 25%, and 27%, respectively (Figure 1). Although HCC recurred in 53 patients, portal vein tumor thrombosis was not observed in any of them.

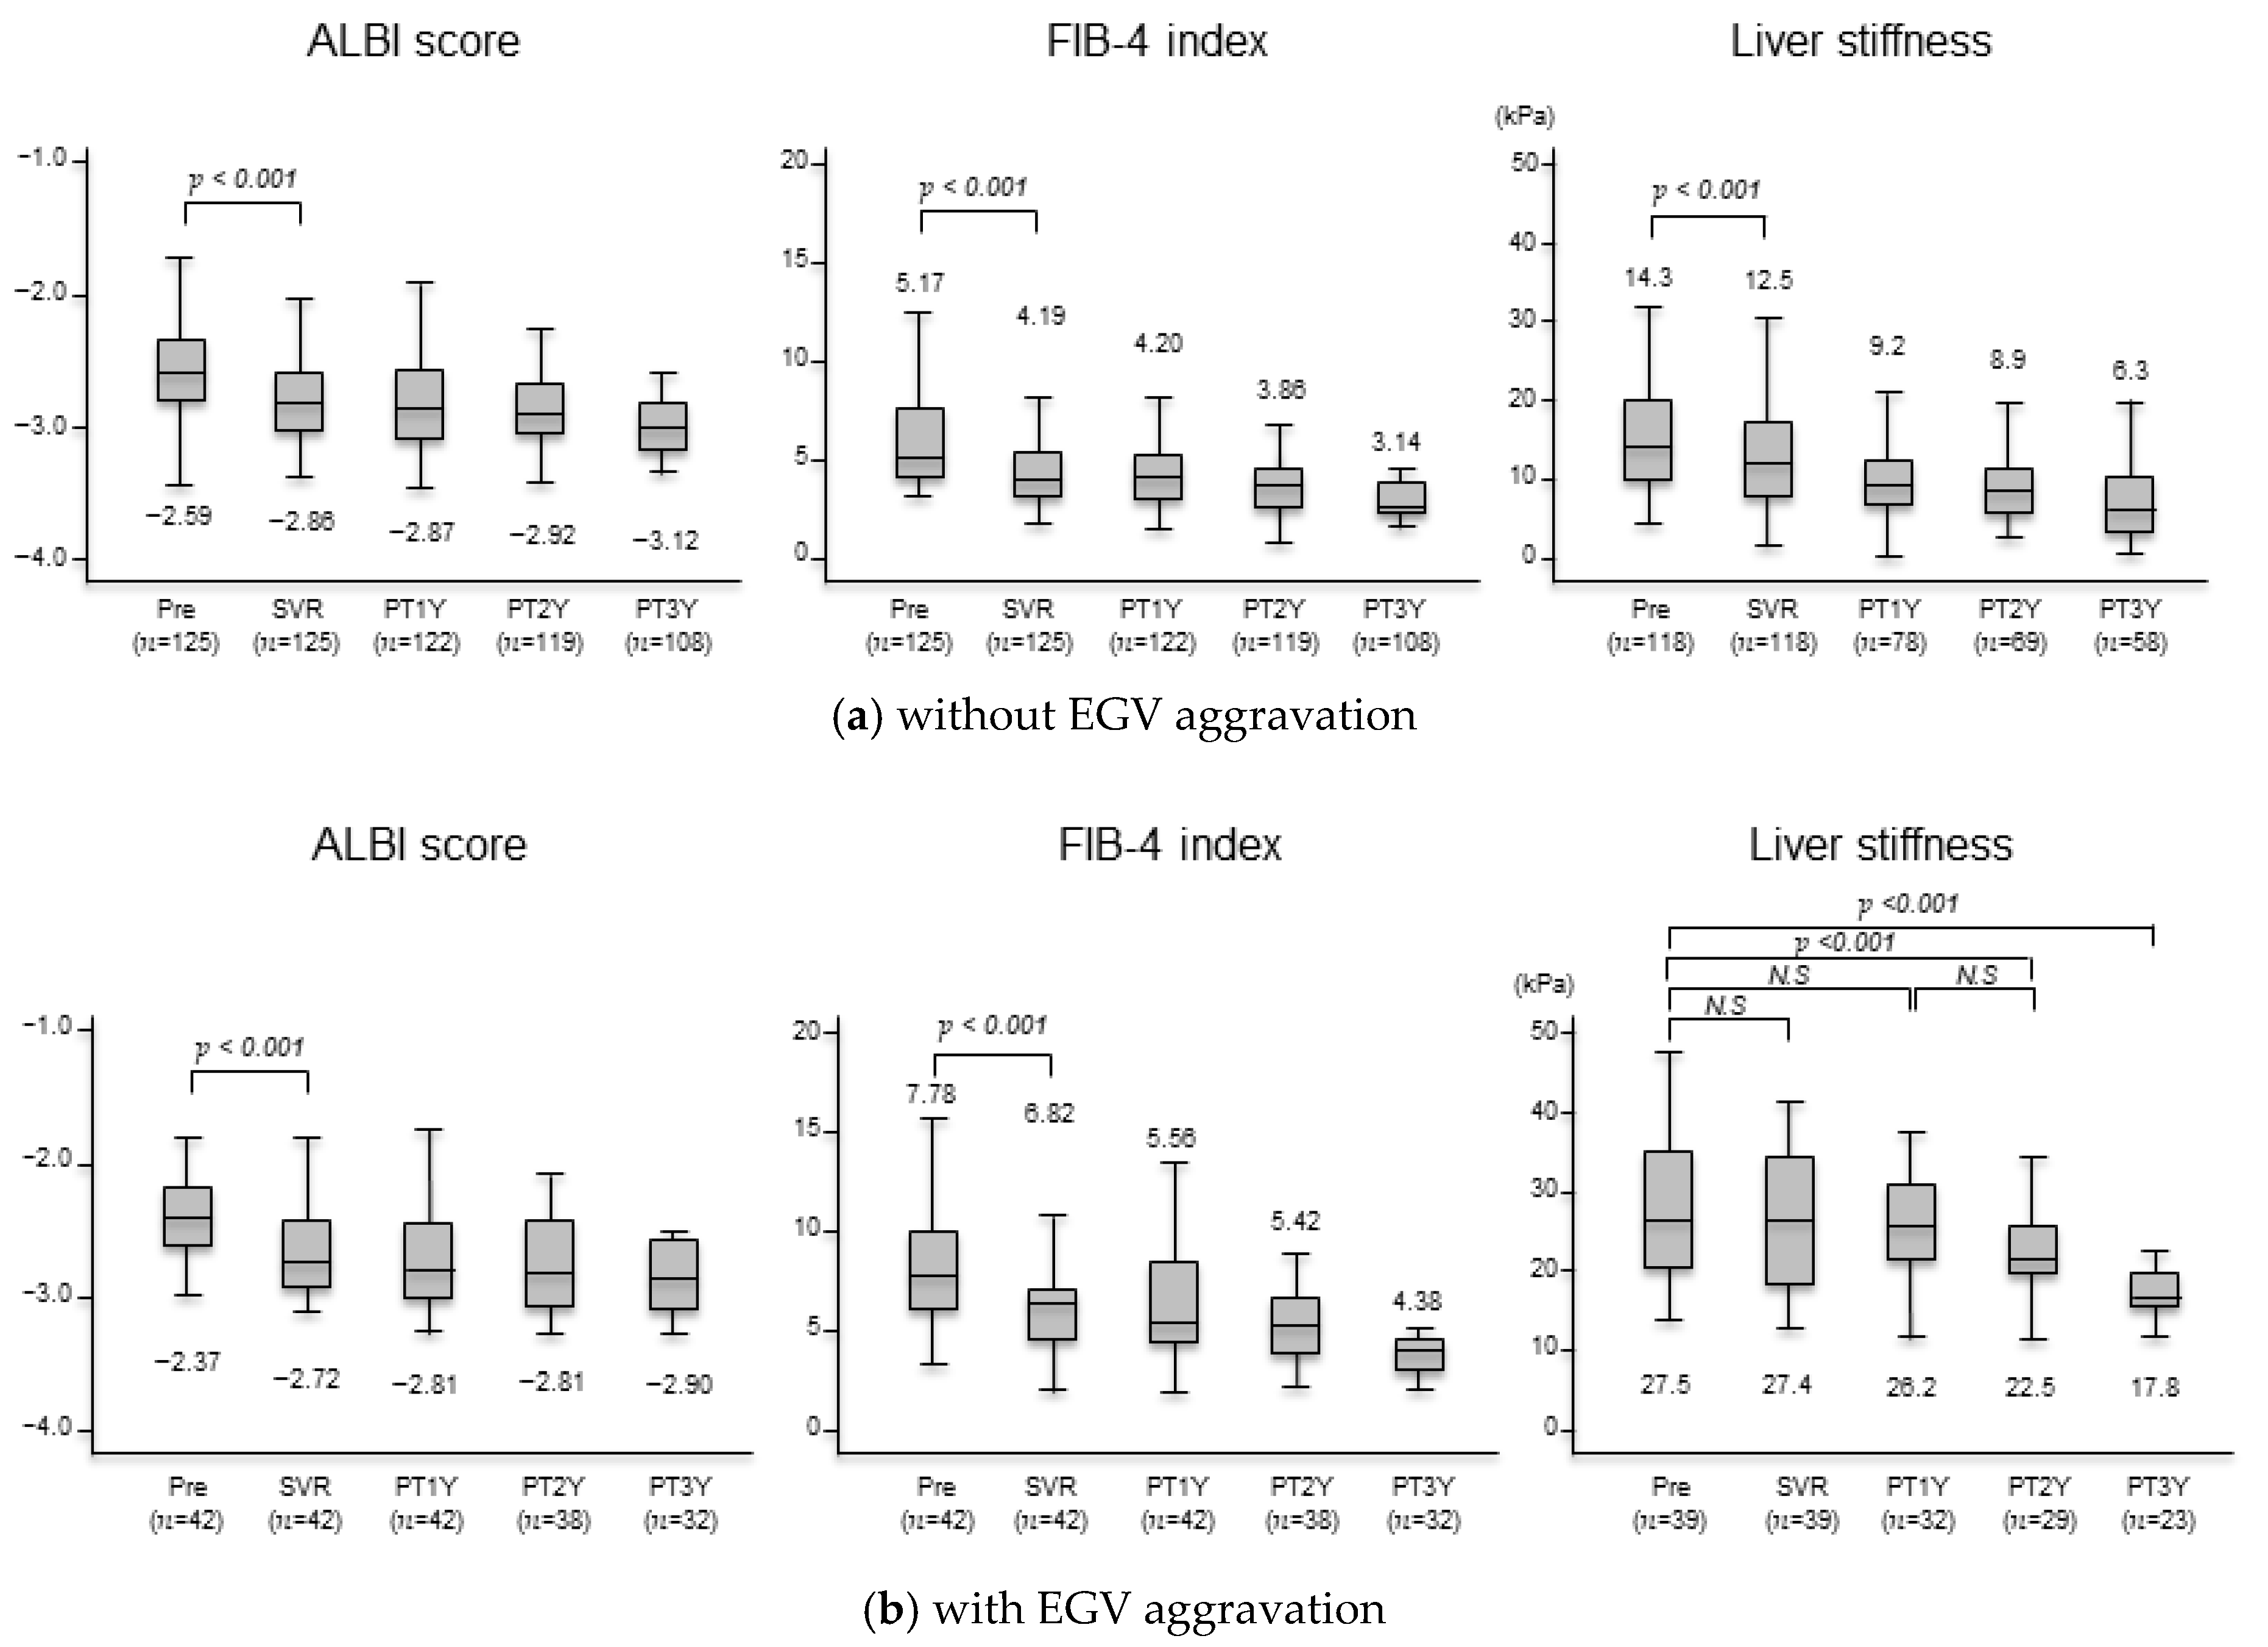
3.3. Changes in Liver Function Test, Serum Fibrosis Markers, and Liver Stiffness after Achieving SVR

Changes in liver function test, serum fibrosis markers, and liver stiffness after SVR depending on the presence or absence of EGV aggravation are shown in Figure 2. In patients without EGV aggravation, the median ALBI score decreased significantly (p < 0.001) from −2.59 before treatment to −2.86 at 24 weeks from EOT achievement. One, two, and three years from EOT, the median ALBI score decreased to −2.87, −2.92, and −3.12, respectively, and the improvement in liver function was maintained. The median FIB-4 index decreased significantly (p < 0.001) from 5.12 before treatment to 4.19 at 24 weeks from EOT. It decreased to 4.20, 3.86, and 3.14, one, two, and three years from EOT, respectively, and the improvement in liver function was also maintained. The median LSM decreased significantly (p < 0.001) from 14.3 kPa before treatment to 12.5 kPa at 24 weeks from EOT, decreasing to 9.2 kPa, 8.9 kPa, and 6.3 kPa, one, two, and three years from EOT, respectively, and the improvement in liver stiffness was maintained. In patients with aggravated EGVs, the median ALBI score decreased significantly (p < 0.001) from –2.37 before treatment to −2.72 at 24 weeks from EOT achievement, decreasing to −2.81, −2.81, and −3.12, one, two, and three years from EOT, respectively, and the improvement in liver function was maintained. The median FIB-4 index decreased significantly (p < 0.001) from 7.78 before treatment to 6.82 at 24 weeks from EOT achievement and decreased to 5.56, 5.42, and 4.38, one, two, and three years from EOT, respectively. The improvement in liver function was maintained. On the other hand, no significant improvement in LSM was observed, decreasing only slightly from 27.5 kPa before treatment to 27.4 kPa at 24 weeks from EOT and 26.2 kPa even one year from EOT. However, LSM decreased significantly to 22.5 kPa two years from EOT (p < 0.001).

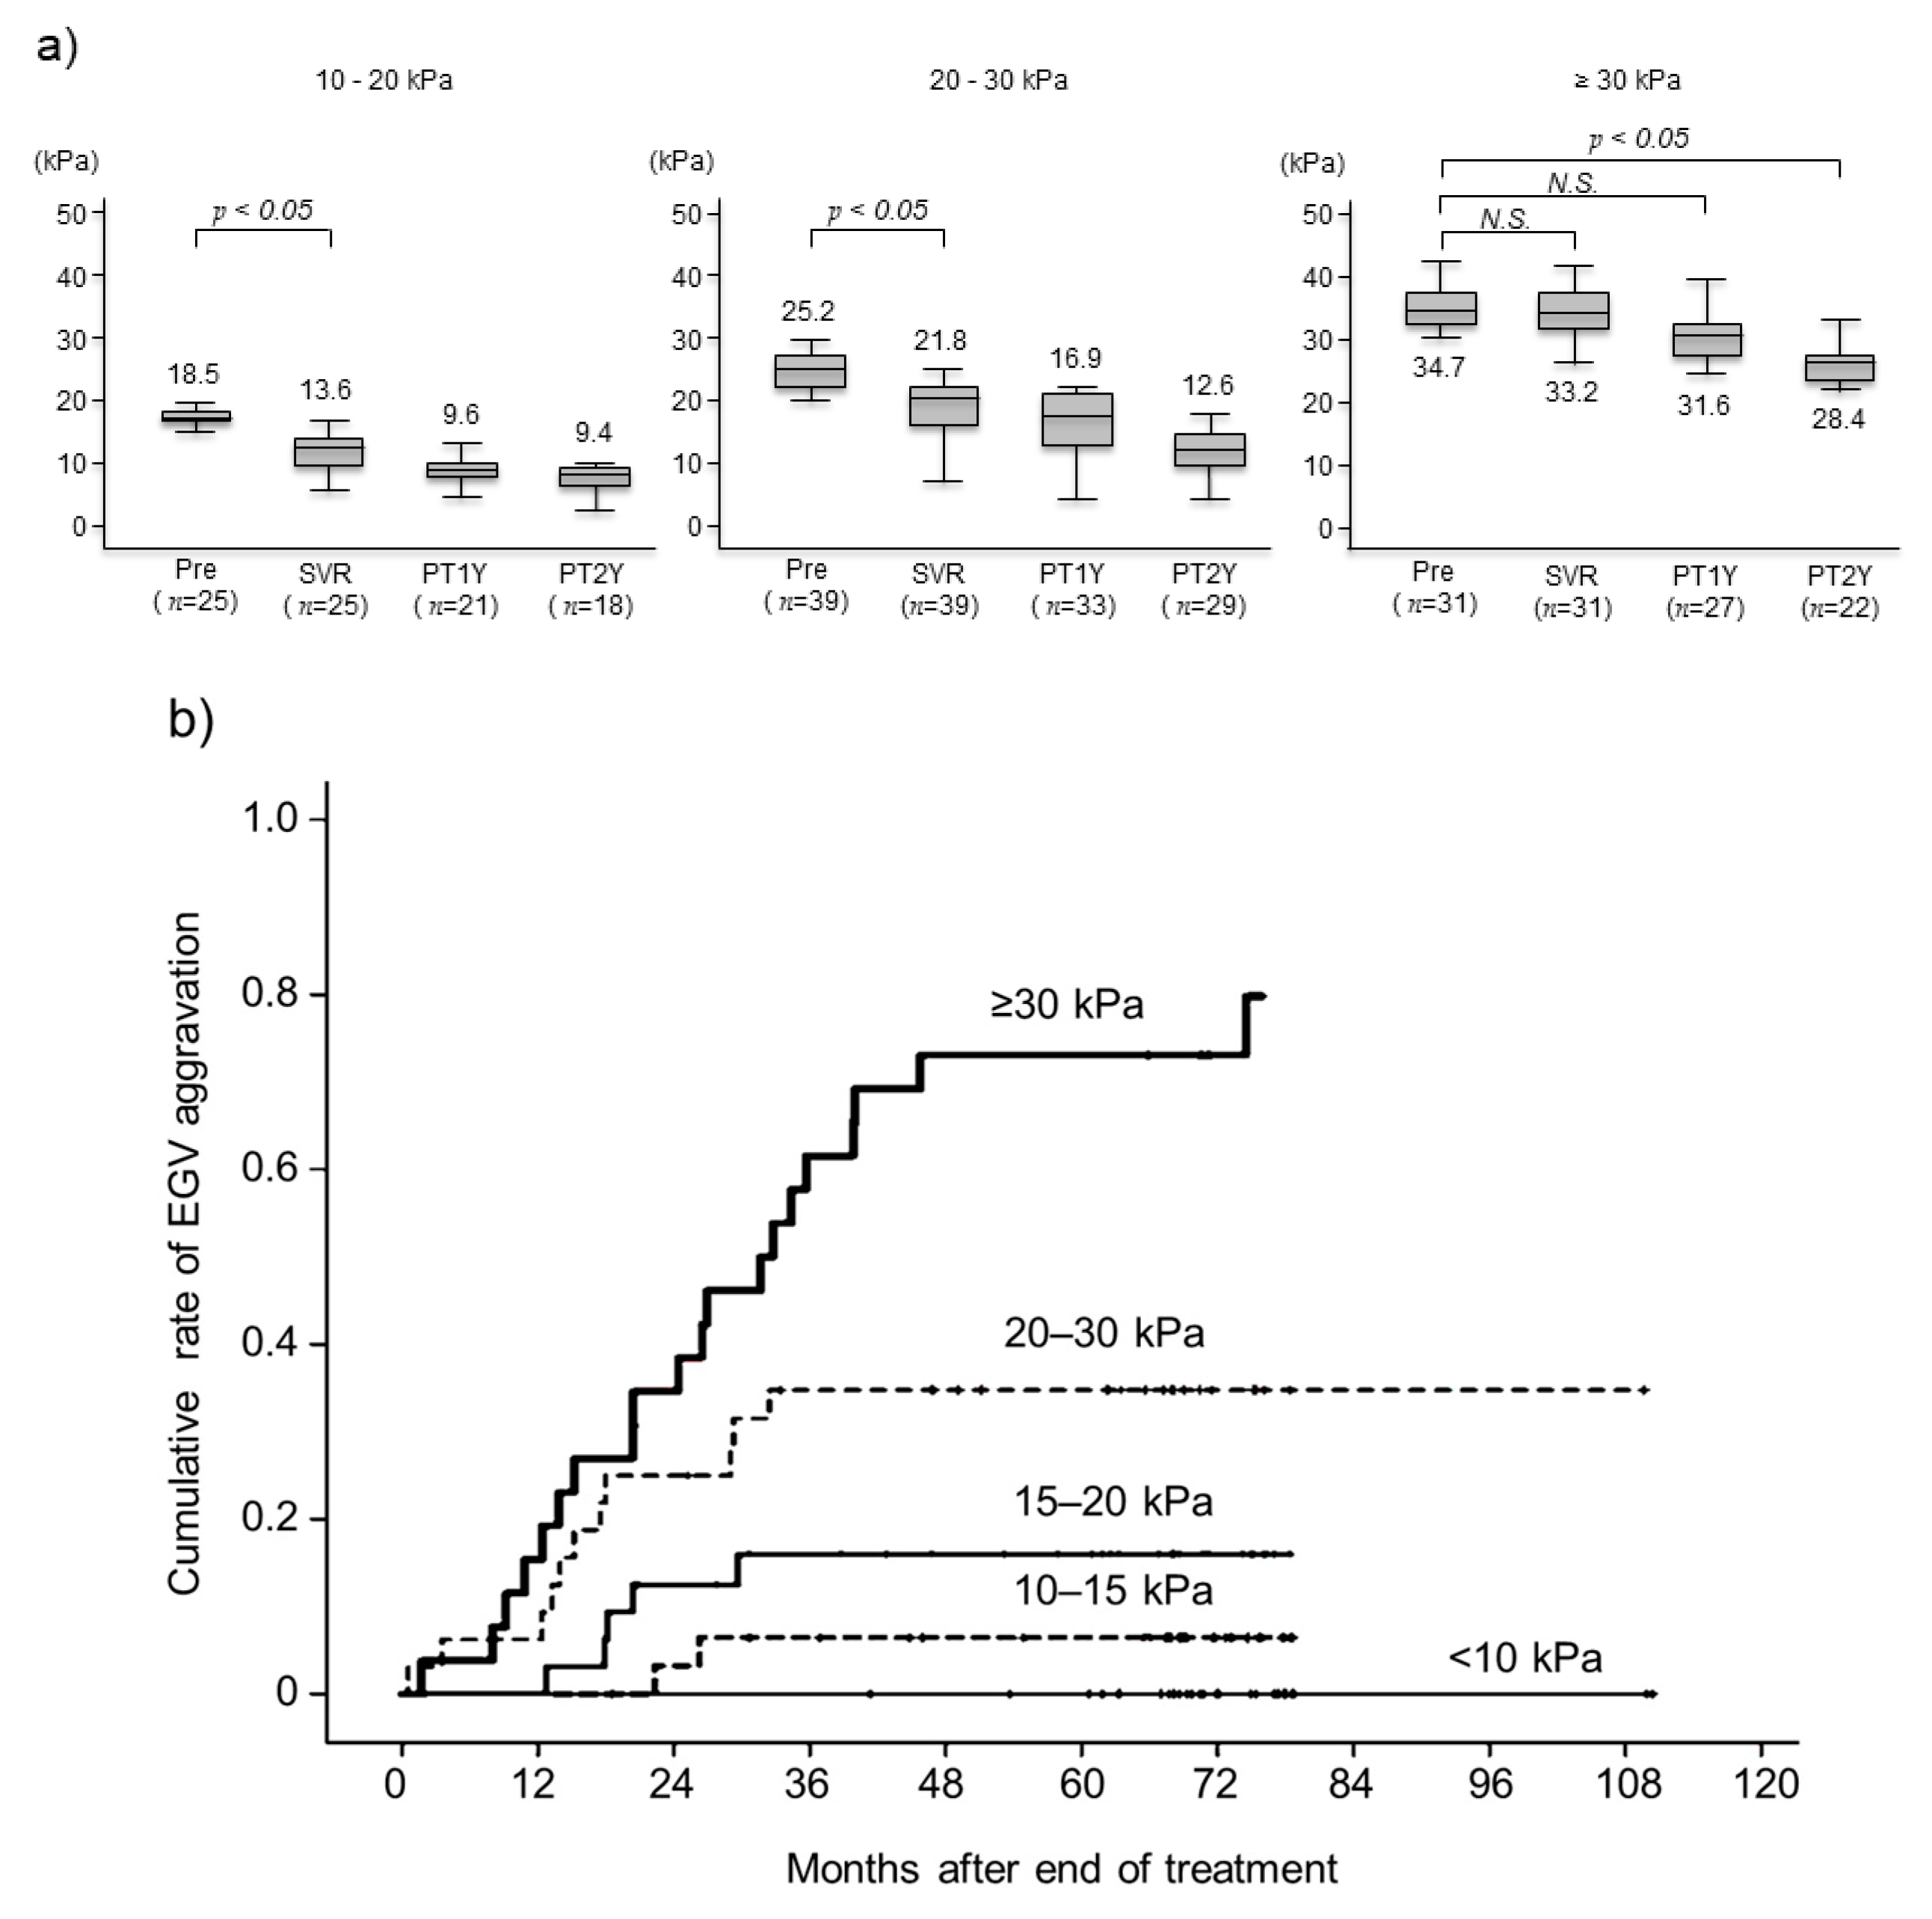
3.4. Changes in Liver Stiffness after Achieving SVR and Aggravated EGVs after Eradicating HCV by Pretreatment LSM

Because LSM seems to be associated with aggravated EGVs, we analyzed changes in LSM after SVR based on the pretreatment LSM level. In the group of patients with a pretreatment LSM of 15–20 kPa, the median LSM decreased significantly from 18.5 at pretreatment to 13.6 when SVR was achieved (p < 0.05) and further reduced to 9.6 and 9.4 kPa at 1 and 2 years from EOT, respectively (Figure 3a). In the group with an LSM of 20–30 kPa, the median LSM decreased significantly from 25.2 at pretreatment to 21.8 when SVR was achieved (p < 0.05) and further reduced to 16.9 and 12.6 kPa at 1 and 2 years from EOT, respectively. By contrast, in the group with pretreatment LSM ≥ 30 kPa, the median LSM decreased only slightly from 34.7 at pretreatment to 33.2 when SVR was achieved and 31.6 kPa at 1 year from EOT. These findings indicate that LSM is less likely to improve despite eliminating HCV when pretreatment LSM ≥ 30 kPa. We analyzed the association between aggravated EGVs and pretreatment LSM. The cumulative aggravated EGV rates at 1, 3, and 5 years were 14%, 63%, and 74% for the group with a pretreatment LSM ≥ 30 kPa; 10%, 31%, and 31% for the group with an LSM of 20–30 kPa; 4%, 16%, 16% for the group with an LSM of 15–20 kPa; and 0%, 0%, and 7% for the group with an LSM of 10–15 kPa, respectively (Figure 3b). By contrast, no patients with a pretreatment LSM < 10 kPa had aggravated EGVs (p < 0.001).

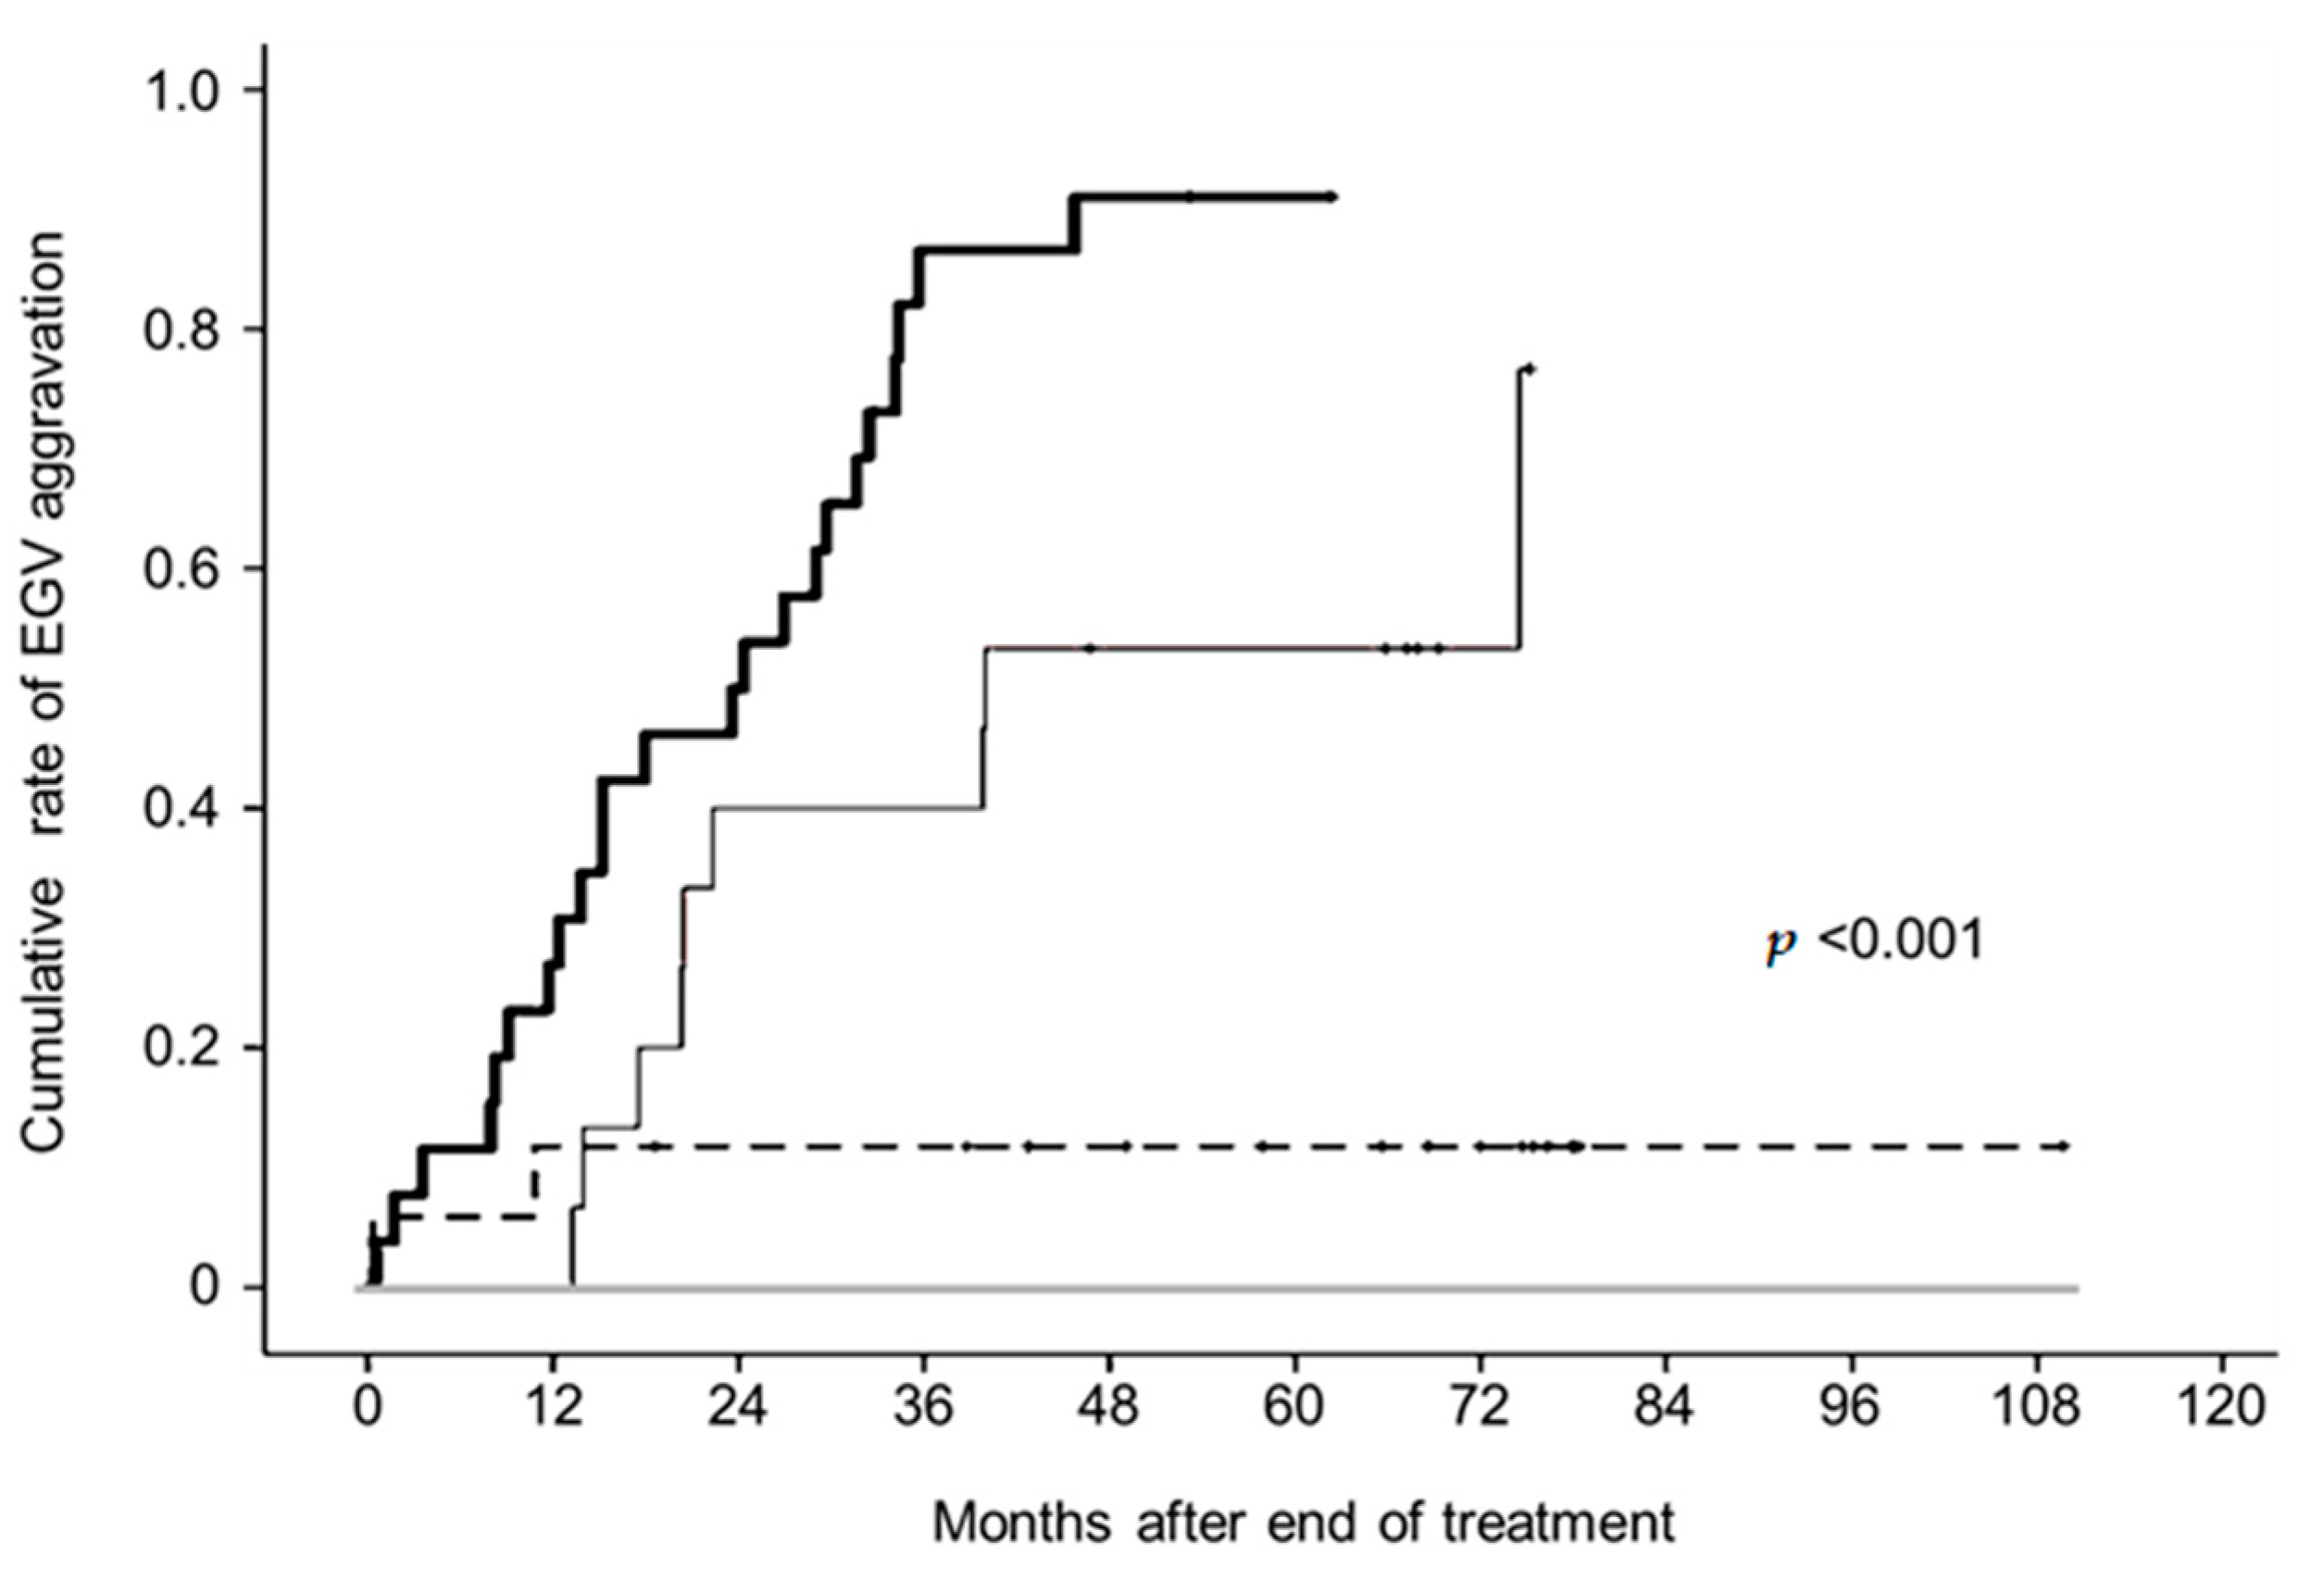
3.5. Serum Bile Acid and Predictive Factors Associated With Aggravated EGVs

The total serum bile acid level at 24 weeks from EOT was significantly correlated with LGV diameters (Figure 4). We then analyzed predictors for post-SVR aggravated EGVs, including serum total bile acid. Univariate analysis showed that platelet count, LSM, total bile acid level, autotaxin level, history of HCC, and the diameter of the LGV at 24 weeks from EOT were significantly associated with aggravated EGVs (Table 2). Multivariate analysis identified platelet count <11.0 × 10⁴/μL (hazard ratio [HR] 3.769 for ≥11.0 × 10⁴/μL, p = 0.008), LSM ≥ 18.0 kPa (HR 4.834 for <18.0 kPa; p = 0.006), total bile acid ≥ 33.0 μmol/L (HR 3.341 for <33.0 μmol/L, p = 0.009), and the diameter of LGV ≥ 5.0 mm when HCV was eradicated (HR 5.891 for <5.0 mm, p < 0.001) as independent risk factors for aggravated EGVs after achieving SVR. On the other hand, although the correlation between the LGV diameters at 24 weeks from EOT and autotaxin level is shown in Figure S1, autotaxin level was not a significant factor in multivariate analysis. Receiver operating characteristic curves were generated for both values, and the optimal cutoff values were identified as 11.0 × 10⁴/μL for platelet count at SVR, with an area under the curve (AUC) of 0.786 (p < 0.001), 18.0 kPa for liver stiffness at SVR with an AUC of 0.883 (p < 0.001), 5.0 mm for the maximal diameters of the LGV with an AUC of 0.901 (p < 0.001), and 33 μmol/L for total bile acid at SVR with an AUC of 0.767 (p < 0.001) (Figure 5).
We analyzed the cumulative rate of aggravated EGVs according to the number of risk factors. In patients who had all four risk factors, LGV diameter ≥ 5.0 mm, LSM ≥ 18.0 kPa, platelet count <11.0 × 10⁴/µL, and total bile acid ≥ 33.0 µmol/L, the cumulative EGV aggravation rates at 1, 3, and 5 years were 27%, 87%, and 91%, respectively. In patients with three risk factors, the cumulative aggravation rates at 1, 3, and 5 years were 7%, 40%, and 53%, respectively. In patients with two risk factors, the cumulative aggravation rates at 1, 3, and 5 years were 0%, 12%, and 12%, respectively. By contrast, none of the patients who had zero or one risk factors experienced aggravated EGVs during the observation period (p < 0.001) (Figure 6).

4. Discussion

During the median observation period of 69 months, 42 (25%) patients with HCV-related liver cirrhosis experienced an aggravation of their EGVs despite achieving SVR. This finding is consistent with previous reports that EGVs were aggravated in 13–58% of patients with HCV-related cirrhosis who achieved SVR [16,17].
Liver function and liver fibrosis estimates based on the ALBI score and FIB-4 index improved after SVR regardless of whether EGVs were aggravated. However, the median LSM failed to improve for the first two years when LGV worsened. Moreover, in patients who had LSM ≥ 30 kPa before treatment, the median LSM did not decrease until one year from EOT, and subsequently improved by two years from EOT. Furthermore, the cumulative aggravated EGV rates at 1, 3, and 5 years were 14%, 63%, and 74% for the group with a pretreatment LSM ≥ 30 kPa, and aggravation rates were significantly higher in the LSM ≥ 30 kPa group. Liver stiffness obtained by elastography has been reported to be useful not only for diagnosing liver fibrosis but also for diagnosing portal hypertension, especially clinically significant portal hypertension [18]. LSM is widely used as a non-invasive test for liver cirrhosis and portal hypertension [19]. In this study, the LSM cutoff in Figure 3 was used as a criterion for liver stiffness, and the analysis was performed using the LSM presented in the Baveno VII guideline as a reference [20]. Previously, according to the Baveno VI criteria, if liver stiffness by VCTE is LSM ≤ 15.0 kPa and platelet count ≥ 15 × 104/μL, clinically significant portal hypertension is excluded. However, in compensated cirrhosis patients whose liver stiffness with VCTE is LSM ≥ 20 kPa and platelet count ≤ 15 × 104 /μL, the presence of clinically significant portal hypertension cannot be ruled out, and upper gastrointestinal endoscopy is proposed [10]. Indeed, as shown in Figure 3a, when liver stiffness is already elevated before DAA therapy, a drastic reduction in liver stiffness is not expected after SVR because a long time is needed to improve liver stiffness, suggesting a high risk of EGV worsening. Furthermore, the aggravation of EGVs has been observed even when LSM was 10–15 kPa, so liver stiffness and platelets alone may not be sufficient; therefore, it is necessary to combine several risk factors to identify the conditions that aggravate EGVs.
Recently, spleen stiffness has been measured in the same way as liver stiffness and is reported to relate to EGV thickness and HVPG [21]. Furthermore, liver stiffness is positively correlated with EGVs in HCV-related cirrhosis patients [22]. Ogasawara et al. reported that liver stiffness 24 weeks after EOT is associated with aggravated EGVs in HCV-related cirrhosis patients after SVR [23]. Based on these observations, we believe it is important to evaluate EGV status before DAA therapy in patients with HCV-related cirrhosis.
This study newly found that total bile acids were associated with the diameter of LGV and were an independent factor for predicting EGV aggravation after SVR. Bile acids are produced in the liver and stored in the gallbladder. After meals, the stored bile acids are released into the small intestine. Approximately 95% of the bile acids in the intestinal tract are reabsorbed and return to the liver through the portal vein as part of the bile acid enterohepatic circulation [24]. Other than that, bile acid concentrations are influenced by absorption from the intestine [25], as well as uptake by hepatocytes [26], hepatic blood flow [27], and renal clearance [28]. Serum total bile acids are elevated in patients with liver cirrhosis [29,30], and portosystemic shunts are associated with elevated serum bile acid in peripheral blood [31,32]. Hayashi et al. measured portal pressure in patients who underwent percutaneous transhepatic portal vein puncture and showed that bile acid levels were positively associated with portal pressure [33]. Certainly, in portal hypertension, it is necessary to understand the status of portal venous pressure, and HVPG is used as a substitute for portal venous pressure [10]. However, since HVPG measurement is invasive and is not currently covered by insurance in Japan, non-invasive tests are needed for evaluating portal hypertension. In this study, we demonstrated the usefulness of total bile acids for indicating the changes in portal hypertension and its progress.
As mentioned above, several cases showed a worsening of EGVs after SVR even though LSM was low at the start of treatment. Therefore, we believe that it is necessary to use multiple factors, including other fibrosis markers, to identify cases with EGV aggravation. Here, we identified the following independent risk factors for post-SVR aggravated EGVs: platelet count < 11.0 × 10⁴/μL; LSM ≥ 18.0 kPa; total bile acid ≥ 33.0 μmol/L; and LGV diameter ≥ 5.0 mm. These findings are consistent with the Baveno VII guidelines [20], which recommends a surveillance of EGVs based on platelet count and LSM. The existence of EGVs or portosystemic collateral vessels increases the risk of aggravated EGVs and the incidence of portosystemic encephalopathy in patients with HCV-related cirrhosis, even after successfully eradicating HCV through DAA therapy [7,8,9]. By adding serum bile acid levels to these previously reported factors, the risk of aggravated EGVs can be stratified with higher accuracy. Patients with all four risk factors had a significantly higher risk of aggravated EGVs; thus, strict surveillance by dynamic CT and endoscopic examination is warranted for such patients. By contrast, no patients with one or none of these risk factors developed aggravated EGVs. These patients seem to have an extremely low risk of aggravated EGVs after SVR, suggesting that the surveillance of EGVs is not needed for such patients.

5. Conclusions

In conclusion, we found that even among patients who successfully achieved SVR following DAA therapy, portal hypertension did not immediately improve in patients with compensated liver cirrhosis, particularly those with at least two of the following risk factors: LGV diameter ≥ 5.0 mm, LSM > 18.0 kPa, platelet count < 11.0 × 10⁴/μL, and total bile acid ≥ 33.0 μmol/L. These patients may require monitoring for aggravated EGVs after SVR is achieved.

Supplementary Materials

The following supporting information can be downloaded at: https://www.mdpi.com/article/10.3390/livers4030025/s1, Figure S1. Correlation between the diameter of left gastric vein and autotaxin at the end of treatment.

Author Contributions

Conception and design: Y.N., M.T., H.A. and S.O.; Acquisition of data: Y.N., K.Y., Y.F., S.U., H.F., A.O., E.M., T.K., D.M., M.T., H.A. and S.O.; Analysis and interpretation of data: Y.N.; Drafting of the manuscript: Y.N.; Statistical analysis: Y.N.; Study supervision: C.N.H., M.T., H.A. and S.O.; Critical revision of the manuscript: M.T., H.A., C.N.H. and S.O. All authors have read and agreed to the published version of the manuscript. All authors agreed to be accountable for all aspects of the work in ensuring that questions related to the accuracy or integrity of any part of the work are appropriately investigated and resolved.

Funding

This study did not receive any funding.

Institutional Review Board Statement

All patients provided written informed consent to participate in the study in accordance with the ethical guidelines of the Declaration of Helsinki and in accordance with a program approved by the ethics committee of Hiroshima University Hospital.

Informed Consent Statement

All patients provided written informed consent to participate in the study in accordance with the ethical guidelines of the Declaration of Helsinki.

Data Availability Statement

All data generated or analyzed during this study are included in the published article.

Acknowledgments

The authors thank Emi Nishio for clerical assistance.

Conflicts of Interest

All authors declare no competing interests. Yuko Nagaoki is an employee of Mazda Motor Corporation. This paper did not receive support in the design of the experiment of this manuscript, provide materials and equipment, or funding support.

References

  1. Carrat, F.; Fontaine, H.; Dorival, C.; Simony, M.; Diallo, A.; Hezode, C.; De Ledinghen, V.; Larrey, D.; Haour, G.; Bronowicki, J.; et al. Clinical outcomes in patients with chronic hepatitis C after direct-acting antiviral treatment: A prospective cohort study. Lancet 2019, 393, 1453–1464. [Google Scholar] [CrossRef] [PubMed]
  2. Mauro, E.; Crespo, G.; Montironi, C.; Londoño, M.C.; Hernández-Gea, V.; Ruiz, P.; Lombardo, J.; Mariño, Z.; Díaz, A.; Colmenero, J.; et al. Portal pressure and liver stiffness measurements in the prediction of fibrosis regression after sustained virological response in recurrent hepatitis C. Hepatology 2018, 67, 1683–1694. [Google Scholar] [CrossRef] [PubMed]
  3. Mandorfer, M.; Kozbial, K.; Schwabl, P.; Freissmuth, C.; Schwarzer, R.; Stern, R.; Chromy, D.; Stättermayer, A.F.; Reiberger, T.; Beinhardt, S.; et al. Sustained virologic response to interferon-free therapies ameliorates HCV-induced portal hypertension. J. Hepatol. 2016, 65, 692–699. [Google Scholar] [CrossRef] [PubMed]
  4. Afdhal, N.; Everson, G.T.; Calleja, J.L.; McCaughan, G.W.; Bosch, J.; Brainard, D.M.; McHutchison, J.G.; De-Oertel, S.; An, D.; Charlton, M.; et al. Effect of viral suppression on hepatic venous pressure gradient in hepatitis C with cirrhosis and portal hypertension. J. Viral Hepatol. 2017, 24, 823–831. [Google Scholar] [CrossRef] [PubMed]
  5. Lens, S.; Alvarado-Tapias, E.; Mariño, Z.; Londoño, M.C.; LLop, E.; Martinez, J.; Fortea, J.I.; Ibañez, L.; Ariza, X.; Baiges, A.; et al. Effects of all-oral anti-viral therapy on HVPG and systemic hemodynamics in patients with hepatitis C virus-associated cirrhosis. Gastroenterology 2017, 153, 1273–1283. [Google Scholar] [CrossRef] [PubMed]
  6. Mandorfer, M.; Kozbial, K.; Schwabl, P.; Chromy, D.; Semmler, G.; Stättermayer, A.F.; Pinter, M.; Hernández-Gea, V.; Fritzer-Szekeres, M.; Steindl-Munda, P.; et al. Changes in hepatic venous pressure gradient predict hepatic decompensation in patients who achieved sustained virologic response to interferon-free therapy. Hepatology 2020, 71, 1023–1036. [Google Scholar] [CrossRef] [PubMed]
  7. Nagaoki, Y.; Aikata, H.; Kobayashi, T.; Fukuhara, T.; Masaki, K.; Tanaka, M.; Naeshiro, N.; Nakahara, T.; Honda, Y.; Miyaki, D.; et al. Risk factors for the exacerbation of esophageal varices or portosystemic encephalopathy after sustained virological response with IFN therapy for HCV-related compensated cirrhosis. J. Gastroenterol. 2013, 48, 847–855. [Google Scholar] [CrossRef] [PubMed]
  8. Nagaoki, Y.; Imamura, M.; Teraoka, Y.; Morio, K.; Fujino, H.; Ono, A.; Nakahara, T.; Murakami, E.; Yamauchi, M.; Kawaoka, T.; et al. Impact of viral eradication by direct-acting antivirals on the risk of hepatocellular carcinoma development, prognosis, and portal hypertension in hepatitis C virus-related compensated cirrhosis patients. Hepatol. Res. 2020, 50, 1222–1233. [Google Scholar] [CrossRef] [PubMed]
  9. Tsuji, S.; Uchida, Y.; Uemura, H.; Kouyama, J.I.; Naiki, K.; Nakao, M.; Motoya, D.; Sugawara, K.; Nakayama, N.; Imai, Y.; et al. Involvement of portosystemic shunts in impaired improvement of liver function after direct-acting antiviral therapies in cirrhotic patients with hepatitis C virus. Hepatol. Res. 2020, 50, 512–523. [Google Scholar] [CrossRef]
  10. de Franchis, R. Expanding consensus in portal hypertension: Report of the Baveno VI Consensus Workshop: Stratifying risk and individualizing care for portal hypertension. J. Hepatol. 2015, 63, 743–752. [Google Scholar] [CrossRef]
  11. Shao, X.; Uojima, H.; Setsu, T.; Okubo, T.; Atsukawa, M.; Furuichi, Y.; Arase, Y.; Hidaka, H.; Tanaka, Y.; Nakazawa, T.; et al. Usefulness of autotaxin for the complications of liver cirrhosis. World J. Gastroenterol. 2020, 26, 97–108. [Google Scholar] [CrossRef]
  12. Johnson, P.J.; Berhane, S.; Kagebayashi, C.; Satomura, S.; Teng, M.; Reeves, H.L.; O’Beirne, J.; Fox, R.; Skowronska, A.; Palmer, D.; et al. Assessment of liver function in patients with hepatocellular carcinoma: A new evidence-based approach-the ALBI grade. Clin. Oncol. 2015, 33, 550–558. [Google Scholar] [CrossRef]
  13. Sterling, R.K.; Lissen, E.; Clumeck, N.; Sola, R.; Correa, M.C.; Montaner, J.; Sulkowski, M.S.; Torriani, F.J.; Dieterich, D.T.; Thomas, D.L.; et al. Development of a simple noninvasive index to predict significant fibrosis in patients with HIV/HCV coinfection. Hepatology 2006, 43, 1317–1325. [Google Scholar] [CrossRef] [PubMed]
  14. Sandrin, L.; Fourquet, B.; Hasquenoph, J.M.; Yon, S.; Fournier, C.; Mal, F.; Christidis, C.; Ziol, M.; Poulet, B.; Kazemi, F.; et al. Transient elastography: A new noninvasive method for assessment of hepatic fibrosis. Ultrasound Med. Biol. 2003, 29, 1705–1713. [Google Scholar] [CrossRef] [PubMed]
  15. The Japan Society for Portal Hypertension. The General Rules for Study of Portal Hypertension, 3rd ed.; Kanehara: Tokyo, Japan, 2013; pp. 37–38. [Google Scholar]
  16. Puigvehí, M.; Londoño, M.C.; Torras, X.; Lorente, S.; Vergara, M.; Morillas, R.M.; Masnou, H.; Serrano, T.; Miquel, M.; Gallego, A.; et al. Impact of sustained virological response with DAAs on gastroesophageal varices and Baveno criteria in HCV-cirrhotic patients. J. Gastroenterol. 2020, 55, 205–216. [Google Scholar] [CrossRef] [PubMed]
  17. Di Marco, V.; Calvaruso, V.; Ferraro, D.; Bavetta, M.G.; Cabibbo, G.; Conte, E.; Cammà, C.; Grimaudo, S.; Pipitone, R.M.; Simone, F.; et al. Effects of eradicating hepatitis C virus infection in patients with cirrhosis differ with stage of portal hypertension. Gastroenterology 2016, 151, 130–139. [Google Scholar] [CrossRef] [PubMed]
  18. You, M.W.; Kim, K.W.; Pyo, J.; Huh, J.; Kim, H.J.; Lee, S.J.; Park, S.H. A Meta-analysis for the Diagnostic Performance of Transient Elastography for Clinically Significant Portal Hypertension. Ultrasound Med. Biol. 2017, 43, 59–68. [Google Scholar] [CrossRef] [PubMed]
  19. Berzigotti, A. Non-invasive evaluation of portal hypertension using ultrasound elastography. J. Hepatol. 2017, 67, 399–411. [Google Scholar] [CrossRef] [PubMed]
  20. de Franchis, R.; Bosch, J.; Garcia-Tsao, G.; Reiberger, T.; Ripoll, C. Baveno VII—Renewing consensus in portal hypertension. J. Hepatol. 2022, 76, 959–974. [Google Scholar] [CrossRef]
  21. Tseng, Y.; Li, F.; Wang, J.; Chen, S.; Jiang, W.; Shen, X.; Wu, S. Spleen and liver stiffness for noninvasive assessment of portal hypertension in cirrhotic patients with large esophageal varices. J. Clin. Ultrasound 2018, 46, 442–449. [Google Scholar] [CrossRef]
  22. Vizzutti, F.; Arena, U.; Romanelli, R.G.; Rega, L.; Foschi, M.; Colagrande, S.; Petrarca, A.; Moscarella, S.; Belli, G.; Zignego, A.L.; et al. Liver stiffness measurement predicts severe portal hypertension in patients with HCV-related cirrhosis. Hepatology 2007, 45, 1290–1297. [Google Scholar] [CrossRef] [PubMed]
  23. Ogasawara, N.; Saitoh, S.; Akuta, N.; Sezaki, H.; Suzuki, F.; Fujiyama, S.; Kawamura, Y.; Hosaka, T.; Kobayashi, M.; Suzuki, Y.; et al. Advantage of liver stiffness measurement before and after direct-acting antiviral therapy to predict hepatocellular carcinoma and exacerbation of esophageal varices in chronic hepatitis C. Hepatol. Res. 2020, 50, 426–438. [Google Scholar] [CrossRef] [PubMed]
  24. Liu, X.; Wang, Y. An overview of bile acid synthesis and its physiological and pathological functions. Yi Chuan 2019, 41, 365–374. [Google Scholar] [PubMed]
  25. LaRusso, N.F.; Hoffman, N.E.; Korman, M.G.; Hofmann, A.F.; Cowen, A.E. Determinants of fasting and postprandial serum bile acid levels in healthy man. Am. J. Dig. Dis. 1978, 23, 385–391. [Google Scholar] [CrossRef]
  26. Ahlberg, J.; Angelin, B.; Björkhem, I.; Einarsson, K. Individual bile acids in portal venous and systemic blood serum of fasting man. Gastroenterology 1977, 73, 1377–1382. [Google Scholar] [CrossRef]
  27. Gilmore, I.T.; Thompson, R.P.H. Kinetics of 14C-glycocholic acid clearance in normal man and in patients with liver disease. Gut 1978, 19, 1110–1115. [Google Scholar] [CrossRef]
  28. Lindblad, L.; Lundholm, K.; Schersten, T. Bile acid concentrations in systemic and portal serum in presumably normal man and in cholestatic and cirrhotic conditions. Scand. J. Gastroenterol. 1977, 12, 395–400. [Google Scholar] [CrossRef]
  29. Tarantino, G.; Cambri, S.; Ferrara, A.; Marzano, M.; Liberti, A.; Vellone, G.; Ciccarelli, A.F. Serum concentration of bile acids and portal hypertension in cirrhotic patients. Possible correlations. Riv. Eur. Sci. Med. Farmacol. 1989, 11, 195–205. [Google Scholar]
  30. Siciliano, M.; Milani, A.; Marra, L.; Rossi, L. Serum bile acids in cirrhosis: Correlation with liver function parameters and with the severity of the disease. Quad. Sclavo Diagn. Clin. Lab. 1986, 22, 355–361. [Google Scholar]
  31. Poupon, R.E.; Poupon, R.Y.; Grosdemouge, M.L.; Erlinger, S. Effect of portacaval shunt on serum bile acid concentration in patients with cirrhosis. Digestion 1977, 16, 138–145. [Google Scholar] [CrossRef]
  32. Ohkubo, H.; Okuda, K.; Lida, S.; Ohnishi, K.; Ikawa, S.; Makino, I. Role of portal and splenic vein shunts and impaired hepatic extraction in the elevated serum bile acids in liver cirrhosis. Gastroenterology 1984, 86, 514–520. [Google Scholar] [CrossRef] [PubMed]
  33. Hayashi, H.; Beppu, T.; Okabe, H.; Nitta, H.; Imai, K.; Doi, K.; Chikamoto, A.; Baba, H. Combined measurements of serum bile acid level and splenic volume may be useful to noninvasively assess portal venous pressure. J. Gastroenterol. 2012, 47, 1336–1341. [Google Scholar] [CrossRef] [PubMed]
Figure 1. Cumulative rate of esophagogastric varix (EGV) aggravation after the achievement of sustained virological response.
Livers 04 00025 g001
Figure 2. Changes in liver function and liver fibrosis following achievement of sustained virological response. Changes in ALBI score, FIB-4 index, and liver stiffness at baseline (Pre), SVR, and one year (PT1Y), two years (PT2Y), and three years (PT3Y) post-treatment in patients with and without aggravation of esophagogastric varices (EGVs). In these box-and-whisker plots, lines within the boxes represent median values. The upper and lower lines of the boxes represent the 75th and 25th percentiles, respectively, and the upper and lower bars outside the boxes represent the 90th and 10th percentiles, respectively.
Livers 04 00025 g002
Figure 3. (a) Changes in liver stiffness measurement (LSM). Patients were classified into three groups with respect to LSM at the start of antiviral therapy 15–20 kPa, 20–30 kPa, and ≥30 kPa. LSM was measured at baseline (Pre), SVR, one year (PT1Y), and two years (PT2Y). (b) Cumulative rate of esophagogastric varix (EGV) aggravation after end of treatment according to liver stiffness measurement (LSM) at the start of antiviral therapy.
Livers 04 00025 g003
Figure 4. Correlation between the diameter of the left gastric vein and total bile acid at the end of treatment.
Livers 04 00025 g004
Figure 5. Receiver operating characteristic curves for platelet count, liver stiffness measurement (LSM), diameter of the left gastric vein (LGV), and total bile acid at SVR.
Livers 04 00025 g005
Figure 6. Cumulative rate of esophagogastric varix (EGV) aggravation after the end of treatment. Patients were divided into four groups based on risk factors (the diameter of left gastric vein ≥ 5.0 mm, liver stiffness measurement > 18.0 kPa, platelet count < 11.0 × 10⁴/µL, and total bile acid ≥ 33.0 µmol/L). Patients having all four risk factors (thick solid line), three risk factors (thin solid line), two risk factors (long dotted line), and with one or no risk factors (gray solid line).
Livers 04 00025 g006
Table 1. Clinical characteristics of 167 patients with HCV-related compensated cirrhosis who achieved SVR by DAA therapy.
Category
Age, years74 (48–90)
Sex, male/female82/85
Body mass index, kg/m222.3 (14.7–39.1)
Total bilirubin, mg/dL0.8 (0.3–3.6)
Aspartate aminotransferase, IU/L49 (12–351)
Alanine aminotransferase, IU/L37 (82–54)
Albumin, g/dL3.9 (2.3–5.1)
Total cholesterol, mg/dL140 (75–256)
Ammonia, μg/dL40 (10–128)
Platelet count, ×104/μL9.8 (3.0–29.5)
Prothrombin activity, %83 (31–112)
Alfa-fetoprotein, ng/mL7.3 (1.1–482.9)
FIB-4 index 5.98 (3.27–26.09)
ALBI score−2.56 (−3.43–−1.28)
Liver stiffness measurement, kPa18.9 (5.6–44.2)
Total bile acid, µmol/L32.3 (1.73–17.7)
Autotaxin, mg/L1.89 (0.76–43.29)
Past history of HCC treatment *, yes/no89/78
Diameter of left gastric vein, mm4.9 (2.8–13.9)
Diameter of splenorenal shunt, mm8.1 (6.7–23.1)
Esophagogastric varices, F1/ F241/7
Gastric varices, F1/F21/2
DAA regimen, n
Daclatasvir/asunaprevir81
Sofosbuvir /ledipasvir31
Ombitasvir/paritaprevir/ritonavir16
Elbasvir/grazoprevir6
Daclatasvir/asunaprevir/beclabuvir1
Sofosbuvir + ribavirin19
Glecaprevir/pibrentasvir16
Continuous data are represented as median and range, and categorical data are represented as counts of patients. *, DAA therapy was received after curative treatment for HCC. FIB-4 index, Fibrosis-4 index; ALBI, albumin–bilirubin grade; HCC, hepatocellular carcinoma.
Table 2. Univariate and multivariate analyses of risk factors associated with aggravation of esophagogastric varices after eradicating HCV.
CategoryUnivariate Analysis
p-Value
Multivariate Analysis
HR (95% CI)
p-Value
Age, <70/70≤ years0.559
Sex, male/female0.649
Body mass index, <23/23≤ kg/m20.562
Total bilirubin, <1.0/1.0≤ mg/dL0.656
Aspartate aminotransferase,
<30/30≤ IU/L
0.317
Alanine aminotransferase,
<20/20≤ IU/L
0.258
Albumin, <4.2/4.2≤ g/dL0.086
Total cholesterol, <170/170≤ mg/dL0.382
Ammonia, <40/40≤ μg/dL0.426
Platelet count, <11.0/11.0≤ ×104/μL<0.0013.769 (1.424–9.977)0.008
Prothrombin activity, <80/80≤ %0.351
Alfa-fetoprotein, <5.0/5.0≤ ng/mL0.763
FIB-4 index, <4.39/4.39≤0.482
ALBI score, <–2.82/–2.82≤0.095
Liver stiffness measurement,
<18.0/18.0≤ kPa
<0.0014.834 (1.706–10.794)0.006
Total bile acid, <33.0/33.0≤ µmol/L<0.0013.341 (1.350–8.173)0.009
Autotaxin, <1.9/1.9≤ mg/L0.0081.921 (0.685–5.832)0.286
Past history of HCC treatment *, yes/no0.0221.532 (0.523–4.386)0.485
Diameter of left gastric vein,
<5.0/5.0≤ mm
<0.0015.891(2.596–14.228)<0.001
Diameter of splenorenal shunt,
<8.0/8.0≤ mm
0.051
FIB-4 index, Fibrosis-4 index; ALBI, albumin–bilirubin; HCC, hepatocellular carcinoma; HR, hazard ratio; CI, confidence interval. *, DAA therapy was received after curative treatment for HCC.
Disclaimer/Publisher’s Note: The statements, opinions and data contained in all publications are solely those of the individual author(s) and contributor(s) and not of MDPI and/or the editor(s). MDPI and/or the editor(s) disclaim responsibility for any injury to people or property resulting from any ideas, methods, instructions or products referred to in the content.

