Article

The Hepatitis B Virus PreS1/HBsAg Ratio Is a Predictive Marker for the Occurrence of Hepatocellular Carcinoma

1
Department of Gastroenterology, Graduate School of Biomedical and Health Sciences, Hiroshima University, Hiroshima 734-8551, Japan
2
Liver Center, Hiroshima University, Hiroshima 734-8551, Japan
*
Authors to whom correspondence should be addressed.
Livers 2024, 4(3), 364-376; https://doi.org/10.3390/livers4030026
Submission received: 27 June 2024 / Revised: 22 July 2024 / Accepted: 26 July 2024 / Published: 2 August 2024
(This article belongs to the Special Issue Viral Hepatitis: Prevention, Infection, and Treatment)

Abstract

:
The preS1 region of the large hepatitis B virus (HBV) surface protein is a crucial component in HBV infection; however, its impact on the development of hepatocellular carcinoma (HCC) remains unknown. This study investigated the relationship between serum preS1 levels and hepatocarcinogenesis in patients with chronic hepatitis B (CHB). The preS1 levels were measured in 531 patients with CHB without a history of HCC. Among the patients, 293 HBV carriers who had never received nucleotide/nucleoside analog (NA) therapy had their preS1 levels measured at their first visit (non-NA group), and 238 patients who had received NA therapy had their preS1 levels measured at the start of NA administration (NA group). The two groups had no significant differences in hepatitis B surface antigen (HBsAg) levels; however, the NA group’s preS1/HBsAg ratio was significantly higher. The preS1/HBsAg ratio was significantly different between patients with CHB not meeting the NA treatment criteria and patients with chronic hepatitis and cirrhosis who were eligible for NA treatment. The predictors of HCC development were analyzed, and the preS1/HBsAg ratio was identified in both groups. The preS1/HBsAg ratio could predict hepatocarcinogenesis in patients with CHB with or without NA administration.

1. Introduction

A universal vaccination program to prevent hepatitis B virus (HBV) infection has been implemented worldwide, yet approximately 1.5 million new HBV infections occur annually, and 296 million people are thought to have chronic HBV (CHB) infection [1]. To prevent severe liver conditions such as cirrhosis, hepatocellular carcinoma (HCC), and liver failure, patients with CHB receive antiviral treatments using pegylated interferon and/or nucleotide/nucleoside analogs (NAs). However, once HBV infects human hepatocytes, its genome forms a covalently closed circular DNA (cccDNA) mini-chromosome in the nucleus, complicating eradication. Therefore, the current guidelines for managing CHB recommend long-term treatment with NAs [2,3,4,5]. These guidelines provide criteria for starting antiviral therapy based on the liver fibrosis stage, the serum alanine aminotransferase (ALT) level, and the serum HBV DNA level to select appropriate patients. Although there are some differences among the criteria, patients whose HBV DNA and ALT levels are above the thresholds are recommended to start antiviral therapies. In contrast, the status of cases in the “gray zone”, where only one of the HBV DNA or ALT levels fails to meet the NA initiation criteria, remains unclear. Considering a report that demonstrated high incidences of HCC or the progression of liver fibrosis in gray-zoned patients [6,7,8,9,10], it is essential to identify patients in the gray zone who need antiviral therapies.
The S gene in the HBV genome encodes three overlapping viral surface antigens: small (S-HB), medium (M-HB), and large hepatitis B surface (L-HB) proteins. The S-HB protein, or the hepatitis B surface antigen (HBsAg), is the most abundant surface antigen and acts as the common C-terminal domain of all three surface antigens. The M-HB protein, consisting of preS2 and S-HB region, originates from a transcript starting at the upstream codon of the S-HB region. The L-HB protein contains an N-terminal preS1 and the M-HB protein [11,12]. The preS1 plays an important role in the HBV infection process [13]. The preS1 has been demonstrated to play several essential roles in the HBV life cycle, affecting intracellular signal transduction pathways such as endoplasmic reticulum (ER) stress and carcinogenesis [14]. The preS1 within the L-HBs protein is essential for viral entry as the HBV receptor-binding site interacts with the sodium taurocholate co-transporting polypeptide on the hepatocyte cell surface [15,16]. However, the impact of the preS1 on the clinical course of chronic hepatitis B, such as the activation of hepatitis, the progression of liver fibrosis, and the development of HCC, is not well known. We have previously reported that the preS1/HBsAg ratio may be a predictive marker for HCC development in patients with CHB [17]. However, the influence of NAs was not considered. This study investigated the association between preS1/HBsAg and hepatocarcinogenesis across different clinical stages in patients with and without NAs. To our knowledge, no previous research has evaluated the impact of NA therapy on the preS1/HBsAg ratio or its variation by clinical stage. Therefore, we assessed the association between the preS1/HBsAg ratio and the incidence of HCC in patients regarding NA therapy.

2. Materials and Methods
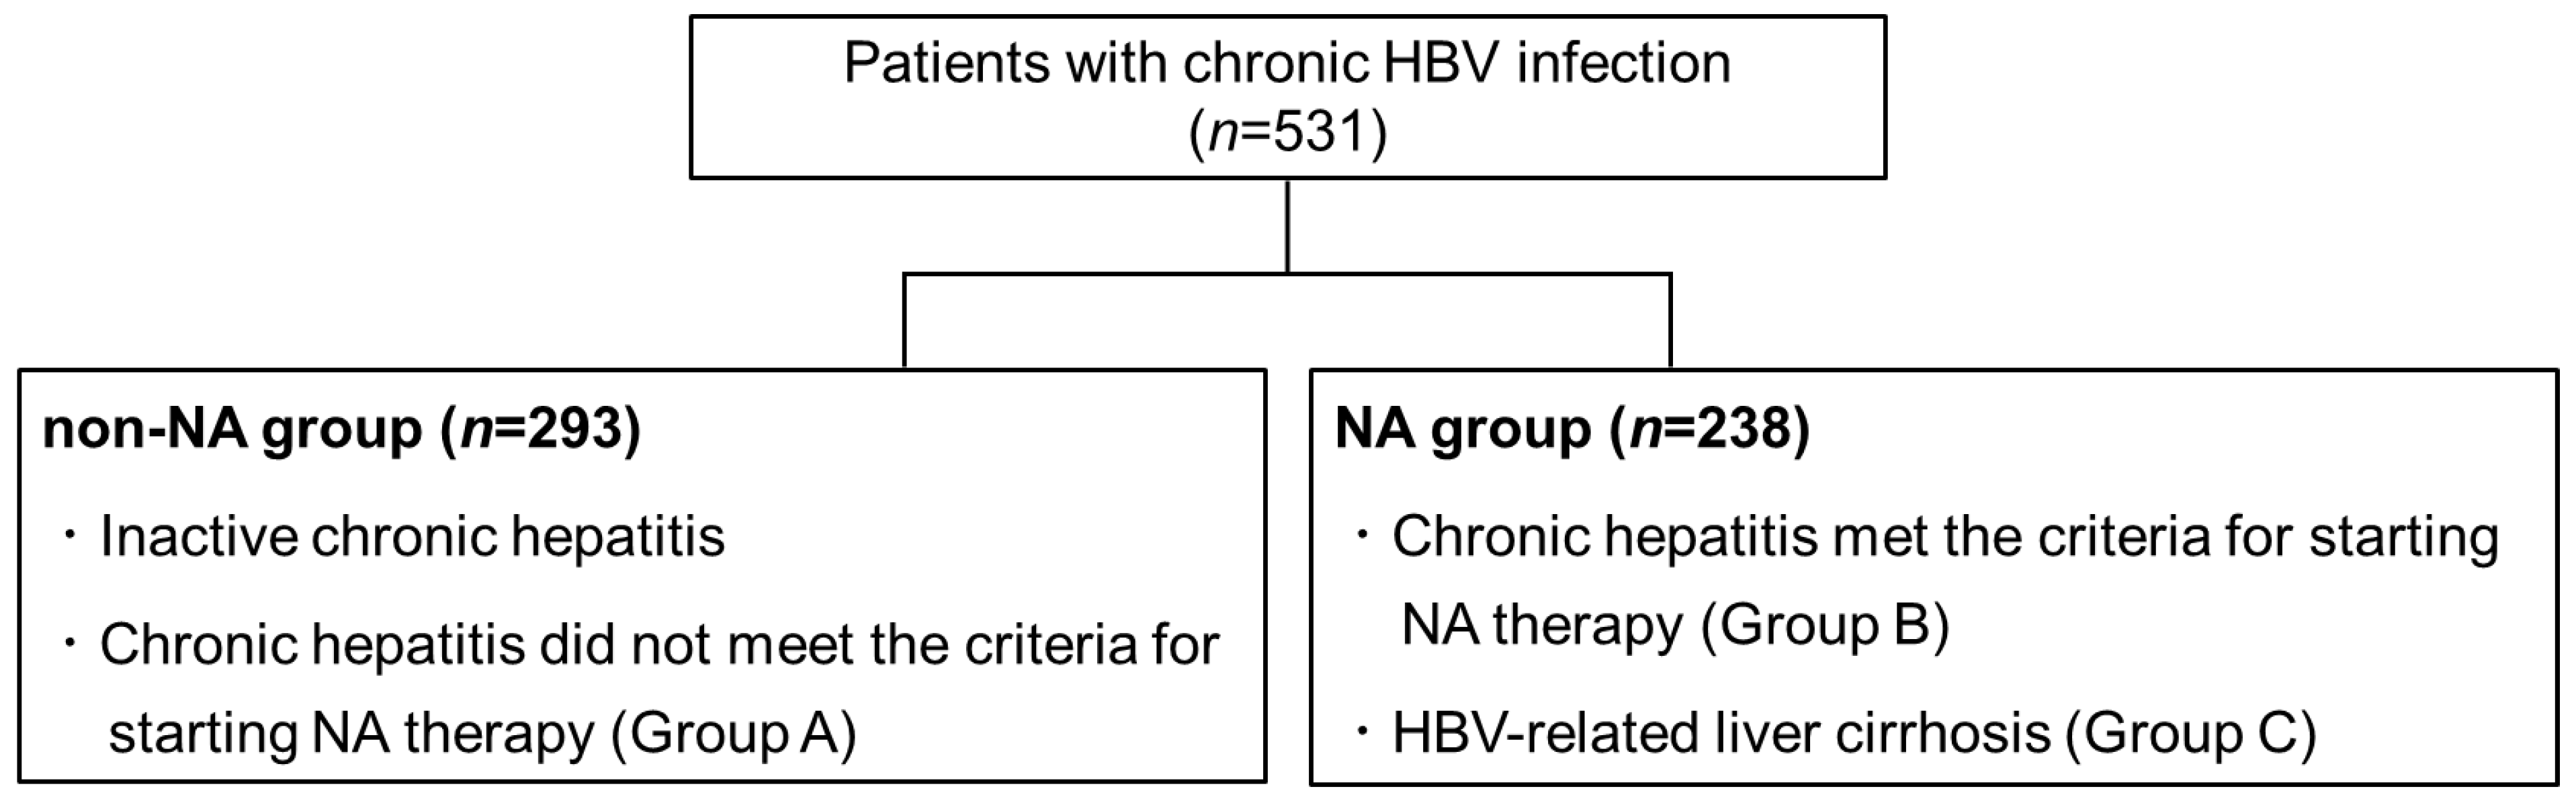
2.1. Patients

This study involved 531 patients with chronic hepatitis B infection who visited Hiroshima University Hospital (Hiroshima, Japan) from January 2001 to August 2021. The patients were diagnosed according to the guidelines [5] and were not in the immune tolerance phase. The following criteria were used for exclusion: (1) coinfection with hepatitis C or human immunodeficiency virus, (2) autoimmune hepatitis or primary biliary cholangitis, (3) acute liver failure at the first visit, (4) patients receiving NA for the prevention of HBV reactivation, (5) a history of HCC or other malignancies, (6) a history of liver transplantation before NA therapy, (7) patients with an ethanol intake > 60 g/day were excluded to avoid the confounding effects of alcoholic liver dysfunction [18], and (8) an observation period of <12 months. We diagnosed chronic hepatitis and cirrhosis using a liver biopsy, a liver stiffness assessment, and imaging techniques, such as computed tomography and ultrasonography. All the patients provided written informed consent to participate in the study. Patients could ask questions and withdraw from the study at any time without impacting their medical care. The experimental protocol conformed to the ethical guidelines of the Declaration of Helsinki and was approved by the Ethics Committee of Hiroshima University Hospital (approval ID: E2022-0274). The patients were divided into two groups based on whether they received NA therapy. Of 531 patients, 238 who received NA therapy (adefovir; ADV, lamivudine; LAM, entecavir; ETV, tenofovir disoproxil fumarate; TDF, tenofovir alafenamide; TAF) for active chronic hepatitis or liver cirrhosis were assigned to the NA group. The remaining 293 patients, who were inactive carriers or had inactive chronic hepatitis and did not meet the criteria for starting NA therapy according to the Japan Society of Hepatology guidelines [5], were assigned to the non-NA group. Furthermore, the enrolled patients other than inactive carriers with low HBV DNA and ALT < 30 were divided into the following three groups depending on the clinical stage of chronic HBV infection: Of the 293 patients in the non-NA group, 193 were classified as Group A as patients diagnosed with chronic hepatitis with high HBV DNA or ALT > 30. However, they did not meet the criteria for the initiation of NA treatment. Of the 238 patients in the NA group, 138 patients were classified as Group B as patients diagnosed with chronic hepatitis who met the criteria for starting NA therapy, and 100 patients were classified as Group C as patients with liver cirrhosis (Figure 1).
Blood samples were obtained from patients in the NA group before the start of therapy and from those in the non-NA group at the initial visit. The biochemical and hematological tests were performed at our hospital. The remaining serum samples were stored at −80 °C for further analysis.

2.2. Quantification of PreS1 and HBsAg Level

As previously reported, we constructed hybridoma clones using the iliac lymph node method to produce anti-preS1 antibodies. We conducted epitope mapping and developed an enzyme-linked immunosorbent assay (ELISA) system to measure preS1 levels in serum [19]. The assay procedure is outlined as follows: To quantify the total levels of preS1 and HBsAg, we used ARCHITECT® chemiluminescent immunoassay technology to perform preS1 and HBsAg prototype assays. Antibodies targeting the common ‘a’ determinant loop of both isoforms were immobilized on the solid phase, and HBsAg-containing particles were captured. We used an acridinium-labeled anti-HBsAg goat polyclonal antibody and acridinium-labeled anti-preS1-specific antibodies, respectively. The chemiluminescence reaction results were measured in relative light units. The concentrations of preS1 and HBsAg were determined by utilizing the calibration curves generated for each assay. The HBsAg calibrators were standardized by following the WHO Third International Standard for HBsAg (NIBSC code: 12/226). The preS1 calibrators were prepared using recombinant preS1 obtained from Beacle, Inc., Kyoto, Japan. In this study, HBsAg is used as a log value rather than in international units per milliliter (IU/mL), and preS1 is measured in nanograms per milliliter (ng/mL).

2.3. Measurement of Other HBV-Related Markers

Hepatitis B e antigen (HBeAg) levels were measured using a commercial chemiluminescence enzyme-linked immunoassay kit (Lumipulse®, Fujirebio Inc., Tokyo, Japan). HBV DNA levels were measured using a real-time PCR assay (COBAS® TaqMan HBV Test; Roche Diagnostics, Tokyo, Japan). The detectable range for HBV DNA quantification was 1.3 to 8.2 log IU/mL.

2.4. Liver Fibrosis Indices

The fibrosis-4 (FIB-4) index was calculated according to the published formulae (age [years] × aspartate aminotransferase (AST) [IU/L])/platelet count [109/L] × alanine aminotransferase (ALT) [IU/L]1/2) [20].

2.5. Statistical Analysis

The categorical variables were presented as frequencies, and the continuous variables were presented as medians and ranges. Spearman’s rank correlation coefficient was used to evaluate the relationship between preS1 and other factors. The Mann–Whitney U test was used to compare values for the clinical stage. We categorized the patients into two groups based on the cut-off values determined using Receiver Operating Characteristic (ROC) curves, and univariate analysis using the log-rank test and multivariate analysis using the Cox proportional hazards model were used to identify the predictive factors contributing to the development of HCC. Several univariate variables showed similar effects and were highly correlated. To address potential multicollinearity and simplify the model, multivariate analyses combined these correlated variables into one composite variable where possible. The number at risk indicates the number of people remaining by the time of that analysis. Statistical significance was set at p < 0.05 for all analyses. The statistical analyses were performed using EZR ver. 1.54 software (Saitama Medical Center, Jichi Medical University, Saitama, Japan) [21].

3. Results

3.1. A Comparison of the Initial Values between the NA Group and the Non-NA Group

The baseline characteristics of the 531 patients are presented in Table 1. The median observation period was 7.6 years. A total of 161 and 176 patients in the NA and non-NA groups were male. Their median ages at the initial visit were 44 and 48 years, respectively. Forty-eight patients in the NA group and twenty-eight patients in the non-NA group tested positive for HBeAg. Median hepatitis B surface antigen (HBsAg) levels and HBV DNA levels were 3.4 Log IU/mL and 5.4 Log IU/mL in the NA group and 3.4 Log IU/mL and 3.8 Log IU/mL in the non-NA group, respectively. We compared each factor between NA and non-NA groups; the two groups differed significantly in several factors. In the NA group, there were more cases of chronic inflammation and fibrosis, and significantly higher AST and ALT levels, lower platelet counts, lower albumin levels, and higher FIB-4 index levels were observed compared to the non-NA group (all p < 0.001). Although no difference in HBsAg levels was observed between the NA and non-NA groups (p = 0.600), and the preS1 level and the preS1/HBsAg ratio in the non-NA group were significantly lower than those in the NA group (p < 0.001 and p < 0.001, respectively). In the non-NA and NA groups, each item was compared by age and gender. In the non-NA group, AST and ALT were significantly higher in males, and HBsAg, preS1, the preS1/HBsAg ratio, and HBV-DNA were higher in younger persons. In the NA group, males were significantly younger, and AST, ALT, HBsAg, and preS1 values were higher in younger patients, but the preS1/HBsAg ratio was not significantly different by age (Tables S1–S4). The relationship between age and preS1, HBsAg, and the preS1/HBsAg ratio was analyzed. PreS1 and HBsAg levels showed significant negative correlations with age. In contrast, the preS1/HBsAg ratio showed a significant positive correlation with age (Figure 2). Despite similar levels of preS1 and HBsAg in males and females, the higher preS1/HBsAg ratio in males may experience more advanced liver fibrosis or have a higher risk of hepatocellular carcinoma (Figure 3).

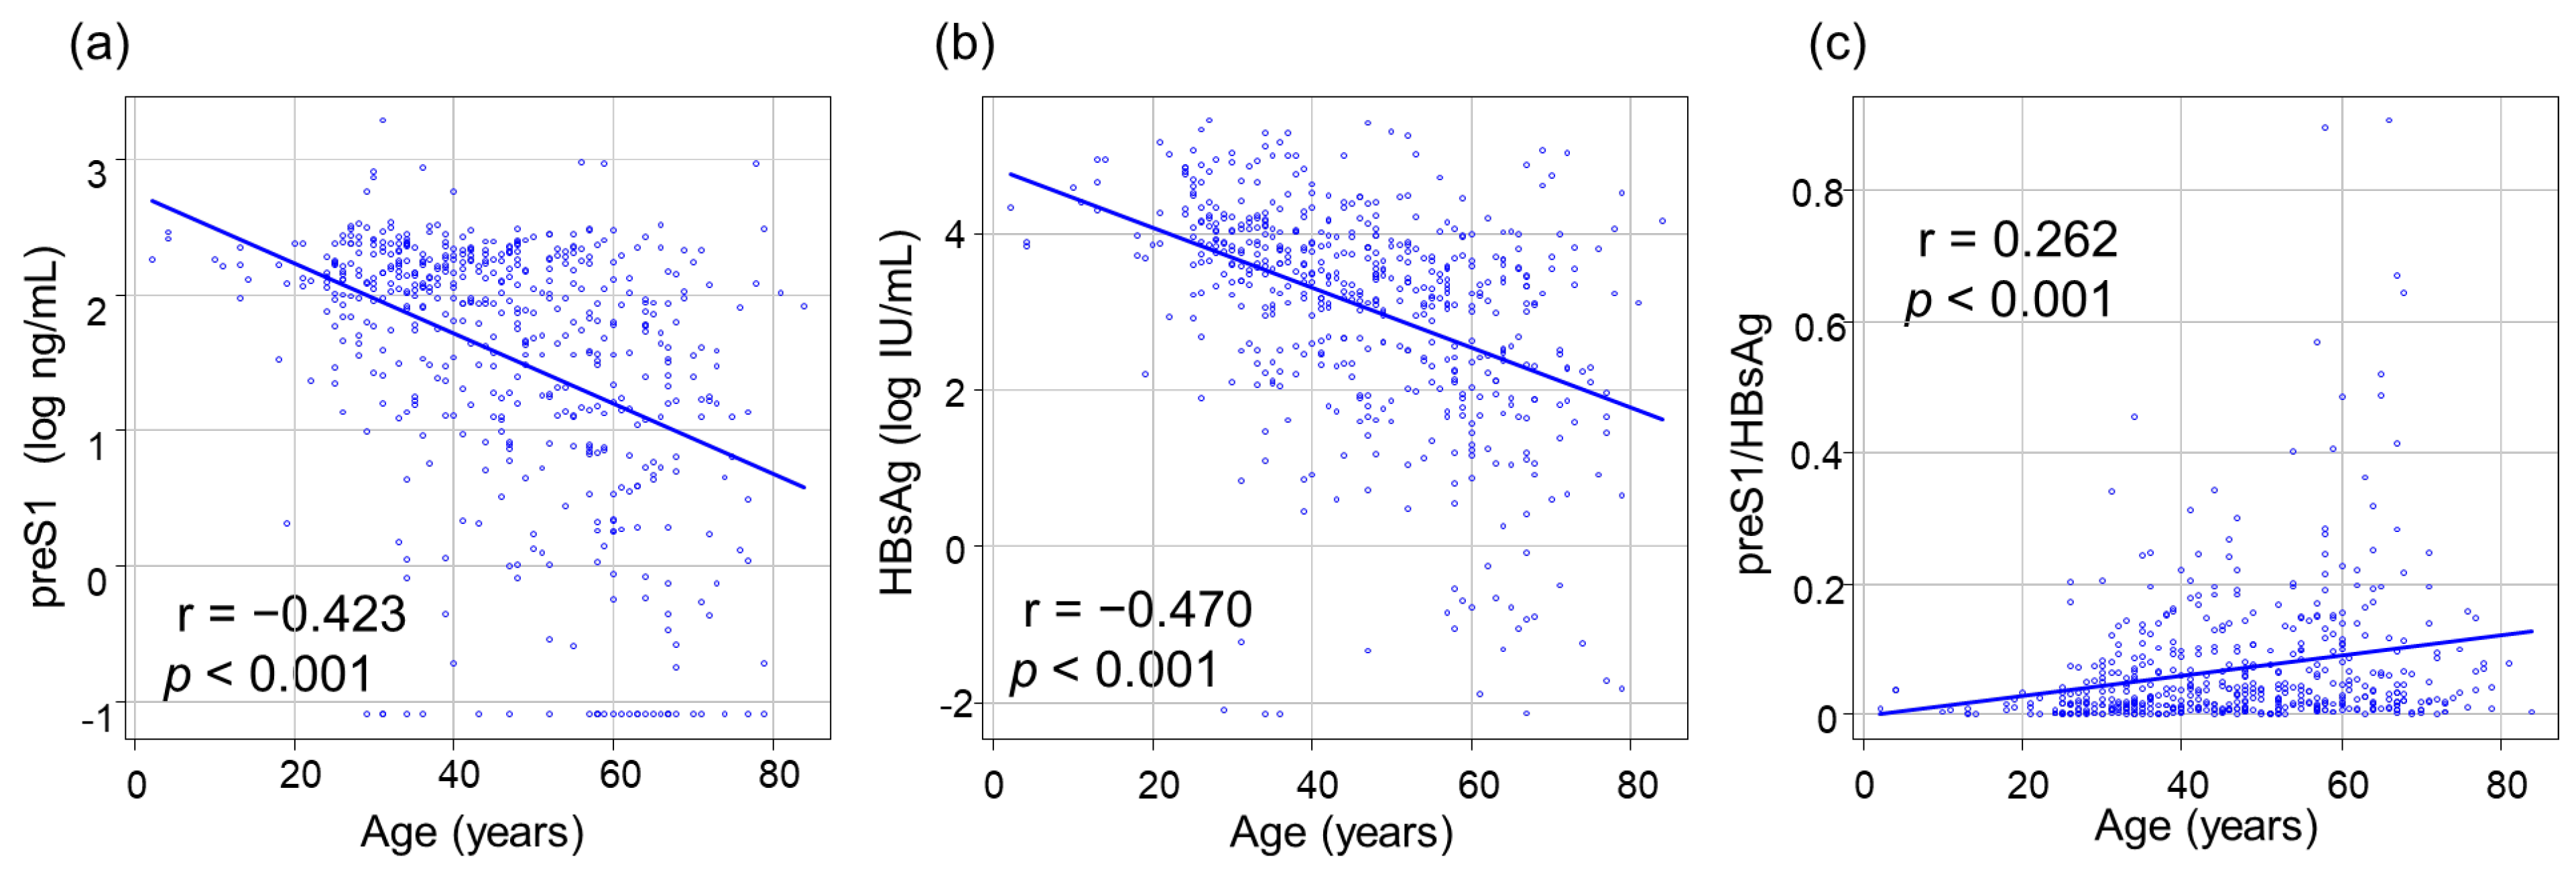
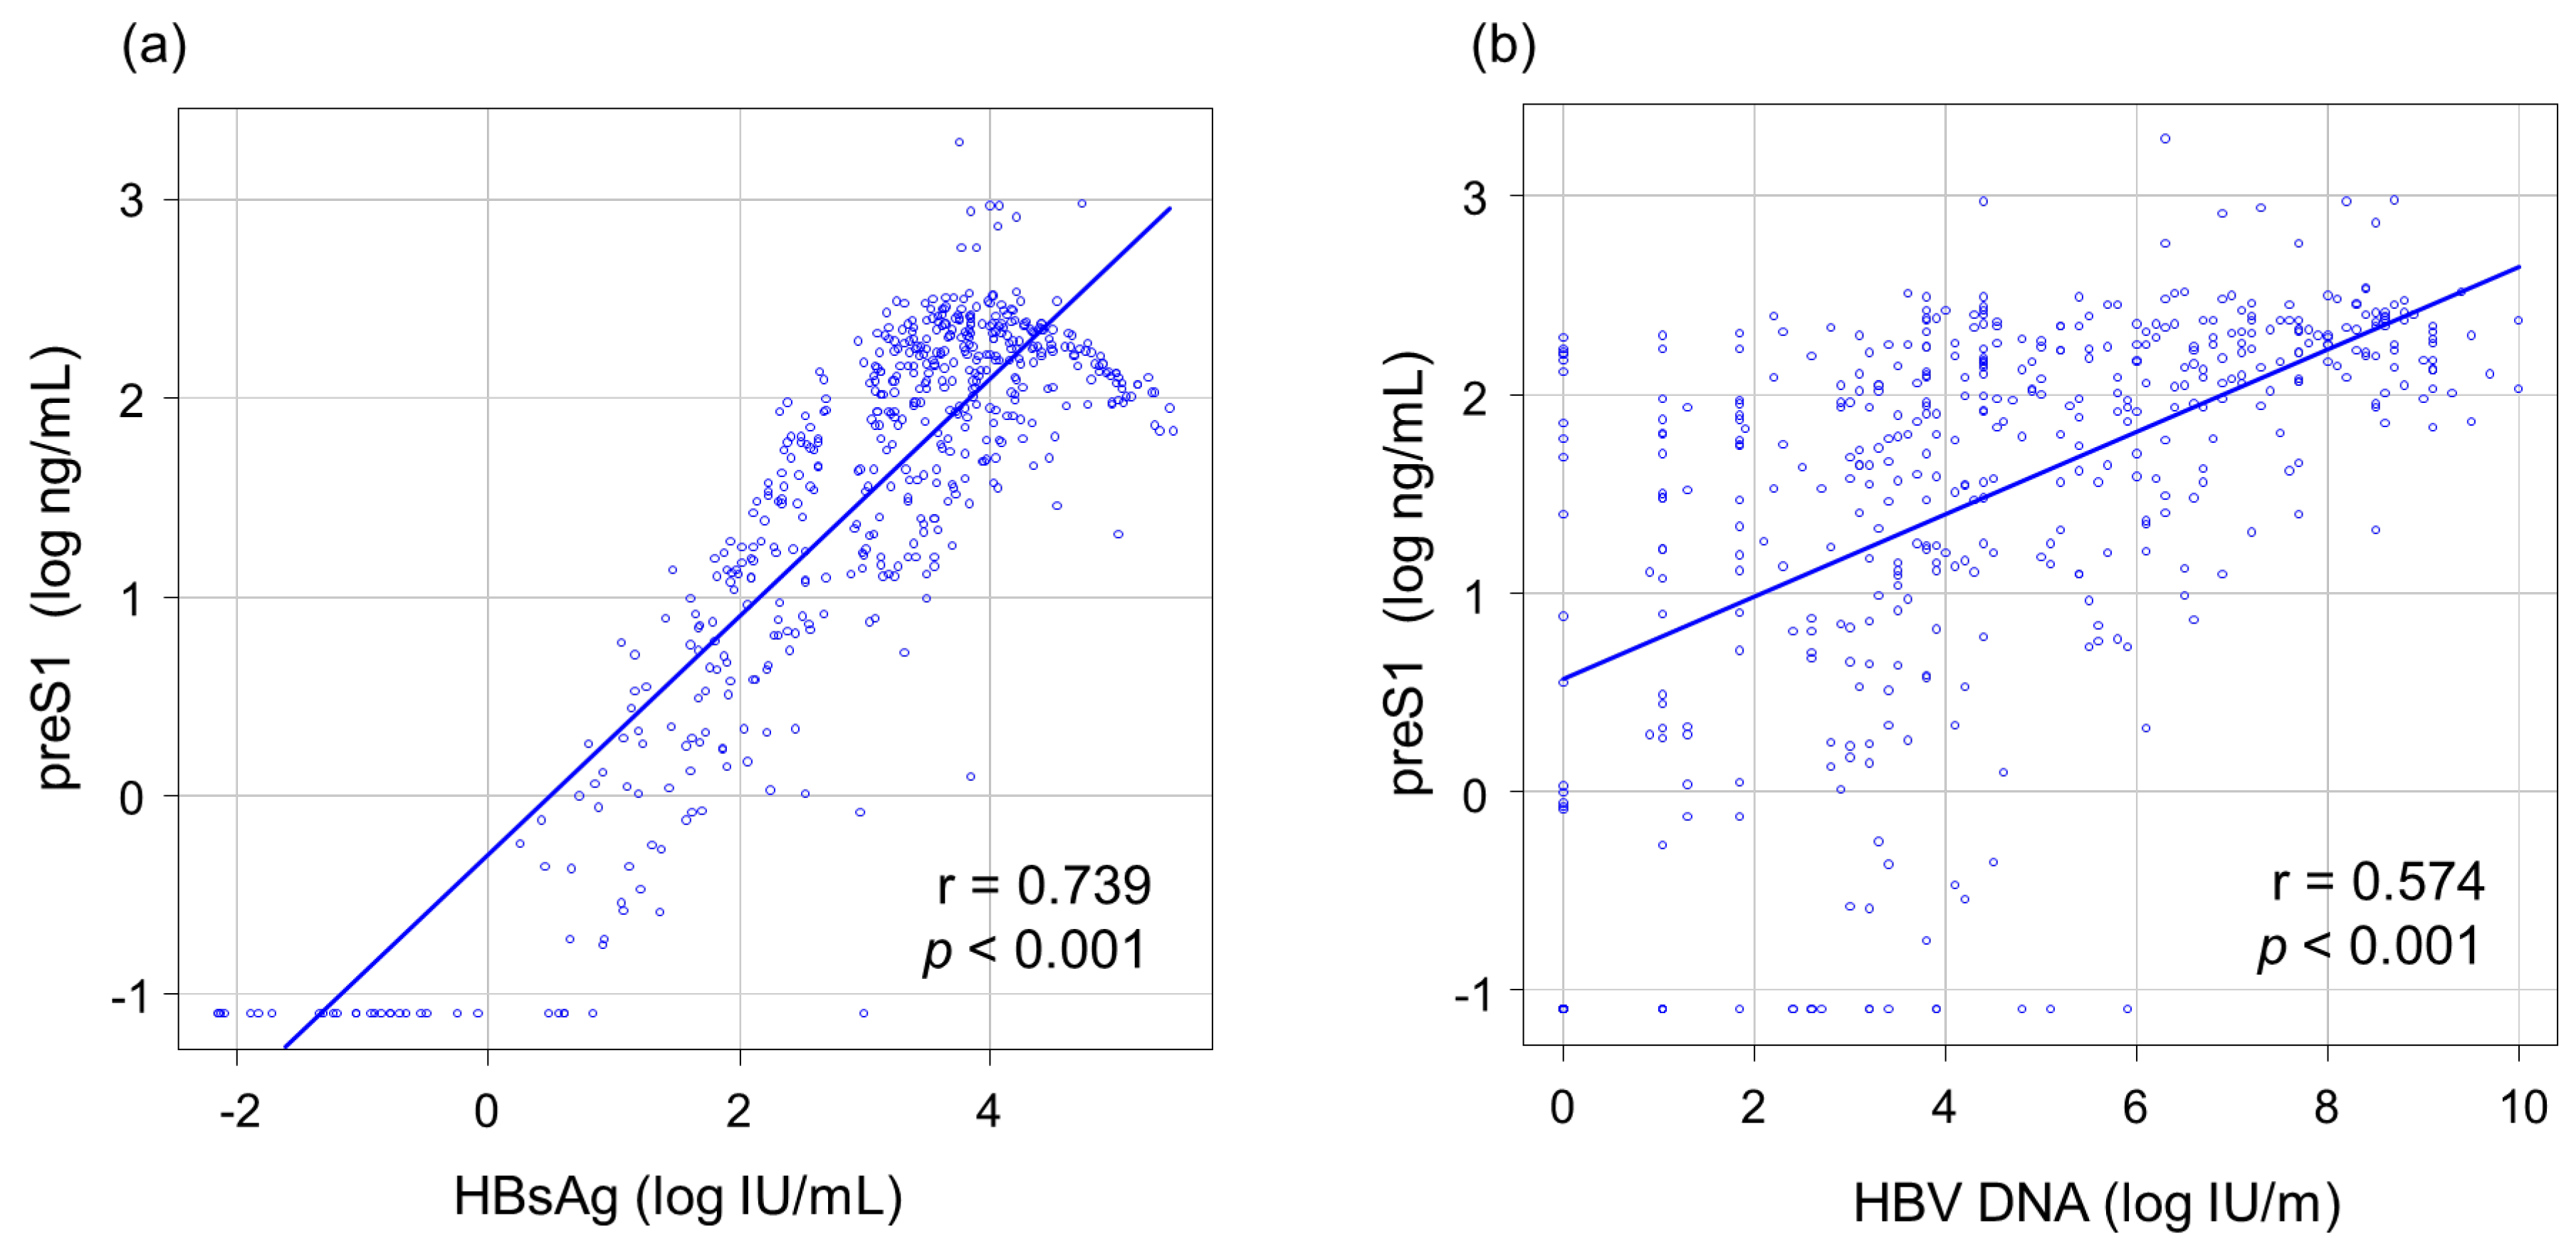
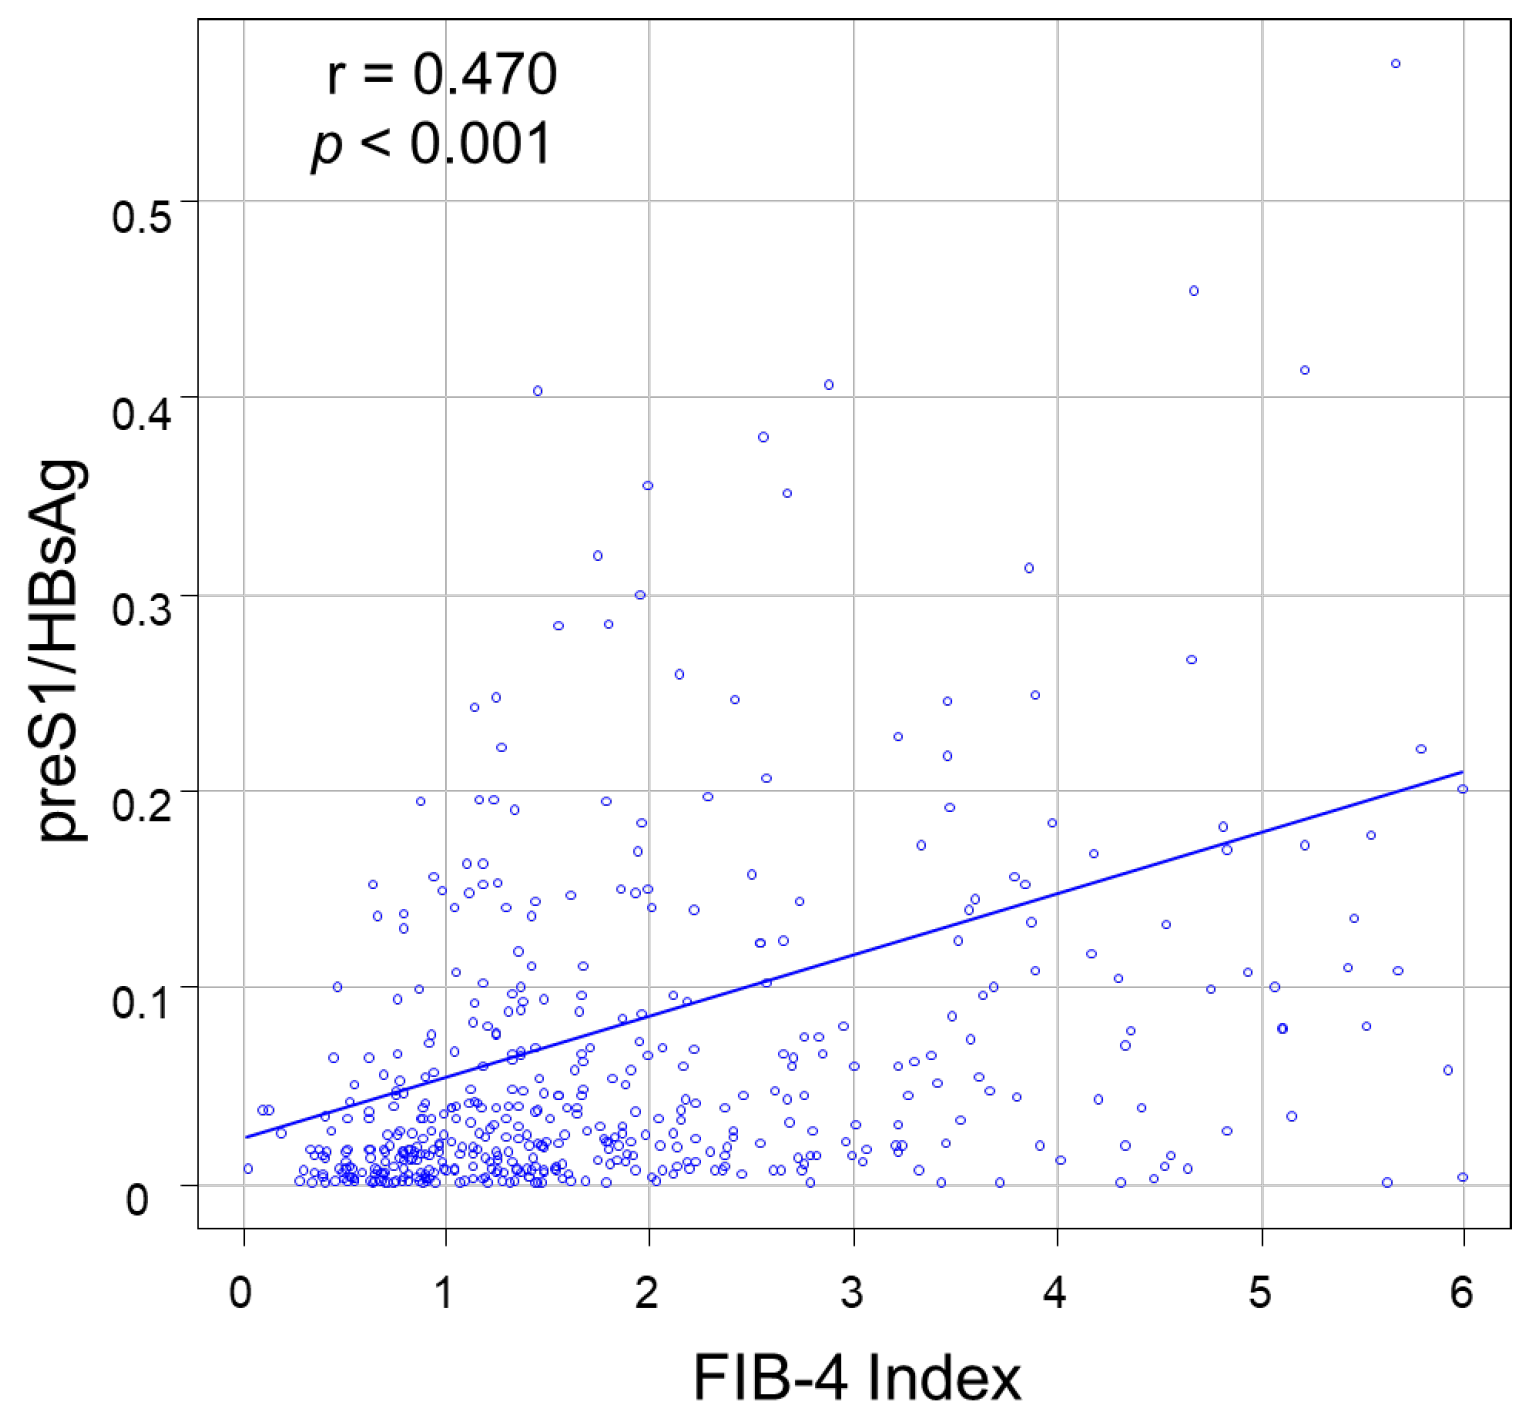
3.2. Correlations between PreS1 Level and Other HBV Markers

The relationship between serum preS1 levels and HBV markers, including HBsAg and HBV DNA, was analyzed. As shown in Figure 4, preS1 levels significantly and positively correlated with HBsAg (r = 0.739, p < 0.001) and HBV DNA levels (r = 0.574, p < 0.001). However, preS1 levels did not correlate with platelet counts (p = 0.124), prothrombin activity (r = −0.067, p = 0.124), total bilirubin (r = 0.013, p = 0.759), AST (r = 0.352, p = 0.692,), ALT (r = 0.376, p = 0.277), albumin level (r = −0.057, p = 0.197), alpha-fetoprotein (AFP) (r = −0.083, p = 0.078), or Des-γ-carboxy pro-thrombin (DCP) (r = −0.015, p = 0.808). We examined the relationship between the preS1/HBsAg ratio and the FIB4 index and found a significant and positive correlation (r = 0.470, p < 0.001) (Figure 5).

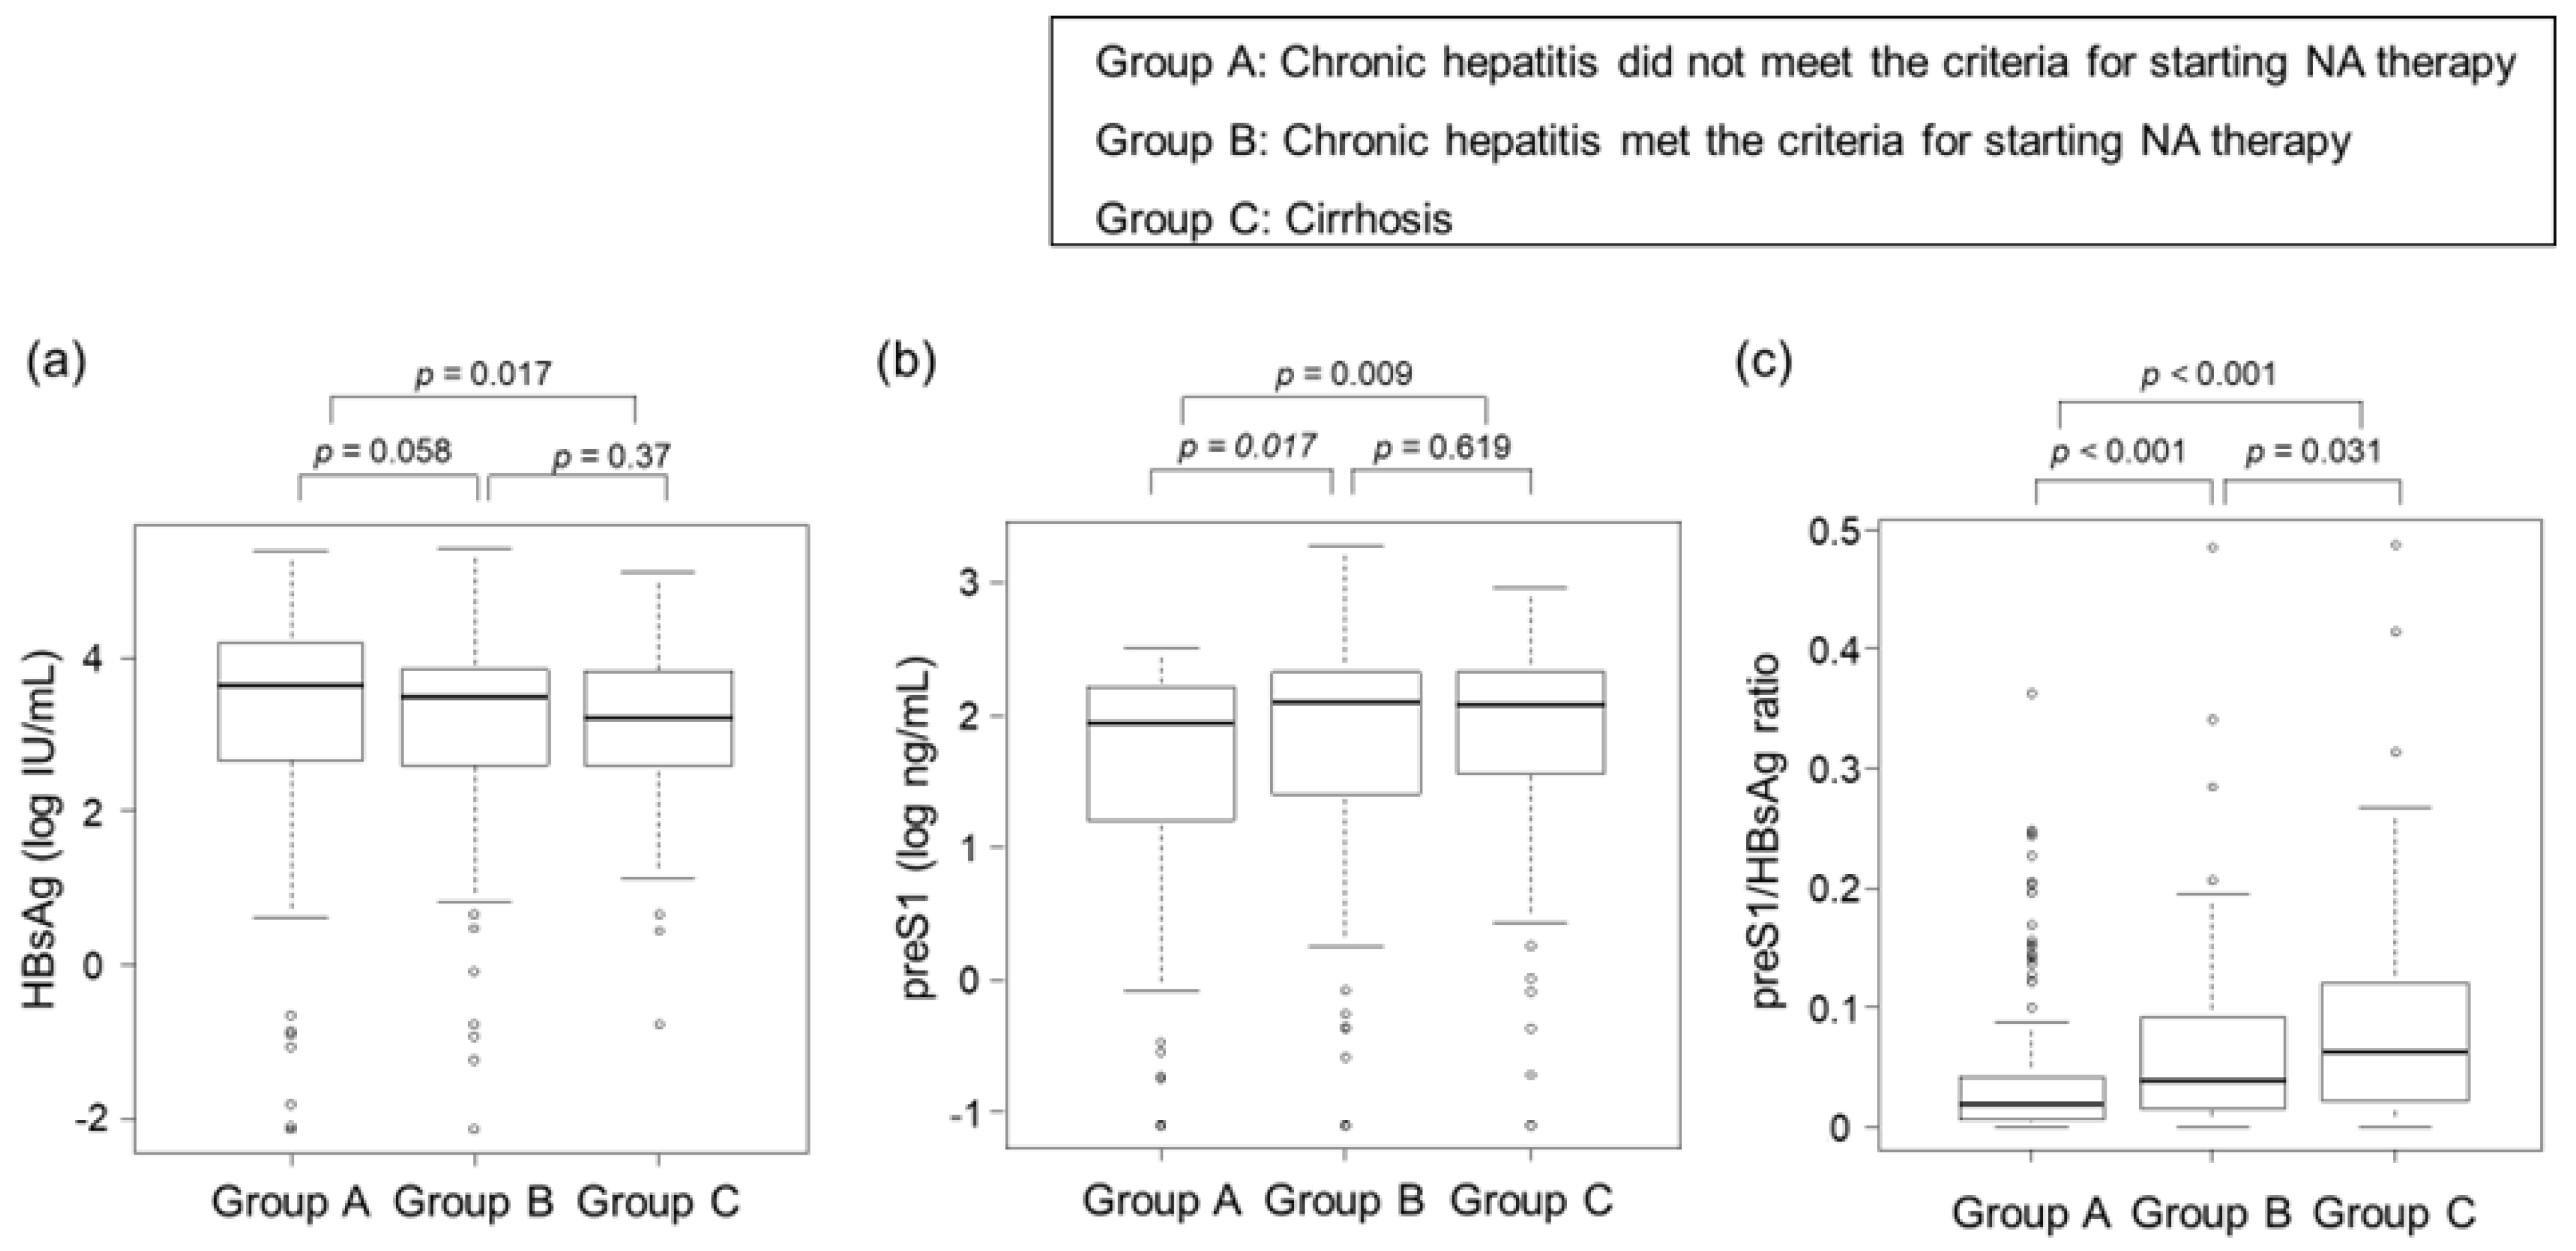
3.3. Correlations between Clinical Stage of CHB Infection and HBsAg, PreS1 Level, and PreS1/HBsAg Ratio

To analyze the relationship between the clinical stage of chronic HBV infection and HBsAg, preS1 levels, and the preS1/HBsAg ratio, enrolled patients other than inactive carriers with low HBV DNA and ALT <30 were divided into three groups, Group A, B, and C, depending on the clinical stage of chronic HBV infection as shown in Methods.
HBsAg levels significantly differed between Group A, which did not meet the criteria for starting NA, and Group C, which included cirrhotic patients, but not between Group A and Group B or Group B and Group C (Figure 6a). In contrast, serum preS1 levels in Groups B and C were significantly higher than those in Group A (Group A vs. Group B, p = 0.017; Group A vs. Group C, p < 0.001) (Figure 6b). However, Groups B and C had no significant differences in the preS1 levels.
When we compared the preS1/HBsAg ratios among the three groups (Figure 6c), we found that the ratio in Group B was significantly higher than that in Group A and that in Group C was significantly higher than that in Group B (Group A vs. B; p < 0.001, Group B vs. C; p = 0.031).

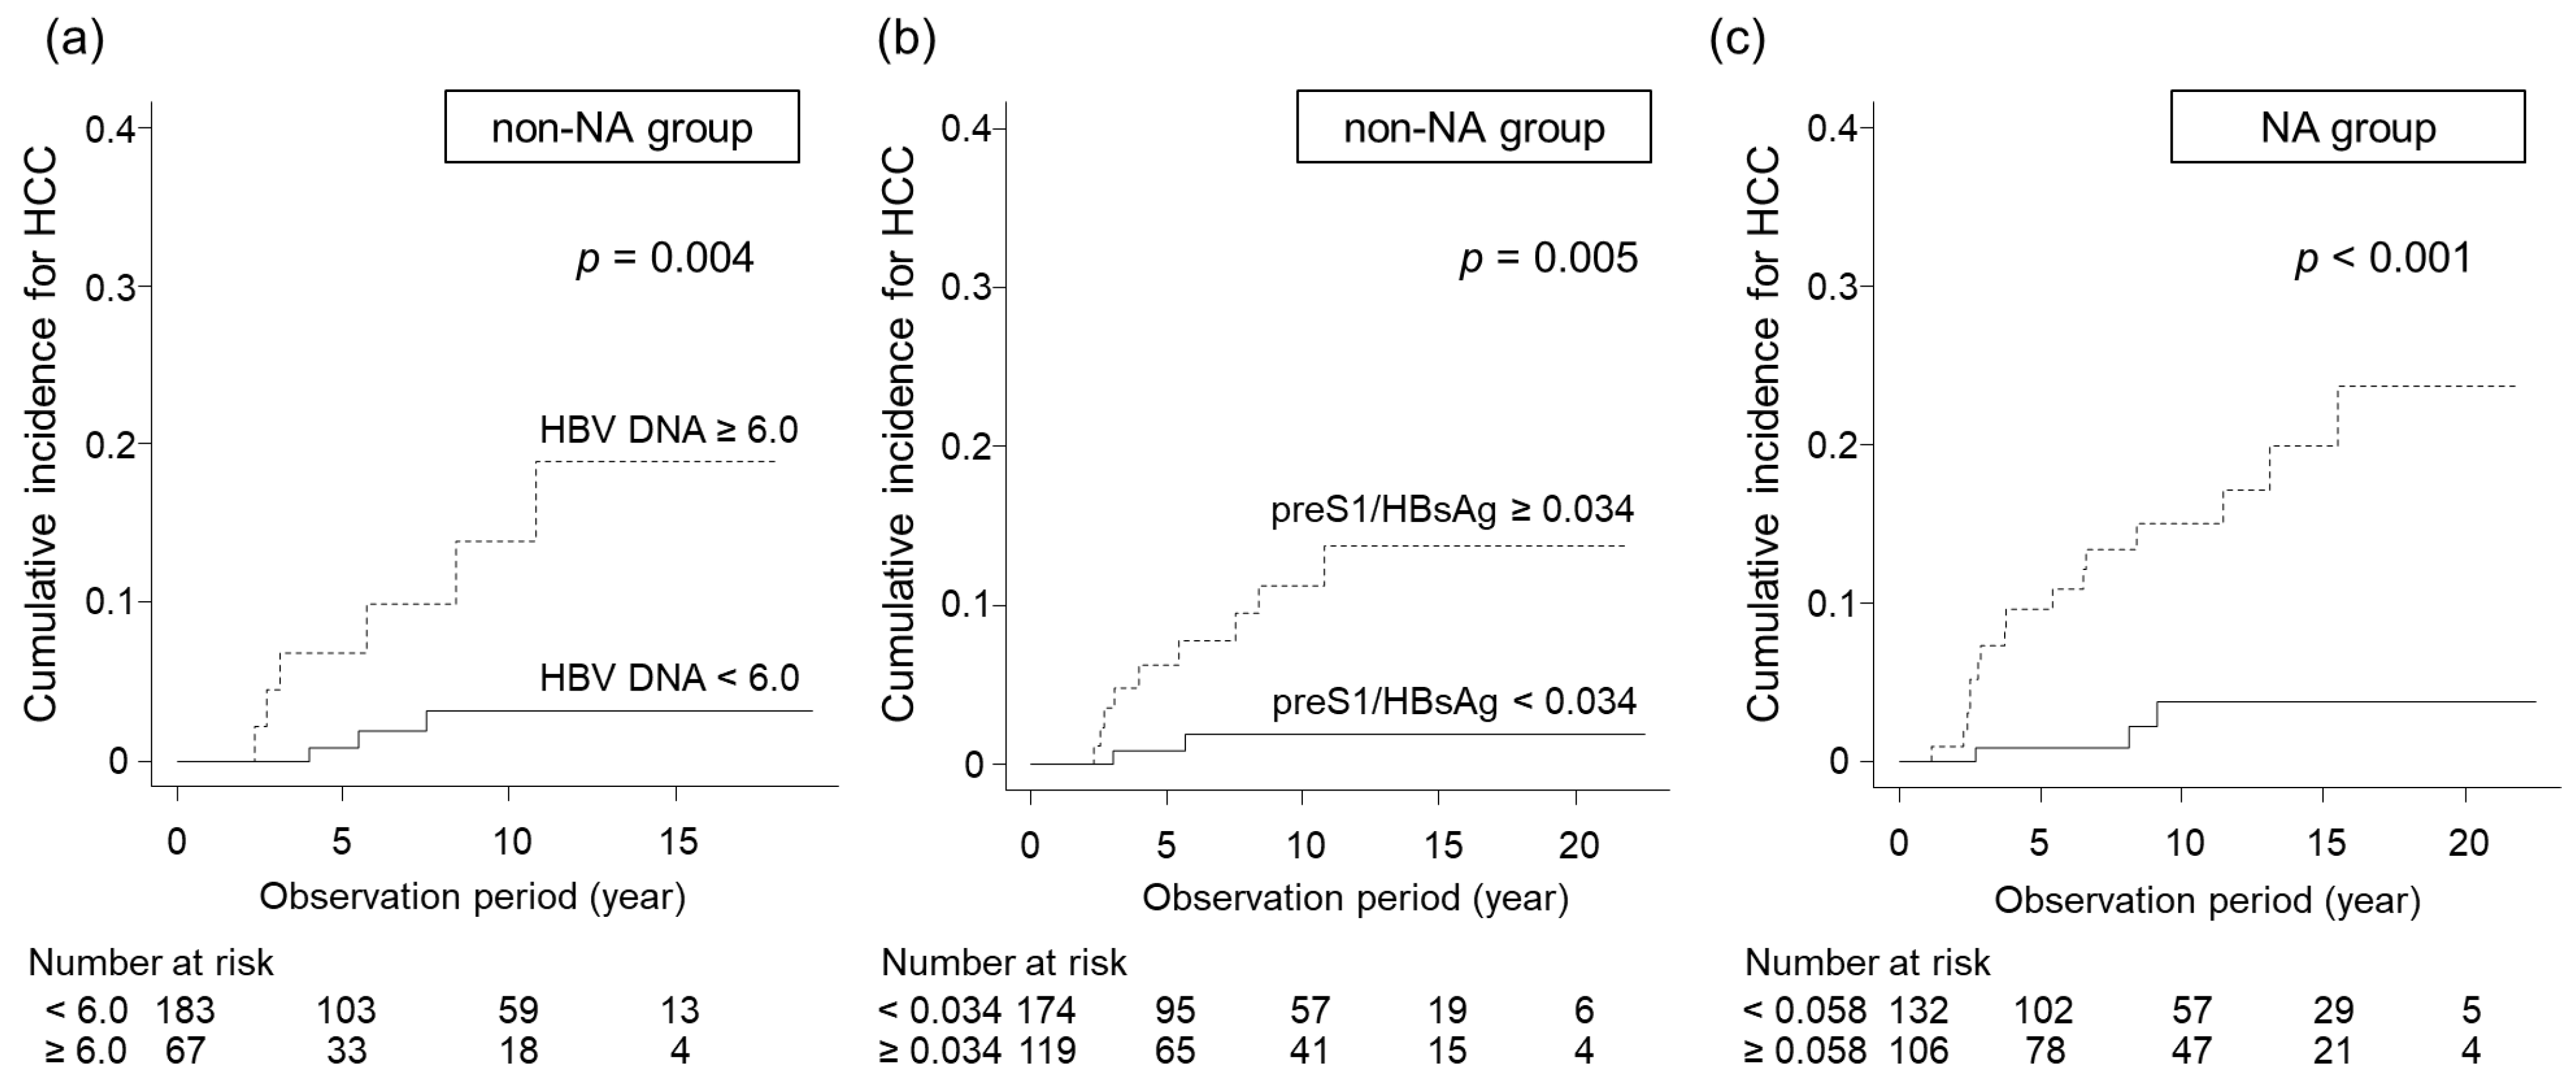
3.4. Identification of Predictive Factors for HCC Development in Non-NA and NA Groups

Statistical analyses of the NA and non-NA groups were performed to identify predictive factors of HCC development in each group. In the non-NA group, univariate analysis showed that AST (p < 0.001), ALT (p = 0.002), preS1 (p = 0.037), preS1/HBsAg (p = 0.005), HBV DNA (p = 0.004), the FIB-4 index (p = 0.007), and AFP (p < 0.001) were significantly associated with HCC development (Table 2). Overlapping prognostic factors (AST, ALT, and the FIB-4 index, as well as preS1 and preS1/HBsAg) were identified in the univariate analysis. To prevent multicollinearity, multivariate analysis was performed using these preS1/HBsAg, HBV DNA, FIB-4 index, and AFP levels, which showed significant differences in univariate analysis. Multivariate analysis showed that the preS1/HBsAg ratio (HR = 15.830; p = 0.007) and the HBV DNA level (HR = 10.940; p < 0.001) were identified as factors significantly associated with HCC development. The incidence of HCC was significantly higher in patients with higher HBV DNA levels or higher preS1/HBsAg ratios (p = 0.004 and p = 0.005, respectively; Figure 7a,b).
In the NA group, univariate analysis showed that age (p = 0.012), platelet count (p = 0.014), HBsAg (p = 0.002), preS1/HBsAg (p < 0.001), the FIB-4 index (p = 0.044), and AFP (p = 0.019) were significantly associated with HCC development (Table 3). Overlapping prognostic factors (Age and the FIB-4 index, and HBsAg and preS1/HBsAg) were identified in the univariate analysis. To prevent multicollinearity, multivariate analysis was performed using these preS1/HBsAg, FIB-4 index, and AFP levels, which showed significant differences in univariate analysis. Multivariate analysis identified only the preS1/HBsAg ratio as a factor associated with HCC development (HR = 4.249; p = 0.027; Table 3), and the incidence of HCC in patients with a higher preS1/HBsAg ratio was significantly higher (p < 0.001; Figure 7c).

4. Discussion

This study aimed to investigate the impact of the preS1/HBsAg ratio on HCC development in patients with CHB. We found that the preS1 levels and the preS1/HBsAg ratio in the non-NA group were significantly lower than those in the NA group (p < 0.001 each), although no difference in the HBsAg levels between the NA and non-NA groups was observed. We have reported the relationship between the levels of preS1 and HBsAg and the severity of liver fibrosis, as determined by a liver biopsy. When we examined the ratio of preS1 to HBsAg, we found that the preS1/HBsAg ratio was significantly correlated with the stages of liver fibrosis [17]. In the present study, we found a significant positive correlation between preS1/HBsAg ratio and the FIB-4 index, which predicts the degree of liver fibrosis. Based on these findings, the preS1/HBsAg ratio was considered a more useful marker for reflecting liver fibrosis and predicting the clinical stage.
We found a significant negative correlation between preS1 levels and age. Similarly, HBsAg levels showed a significant negative correlation with age. In contrast, the preS1/HBsAg ratio showed a significant positive correlation with age. This positive correlation in the preS1/HBs antigen ratio with age could indicate that, as individuals age, there may be an increase in the relative expression of preS1 compared to the HBs antigen, potentially reflecting progressive liver damage or changes in viral activity. Higher preS1/HBsAg ratios in males may lead to more advanced liver fibrosis and a higher risk of HCC.
The clinical course of CHB patients who do not meet the criteria for NA therapy, the so-called gray zone, is unclear. Therefore, this study evaluated the usefulness of HBsAg, preS1, and preS1/HBsAg ratios for assessing several clinical stages. The results showed that only the preS1/HBsAg ratio differed significantly in all clinical stages. The preS1/HBsAg ratio may be a more useful marker for predicting the progression of liver fibrosis and the clinical stage than the HBsAg and preS1 levels. Furthermore, a higher preS1/HBsAg ratio and higher HBV DNA levels were significantly associated with the incidence of HCC in the non-NA group. Even in patients with CHB in the “gray zone”, those with a high preS1/HBsAg ratio may need to be carefully monitored, including the assessment of liver fibrosis, and the indication for antiviral therapy may need to be considered. Moreover, patients in the NA group with higher preS1/HBsAg ratios had a higher incidence of HCC. During antiviral therapy, we also need to carefully monitor the development of HCC in patients in the NA group with higher preS1/HBsAg ratios.
A robust production of L-HB, which contains the preS1 region, is associated with inflammation and carcinogenesis in the liver. There have been several reports on the possible influence of preS1 on the development of HCC. Accumulating large S protein molecules with pre-S deletion mutations in the cell cytoplasm causes cytotoxicity [22]. Pre-S deletion mutations in the HBV genome may be associated with HCC development through liver injury and intracellular stress progression. Additionally, high levels of HBsAg production by hepatocytes may lead to their accumulation in the ER, triggering ER stress [22,23]. ER stress can result in oxidative stress and DNA damage in hepatocytes. It can also regulate intracellular signaling pathways related to cell proliferation, apoptosis, and the production of inflammatory cytokines and chemokines [24,25], leading to carcinogenesis. L-HB acts as a tumor promoter by activating activator protein 1 (AP-1) and nuclear factor kappa B via protein kinase C (PKC)/Raf proto-oncogene serine/threonine–protein kinase (Raf-1)/mitogen-activated protein kinase 2 (MAPK-2) signaling [26,27]. Tsai HW et al. reported that the serum L-HBs were correlated with recurrence after surgery, and L-HBs are an independent parameter associated with HCC recurrence [28]. In our study, the cumulative HCC development rate was higher when the preS1/HBs antigen ratio was higher. Although patients with CHB with a high preS1/HBsAg ratio may have advanced fibrosis, the influence of preS1 as a cause of not only liver fibrosis but also accelerated carcinogenesis needs to be investigated in the future. Several guidelines for treating chronic hepatitis B indicate that antiviral therapy aims to achieve HBsAg reduction [2,3,4,5], but it is challenging to achieve HBsAg loss with current antiviral therapies. Thus, the development of HCC is expected to decrease if antiviral agents that suppress HBsAg production, particularly L-HBs, are developed. It has been reported that preS1-targeting chimeric antigen receptor T cells diminish HBV infection in liver-humanized FRG mice [29]. As such, there is potential for the future development of treatments for CHB patients that target preS1.
The present study had several limitations. First, this study did not examine other HBV and fibrosis markers, such as HBcrAg, Mac-2 binding protein glycosylation isomer, hyaluronic acid, and autotaxin; therefore, it was impossible to compare their significance. In the present study, we could not assess fibrosis by liver biopsy in all patients, which may differ from the actual fibrosis stage. Since the present study is a retrospective study using long-term data collected from existing medical records, it may not have captured all relevant variables uniformly. The median observation period was 7.6 years, but a more extended observation period provides a more comprehensive assessment of the progression of liver fibrosis and the development of HCC. It also provides a robust dataset for analyzing the temporal relationship between preS1 levels, liver fibrosis, and HCC risk. However, it is also possible that changes in treatment regimens and patient management strategies over the observation period could have influenced the results. Prospective studies are necessary to confirm the associations observed in our analysis and to better control for potential confounding factors. We acknowledge that evaluating preS1 in clinical practice can be challenging. The measurement of preS1 requires specialized laboratory techniques that may not be readily available in all clinical settings. More accessible and standardized methods of measuring preS1 need to be developed. In the current study, the use of the preS1/HBs antigen ratio rather than preS1 or HBs antigen levels was associated with significant differences in the clinical stage progression and HCC development. However, we recognize the limitations of comparing items with such different units of measurement identically. Our study was conducted at a single center, which may limit the generalizability of our findings. Patient populations and treatment practices can vary significantly between different institutions and geographic regions. As a result, the outcomes observed in our study may not be fully representative of those in other settings. Future multi-center studies are needed to validate our findings and ensure broader applicability. Although sequence analysis of the preS1 region was not conducted in this study, it would be interesting to explore the association between the development of HCC, preS1, and the presence of preS1 mutations.

5. Conclusions

We found that a higher preS1/HBsAg ratio was significantly associated with the incidence of HCC, regardless of whether the NA treatment indication was met. This study suggests that patients with CHB with a high preS1/HBsAg ratio may have advanced fibrosis and should be considered for antiviral therapy to prevent the development of HCC. These results may help optimize the indications for NA treatment and identify patients at a high risk of HCC and those who should be followed up more carefully.

Supplementary Materials

The following supporting information can be downloaded at: https://www.mdpi.com/article/10.3390/livers4030026/s1, Table S1: Comparison of background factors by age in non-NA group; Table S2: Comparison of background factors by gender in non-NA group; Table S3: Comparison of background factors by age in NA group; Table S4: Comparison of background factors by gender in NA group.

Author Contributions

M.K., H.F. and M.T. contributed to the conception and design of the study. Material preparation and data collection were performed by M.K., H.F., M.T., S.U., A.O., E.M., T.K., D.M., C.N.H. and S.O.; M.K., H.F. and M.T. performed the experiments and analyses. The first draft of the manuscript was written by M.K., H.F., M.T. and C.N.H., and all authors commented on the previous versions. All authors have read and agreed to the published version of the manuscript.

Funding

This study was funded by the Ministry of Education, Culture, Sports, Science, and Technology (MEXT), Japan, under Grant Number 21k08006, by JSPS KAKENHI Grant Number JP21K16000, and by the Japan Agency for Medical Research and Development (AMED), under Grant Number 23fk0210084s0303.

Institutional Review Board Statement

This study was approved by the Ethics Committee of Hiroshima University, Hiroshima, Japan (approval ID: E2022-0274). The study was conducted in accordance with the principles of the Declaration of Helsinki.

Informed Consent Statement

Informed consent was obtained from all subjects involved in the study.

Data Availability Statement

The dataset is stored in a secure, anonymized format to protect patient confidentiality. The data supporting this study’s findings are available from the corresponding author upon reasonable request. The data are not publicly available due to privacy or ethical restrictions. Data access will be granted in accordance with institutional policies and data-sharing agreements to ensure that patient privacy and ethical considerations are maintained.

Acknowledgments

We thank Chikako Kanehara for assistance with this study. We also thank the Diagnostics Division, Abbott Japan LLC, for technical assistance with the experiments.

Conflicts of Interest

The authors declare no conflicts of interest.

References

  1. World Health Organization. Global Progress Report on HIV, Viral Hepatitis and Sexually Transmitted Infections. Available online: https://www.who.int/publications/i/item/9789240027077 (accessed on 13 May 2024).
  2. European Association for the Study of the Liver. EASL 2017 Clinical Practice Guidelines on the management of hepatitis B virus infection. J. Hepatol. 2017, 67, 370–398. [Google Scholar] [CrossRef] [PubMed]
  3. Omata, M.; Cheng, A.-L.; Kokudo, N.; Kudo, M.; Lee, J.M.; Jia, J.; Tateishi, R.; Han, K.-H.; Chawla, Y.K.; Shiina, S.; et al. Asia-Pacific clinical practice guidelines on the management of hepatocellular carcinoma: A 2017 update. Hepatol. Int. 2017, 11, 317–370. [Google Scholar] [CrossRef] [PubMed]
  4. Terrault, N.A.; Lok, A.S.F.; McMahon, B.J.; Chang, K.-M.; Hwang, J.P.; Jonas, M.M.; Brown, R.S., Jr.; Bzowej, N.H.; Wong, J.B. Update on prevention, diagnosis, and treatment of chronic hepatitis B: AASLD 2018 hepatitis B guidance. Hepatology 2018, 67, 1560–1599. [Google Scholar] [CrossRef]
  5. Drafting Committee for Hepatitis Management Guidelines, the Japan Society of Hepatology. Japan Society of Hepatology Guidelines for the Management of Hepatitis B Virus Infection: 2019 update. Hepatol. Res. 2020, 50, 892–923. [Google Scholar] [CrossRef] [PubMed]
  6. Wang, J.; Yan, X.; Zhu, L.; Liu, J.; Qiu, Y.; Li, Y.; Liu, Y.; Xue, R.; Zhan, J.; Jiang, S.; et al. Significant histological disease of patients with chronic hepatitis B virus infection in the grey zone. Aliment. Pharmacol. Ther. 2023, 57, 464–474. [Google Scholar] [CrossRef] [PubMed]
  7. Liu, J.; Wang, J.; Yan, X.; Xue, R.; Zhan, J.; Jiang, S.; Geng, Y.; Liu, Y.; Mao, M.; Xia, J.; et al. Presence of liver inflammation in Asian patients with chronic hepatitis B with normal ALT and detectable HBV DNA in absence of liver fibrosis. Hepatol. Commun. 2022, 6, 855–866. [Google Scholar] [CrossRef] [PubMed]
  8. Huang, D.Q.; Li, X.; Le, M.H.; Le, A.K.; Yeo, Y.H.; Trinh, H.N.; Zhang, J.; Li, J.; Wong, C.; Wong, C.; et al. Natural history and hepatocellular carcinoma risk in untreated chronic hepatitis B patients with indeterminate phase. Clin. Gastroenterol. Hepatol. 2022, 20, 1803–1812.e5. [Google Scholar] [CrossRef]
  9. Choi, G.H.; Kim, G.A.; Choi, J.; Han, S.; Lim, Y.S. High risk of clinical events in untreated HBeAg-negative chronic hepatitis B patients with high viral load and no significant ALT elevation. Aliment. Pharmacol. Ther. 2019, 50, 215–226. [Google Scholar] [CrossRef] [PubMed]
  10. Mason, W.S.; Gill, U.S.; Litwin, S.; Zhou, Y.; Peri, S.; Pop, O.; Hong, M.L.; Naik, S.; Quaglia, A.; Bertoletti, A.; et al. HBV DNA integration and clonal hepatocyte expansion in chronic hepatitis B patients considered immune tolerant. Gastroenterology 2016, 151, 986–998.e4. [Google Scholar] [CrossRef]
  11. Bian, Y.; Zhang, Z.; Sun, Z.; Zhao, J.; Zhu, D.; Wang, Y.; Fu, S.; Guo, J.; Liu, L.; Su, L.; et al. Vaccines targeting preS1 domain overcome immune tolerance in hepatitis B virus carrier mice. Hepatology 2017, 66, 1067–1082. [Google Scholar] [CrossRef] [PubMed]
  12. Ganem, D.; Prince, A.M. Hepatitis B virus infection—Natural history and clinical consequences. N. Engl. J. Med. 2004, 350, 1118–1129. [Google Scholar] [CrossRef] [PubMed]
  13. Klingmüller, U.; Schaller, H. Hepadnavirus infection requires interaction between the viral pre-S domain and a specific hepatocellular receptor. J. Virol. 1993, 67, 7414–7422. [Google Scholar] [CrossRef] [PubMed]
  14. Tsuge, M. The association between hepatocarcinogenesis and intracellular alterations due to hepatitis B virus infection. Liver Int. 2021, 41, 2836–2848. [Google Scholar] [CrossRef] [PubMed]
  15. Yan, H.; Zhong, G.; Xu, G.; He, W.; Jing, Z.; Gao, Z.; Huang, Y.; Qi, Y.; Peng, B.; Wang, H.; et al. Sodium taurocholate cotransporting polypeptide is a functional receptor for human hepatitis B and D virus. Elife 2012, 1, e00049. [Google Scholar] [CrossRef]
  16. Park, J.-H.; Iwamoto, M.; Yun, J.-H.; Uchikubo-Kamo, T.; Son, D.; Jin, Z.; Yoshida, H.; Ohki, M.; Ishimoto, N.; Mizutani, K.; et al. Structural insights into the HBV receptor and bile acid transporter NTCP. Nature 2022, 606, 1027–1031. [Google Scholar] [CrossRef]
  17. Nishida, Y.; Imamura, M.; Teraoka, Y.; Morio, K.; Fujino, H.; Ono, A.; Nakahara, T.; Murakami, E.; Yamauchi, M.; Kawaoka, T.; et al. Serum preS1 and HBsAg ratio reflects liver fibrosis and predicts the development of hepatocellular carcinoma in chronic hepatitis B patients. J. Viral Hepat. 2021, 28, 1304–1311. [Google Scholar] [CrossRef]
  18. Nihon Arukoru Igakkai/Japenese Medical Society of Alcohol Studies. Guidelines for conflict of interest in clinical research. Jpn. J. Alcohol Stud. Drug Depend. 2013, 48, 339–357. (In Japanese) [Google Scholar]
  19. Hatooka, H.; Shimomura, Y.; Imamura, M.; Teraoka, Y.; Morio, K.; Fujino, H.; Ono, A.; Nakahara, T.; Murakami, E.; Yamauchi, M.; et al. Construction of an anti-hepatitis B virus preS1 antibody and usefulness of preS1 measurement for chronic hepatitis B patients: Anti-HBV PreS1 antibody. J. Infect. 2022, 84, 391–399. [Google Scholar] [CrossRef] [PubMed]
  20. Sterling, R.K.; Lissen, E.; Clumeck, N.; Sola, R.; Correa, M.C.; Montaner, J.; Sulkowski, M.S.; Torriani, F.J.; Dieterich, D.T.; Thomas, D.L.; et al. Development of a simple noninvasive index to predict significant fibrosis in patients with HIV/HCV coinfection. Hepatology 2006, 43, 1317–1325. [Google Scholar] [CrossRef]
  21. Kanda, Y. Investigation of the freely available easy-to-use software ‘EZR’ for medical statistics. Bone Marrow Transplant. 2013, 48, 452–458. [Google Scholar] [CrossRef]
  22. Lin, W.L.; Hung, J.H.; Huang, W. Association of the hepatitis B virus large surface protein with viral infectivity and endoplasmic reticulum stress-mediated liver carcinogenesis. Cells 2020, 9, 2052. [Google Scholar] [CrossRef]
  23. Wang, H.C.; Huang, W.; Lai, M.D.; Su, I.J. Hepatitis B virus pre-S mutants, endoplasmic reticulum stress and hepatocarcinogenesis. Cancer Sci. 2006, 97, 683–688. [Google Scholar] [CrossRef] [PubMed]
  24. Tsuge, M.; Hiraga, N.; Zhang, Y.; Yamashita, M.; Sato, O.; Oka, N.; Shiraishi, K.; Izaki, Y.; Makokha, G.N.; Uchida, T.; et al. Endoplasmic reticulum-mediated induction of interleukin-8 occurs by hepatitis B virus infection and contributes to suppression of interferon responsiveness in human hepatocytes. Virology 2018, 525, 48–61. [Google Scholar] [CrossRef]
  25. Tsushima, K.; Tsuge, M.; Hiraga, N.; Uchida, T.; Murakami, E.; Makokha, G.N.; Kurihara, M.; Nomura, M.; Hiyama, Y.; Fujino, H.; et al. Comparison of intracellular responses between HBV genotype A and C infection in human hepatocyte chimeric mice. J. Gastroenterol. 2019, 54, 650–659. [Google Scholar] [CrossRef] [PubMed]
  26. Hildt, E.; Saher, G.; Bruss, V.; Hofschneider, P.H. The hepatitis B virus large surface protein (LHBs) is a transcriptional activator. Virology 1996, 225, 235–239. [Google Scholar] [CrossRef] [PubMed]
  27. Hildt, E.; Hofschneider, P.H. The PreS2 activators of the hepatitis B virus: Activators of tumour promoter pathways. Recent Results Cancer Res. 1998, 154, 315–329. [Google Scholar] [PubMed]
  28. Tsai, H.W.; Lee, Y.P.; Yen, C.J.; Cheng, K.H.; Huang, C.J.; Huang, W. The Serum Hepatitis B Virus Large Surface Protein as High-Risk Recurrence Biomarker for Hepatoma after Curative Surgery. Int. J. Mol. Sci. 2022, 23, 5376. [Google Scholar] [CrossRef] [PubMed]
  29. Guo, G.; He, W.; Zhou, Z.; Diao, Y.; Sui, J.; Li, W. PreS1-targeting chimeric antigen receptor T cells diminish HBV infection in liver humanized FRG mice. Virology 2023, 586, 23–34. [Google Scholar] [CrossRef]
Figure 1. Enrolled patients with chronic HBV infections. Of the 531 enrolled patients, 293 who were inactive carriers or had active chronic hepatitis and who did not meet the Japan Society of Hepatology criteria for the initiation of NA therapy were assigned to the non-NA group. The NA group consisted of 238 patients who received NA therapy for active chronic hepatitis or cirrhosis.
Livers 04 00026 g001
Figure 2. The relationship between age and (a) preS1, (b) HBsAg, and (c) the preS1/HBsAg ratio. PreS1 and HBsAg levels showed significant negative correlations with age. In contrast, the preS1/HBsAg ratio showed a significant positive correlation with age. Correlation analyses were performed using Spearman rank correlation coefficients.
Livers 04 00026 g002
Figure 3. The relationship between sex and (a) preS1, (b) HBsAg, and (c) the preS1/HBsAg ratio. Despite similar levels of preS1 and HBsAg in males and females, the preS1/HBsAg ratio is significantly higher in males.
Livers 04 00026 g003
Figure 4. Correlation between serum preS1 values and HBV markers. Correlations between preS1 and (a) HBsAg, and (b) HBV DNA levels are shown as scatter plots. PreS1 levels were significantly and positively correlated with HBsAg and HBV DNA levels. Correlation analyses were performed using Spearman rank correlation coefficients.
Livers 04 00026 g004
Figure 5. Correlation between preS1/HBsAg ratio and FIB-4 Index. PreS1/HBsAg ratio was significantly positively correlated with FIB-4 index.
Livers 04 00026 g005
Figure 6. A comparison between the clinical stage and (a) HBsAg, (b) preS1 levels, and (c) the preS1/HBsAg ratio. The preS1/HBsAg ratio was significantly different among all groups.
Livers 04 00026 g006
Figure 7. The cumulative rate of HCC development in non-NA and NA groups. In the non-NA group, the incidence of HCC in patients with higher HBV DNA levels (a) or higher preS1/HBsAg ratios (b) was significantly higher (p = 0.004 and p = 0.005, respectively). In the NA group, the incidence of HCC in patients with a higher preS1/HBsAg ratio (c) was significantly higher (p < 0.001). The data were analyzed using the log-rank test.
Livers 04 00026 g007
Table 1. Baseline characteristics of patients.
FactorsOverall
(n = 531)
Non-NA Group
(n = 293)
NA Group
(n = 238)
p-Value **
Age (yr) *46 (34–59)44 (32–58)48 (38–60)<0.001
Gender (male/female)337/194176/117161/770.090
Platelet count (×104/µL) *17.6 (13.6–21.7)18.9 (15.7–22.3)16.3 (11.9–20.2)<0.001
Total bilirubin (mg/dL) *0.8 (0.6–1.1)0.8 (0.6–1.0)0.8 (0.6–1.2)0.070
AST (U/L) *35 (22–70)27 (20–45)57 (32–96)<0.001
ALT (U/L) *42 (21–105)28 (18–63)62 (34–166)<0.001
Albumin (g/dL) *4.3 (4–4.6)4.4 (4.2–4.7)4.2 (3.8–4.4)<0.001
Prothrombin activity (%) *90 (80–99)95 (86–104)83 (6–117)<0.001
HBsAg (log IU/mL) *3.4 (2.3–4.0)3.4 (2.1–4.0)3.4 (2.6–3.8)0.600
preS1 (ng/mL) *84 (13–175)55 (6.7–135)122 (33–216)<0.001
preS1/HBsAg *0.03 (0.01–0.09)0.02 (0.01–0.07)0.05 (0.02–0.1)<0.001
HBeAg (positive/negative/unmeasured)76/200/25528/124/14148/76/114<0.001
HBV DNA (log IU/mL) *4.4 (3.1–6.7)3.8 (2.2–6.1)5.4 (3.8–7.1)<0.001
FIB-4 index *1.5 (0.9–2.8)1.3 (0.8–1.9)2.2 (1.2–4.2)<0.001
AFP4.4 (2.5–9.6)2.5 (2.5–6.3)7.3 (2.7–14)<0.001
DCP17 (13–22)17 (14–22)17 (13–22)0.755
nucleotide/nucleoside analog ADV:2,
LAM:79,
ETV:143,
TDF:8,
TAF:6
* Median (interquartile range), ** statistical analyses were performed using Fisher’s exact or Mann–Whitney U tests. Legend: AST, aspartate aminotransferase; ALT, alanine aminotransferase; HBsAg, hepatitis B surface antigen; HBeAg, hepatitis B e antigen; FIB-4 index, fibrosis-4 index; ADV, adefovir; LAM, lamivudine; ETV, entecavir; TDF, tenofovir disoproxil fumarate; TAF, tenofovir alafenamide.
Table 2. Factors associated with HCC development in non-NA group.
VariableUnivariateMultivariate
p-Value *HR (95% CI)p-Value **
Age, ≥44/<440.054
Gender, male/female0.116
Platelet count (×104/µL), <17.3/≥17.30.343
Total bilirubin (mg/dL), <0.7/≥0.70.271
AST (U/L), ≥38/<38<0.001
ALT (U/L), ≥33/<330.002
Albumin (g/dL), <4.3/≥4.30.110
Prothrombin activity (%), <89/≥890.144
HBsAg (log IU/mL), <3.8/≥3.80.061
preS1 (ng/mL), ≥105/<1050.037
preS1/HBsAg, ≥0.034/<0.0340.00515.830 (1.854–135.200)0.012
HBeAg, positive/negative0.512
HBV DNA (log IU/mL), ≥6.0/<6.00.00410.94 (1.932–61.980)<0.001
FIB-4 index, ≥1.55/<1.550.0071.581 (0.328–7.632)0.568
AFP, ≥5.9/<5.9<0.0012.998(0.471–19.090)0.245
DCP, ≥18/<180.936
* Log-rank test, ** Cox regression analysis. Legend: AST, aspartate aminotransferase; ALT, alanine aminotransferase; HBsAg, hepatitis B surface antigen; HBeAg, hepatitis B e antigen; FIB-4 index, fibrosis-4 index; AFP, alpha-fetoprotein; DCP, Des-γ-carboxy prothrombin.
Table 3. Factors associated with HCC development in NA group.
VariableUnivariateMultivariate
p-Value *HR (95% CI)p-Value **
Age, ≥47/<470.012
Gender, male/female0.154
Platelet count (×104/µL), <12.0/≥12.00.014
Total bilirubin (mg/dL), <0.9/≥0.90.084
AST (U/L), ≥71/<710.190
ALT (U/L), ≥111/<1110.142
Albumin (g/dL), <4.1/≥4.10.103
Prothrombin activity (%), <92/≥920.308
HBsAg (log IU/mL), <3.5/≥3.50.002
preS1 (ng/mL), ≥171.29/<170.290.102
preS1/HBsAg, ≥0.058/<0.058<0.0014.249 (1.179–15.310)0.027
HBeAg, positive/negative0.406
HBV DNA (log IU/mL), ≥4.9/<4.90.144
FIB-4 index, ≥2.75/<2.750.0441.049 (0.367–3.001)0.929
AFP, ≥9.7/<9.70.0193.249 (1.010–10.450)0.058
DCP, ≥16/<160.884
* Log-rank test, ** Cox regression analysis. Legend: AST, aspartate aminotransferase; ALT, alanine aminotransferase; HBsAg, hepatitis B surface antigen; HBeAg, hepatitis B e antigen; FIB-4 index, fibrosis-4 index; AFP, alpha-fetoprotein; DCP, Des-γ-carboxy prothrombin.
Disclaimer/Publisher’s Note: The statements, opinions and data contained in all publications are solely those of the individual author(s) and contributor(s) and not of MDPI and/or the editor(s). MDPI and/or the editor(s) disclaim responsibility for any injury to people or property resulting from any ideas, methods, instructions or products referred to in the content.

