Article

Electrochemical Determination of Catechol Using a Disposable Printed Electrode with Conductive Ink Based on Graphite and Carbon Black

by
Sthephane Pereira de Oliveira
,
Thaís Cristina de Oliveira Cândido
,
Arnaldo César Pereira
and
Daniela Nunes da Silva
*
Natural Sciences Department, Federal University of São João del Rei, 74 Praça Dom Helvécio, São João del Rei 36301-160, MG, Brazil
*
Author to whom correspondence should be addressed.
Analytica 2024, 5(2), 250-262; https://doi.org/10.3390/analytica5020016
Submission received: 6 May 2024 / Revised: 18 May 2024 / Accepted: 19 May 2024 / Published: 1 June 2024

Abstract

:
Catechol (CT) is a phenolic compound widely used in various industrial sectors, but it is toxic; thus, there is a need for methods that aim to identify and quantify the existence of residues of this material in the environment. In this study a disposable printed electrochemical sensor was developed as an effective alternative for determining CT in water samples. The electrode, called SPEC, was manufactured using the screen-printing method using polyethylene terephthalate (PET) as a support, in which a conductive ink based on carbonaceous materials was used to print the working and auxiliary electrodes and a silver/silver chloride of ink on the reference electrode. The optimal ratio for the conductive ink was 6.25% carbon black, 35.42% graphite, and 58.33% nail polish. The ink obtained was characterized by scanning electron microscopy (SEM). The assessment of the effect of pH on the redox process showed Nernstian behavior (0.057 V pH−1), indicating that the process involves the same number of protons and electrons. Under optimized conditions, with 0.2 mol L−1 acetate buffer at pH 5.0, and by square wave voltammetry, the sensor presented sensitivity values of 0.31 μA L μmol−1, a detection limit of 5.96 μmol L−1, and a quantification limit of 19.87 μmol L−1. The sensor was applied to determine CT in tap water samples, and the results showed recoveries between 97.95 and 100.17%.

Graphical Abstract

1. Introduction

Catechol (CT) is a phenolic compound derived from benzene, widely used in industrial activities [1,2,3]. Its main reported applications are in the photographic industry, dye manufacturing, pesticide production, and pharmacology, among other areas. Generally, this compound is present in industrial wastewater, and the major problem with CT is its high toxicity and low degradability, which can be a risk to aquatic organisms and humans. Thus, CT is considered an environmental pollutant, and the maximum allowable concentration of phenolic compounds in freshwater is 0.5 mg L−1 [1,2,3,4,5,6].
Given the above, it is necessary to search for sensitive, fast, precise, and selective methodologies for the determination of CT. Different techniques are employed, such as spectrophotometry [7], gas chromatography [8], electrochemiluminescence [9,10], high-performance liquid chromatography (HPLC) [11], and electrochemical techniques [1,2,3,4,5,6,12,13,14].
Electrochemical techniques have been widely used due to the low cost of the devices, the absence of the need for sample pretreatment, rapid responses, and high sensitivity and selectivity. Printed electrodes are widely used devices due to their versatility, ease of preparation, low cost, and the fact that they present the complete three-electrode system in a single device. To obtain printed electrodes, a conductive ink, inert support, and an appropriate printing technique are required [12,13,14,15,16].
For the conductive ink, different materials can be used, such as carbonaceous materials like graphite (GR), carbon black (CB), and carbon nanotubes (CNT), as well as metallic materials like silver, gold, and copper, among others. The binder can be enamels, polymers, glues, cellulose acetate, among others. For solvents, the most appropriate ones for the chosen binder are used, and the most common are water, acetone, cyclohexanone, and toluene. Another important component is the support. Various materials can be used for this purpose, including paper, polyethylene terephthalate (PET), polyvinyl chloride (PVC), adhesives, ceramic materials, and polyester. The printing technique to be used must be suitable for the type of ink chosen. Various techniques are employed in the manufacture of printed electrodes, and the most common is screen-printing [15,16,17,18,19,20,21,22,23,24].
The literature reports several studies aiming at the manufacture of printed electrodes by applying different ink compositions, supports, and printing techniques. In this context, Freitas et al. (2023) developed a screen-printed device with ink based on graphite, handmade glue, acetone, ethyl acetate, and glycerin. The printed sensors were used for the determination of paracetamol and dopamine. The results obtained demonstrated that the sensor is applicable, is low cost, can be produced on a large scale, and can be adapted for microfluidic and wearable devices [25].
Orzari et al. (2024) developed an electrode printed with a conductive ink based on carbon black and polyvinyl alcohol. The device was used for the determination of Parkinson’s biomarkers. The proposed sensor is low cost, can be used as disposable, is easy to apply, and the results obtained are acceptable [26].
Therefore, the objective of this work was the development of an electrode printed with graphite-based ink, carbon black, bonded with nail polish, and dispersed in acetone. The electrode was printed on a polyethylene terephthalate (PET) support using the silkscreen technique. The device obtained was characterized by electrochemical techniques and applied for the determination and quantification of catechol in water samples.

2. Materials and Methods

2.1. Reagents

Pure powdered graphite, acetic acid, sodium acetate, and acetone were all purchased from Synth® (Diadema, SP, Brazil). Carbon black powder was purchased from Cabot (Maua, SP, Brazil). The nail polish was purchased from Cora (São Paulo, SP, Brazil) and the catechol was purchased from Sigma-Aldrich®. All chemical reagents used were of analytical grade. The solutions were all prepared in water purified by the Millipore® (Burlington, MA, USA) Milli-Q system.

2.2. Obtaining Working Electrodes

2.2.1. Carbon Paste Electrode (CPE)

Two working electrodes were used in this study. One was an electrode based on carbon paste made up of graphite, carbon black, and mineral oil. The carbon paste was deposited in the cavity of a device formed by a 15 cm long tube containing a lower cavity with an internal diameter of 4 mm and a depth of 1 mm. The cavity has a platinum plate connected to a nickel/chromium plate, which was responsible for the electrical contact of the electrode. In this electrode, the components of the paste were optimized, and the sensor was used to evaluate the influence of pH and concentration of the supporting electrolyte on the catechol redox process. Carbon paste electrodes are popular due to their low background current and wide working potential range.

2.2.2. Screen-Printed Carbon Electrode (SPEC)

The second electrode used was a disposable printed electrode produced in the research laboratory, using the screen-printing technique. The printed electrode is composed of three electrodes in a single device, formed by a non-conductive substrate (polyethylene terephthalate sheet), a conductive ink composed of carbonaceous materials (graphite and carbon black), a binder (nail polish), and the solvent (acetone). The printed sensor was named SPEC.
This section details the fabrication of the conductive ink used for printing the electrodes. The process involved mixing pre-optimized quantities of graphite (GR), carbon black (CB), and nail polish (NP).
Amounts of 0.85 g of graphite and 0.15 g of carbon black were manually mixed, and 1.50 mL of acetone was then added and stirred until a completely uniform ink (designated as GR:CB) was obtained. It is crucial to use the ink immediately to prevent drying. Figure 1 illustrates the steps involved in the conductive ink preparation process.
The electrodes were printed using a commercial polyethylene terephthalate (PET) sheet as the substrate, which was previously sanded and cleaned with 70% alcohol. The electrode pattern was then printed on a vinyl adhesive sheet using a cutting plotter (Visutec, model MVSK800). The pattern was adhered to the PET and the conductive ink was deposited using a squeegee. The pattern was then removed, and silver ink was added to the quasi-reference electrode, followed by 100 µL of sodium hypochlorite to generate the Ag/AgCl electrode. The device was then placed in an oven at 50 °C for 20 min. Finally, the geometric area was delimited using nail polish, which created an insulating layer between the solution and the contacts. Figure 2 shows the steps involved in the fabrication of the printed electrodes.

2.3. Instrumentation

Characterization of the materials by scanning electron microscopy (SEM) was carried out with a JEOL microscope (model JSM-300-LV, Peabody, MA, USA).
Cyclic voltammetry (CV) was employed as the electrochemical characterization technique to evaluate the electrochemical performance of the SPEC sensor. All measurements were performed using a Metrohm PGSTAT12 potentiostat/galvanostat coupled to a computer for data acquisition using Nova 2.1.6 software. A conventional electrochemical cell containing the described working electrodes was used as the system for obtaining the electrochemical measurements. The electrochemical behavior of catechol was evaluated in 0.2 mol L−1 acetate buffer solution at pH 5.0 in the presence of 15.0 μmol L−1 of catechol, a concentration optimized to ensure ideal visibility of redox processes.

3. Results

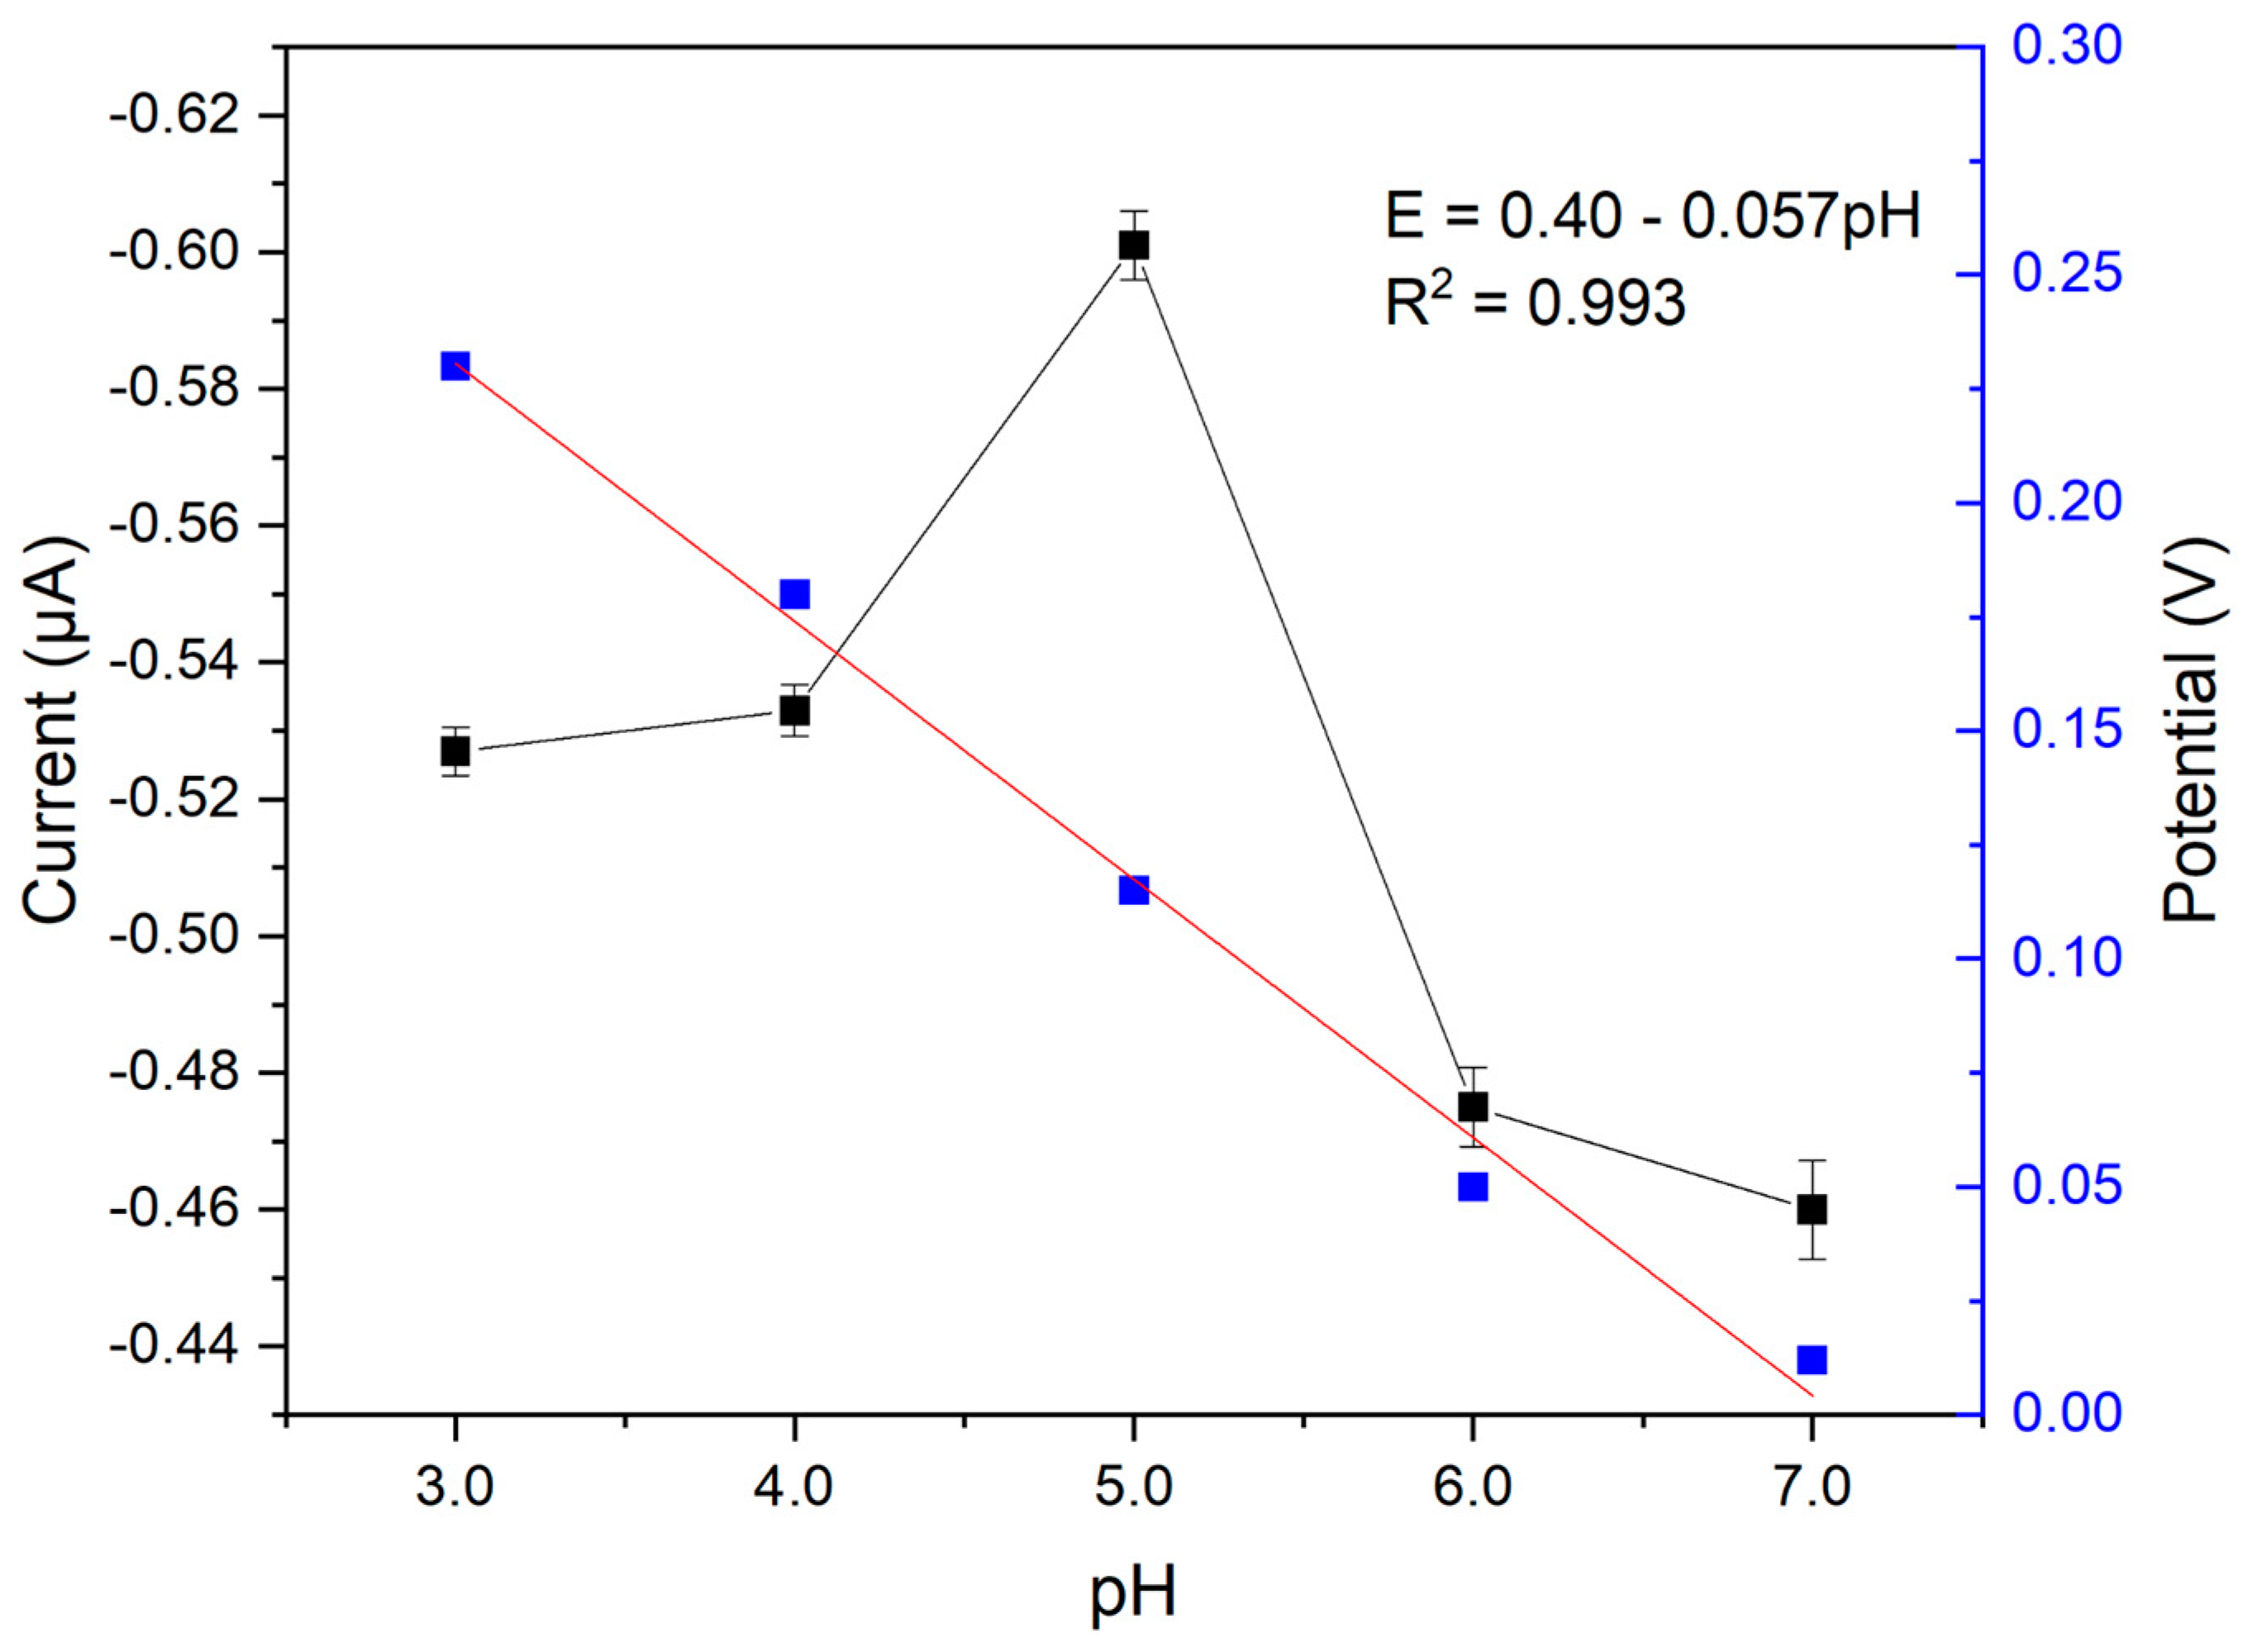
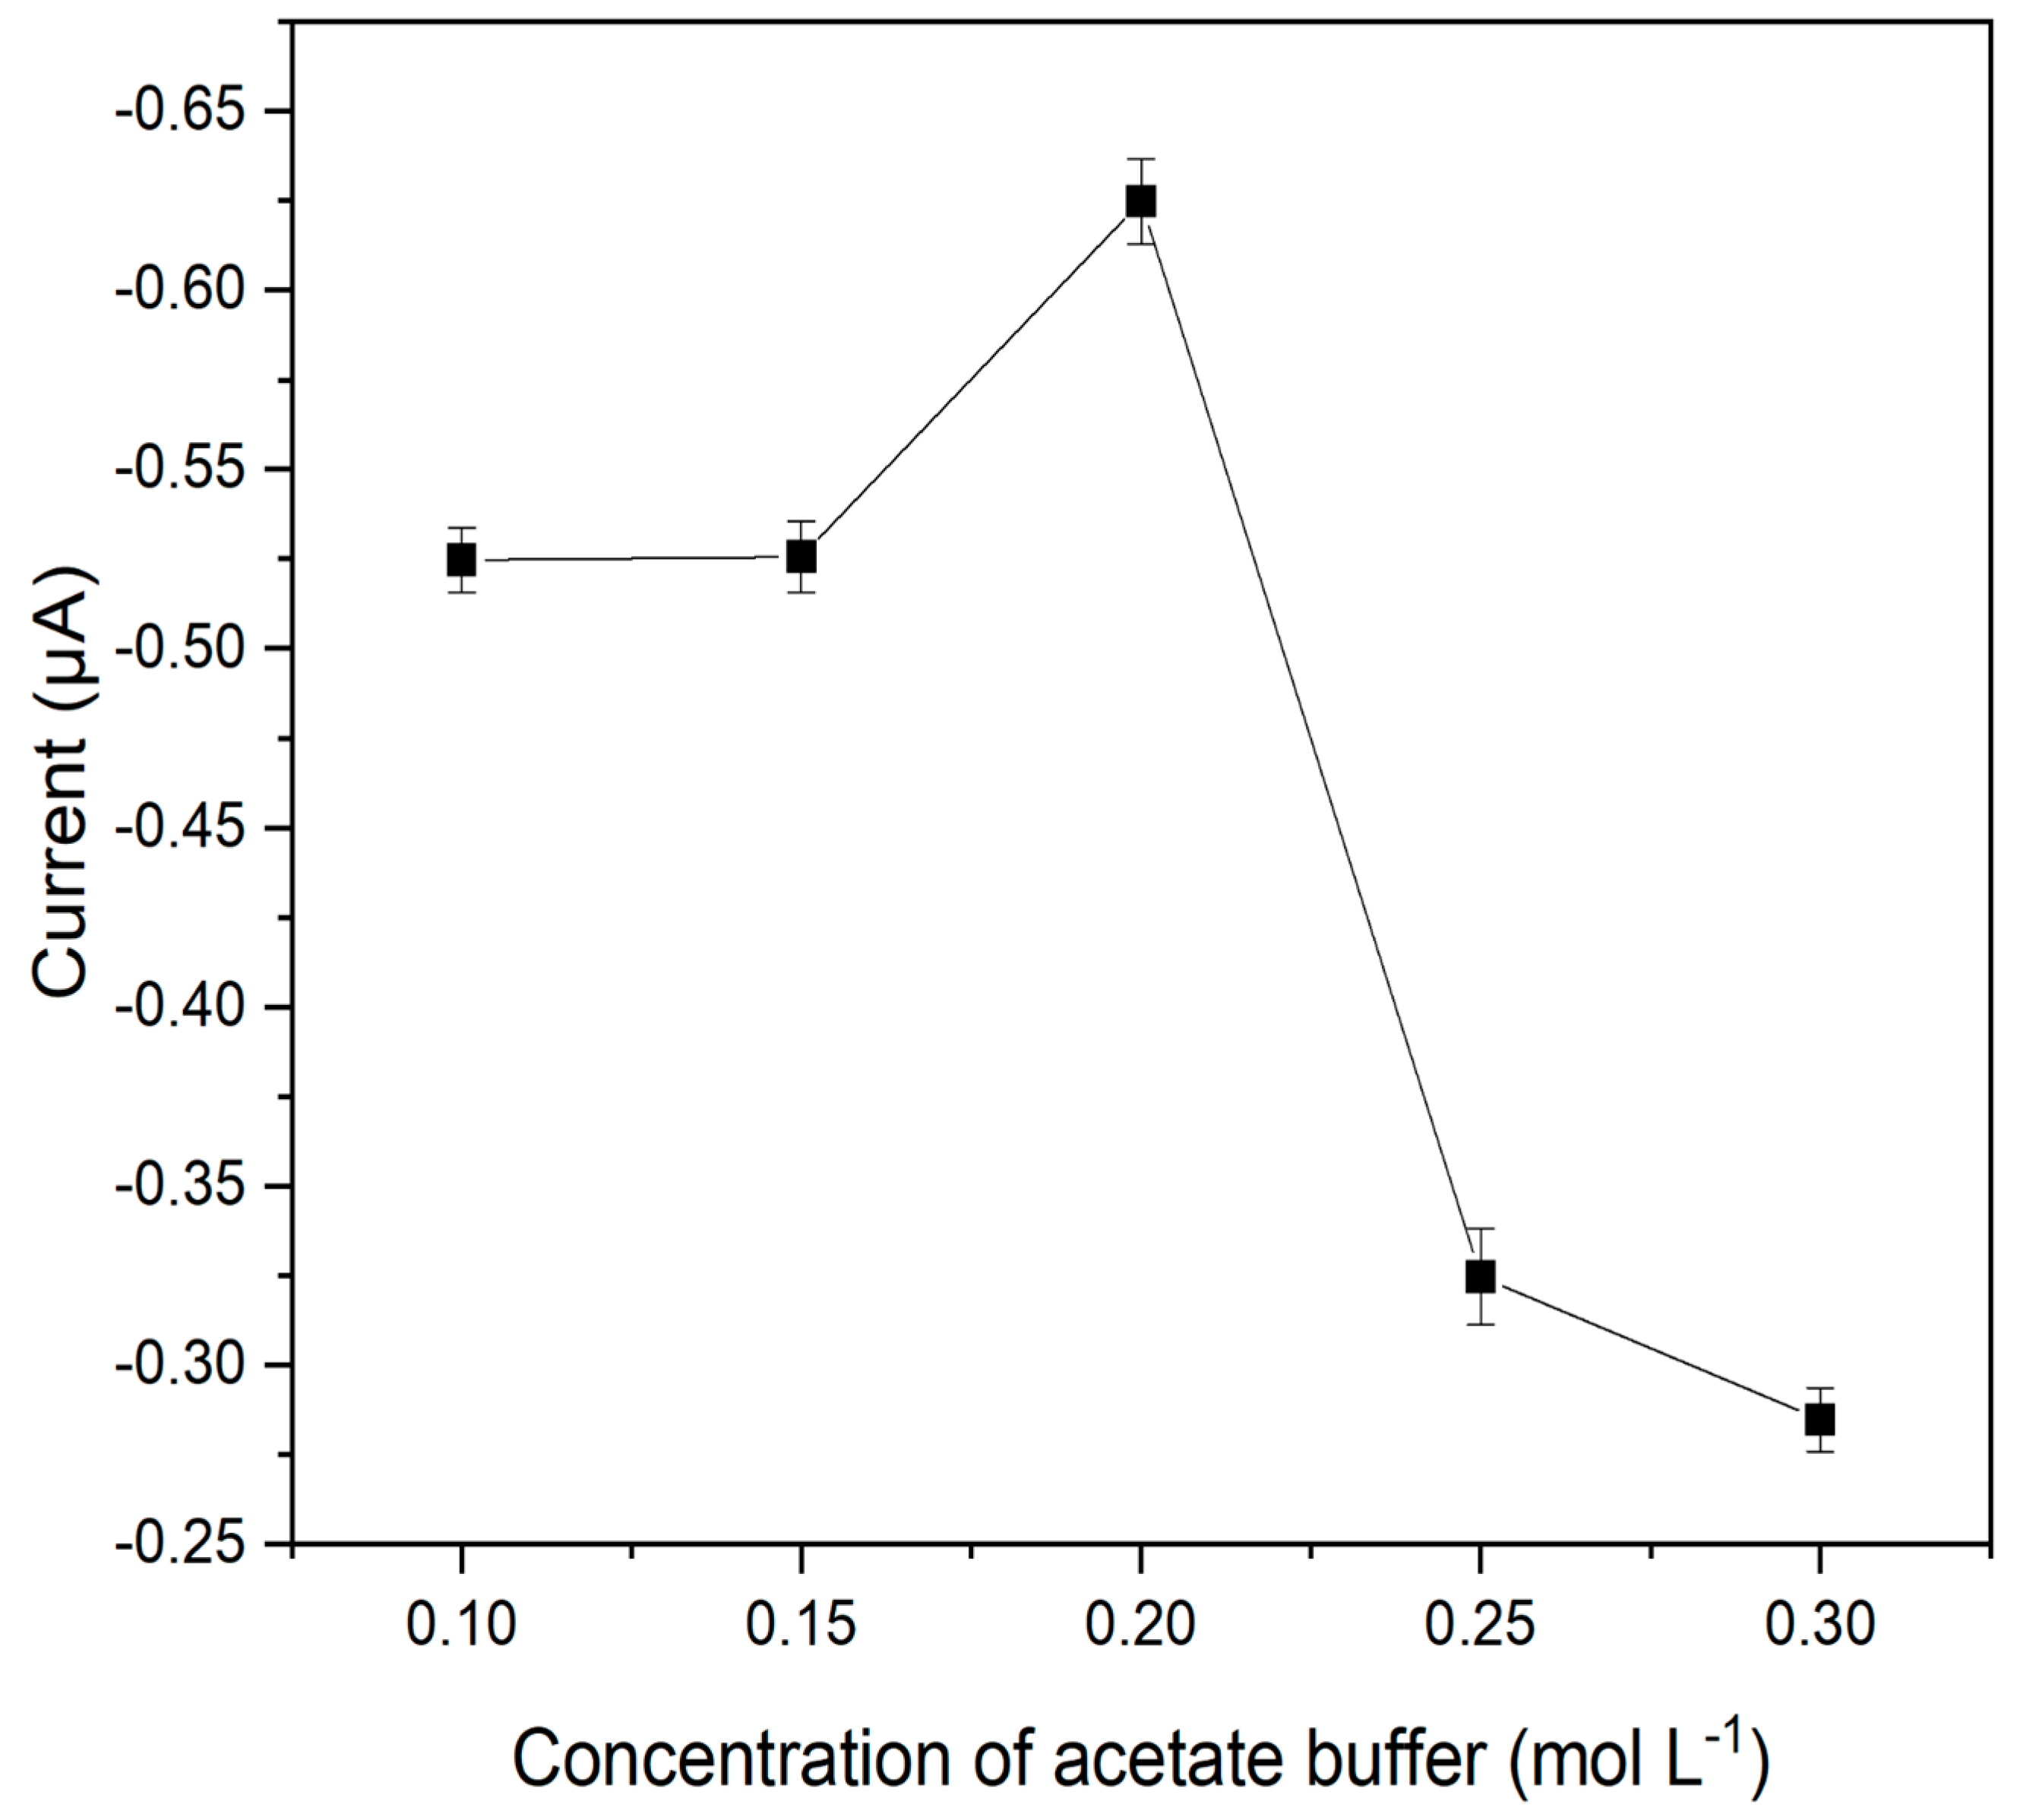
3.1. Electrochemical Performance as a Function of pH and Buffer Solution Concentration

Studies employing a CPE electrode were carried out to evaluate the influence of pH and supporting electrolyte concentration on the redox process of catechol. Firstly, the effect of pH was evaluated at values between 3.0 and 7.0, and for this study, a 0.2 mol L−1 acetate buffer solution was used. The acetate buffer solution was selected due to its wide application in the electrochemical analysis of catechol, as reported in the literature, ensuring ideal experimental conditions [27,28,29,30,31]. The results presented for variation in current and cathodic peak potential as a function of pH can be seen in Figure 3.
An increase in the cathodic peak current intensity was observed (Figure 3) at pH 5.0. At pH values above 5.0, the current decreased. This suggests that a higher pH harms the catechol redox reaction. Therefore, the optimized value was pH 5.0, as this value falls within the buffering range of the acetate buffer solution (3.75 to 5.75), making it a suitable choice for further studies.
Regarding the influence of pH on the cathodic peak potential, a linear relationship was observed. This correlation indicates that protons also participate in the reduction of catechol. From the slope of the line described in Figure 3, a value of −0.057 is obtained. Relating this to the Nernst equation, where ne is the number of electrons and m is the number of protons, the following is obtained:
E P C = 0.0592 m n e × p H + b
It can be seen that the angular coefficient of the straight line obtained (−0.057) is very close to that of a Nernstian system (−0.0592), indicating that the number of protons involved in the catechol redox reaction is equal to the number of electrons. In Scheme 1 below, the redox reaction proposed according to the literature for the catechol in the electrode is identified:
Finally, the ionic strength of the reaction medium was evaluated at pH 5.0, varying the concentration of the acetate buffer solution from 0.10 to 0.30 mol L−1, as shown in Figure 4.
According to Figure 4, it was observed that above 0.20 mol L−1, the analytical response of the sensor decreased. This can be explained by the fact that increasing the number of ions present in the buffer solution may hinder the diffusion process. Competition between the analyte and acetate ions may have occurred, which justifies the lower current intensity. On the other hand, the 0.15 mol L−1 concentration also presented a lower current value when compared to the best performance concentration. It is known that the electrolyte concentration should be at least 100 times higher than that of the analyte, so for very low concentrations, the role of maintaining the high ionic strength of the solution may be impaired. Another fact that may also justify this behavior is that the amount of charge carriers available was probably insufficient for effective reduction. Thus, the concentration of the acetate buffer solution was set at 0.2 mol L−1 for subsequent studies.
In the following stages, printed electrodes were used due to their characteristics of being simpler and miniaturized systems, presenting more compact electrode arrangements that can be built on a single support. This makes them suitable for the development of portable sensors. In addition, these electrodes can be produced on a large scale, reducing manufacturing costs, and can be used as disposable devices. This not only reduces cleaning steps between analyses but also prevents contamination problems on the electrode surface.

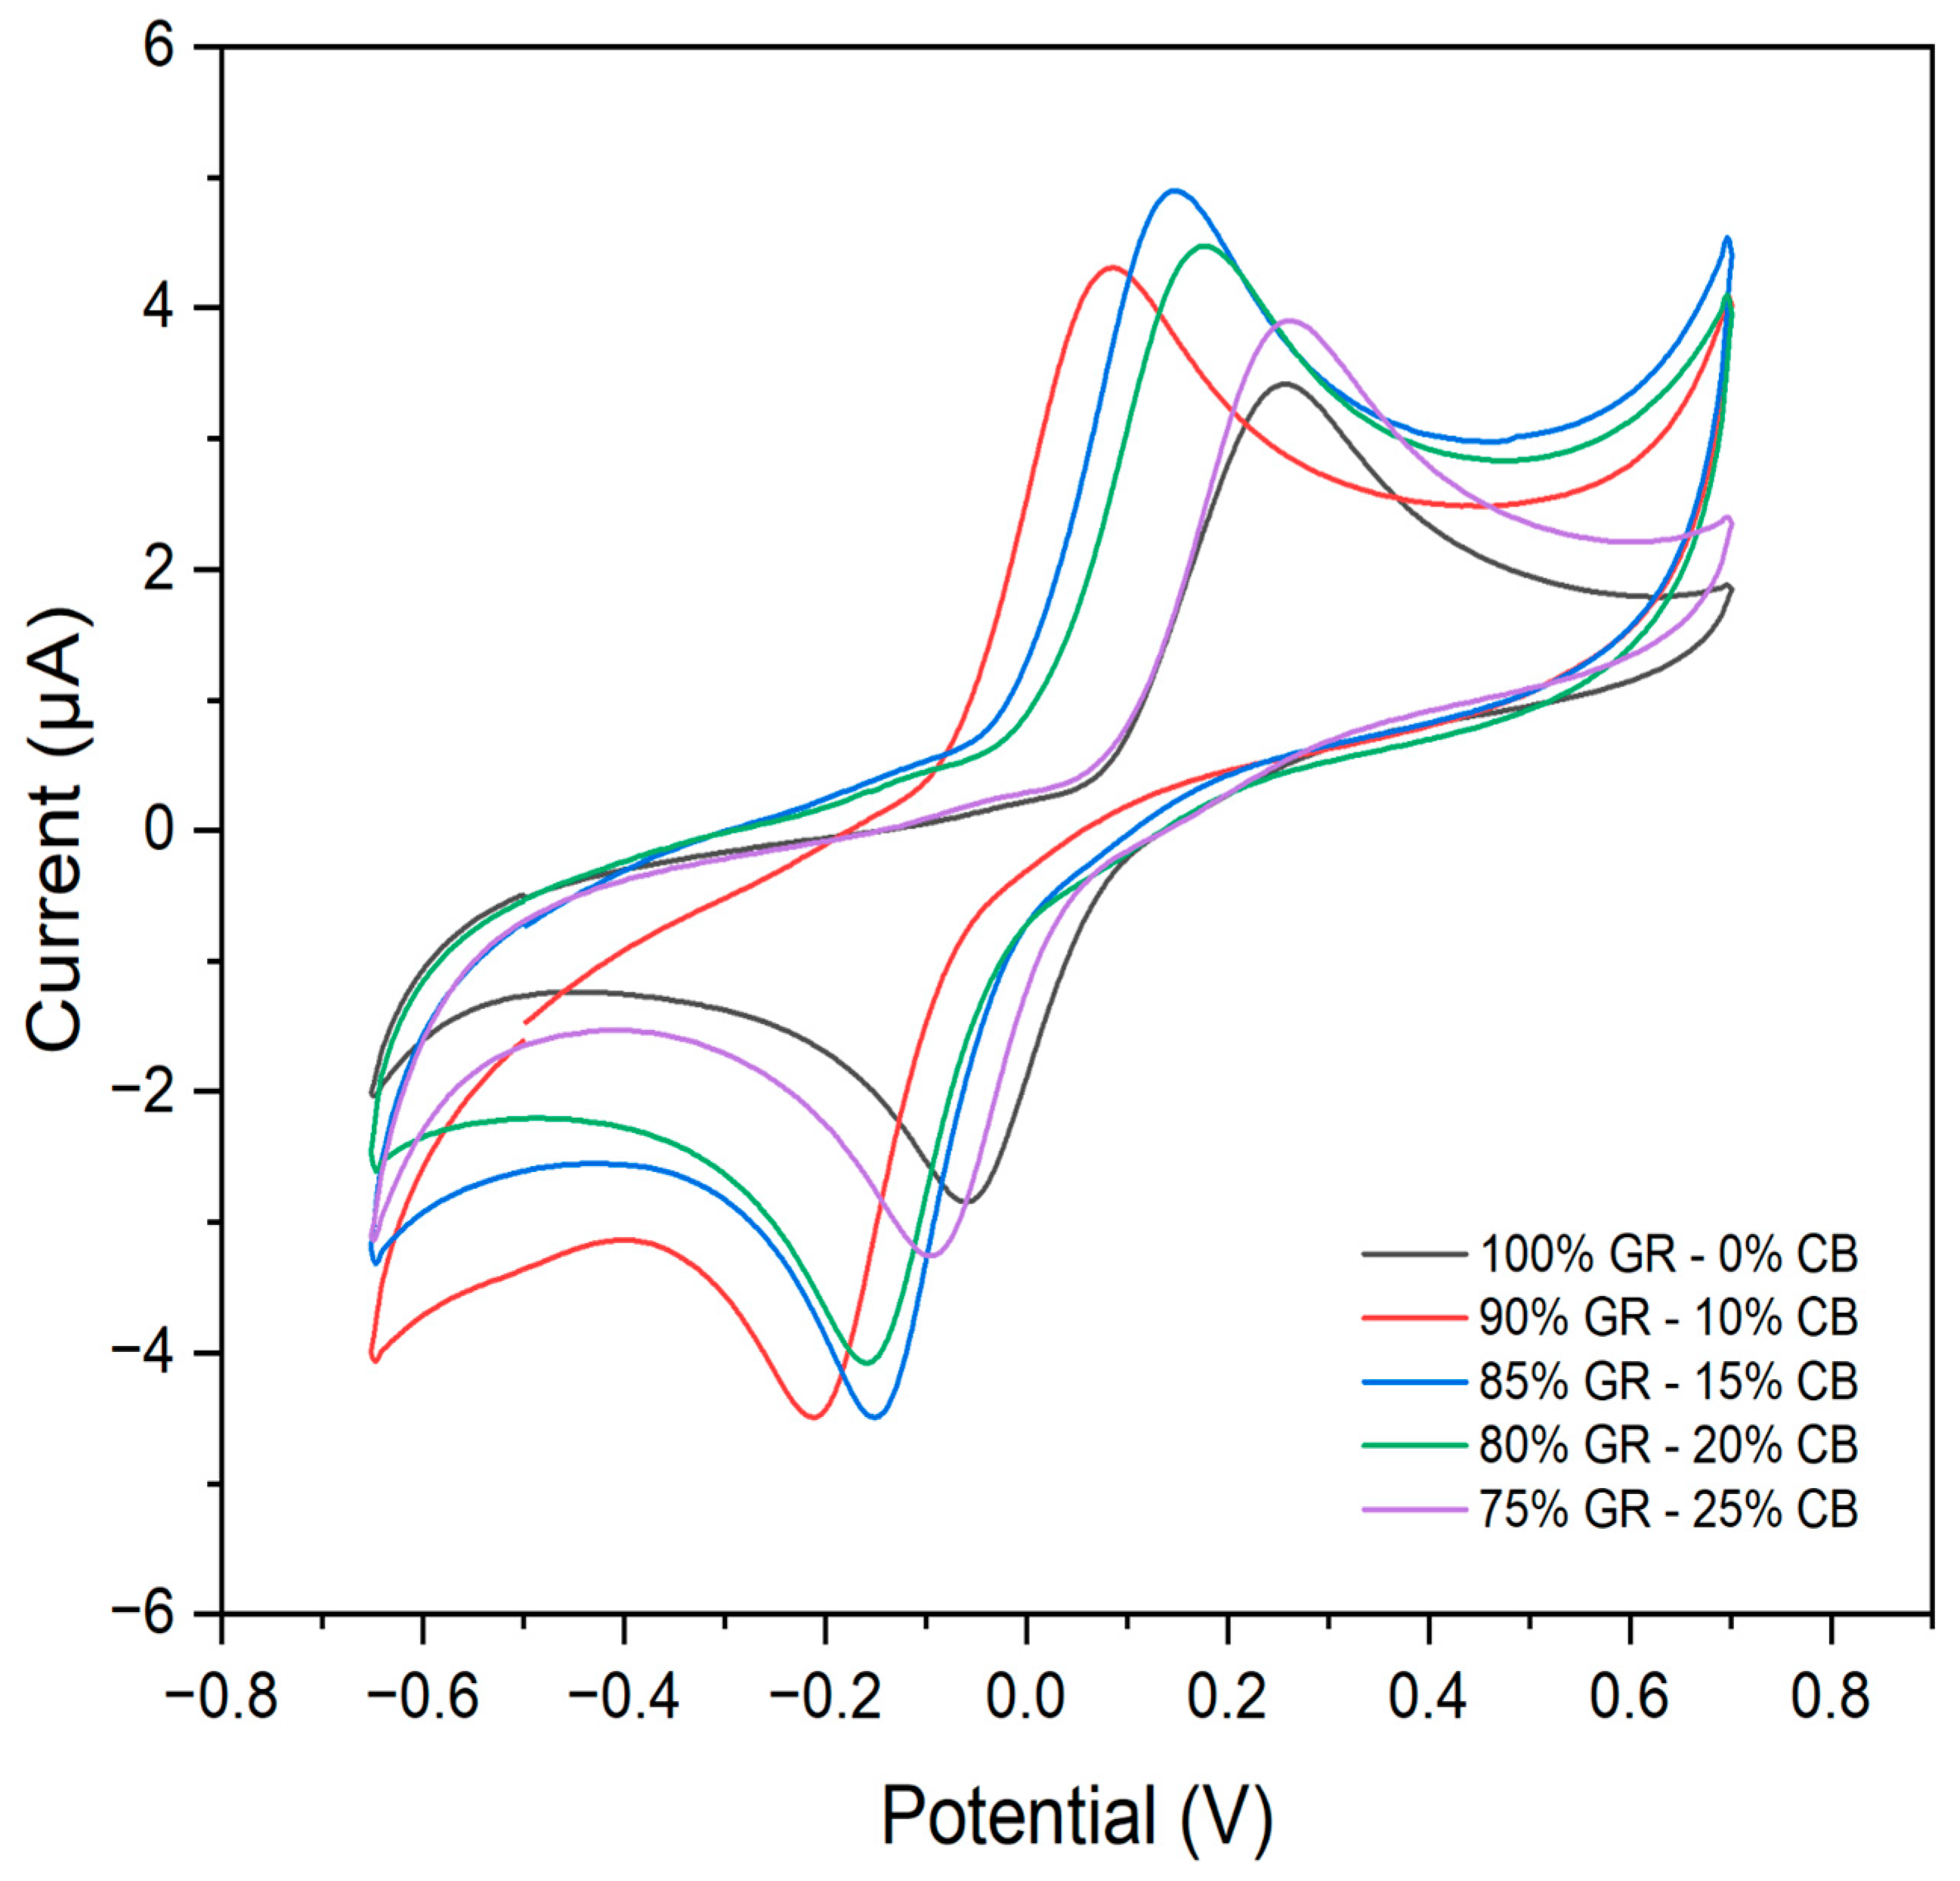
3.2. Conductive Ink Optimization

The conductive ink for electrode printing was formulated by combining graphite (GR) and carbon black (CB) as carbonaceous fillers dispersed in a nail polish (NP) binder. The electrochemical behavior of the formulated inks was initially evaluated using cyclic voltammetry (CV) to optimize the ratio of GR:CB while maintaining the constant NP amount (details in Figure 5).
CV analysis revealed that the ink containing 85% GR and 15% CB exhibited superior electrochemical performance. This ink demonstrated the highest current intensity and well-defined redox peaks indicative of good reversibility. In contrast, inks with higher CB content (20% and 25%) displayed a decrease in current intensity and diminished reversibility. Based on these results, the ink composition of 85% GR and 15% CB was chosen for the printing process of the electrodes.
After optimizing the amount of carbonaceous material, the amount of NP in the composition of the paint was studied. For this purpose, the previously optimized amounts of carbonaceous material (GR:CB) were maintained, and the amounts of NP (58.3, 55.5, and 60.8%) were varied. The voltammograms are shown in Figure 6. The ink composed of 58.3% NP showed the best electrochemical performance and greater reversibility. For 55.5% NP, it was not enough to homogenize the ink, while for the ink with 60.8% NP, there was a reduction in the intensity of the current, justified by the greater amount of binder material, hindering the process of electronic transfer. Therefore, the paint with the best electrochemical performance has in its composition 58.3% binder and 41.7% carbonaceous material (GR:CB).

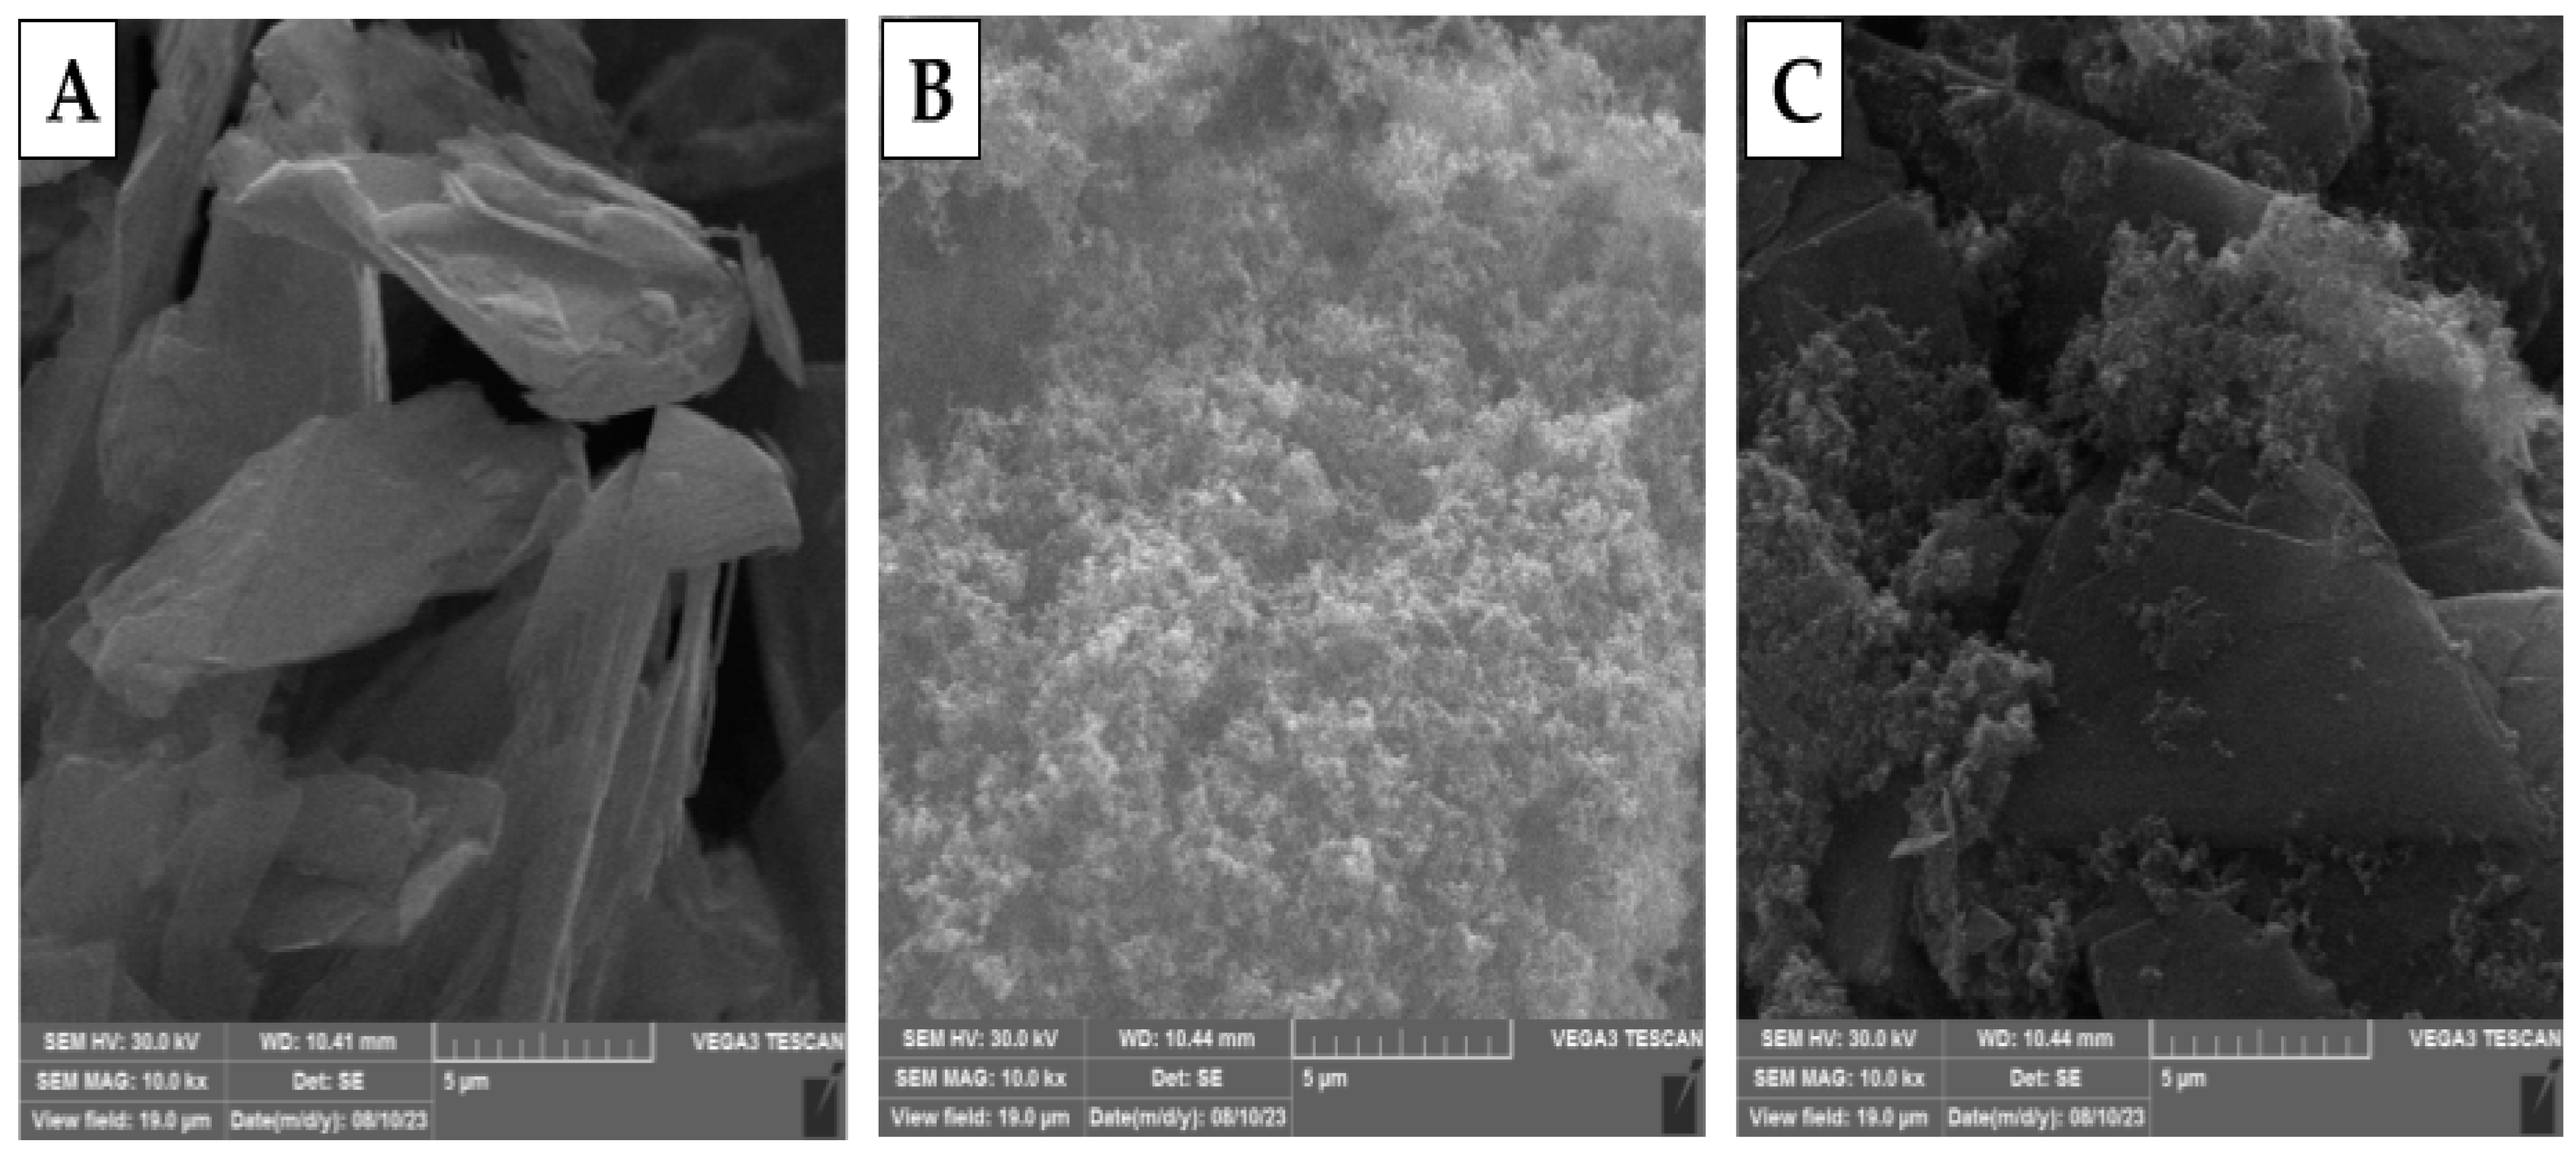
3.3. Scanning Electron Microscopy (SEM)

Scanning electron microscopy (SEM) revealed the morphology of the carbonaceous materials and conductive ink (Figure 7). Graphite (Figure 7A) exhibits the characteristic lamellar structure as expected for this material [32]. Carbon black (Figure 7B) appears as spherical clusters of carbon particles, confirming its typical morphology [33]. The ink image (Figure 7C) demonstrates good dispersion of the carbonaceous materials. This dispersion is important for improving the surface area of the composite which provides a better electron transfer.

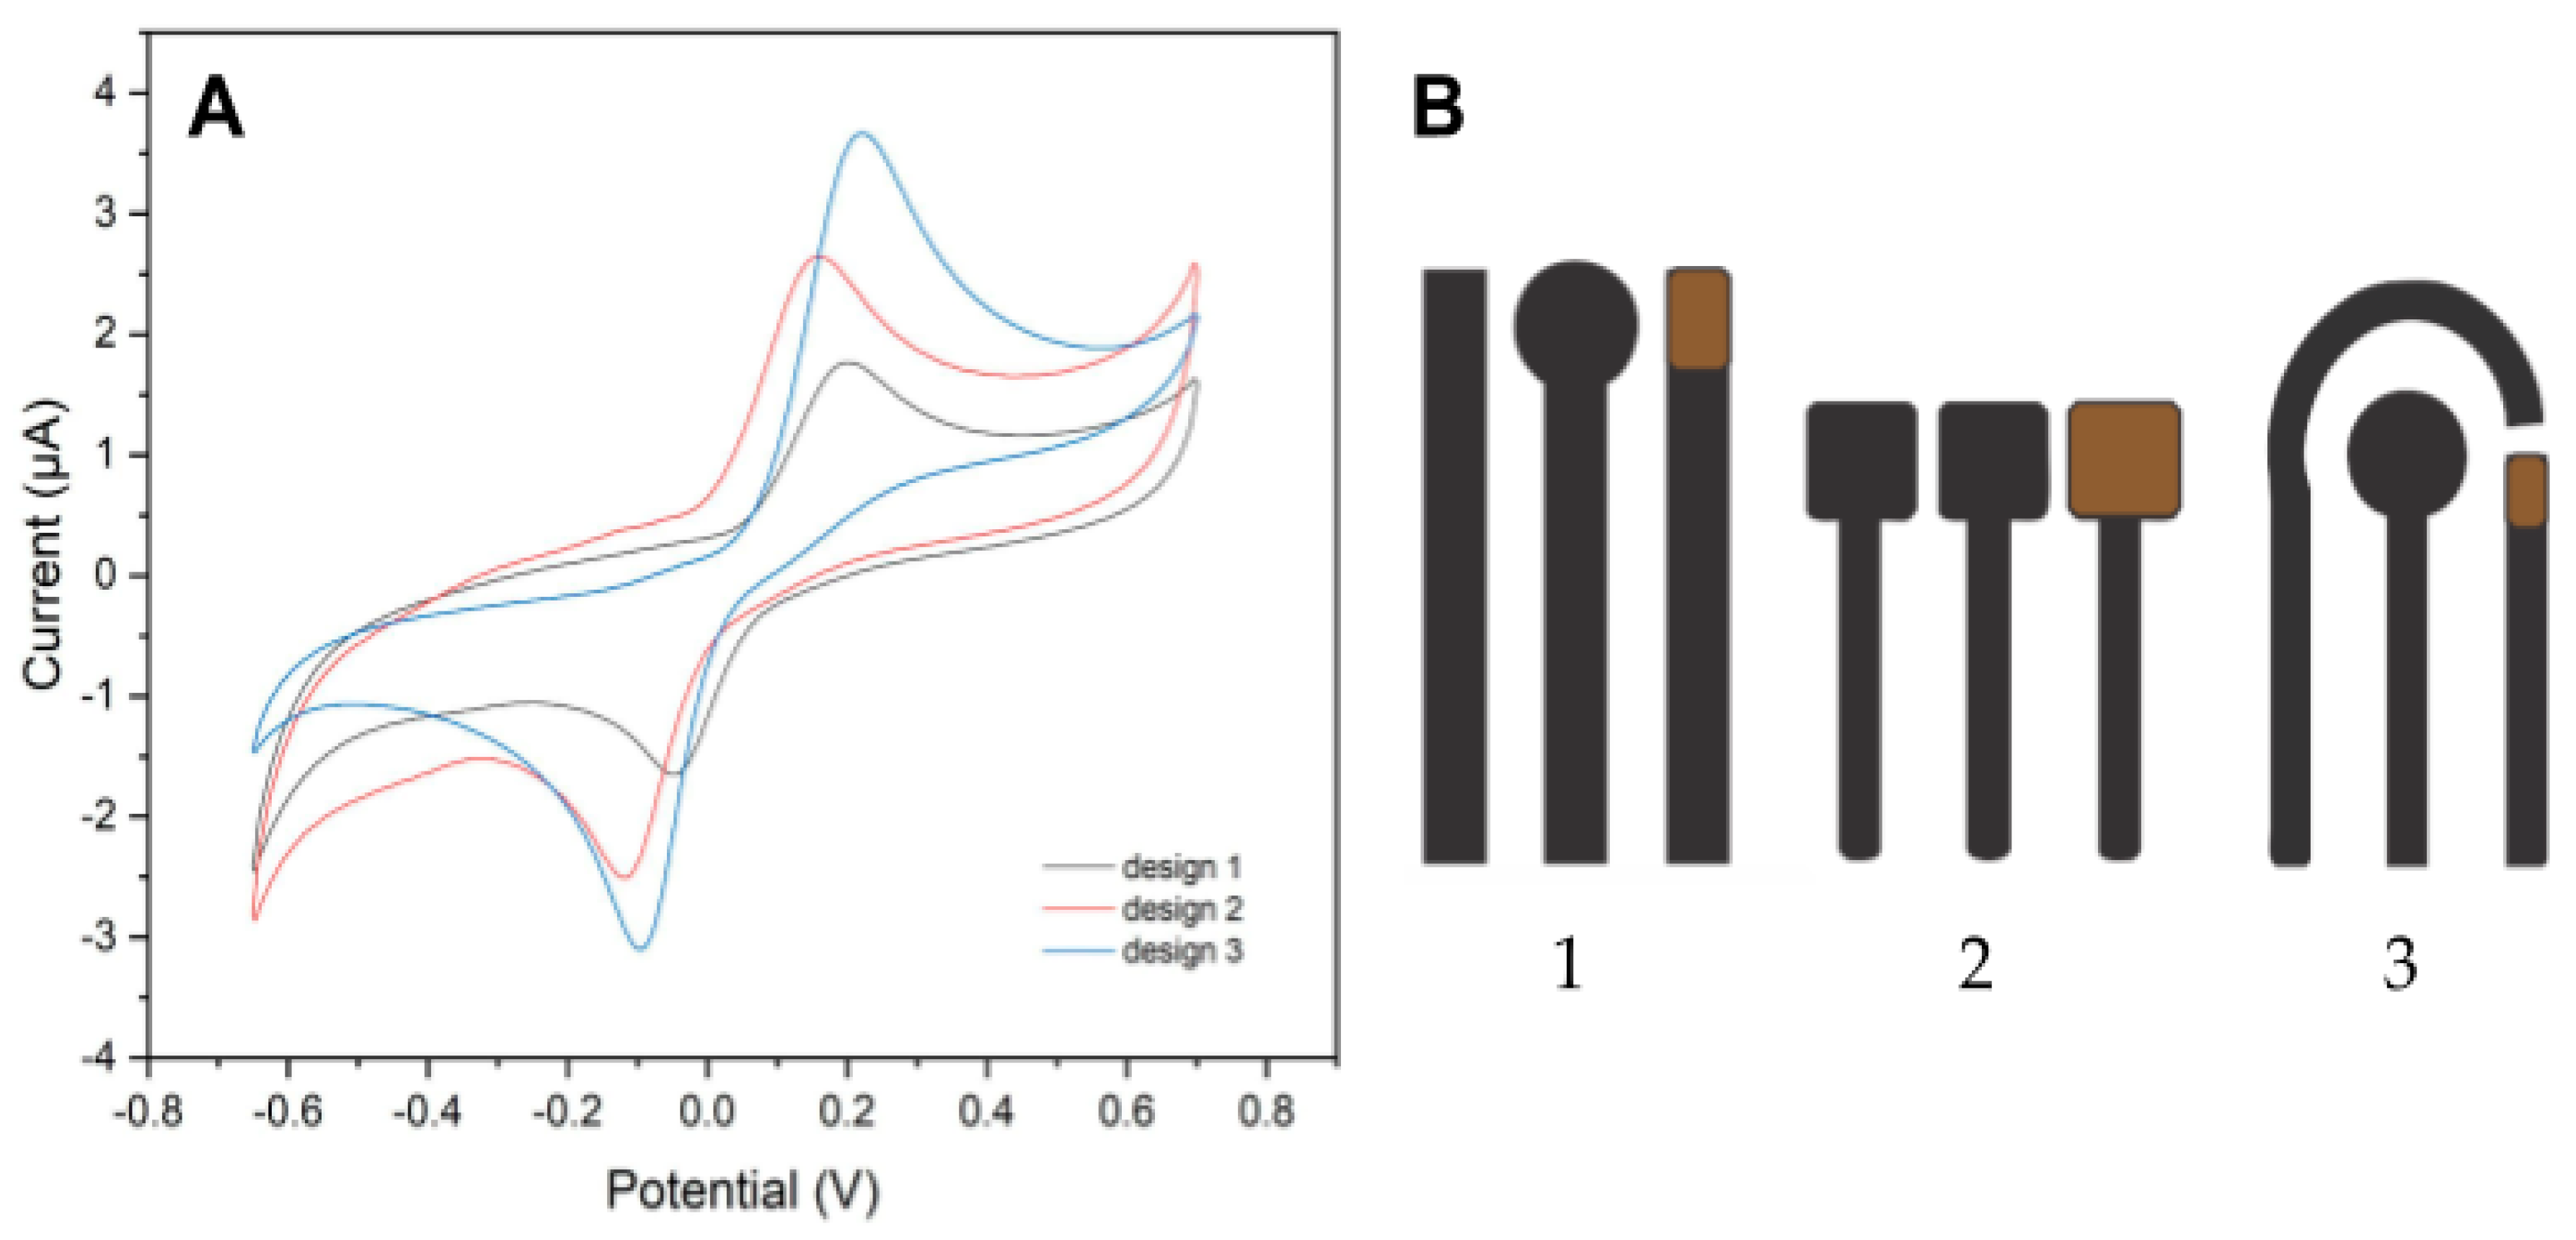
3.4. Sensor Design Optimization

The influence of electrode design on the analytical response of catechol was evaluated. This study is important because the geometry and distance between the electrodes directly influence the electron transfer process. Thus, three designs were developed, and the electrochemical behavior of catechol was evaluated using the SPEC sensor through the cyclic voltammetry technique (Figure 8).
Three electrode designs were evaluated for their analytical performance. Design 1 had a working electrode with a larger geometric area (28.26 mm2) compared to the auxiliary electrode (12.89 mm2). In design 2, all three electrodes had the same geometric area (28.26 mm²). Design 3 differed by having a smaller working electrode (28.26 mm2) and a larger auxiliary electrode (66.33 mm2).
Among these designs, design 3 exhibited the best analytical performance. This was attributed to its considerable current gain and well-defined peak profiles. One justification for the observed result may be related to the ratio between the size of the auxiliary electrode and the working electrode, where the area of the former is approximately twice that of the latter. Montes et al. (2015) investigated the relationship between the working and auxiliary electrode sizes [34]. Their findings suggest that a larger auxiliary electrode helps prevent several issues: blockage of the working electrode surface, polarization, and passivation (formation of a protective layer) caused by the applied current. Considering this research and the results obtained, design 3 with its larger auxiliary electrode was chosen for this study.

3.5. Choice of Technique and Optimization of Operating Parameters

To evaluate which technique would be more sensitive for the determination of catechol, assessing its reduction, and using the SPEC sensor, the operational parameters of the differential pulse voltammetry (DPV) and square wave voltammetry (SWV) techniques were first optimized. Both techniques were used for this study because they minimize the contribution of capacitive current to the total current read [35]. The following operational conditions were optimized: scan rate, amplitude, and frequency, as can be seen in Table 1 below.
According to the table, a higher sensitivity for SWV of 0.31 μA L μmol−1 compared to DPV of 0.13 μA L μmol−1 is observed, so the current gain for SWV is greater, allowing us to conclude that a small difference in the concentration of the analyte causes a large variation in the value of the measured analytical signal. In addition, this technique has the advantage of being able to work with high scan rates, so that there is a greater definition of the peak current, therefore improving its sensitivity. Thus, SWV is the most sensitive and suitable technique for the determination of catechol.

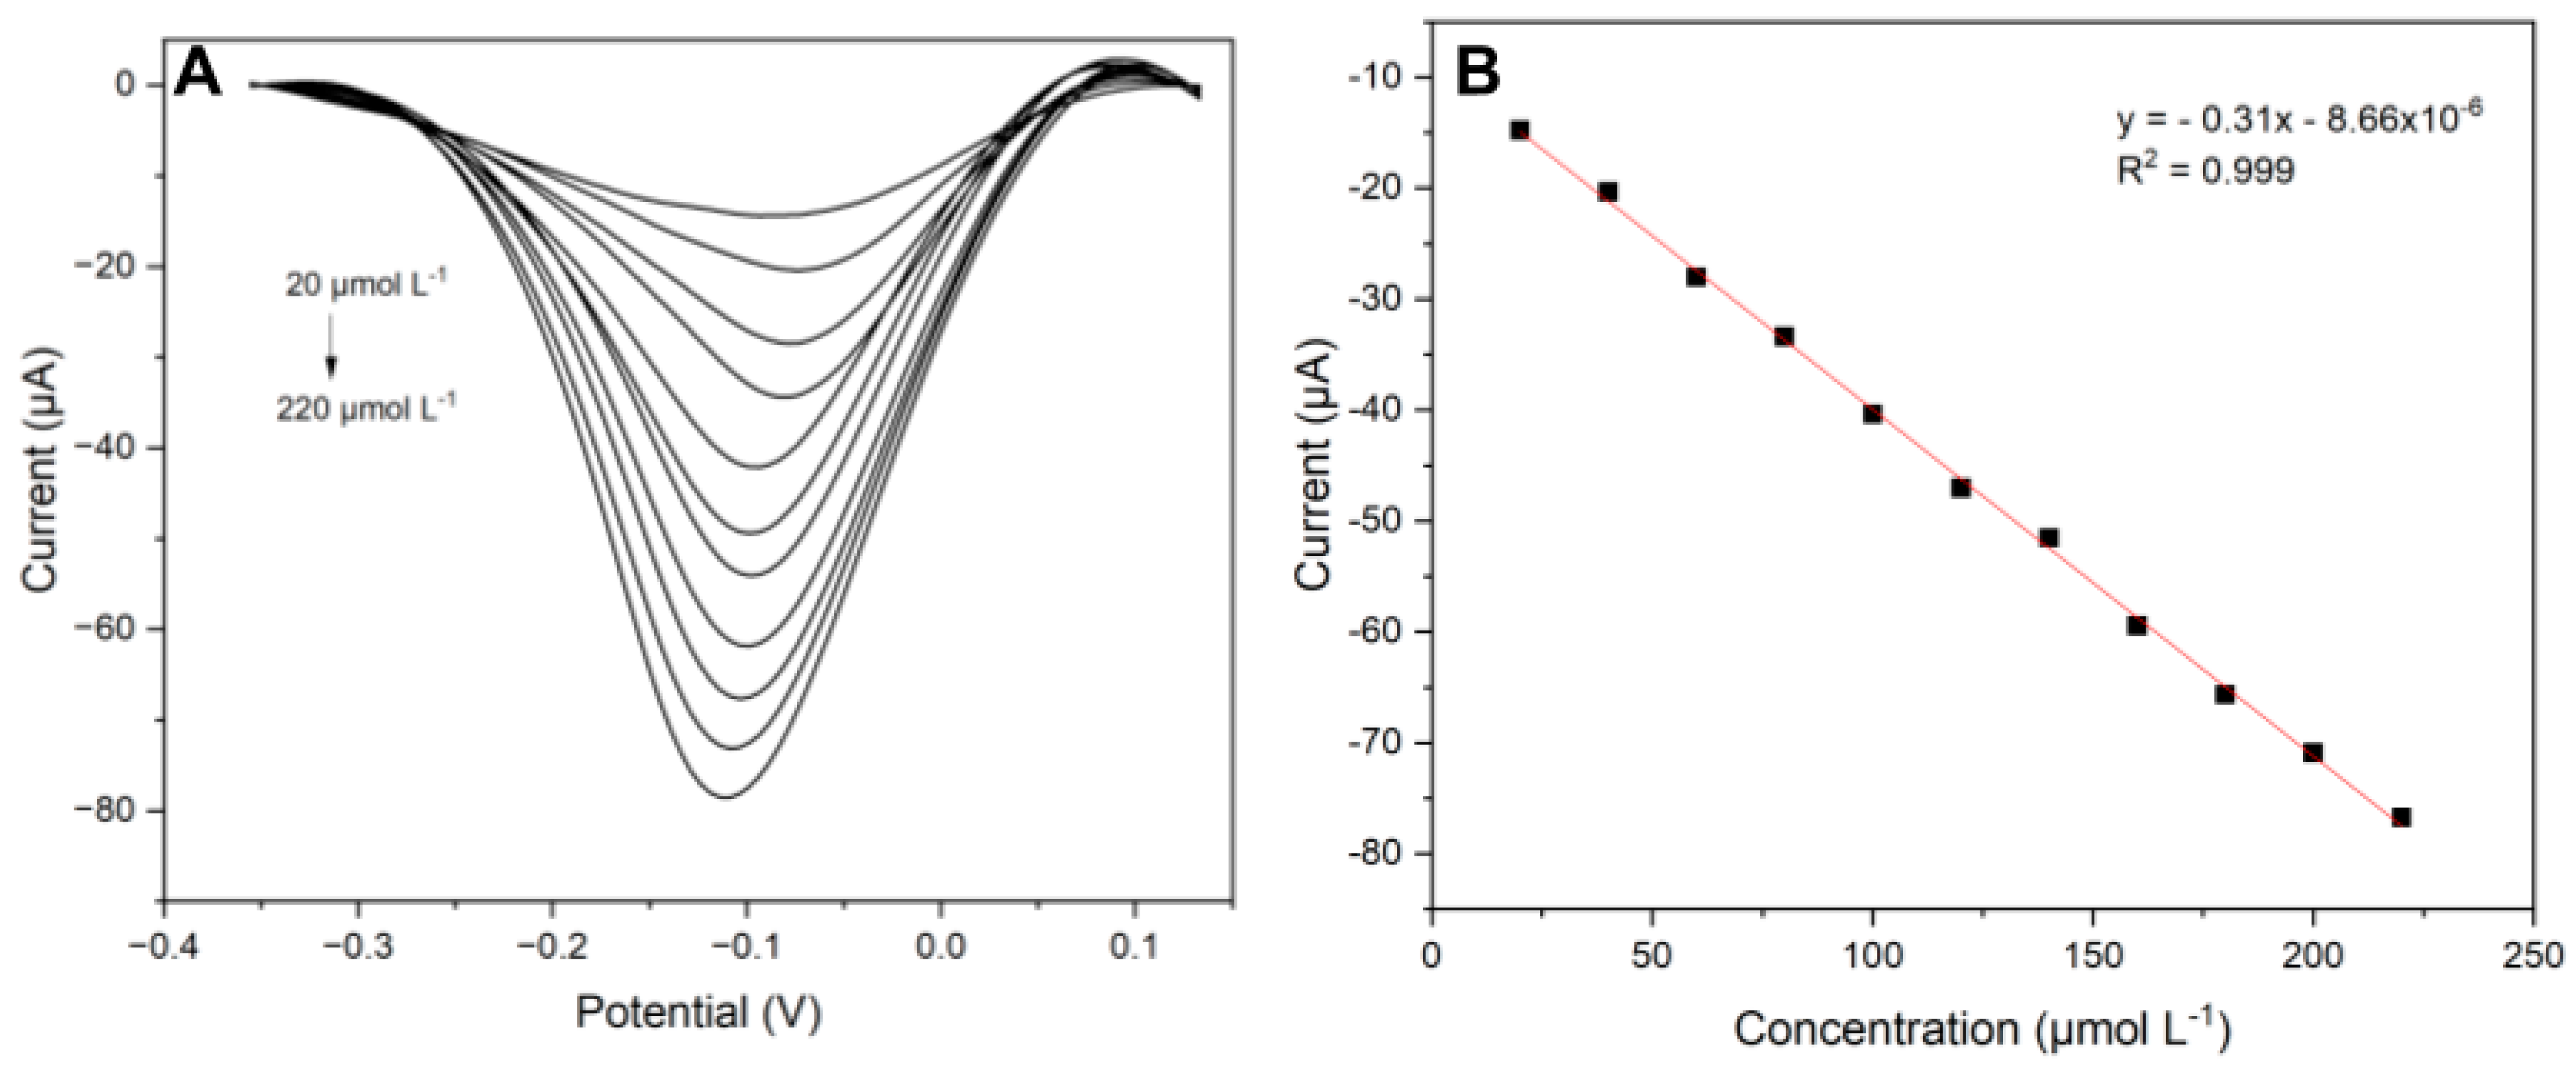
3.6. Construction of the Analytical Curve

After completing the optimization of all experimental and operational parameters that may influence the electron transfer process, the applicability of the sensor was evaluated through the analytical curve, using the square wave voltammetry (SWV) technique in 0.2 mol L−1 acetate buffer (pH 5.0), and with the following parameters: an amplitude of 100 mV and a frequency of 40 Hz. The square wave voltammograms and the analytical curve obtained for the proposed sensor can be seen in Figure 9 below.
As observed in the voltammograms, there was a gradual increase in current extending to more negative values as the catechol concentration increased. The analytical curve allowed us to verify the linearity of the system and, through it and the straight-line equation, to calculate the analytical parameters. Thus, according to the following equation: IPC (μA) = −8.66 × 10⁻⁶–0.31 [CT], a linear range of 20–220 µmol L−1, a sensitivity of 0.31 μA L μmol−1, and a limit of detection and quantification of 5.96 and 19.87 μmol L−1, respectively, were obtained. Based on this study, it can be considered that the presented sensor has analytical potential and can be used as an electrochemical sensor.
The results of the obtained analytical parameters were compared with published works. As can be observed in Table 2, the developed method presents a limit of detection close to the values found in the literature, being advantageous for employing a simple, sensitive, and easy-to-produce method, in addition to being disposable and low cost, with an estimated manufacturing value of $0.01 per unit.

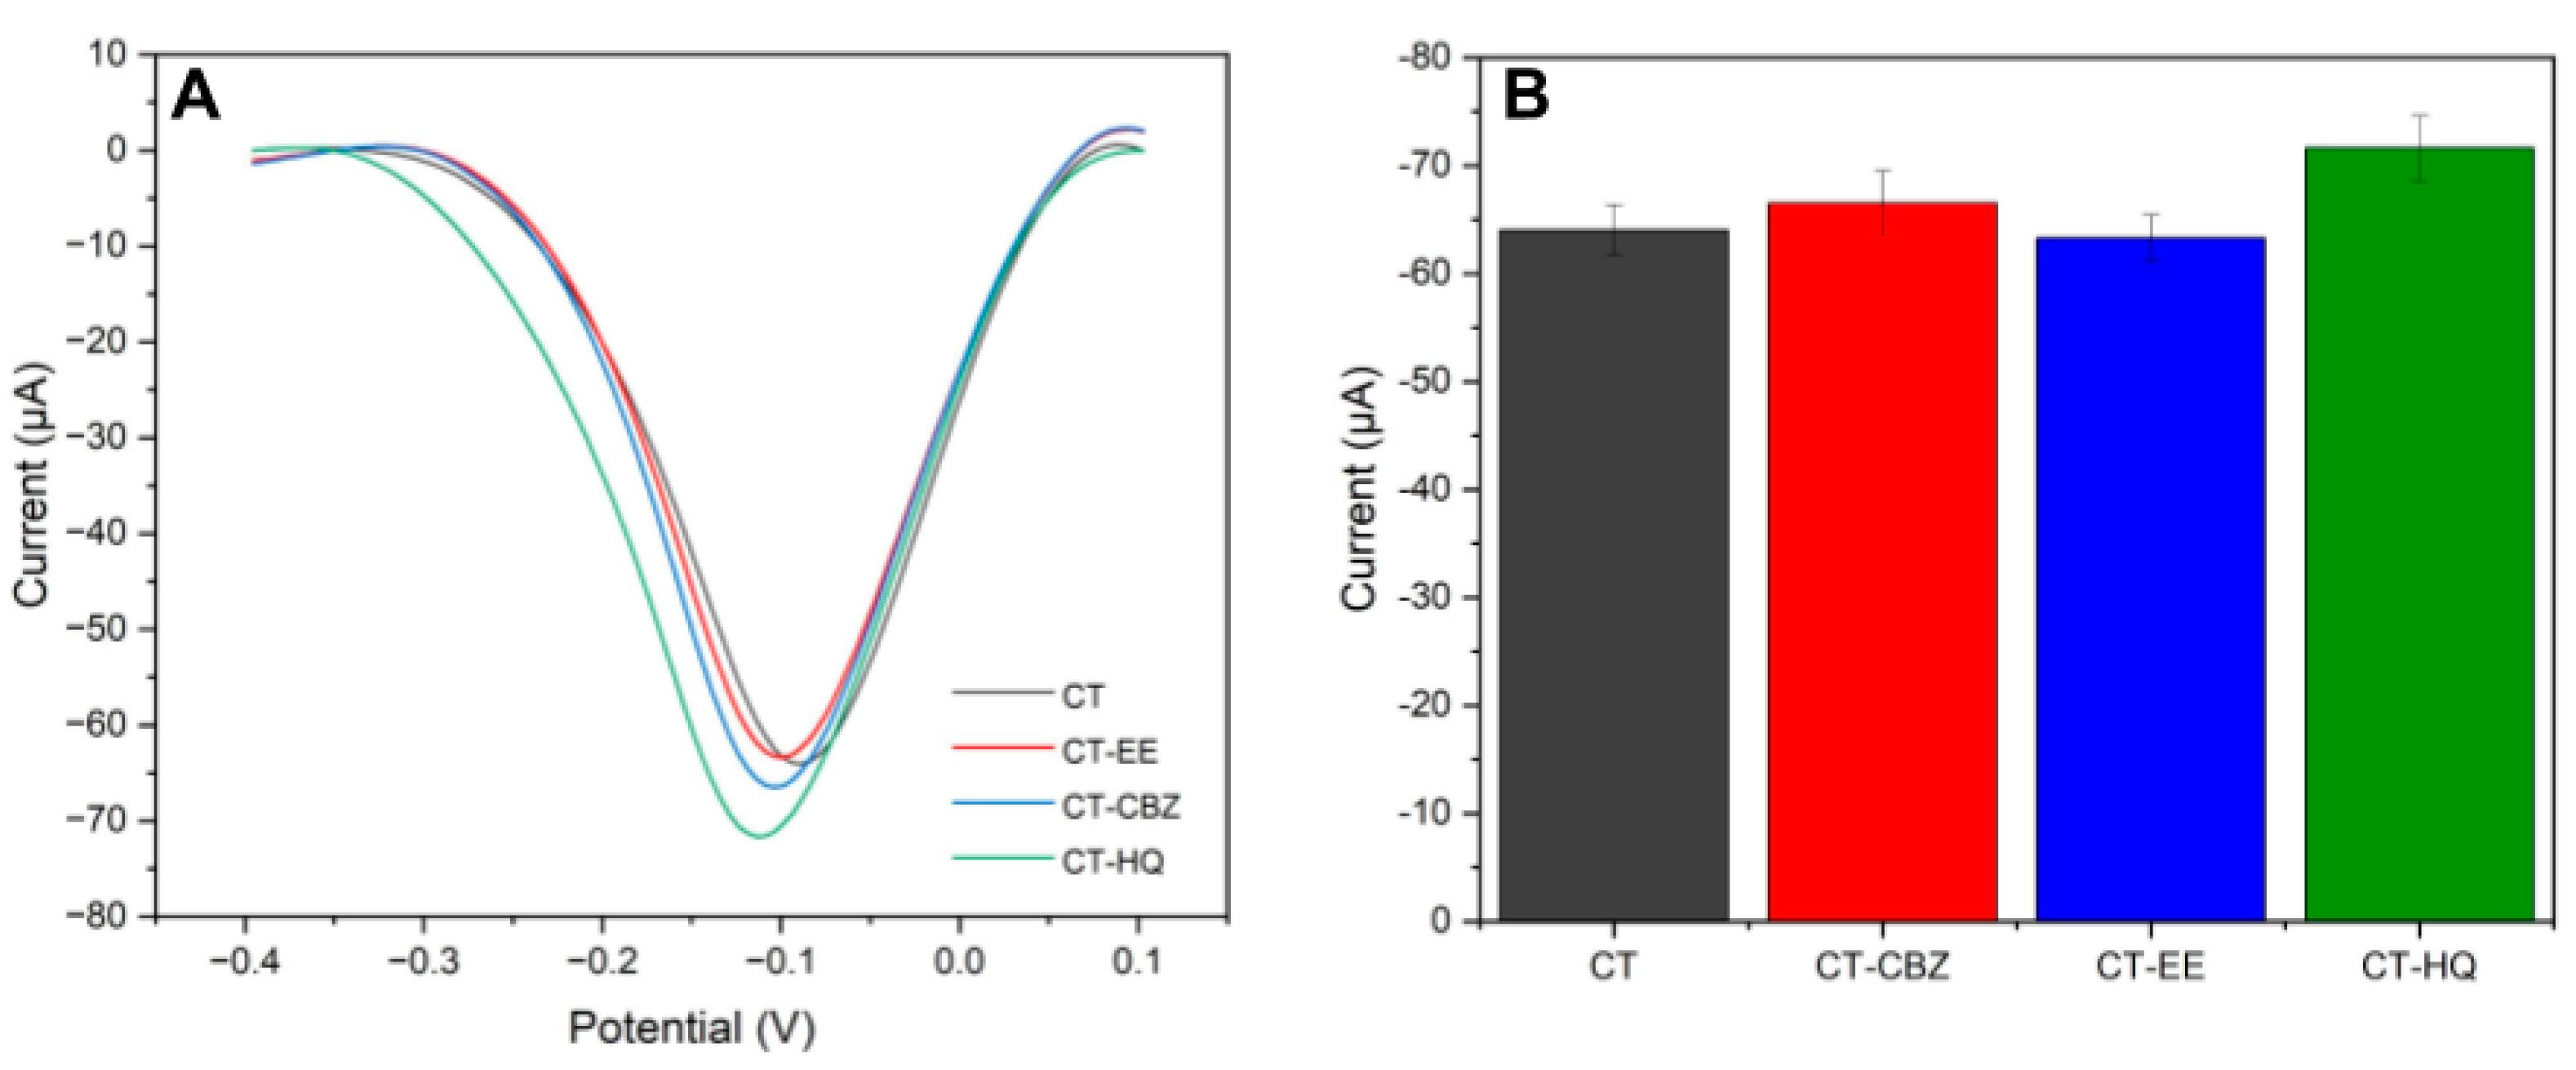
3.7. Assessment of Sensor Performance against Possible Interfering Species

Aiming at the application of the proposed sensor for the determination of catechol in water samples, the behavior of possible interfering species in the reduction of catechol was evaluated using the square wave voltammetry technique (Figure 10). The synthetic hormone ethinylestradiol (EE), considered an environmental pollutant, carbendazim (CBZ), which is widely used as a pesticide and is present in river water and in food, and hydroquinone (HQ), which is an isomer of catechol and presents similar electrochemical properties, were evaluated. Both compounds are electrochemically active. They were both added to the electrochemical cell containing the acetate buffer (pH 5.0) with the addition of 100 µmol L−1 of catechol and evaluated separately. The concentration of the interferents was 10 times higher than that of catechol.
It was possible to conclude, from the results presented, that carbendazim and ethinylestradiol influenced the current variation by less than 4%, while hydroquinone influenced the current variation by about 12%, which is explained by the great similarity between the compounds, since catechol and hydroquinone are constitutional isomers, changing only the position of the OH group which is ortho for catechol and para for hydroquinone. While hydroquinone interfered, the sensor remains applicable for catechol detection in water samples containing both compounds.

3.8. Application of the Method

The SPEC sensor was applied to the determination of catechol in tap water samples. The samples were evaluated utilizing the method of the addition of known concentrations of catechol and subsequent recovery. The technique used was SWV with the following parameters: an amplitude of 100 mV and a frequency of 40 Hz. Table 3 displays high recovery percentages ranging from 97.95% to 100.17%. This indicates the successful application of the analytical method without matrix effects, demonstrating its suitability for catechol determination in water samples.

4. Conclusions

This work developed an electrochemical sensor using a screen-printed carbon electrode printed with a proposed and optimized conductive ink for catechol determination. The ink obtained presented suitable characteristics for the printing technique used. The low-cost materials used contributed to the production of a disposable device with a low manufacturing cost estimated at $0.01 per device. The catechol redox process also depends on pH and follows Nernstian behavior. The optimization of experimental and operational parameters resulted in a detection limit of 5.96 µmol L−1 and a sensitivity of 0.31 μA L μmol−1. The method was applied to determine catechol in tap water samples, without matrix effect, with recoveries close to 100%, therefore being effective for this type of analysis. In short, the proposed sensor developed (SPEC), in addition to having a low manufacturing cost, demonstrates viability as an alternative for the determination of catechol in real samples, such as water.

Author Contributions

S.P.d.O. developed and applied the methodology and wrote the manuscript. T.C.d.O.C., D.N.d.S. and A.C.P. contributed to the development of the entire analytical method and also contributed to writing the manuscript. All authors have read and agreed to the published version of the manuscript.

Funding

This research received no external funding.

Data Availability Statement

Data are contained within the article.

Acknowledgments

Fundação de Amparo à Pesquisa do Estado de Minas Gerais (FAPEMIG), Conselho Nacional de Desenvolvimento Científico e Tecnológico (CNPq), Coordenação de Aperfeiçoamento de Pessoal de Nível Superior (CAPES) and INCT-DATREM.

Conflicts of Interest

The authors declare no conflicts of interest.

References

  1. Nikhil, S.; Karthika, A.; Suresh, P.; Suganthi, A.; Rajarajan, M. A selective and sensitive electrochemical determination of catechol based on reduced graphene oxide decorated β-cyclodextrin nanosheet modified glassy carbon electrode. Adv. Powder Technol. 2021, 32, 2148–2159. [Google Scholar] [CrossRef]
  2. Harshitha, B.T.; Manjunatha, J.G.; Pushpanjali, P.A.; Karthik, C.S.; Sandeep, S.; Mallu, P.; D’Souza, E.; Sreeharsha, N.; Asdaq, S.M.B.; Anwer, M.K. Efficient Electrochemical Determination of Catechol with Hydroquinone at Poly (L-Serine) Layered Carbon Paste Electrode. Chem. Sel. 2021, 6, 6764. [Google Scholar] [CrossRef]
  3. Suvina, V.; Kokulnathan, T.; Wang, T.J.; Geetha Balakrishna, R. Lanthanum cobaltite supported in graphene nanosheets for non-enzymatic electrochemical determination of catechol. Microchim Acta 2020, 187, 189. [Google Scholar] [CrossRef] [PubMed]
  4. Sumanth, G.S.; Swamy, B.K.; Chetankumar, K. Poly DY 11/Zn/CuO modified electrochemical sensor for the detection of catechol and hydroquinone: A voltammetric study. Mater. Chem. Phys. 2023, 296, 127349. [Google Scholar] [CrossRef]
  5. Meskher, H.; Achi, F.; Zouaoui, A.; Ha, S.; Peacock, M.; Belkhalfa, H. Simultaneous and selective electrochemical determination of catechol and hydroquinone on a platinum electrode modified with nickel oxide (NiO) and reduced graphene oxide (rGO). Anal. Lett. 2022, 55, 1466–1481. [Google Scholar] [CrossRef]
  6. Mashhadizadeh, M.H.; Kalantarian, S.M.; Azhdeh, A. A Novel Electrochemical Sensor for Simultaneous Determination of Hydroquinone, Catechol, and Resorcinol Using a Zn-MOF Modified Carbon Paste Electrode, Nitrogen-Doped Graphite and AuNPs. Electroanalysis 2021, 33, 160. [Google Scholar] [CrossRef]
  7. Lupetti, K.O.; Rocha, F.R.P.; Fatibello-Filho, O. An improved flow system for phenols determination exploiting multi commutation and long path length spectrophotometry. Talanta 2004, 62, 463–467. [Google Scholar] [CrossRef]
  8. Ogrizek, M.; Kroflič, A.; Šala, M. Determination of trace concentrations of simple phenols in ambient PM samples. Chemosphere 2022, 303, 135313. [Google Scholar] [CrossRef]
  9. Yao, C.; Zhang, H.; Wang, Z.; Liu, G. Determination of catechol in tea based on the inhibition of CS@Cd composites electrochemiluminescence. Microchem. J. 2024, 198, 110200. [Google Scholar] [CrossRef]
  10. Wang, X.; Wang, X.; Gao, S.; Zheng, Y.; Tang, M.; Chen, B. A solid-state electrochemiluminescence sensing platform for detection of catechol based on novel luminescent composite nanofibers. Talanta 2013, 107, 127–132. [Google Scholar] [CrossRef]
  11. Bagheri, H.; Mohammadi, A.; Salemi, A. On-line trace enrichment of phenolic compounds from water using a pyrrole-based polymer as the solid-phase extraction sorbent coupled with high-performance liquid chromatography. Anal. Chim. Acta 2004, 513, 445–449. [Google Scholar] [CrossRef]
  12. Karim, M.N.; Lee, J.E.; Lee, H.J. Amperometric detection of catechol using tyrosinase modified electrodes enhanced by the layer-by-layer assembly of gold nanocubes and polyelectrolytes. Biosens. Bioelectron. 2014, 61, 147–151. [Google Scholar] [CrossRef] [PubMed]
  13. Boopathy, G.; Keerthi, M.; Chen, S.M.; Umapathy, M.J.; Kumar, B.N. Highly porous nickel molybdate@ graphene oxide nanocomposite for the ultrasensitive electrochemical detection of environmental toxic pollutant catechol. Mater. Chem. Phys. 2020, 239, 121982. [Google Scholar] [CrossRef]
  14. Zhang, Y.; Xiao, S.; Xie, J.; Yang, Z.; Pang, P.; Gao, Y. Simultaneous electrochemical determination of catechol and hydroquinone based on graphene–TiO2 nanocomposite modified glassy carbon electrode. Sens. Actuators B Chem. 2014, 204, 102–108. [Google Scholar] [CrossRef]
  15. Dos Santos, S.M.V.; Oliveira, P.R.; Oliveira, M.C.; Bergamini, M.F.; Marcolino, L.H., Jr. Screen-Printed Electrodes Constructed Using Carbon Black as Conductive Material. Virtual J. Chem. 2017, 9, 626–640. [Google Scholar] [CrossRef]
  16. Lawes, S.; Riese, A.; Sun, Q.; Cheng, N.; Sun, X. Printing Nanostructured Carbon for Energy Storage and Conversion Applications. Carbon 2015, 92, 150–176. [Google Scholar] [CrossRef]
  17. Oliveira, A.E.F.; Pereira, A.C. Development of a Simple and Cheap Conductive Graphite Ink. J. Electrochem. Soc. 2021, 168, 087508. [Google Scholar] [CrossRef]
  18. Oliveira, A.E.F.; Pereira, A.C.; Ferreira, L.F. Fabrication of Low-cost Screen-printed Electrode in Paper Using Conductive Inks of Graphite and Silver/Silver Chloride. Electroanalysis 2023, 35, e202200093. [Google Scholar] [CrossRef]
  19. Fonseca, W.T.; Castro, K.R.; Oliveira, T.R.; Faria, R.C. Disposable and Flexible Electrochemical Paper-based Analytical Devices Using Low-cost Conductive Ink. Electroanalysis 2021, 33, 1520–1527. [Google Scholar] [CrossRef]
  20. Oliveira, A.E.F.; Pereira, A.C.; Resende, M.A.C.; Ferreira, L.F. Fabrication of a Simple and Cheap Screen-printed Silver/Silver Chloride (Ag/AgCl) Quasi-reference Electrode. Electroanalysis 2022, 34, 809–819. [Google Scholar] [CrossRef]
  21. Cândido, T.C.O.; Pereira, A.C.; Silva, D.N. Development and Characterization of Conductive Ink Composed of Graphite and Carbon Black for Application in Printed Electrodes. Analytica 2023, 4, 513–526. [Google Scholar] [CrossRef]
  22. Das Neves, M.F.F.; Damasceno, J.P.V.; Junior, O.D.L.; Zarbin, A.J.G.; Roman, L.S. Conductive ink based on PEDOT nanoparticles dispersed in water without organic solvents, passivant agents or metallic residues. Synth. Met. 2021, 272, 116657. [Google Scholar] [CrossRef]
  23. Wiklund, J.; Karakoç, A.; Palko, T.; Yiğitler, H.; Ruttik, K.; Jäntti, R.; Paltakari, J. A Review on Printed Electronics: Fabrication Methods, Inks, Substrates, Applications and Environmental Impacts. J. Manuf. Mater. Process. 2021, 5, 89. [Google Scholar] [CrossRef]
  24. Pérez-Fernández, B.; Costa-García, A.; Muñiz, A.D.L.E. Electrochemical (bio) sensors for pesticides detection using screen-printed electrodes. Biosensors 2020, 10, 32. [Google Scholar] [CrossRef] [PubMed]
  25. De Freitas, R.C.; Fonseca, W.T.; Azzi, D.C.; Raymundo-Pereira, P.A.; Oliveira, O.N.; Janegitz, B.C. Flexible electrochemical sensor printed with conductive ink made with craft glue and graphite to detect drugs and neurotransmitters. Microchem. J. 2023, 191, 108823. [Google Scholar] [CrossRef]
  26. Orzari, L.O.; Silva, L.R.G.e.; de Freitas, R.C.; Brazaca, L.C.; Janegitz, B.C. Lab-made disposable screen-printed electrochemical sensors and immunosensors modified with Pd nanoparticles for Parkinson’s disease diagnostics. Microchim. Acta 2024, 191, 189. [Google Scholar] [CrossRef] [PubMed]
  27. Yang, J.; Mullick, G.; He, S.; Nag, A.; Deng, S.; Afsarimanesh, N.; Gao, J. Graphene allotropes-based electrochemical sensors to detect catechol molecules. Sens. Actuators A Phys. 2024, 368, 115088. [Google Scholar] [CrossRef]
  28. Zhang, Y.; Li, X.; Li, D.; Wei, Q. A laccase based biosensor on AuNPs-MoS2 modified glassy carbon electrode for catechol detection. Colloids Surf. B Biointerfaces 2020, 186, 110683. [Google Scholar] [CrossRef] [PubMed]
  29. Saha, R.; Mukhopadhyay, M. Electrochemical analysis of Catechol polymerization in presence of Trametes versicolor laccase and the mediator ABTS. Enzym. Microb. Technol. 2021, 152, 109934. [Google Scholar] [CrossRef]
  30. Yasa, M.; Deniz, A.; Forough, M.; Yildirim, E.; Persil Cetinkol, O.; Udum, Y.A.; Toppare, L. Construction of amperometric biosensor modified with conducting polymer/carbon dots for the analysis of catechol. J. Polym. Sci. 2020, 58, 3336–3348. [Google Scholar] [CrossRef]
  31. Malinowski, S.; Wardak, C.; Jaroszyńska-Wolińska, J.; Herbert, P.A.F.; Pietrzak, K. New electrochemical laccase-based biosensor for dihydroxybenzene isomers determination in real water samples. J. Water Process Eng. 2020, 34, 101150. [Google Scholar] [CrossRef]
  32. Romero, A.; Lavin-Lopez, M.P.; Sanchez-Silva, L.; Valverde, J.L.; Paton-Carrero, A. Comparative study of different scalable routes to synthesize graphene oxide and reduced graphene oxide. Mater. Chem. Phys. 2018, 203, 284–292. [Google Scholar] [CrossRef]
  33. Pinto, S.D.S.; Rezende, M.C. Application of poly(o-methoxyaniline) and its carbon black composites in microwave absorbers. Polímeros 2012, 22, 325–331. [Google Scholar] [CrossRef]
  34. Montês, V. Development and Optimization of Printed Electrochemical Sensors. Master’s Thesis, Department of Chemistry and Biochemistry, University of Porto, Porto, Portugal, 2015. [Google Scholar]
  35. Souza, D.; Machado, S.A.S.; Avaca, L.A. Square wave voltammetry. Part I: Theoretical aspects. Quim. Nova 2003, 26, 81–89. [Google Scholar] [CrossRef]
  36. Manoj, D.; Gnanasekaran, L.; Rajendran, S.; Jalil, A.A.; Siddiqui, M.N.; Gracia, F.; Soto-Moscoso, M. A mechanothermal approach for the synthesis of Fe3O4 nanoparticles as dopant on mesoporous TiO2 for electrochemical determination of catechol. Environ. Res. 2023, 222, 115358. [Google Scholar] [CrossRef] [PubMed]
  37. Gil, E.S.; Muller, L.; Santiago, M.F.; Garcia, T.A. Biosensor based on crude laccase extract (Pycnoporus sanguineus) for environmental analysis of phenolic compounds. J. Port. Soc. Electrochem. 2009, 27, 215–225. [Google Scholar] [CrossRef]
  38. Gao, Z.-Y.; Gao, Y.-L.; Wang, E.; Xu, S.; Chen, W. Electrochemical determination of catechol based on cadmium telluride quantum dots/graphene composite film modified electrode. J. Electrochem. Soc. 2016, 163, H528–H533. [Google Scholar] [CrossRef]
  39. Orzari, L.O.; Andreotti, I.A.d.A.; Bergamini, M.F.; Junior, L.H.M.; Janegitz, B.C. Disposable electrode obtained by pencil drawing on corrugated fiberboard substrate. Sens. Actuators B Chem. 2018, 264, 20–26. [Google Scholar] [CrossRef]
Figure 1. Illustration of the conductive ink preparation process using carbon black, graphite, nail polish, and acetone.
Analytica 05 00016 g001
Figure 2. Illustration of the screen-printed electrode manufacturing process.
Analytica 05 00016 g002
Scheme 1. Proposed reaction for the electrochemical oxidation and reduction of catechol [2,3].
Analytica 05 00016 sch001
Figure 3. Values of current variation and cathodic peak potential as a function of the pH of the buffer solution. Reaction medium 15.0 μmol L−1 of catechol in acetate buffer solution (0.2 mol L−1).
Analytica 05 00016 g003
Figure 4. Values of current variation as a function of the concentration of the buffer solution. Reaction medium 15.0 μmol L−1 of catechol in acetate buffer solution at pH 5.0.
Analytica 05 00016 g004
Figure 5. Electrochemical behavior using different mass percentages of the proportion between graphite and carbon black in 0.2 mol L−1 of acetate buffer solution (pH 5.0) with 15.0 μmol L−1 of catechol.
Analytica 05 00016 g005
Figure 6. Electrochemical behavior using different mass percentages of the proportions between carbonaceous material and nail polish in 0.2 mol L−1 of acetate buffer solution (pH 5.0) with 15.0 μmol L−1 of catechol.
Analytica 05 00016 g006
Figure 7. Electron micrographs for (A) graphite; (B) carbon black; (C) composite ink containing graphite, carbon black, and nail polish. 1000× magnitude.
Analytica 05 00016 g007
Figure 8. (A) Cyclic voltammograms referring to each design. (B) Printed electrode designs. Reaction medium 15.0 μmol L−1 of catechol in 0.2 mol L−1 acetate buffer solution (pH 5.0).
Analytica 05 00016 g008
Figure 9. (A) Square wave voltammograms for different concentrations of catechol; (B) analytical curve. Reaction medium in 0.2 mol L−1 acetate buffer solution (pH 5.0).
Analytica 05 00016 g009
Figure 10. (A) Square wave voltammograms in the presence of possible catechol interferers. (B) Variation values of cathodic peak current presented in each voltammogram. Reaction medium 100.0 μmol L−1 of catechol in 0.2 mol L−1 acetate buffer solution (pH 5.0).
Analytica 05 00016 g010
Table 1. Optimization of operational parameters of DPV and SWV techniques.
TechniqueDPVSWV
Evaluated ParametersEvaluated RangeOptimized ValueEvaluated RangeOptimized Value
scan rate (mV/s)4–3010--
amplitude (mV)5–120805–120100
frequency (Hz)--5–6040
sensitivity
(μA L μmol−1)
0.130.31
Table 2. Comparison of the analytical performance proposed by the SPEC with other electrochemical sensors for the determination of catechol.
Proposed SensorTechniqueLinear Range (μmol L−1)LOD (μmol L−1)Reference
Fe3O4–TiO2/GC aCV100–50045.00[36]
PCL bDPV20–7004.50[37]
CdTe QDs/GR/GCE cDPV30–100018.28[38]
disposable electrode PD-CFB dLSV e50–110010.00[39]
SPECSWV20–2205.96This work
a mesoporous structure of Fe3O4–TiO2 decorated on a glassy carbon (GC) electrode; b carbon paste biosensor modified with crude laccase extract; c glassy carbon electrode (GCE) modified with cadmium telluride quantum dots (CdTe QDs)/graphene (GR); d disposable graphite electrode drawn with an ordinary pencil on a corrugated fiberboard substrate (PD-CFB); e linear sweep voltammetry.
Table 3. Determination of catechol in tap water samples.
Added Concentration (μmol L−1)Concentration Detected (μmol L−1)Recovery (%)
0.000.00-
70.0068.0097.95
150.00150.30100.17
Disclaimer/Publisher’s Note: The statements, opinions and data contained in all publications are solely those of the individual author(s) and contributor(s) and not of MDPI and/or the editor(s). MDPI and/or the editor(s) disclaim responsibility for any injury to people or property resulting from any ideas, methods, instructions or products referred to in the content.

