Article

Analysis of Aceclofenac, Ketorolac, and Sulindac in Human Urine Using the Microemulsion Electrokinetic Chromatography Method

1
Department of Chemistry, Faculty of Mathematics and Natural Science, Jenderal Soedirman University, UNSOED, Purwokerto 53123, Central Java, Indonesia
2
Department of Chemistry, Faculty of Science, Universiti Teknologi Malaysia, UTM, Johor Bahru 81310, Johor, Malaysia
3
Centre for Sustainable Nanomaterials, Ibnu Sina Institute for Scientific and Industrial Research, Universiti Teknologi Malaysia, UTM, Johor Bahru 81310, Johor, Malaysia
4
Research Center for Polymer Technology, National Research and Innovation Agency (BRIN), KST BJ. Habibie, Puspiptek Building 460, Tangerang Selatan 15314, Banten, Indonesia
*
Author to whom correspondence should be addressed.
Analytica 2024, 5(3), 431-439; https://doi.org/10.3390/analytica5030028
Submission received: 6 August 2024 / Revised: 29 August 2024 / Accepted: 30 August 2024 / Published: 3 September 2024
(This article belongs to the Section Chromatography)

Abstract

:
A method to determine aceclofenac, ketorolac, and sulindac in human urine samples using microemulsion electrokinetic chromatography (MEEKC) has been developed in this study. The optimization of MEEKC conditions was carried out by changing the microemulsion compositions including the buffer pH, borate salt concentration, surfactant concentration, co-surfactant concentration, organic modifier concentration, and oil droplet concentration. The optimum separation of selected drugs was obtained with a composition of microemulsion containing 10 mM borate buffer pH 9, 0.5% sodium dodecyl sulphate (SDS), 6.6% n-butanol, 6.0% acetonitrile, and 0.8% ethyl acetate. Excellent linearity was obtained in the range concentration of 25 to 200 ppm with r2 > 0.999. Limits of detection (LOD, S/N = 3) and limits of quantification (LOQ, S/N = 10) were 2.72 to 4.75 and 9.08 to 15.85 ppm, respectively. The solid-phase extraction (SPE) method using C-18 as an adsorbent and the solid phase micro-tip extraction (SPMTE) method using multiwalled carbon nanotubes (MWCNTs) as an adsorbent were used to clean-up and pre-concentrate the urine samples prior to the MEEKC analysis. The best recoveries of the selected drugs in the spiked urine sample were 91 to 103% with RSD of 1.26 to 4.03% (n = 3) using the SPE-MEEKC method.

1. Introduction

The COVID-19 pandemic has increased the demand for pharmaceuticals, such as non-steroidal anti-inflammatory drugs (NSAIDs). These drugs have been employed to treat COVID-19-associated fever, pain, and inflammation symptoms [1,2]. The analysis of NSAIDs in biological samples such as urine and plasma can be used to monitor the level of the ingestion of the drugs. Several analytical methods for the determination of NSAIDs have been reported, including gas chromatography [3], liquid chromatography [4,5], and capillary electrophoresis (CE) [6,7,8] methods. The advantages of CE for drugs analysis compared to chromatographic techniques include high separation power, low sample consumption, and less organic solvent [9,10].
Microemulsion electrokinetic chromatography (MEEKC), a mode of the CE method, has been demonstrated to have a reliable separation of both neutral and charged analytes. It involves microemulsion where water and oil were mixed, providing a larger partitioning area of the neutral and charged analytes compared to micelles. Commonly, microemulsion in MEEKC is composed of a surfactant, co-surfactant, organic modifier, and immiscible nanometer oil droplet in a buffer solution [11,12,13,14,15].
Biological samples, such as urine and plasma, often acquire a clean-up method that provides high selectivity and the usage of small-volume samples. The extraction methods for NSAIDs have been performed using liquid–liquid extraction (LLE) and solid phase extraction (SPE) on various biological and water samples [3,4,5,6,16]. Solid phase membrane tip extraction (SPMTE) was used as a sample preparation method [17,18,19]. SPMTE could reduce the extraction time and solvent usage. Multiwalled carbon nanotubes (MWCNTs) have been used as the adsorbent in SPMTE to determine triazine herbicides prior to micro-liquid chromatography [17]. MWCNTs were selected as adsorbents in this research due to their thermal stability and unique electrical properties. This extraction method was proven to give comparable LODs to the commercial SPE [17]. Mesoporous crystalline material-41 (MCM-41) was also used as an adsorbent in SPMTE for NSAIDs analysis, namely diclofenac, ketoprofen, naproxen, and mefenamic acid, in urine samples. This method has showed excellent recovery, repeatability, and reproducibility [18].
The present study developed and optimized the MEEKC method for the simultaneous determination of three NSAIDs, aceclofenac, ketorolac, and sulindac (Figure 1), in human urine samples. NSAIDs are acidic compounds with pKa values in the range of 3–6, and exist in the anionic form in a medium with pH > 7. As of the writing of this manuscript, publications on the analysis of these three drugs using SPE-MEEKC and SPMTE-MEEKC methods range from limited to none. Several parameters in the microemulsion background electrolyte (BGE), and also CE conditions, have been optimized in this research. The optimized MEEKC combined with SPE using C-18 as an adsorbent and SPMTE using MWCNTs as an adsorbent were then applied to determine the selected drugs in human urine samples. A comparison between the SPE-MEEKC and the SPMTE-MEEKC in terms of recoveries of the selected drugs is presented.

2. Materials and Methods

2.1. Materials

The analytes obtained from Sigma Aldrich (St. Louis, MO, USA) were aceclofenac, ketorolac, and sulindac. Sodium dodecyl sulphate (SDS) was obtained from Fischer Chemicals (Loughborough, Leics, UK), the SPE cartridge (LiChrolut® RP-18 sorbent, 500 mg) was from Merck (Darmstadt, Germany), and multiwalled carbon nanotubes (MWCNTs) were purchased from Sun Nanotech (Nanchang, China). The polypropylene (PP) sheet (157 µm thickness; 0.2 µm pore size) was obtained from Membrana (Wuppertal, Germany), and purified water (18 MΩ cm) was collected from Millipore Water Purification System (Molsheim, France). All organic solvents were HPLC grade. Stock solutions of individual NSAIDs (2000 ppm in acetonitrile) were stored in the refrigerator at 5 °C. Final dilutions were prepared by diluting the stock solution with acetonitrile. All of the reagents and materials were used as purchased, without prior modifications.

2.2. Methods

2.2.1. Buffer and Microemulsion Preparation

Borate buffer was prepared by dissolving appropriate amounts of sodium tetraborate anhydrous using purified water, and the pH solution was adjusted using boric acid or NaOH solution (the changes in borate concentration due to the addition of boric acid are negligible in this experiment). The microemulsions (oil-in-water, O/W) were prepared by weighing the right amounts of SDS, n-butanol, acetonitrile, and ethyl acetate in borate buffer solution (w/v) and then sonicating them for 30 min until they became homogenous. The MEEKC conditions were optimized in this research, whereas the initial MEEKC conditions (microemulsion content and CE condition) were adapted from the previous study [19].

2.2.2. CE Instrumentation

A CE instrument from Agilent HP3D System (Agilent Technologies, Wald-Bronn, Germany) equipped with photo-diode array detector and a temperature control was used. An untreated fused-silica capillary (50 µm i.d., 375 µm o.d., and 54.5 cm of total length, 23 cm of effective length) was used for all of the separation process. The conditioning of a new capillary was performed by subsequently rinsing with 1 M NaOH solution for 10 min, with purified water for 30 min, and finally with microemulsion BGE solution for 15 min. Between runs, the capillary was rinsed with 0.1 M NaOH solution for 3 min, purified water for 3 min, and BGE for 3 min. Sample injection was performed hydrodynamically at 50 mbar for 7 s, and UV detection was 200 nm. The applied voltage and temperature were optimized in this research.

2.2.3. Sample Collection and Pretreatment

Human urine samples were obtained from a drug-free healthy volunteer and performed in accordance with the approval from the Research Ethics Committee of our institution. The urine samples were diluted to 1:1 (v/v) with purified water, and the pH sample was adjusted to 2 with 0.1 M hydrochloric acid solution to facilitate the extraction process by increasing the solubility of the NSAIDs. The spiked urine samples were prepared with spiking analytes at 1 ppm, and then the pH solution was adjusted.

2.2.4. Solid Phase Extraction (SPE)

This SPE procedure was slightly modified from a previous study [20]. SPE C-18 cartridge was preconditioned with a series of 6 mL of solvents, including hexane, acetone, and acidified purified water (pH 2) at 2 mL/min flow rate. Hexane was used to remove non-polar impurities, while acetone was used to remove polar impurities. The acidified water (pH 2) prepared the stationary phase to capture the acidic analytes. After preconditioning, a 10 mL acidified urine sample (pH 2) spiked at 1 ppm of each selected drug was loaded onto the cartridge at a 2 mL/min flow rate. The retained analytes were sequentially eluted with acetone (1 mL), methanol (2 mL), and then with acetone (2 mL). The eluted analytes were concentrated by evaporating the solvent using a gentle flow of nitrogen gas to dryness. It was reconstituted with 200 µL of acetonitrile.

2.2.5. Solid Phase Membrane Tip Extraction (SPMTE)

The preparation of the SPMTE device and the extraction procedure was similar to that of a previous experiment [17]. The extraction of selected NSAIDs from samples was performed using SPMTE with MWCNTs as a sorbent, isopropanol as a conditioning solvent, 10 mL of sample volume, 30 min of extraction time, 15 min of desorption time, sample pH 2, and 2.5% NaCl as salt addition concentration. The solid phase membrane tip was inserted into both the blank and spiked urine samples. Finally, the extracted NSAIDs were then desorbed with a 200 µL acetonitrile using ultrasonication.

3. Results and Discussion

3.1. Optimization of the MEEKC

3.1.1. Borate Buffer pH

The effect of the buffer pH was first explored with a pH ranging from 7 to 10. Table 1 shows the results for the effect of the buffer pH on the peak area, resolution, and plate number of the analytes. Based on the results, the resolution of three analytes were greater than 1.50 for all of the buffer pHs. The best separation efficiencies for all of the analytes (N > 69,000) were obtained at buffer pH 9. This buffer pH was selected as the optimal pH and was employed in all subsequent investigations.

3.1.2. Borate Concentration

Borate concentrations were also evaluated from 2.5 mM to 12.5 mM. Table 2 shows the results for the effect of borate concentrations on the resolution, separation efficiency, and peak area. From this experiment, the resolution of three analytes was greater than 1.50 for all of the borate concentrations. An amount of 10 mM of borate was chosen as the optimal borate concentration since it resulted in the highest peak area with good resolution and separation efficiency. This borate concentration was employed in all subsequent investigations.

3.1.3. Surfactant Concentration

In this study, SDS was used as surfactant, varying from 0.25% to 1.25% (w/v). As illustrated in Table 3, the resolution of three analytes were greater than 1.50 for all of the SDS concentrations. A 0.5% SDS was chosen as the optimal SDS concentration, since it resulted in a better separation efficiency than 1.00% and 1.25% SDS, with peak area greater than 0.25% SDS. This SDS concentration was used in all subsequent investigations.

3.1.4. Co-Surfactant Concentration

The n-butanol was used as the co-surfactant in this research. A series of n-butanol concentrations ranging from 3.3% to 13.2% (w/v) were investigated. As shown in Figure S1, the baseline resolution of three analytes (Rs > 1.50) was obtained using 3.3% and 6.6% n-butanol. In addition, a poor resolution was observed using 9.9% n-butanol (Rs < 1.50 between aceclofenac and ketorolac) and using 13.2% n-butanol (Rs < 1.0 between aceclofenac and sulindac). A 6.6% n-butanol was chosen as the optimal concentration, since it rendered a better resolution than 3.3% n-butanol. This concentration was employed in all subsequent investigations.

3.1.5. Organic Modifier Concentration

Acetonitrile was used as the organic modifier in this study, ranging from 3.0% to 12.0% (w/v). As presented in Figure S2, the baseline resolution of three analytes (Rs > 1.50) was obtained using 6% acetonitrile. Poor resolutions (Rs < 1.50) between aceclofenac and ketorolac were observed using 9% and 12% acetonitrile. At 3% acetonitrile, no peaks were observed in the electropherogram. Therefore, a 6% acetonitrile was selected as the optimal concentration and was employed in the further experiment.

3.1.6. Oil Droplet Concentration

The ethyl acetate was used as the oil droplet in this research. The effects of different ethyl acetate concentrations (0.2% to 0.8% w/v) were then explored in this experiment. The baseline resolution of three analytes (Rs > 1.50) was obtained using 0.2%, 0.4%, and 0.8% ethyl acetate. Further increment of ethyl acetate concentration would reduce the peak resolution of three analytes. A 0.8% ethyl acetate was selected as the optimal condition, since it gave the shorter analysis time (Figure S3). This concentration was employed in all subsequent investigations.

3.1.7. Temperature

The effect of temperature on the separation of three selected drugs was evaluated in this study from 20 °C to 30 °C. The baseline resolution of three analytes (Rs > 1.50) was obtained using all the separation temperatures (see Table 4). A 25 °C was selected as the optimal separation temperature since it gave the highest peak area of three analytes.

3.1.8. Applied Voltage

The effect of applied voltage on the separation of three selected drugs was also investigated in this study from 20 kV to 30 kV. The baseline resolution of three analytes (Rs > 1.50) was obtained using all of the applied voltages. At 30 kV, the migration time of the analytes was less than 8 min (see Figure S4). From this experiment, 30 kV was selected as the optimal applied voltage, since it gave the shorter analysis time.

3.2. Analytical Performance of the MEEKC Method

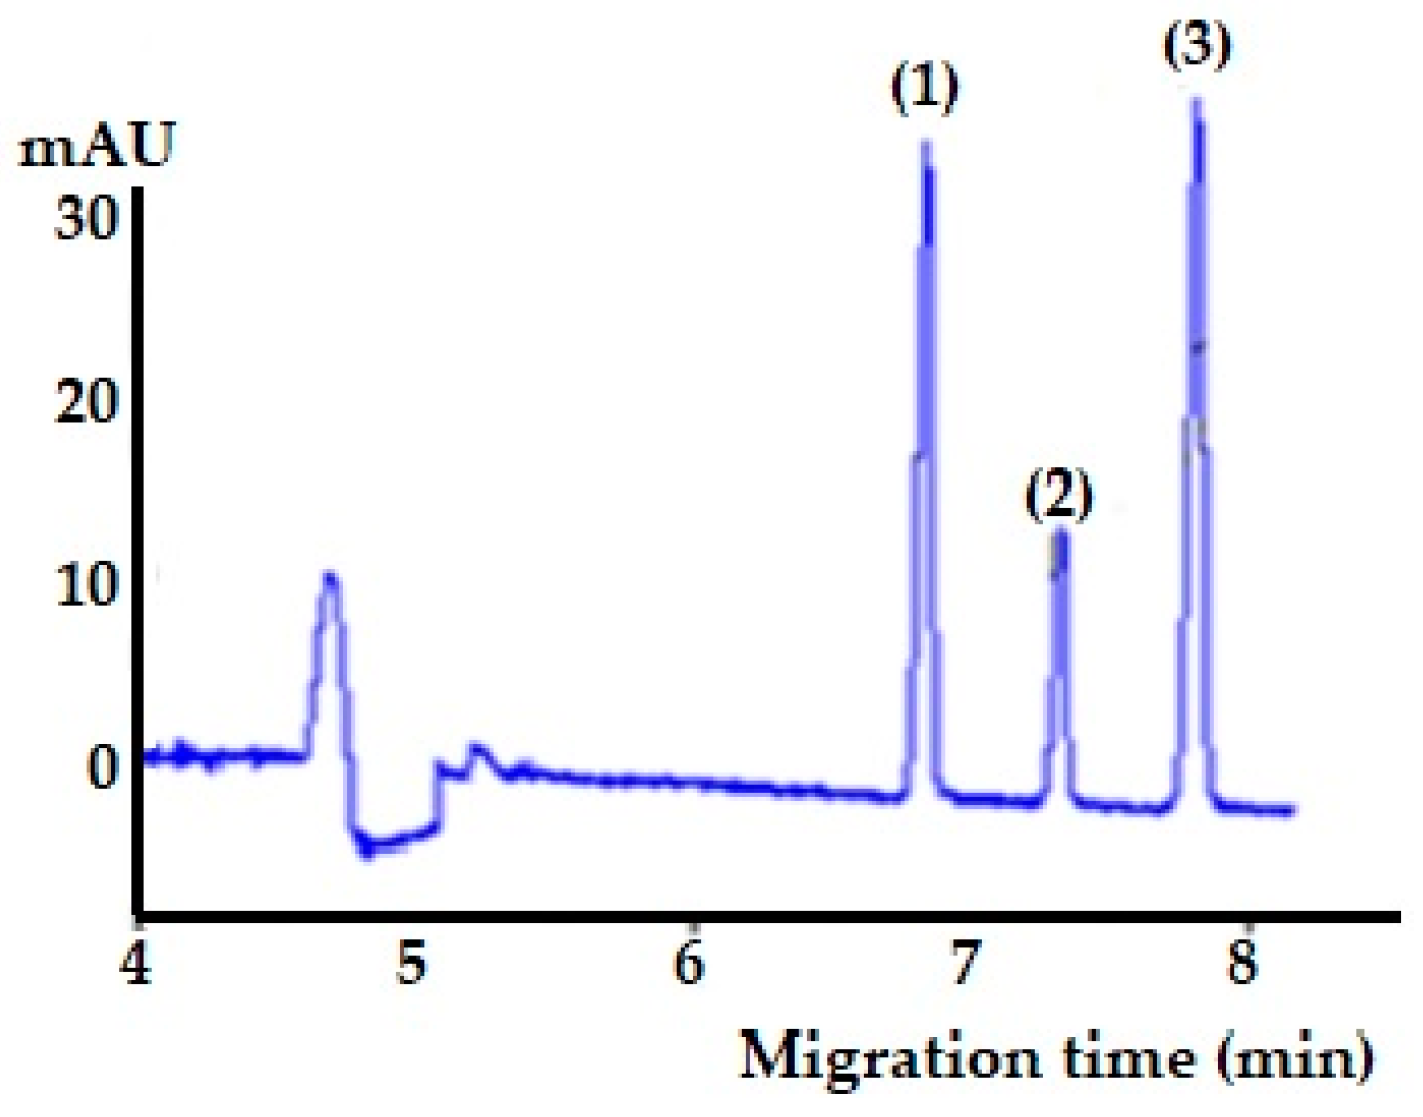
A typical electropherogram of the NSAIDs in the optimized MEEKC method is presented in Figure 2. Migration order of the analytes is sulindac (peak 1), ketorolac (peak 2), and aceclofenac (peak 3). The analytical performance of the optimized MEEKC method is shown in Table 5. Good repeatability in the migration time and peak area was obtained, ranging from 0.70 to 1.65% and 2.03 to 2.30%, respectively. All calibration curves were linear for all of the NSAIDs over the concentration range of 25 to 200 ppm of standards with r2 higher than 0.999. The LOD (S/N = 3) and LOQ (S/N = 10) of the three analytes ranged from 2.72 to 4.75 ppm and 9.08 to 15.85 ppm, respectively.

3.3. Analysis of Urine Samples

To validate the optimized MEEKC method, the SPE using C-18 as an adsorbent was first applied for the analysis of three drugs in the blank and spiked urine samples prior to the MEEKC method. A typical electropherogram of blank and spiked urine samples using the SPE-MEEKC method are presented in Figure 3a. The recoveries of selected NSAIDs were calculated with the calibration graph of NSAIDs standards with known concentrations (see Table S1). From this experiment, excellent recoveries of NSAIDs in spiked urine samples ranged from 91 to 103% with RSD between 1.26 and 4.03%, as presented in Table 6.
In addition, the SPMTE using MWCNTs as an adsorbent was also applied and compared with the SPE method for the analysis of three drugs in the blank and spiked urine samples prior to the MEEKC method. Recoveries of selected NSAIDs from human urine samples were also calculated with the calibration graph of NSAIDs standards with known concentrations (see Table S1). A typical electropherogram of blank and spiked urine samples using SPMTE-MEEKC is shown in Figure 3b. From this experiment, recoveries of three drugs in the spiked urine samples using SPMTE-MEEKC were good for all analytes, ranging from 87% to 96% with RSD between 2.04% and 5.80% (see Table 6).
Simultaneous separation of the selected NSAIDs has been successfully achieved by the optimized MEEKC with resolutions greater than 2.0 for all of the analytes and with a migration time within 8 min. The migration time of sulindac in this result (less than 7 min) was faster than that of a previous study (greater than 9 min) [7]. The optimized MEEKC combined with SPE using C-18 as an adsorbent and SPMTE using MWCNTs as an adsorbent has been successfully applied to determine the selected drugs in the spiked human urine samples. Results showed that the SPE method gave better recoveries compared to the SPMTE method. However, the SPMTE method offers lower solvent and adsorbent consumptions than the SPE method. The SPMTE has a less-organic solvent (about 400 times lower than SPE) and a less-adsorbent mass (about 170 times lower than SPE) usage. It can reduce costs and function in environmentally friendly way. Overall, the SPMTE-MEEKC method has been demonstrated to be a promising alternative for the analysis of selected NSAIDs in biological samples.

4. Conclusions

The presented method is a proper eco-friendly alternative analysis which can be used to determine NSAIDs in human urine samples. It requires only a small amount of samples and reagents instead of hazardous organic solvents. The method was validated using SPE using C-18 as an adsorbent and SPMTE using MWCNTs as an adsorbent. The results show excellent recoveries (79–103%) for all of the analytes in the spiked urine samples.

Supplementary Materials

The following supporting information can be downloaded at: https://www.mdpi.com/article/10.3390/analytica5030028/s1, Figure S1: Electropherogram of the n-butanol concentration optimization; Figure S2: Electropherogram of the acetonitrile concentration optimization; Figure S3: Effect of ethyl acetate concentration on migration time; Figure S4: Effect of applied voltage on migration time; Table S1: Calibration curves of NSAIDs standards by the SPE-MEEKC and SPMTE-MEEKC methods.

Author Contributions

Conceptualization, D.H. and W.A.W.I.; methodology, D.H. and I.M.Y.; formal analysis, D.H. and I.M.Y.; investigation, I.M.Y.; resources, W.A.W.I. and A.S.A.K.; data curation, I.M.Y. and C.; writing—original draft preparation, D.H. and C.; writing—review and editing, A.R. and J.A.L.; supervision, D.H. and W.A.W.I.; project administration, C.; funding acquisition, D.H. All authors have read and agreed to the published version of the manuscript.

Funding

This research was supported by the Ministry of Education, Culture, Research, and Technology and Universitas Jenderal Soedirman, Indonesia through the World Class Research (WCR) Grants 2023.

Data Availability Statement

Data available on request from the authors.

Acknowledgments

The authors thank Kemendikbudristek and Universitas Jenderal Soedirman Indonesia for the financial support through the WCR Grant 2023, and to the Universiti Teknologi Malaysia for the CE instrument usage. The authors also acknowledge Polymer Technology Laboratories, Integrated Laboratories for Agroindustry and Biotechnology (LAPTIAB) Serpong, and E-Layanan Sains (ELSA) of BRIN for the facilities and scientific, and technical support during the Visiting Research Fellow BRIN for DH (No. 86/II/HK/2023).

Conflicts of Interest

The authors declare that they do not have any conflicts of interest.

References

  1. Gwenzi, W.; Selvasembian, R.; Offiong, N.A.O.; Mahmoud, A.E.D.; Sanganyado, E.; Mal, J. COVID-19 drugs in aquatic systems: A review. Environ. Chem. Let. 2022, 20, 1275–1294. [Google Scholar] [CrossRef] [PubMed]
  2. Atkinson, T.J.; Fudin, J. Nonsteroidal antiinflammatory drugs for acute and chronic pain. Phys. Med. Rehabil. Clin. N. Am. 2020, 31, 219–231. [Google Scholar] [CrossRef] [PubMed]
  3. Avino, P.; Notardonato, I.; Passarela, S.; Russo, M.V. Determination of non-steroidal anti-inflammatory drugs in animal urine samples by ultrasound vortex-assisted dispersive liquid–liquid microextraction and gas chromatography coupled to ion trap-mass spectrometry. Appl. Sci. 2020, 10, 5441. [Google Scholar] [CrossRef]
  4. Sandrin, V.S.S.; Oliveira, G.M.; Weckwerth, G.M.; Polanco, N.L.D.H.; Faria, F.A.C.; Santos, C.F. Analysis of different methods of extracting NSAIDs in biological fluid samples for LC-MS/MS assays: Scoping review. Metabolites 2022, 12, 751. [Google Scholar] [CrossRef] [PubMed]
  5. Reinholds, I.; Pugajeva, I.; Zacs, D.; Lundanes, E.; Rusko, J.; Perkons, I.; Bartkevics, V. Determination of acidic non-steroidal anti-inflammatory drugs in aquatic samples by liquid chromatography-triple quadrupole mass spectrometry combined with carbon nanotubes-based solid-phase extraction. Env. Mon. Assess. 2017, 189, 568. [Google Scholar] [CrossRef] [PubMed]
  6. Alatawi, H.; Hogan, A.; Albalawi, I.; Alsefri, S.; Moore, E. Efficient determination of non-steroidal anti-inflammatory drugs by micellar electrokinetic chromatography in wastewater. Anal. Methods 2023, 15, 1402–1409. [Google Scholar] [CrossRef] [PubMed]
  7. Kuo, Y.L.; Liu, W.L.; Hsieh, S.H.; Huang, H.Y. Analyses of non-steroidal anti-inflammatory drugs in environmental water samples with microemulsion electrokinetic chromatography. Anal. Sci. 2010, 26, 703–707. [Google Scholar] [CrossRef] [PubMed]
  8. Semail, N.F.; Abdul Keyon, A.S.; Saad, B.; Kamaruzaman, S.; Zain, N.N.M.; Lim, V.; Miskam, M.; Wan Abdullah, W.N.; Raoov, M.; Yahaya, N. Induced sample via transient isotachophoresis mediated with sweeping in micellar electrokinetic chromatography for the dual-stacking strategy of non-steroidal anti-inflammatory drugs in environmental water samples. J. Chrom. A 2022, 1685, 463616. [Google Scholar] [CrossRef] [PubMed]
  9. Reminek, F.; Foret, F. Capillary electrophoretic methods for quality control analyses of pharmaceuticals: A review. Electrophoresis 2021, 42, 19–37. [Google Scholar] [CrossRef] [PubMed]
  10. Finja, K.; Holger, Z.; Matthias, S.; Ratih, R.; Robert, M.; Mais, O.; Sophie, H.; Christin, S.; Blanca, H.; Lapizco, E.; et al. Strategies for capillary electrophoresis: Method development and validation for pharmaceutical and biological applications Updated and completely revised edition. Electrophoresis 2023, 44, 1279–1341. [Google Scholar] [CrossRef]
  11. Zeid, A.M.; El-Masry, A.A.; El-Wasseef, D.R.; Eid, M.; Shehata, I.A. Green microemulsion electrokinetic chromatographic method for simultaneous determination of azelastine and budesonide. Sust. Chem. Pharm. 2022, 29, 100795. [Google Scholar] [CrossRef]
  12. Yan, T.C.; Zhang, H.H.; Cao, J.; Ye, L.H. Analysis of iodinated amino acids by microemulsion electrokinetic chromatography using aliphatic amine as a cosurfactant. J. Chrom. A 2022, 1685, 463644. [Google Scholar] [CrossRef] [PubMed]
  13. Chang, C.W.; Chen, Y.C.; Liu, C.Y. Separation and on-line preconcentration of nonsteroidal anti-inflammatory drugs by microemulsion electrokinetic chromatography. Electrophoresis 2015, 36, 2745–2753. [Google Scholar] [CrossRef] [PubMed]
  14. Zhen, X.T.; Chen, Y.; Yang, J.; Dong, X.; Zheng, H.; Cao, J. On-line concentration of triazine herbicides in microemulsion electrokinetic chromatography by electrokinetic injection assisted micelle to cyclodextrin stacking. J. Chrom. A 2020, 1628, 461438. [Google Scholar] [CrossRef] [PubMed]
  15. Buchberger, W. Microemulsion electrokinetic chromatography. In Capillary Electrophoresis. Methods and Protocols, 2nd ed.; Schmitt-Kopplin, P., Ed.; Humana: New York, NY, USA, 2016; Volume 1483, pp. 91–109. [Google Scholar] [CrossRef]
  16. Medina, G.S.; Acquaviva, A.; Reta, R. Development of monolithic sorbent cartridges (m-SPE) for the extraction of non-steroidal anti-inflammatory drugs from surface waters and their determination by HPLC. Microchem. J. 2020, 159, 105447. [Google Scholar] [CrossRef]
  17. See, H.H.; Sanagi, M.M.; Wan Ibrahim, W.A.; Naim, A.A. Determination of triazine herbicides using membrane-protected carbon nanotubes solid phase membrane tip extraction prior to micro-liquid chromatography. J. Chrom. A 2010, 1217, 1767–1772. [Google Scholar] [CrossRef] [PubMed]
  18. Kamaruzaman, S.; Sanagi, M.M.; Endud, S.; Wan Ibrahim, W.A.; Yahaya, N. MCM-41 solid phase membrane tip extraction combined with liquid chromatography for the determination of non-steroidal anti-inflammatory drugs in human urine. J. Chrom. B. 2013, 940, 59–65. [Google Scholar] [CrossRef] [PubMed]
  19. Rahim, K.A.; Sanagi, M.M.; Hermawan, D.; Wan Ibrahim, W.A.; Abdul Keyon, A.S. Microemulsion electrokinetic chromatography coupled with dispersive micro-solid phase extraction for determination of isoflavones in soybean products. Malay. J. Anal. Sci. 2018, 22, 54–63. [Google Scholar] [CrossRef]
  20. Paíga, P.; Lolić, A.; Hellebuyck, F.; Santos, L.H.; Correia, M.; Delerue-Matos, C. Development of a SPE–UHPLC–MS/MS methodology for the determination of non-steroidal anti-inflammatory and analgesic pharmaceuticals in seawater. J. Pharm. Biomed. Anal. 2015, 106, 61–70. [Google Scholar] [CrossRef] [PubMed]
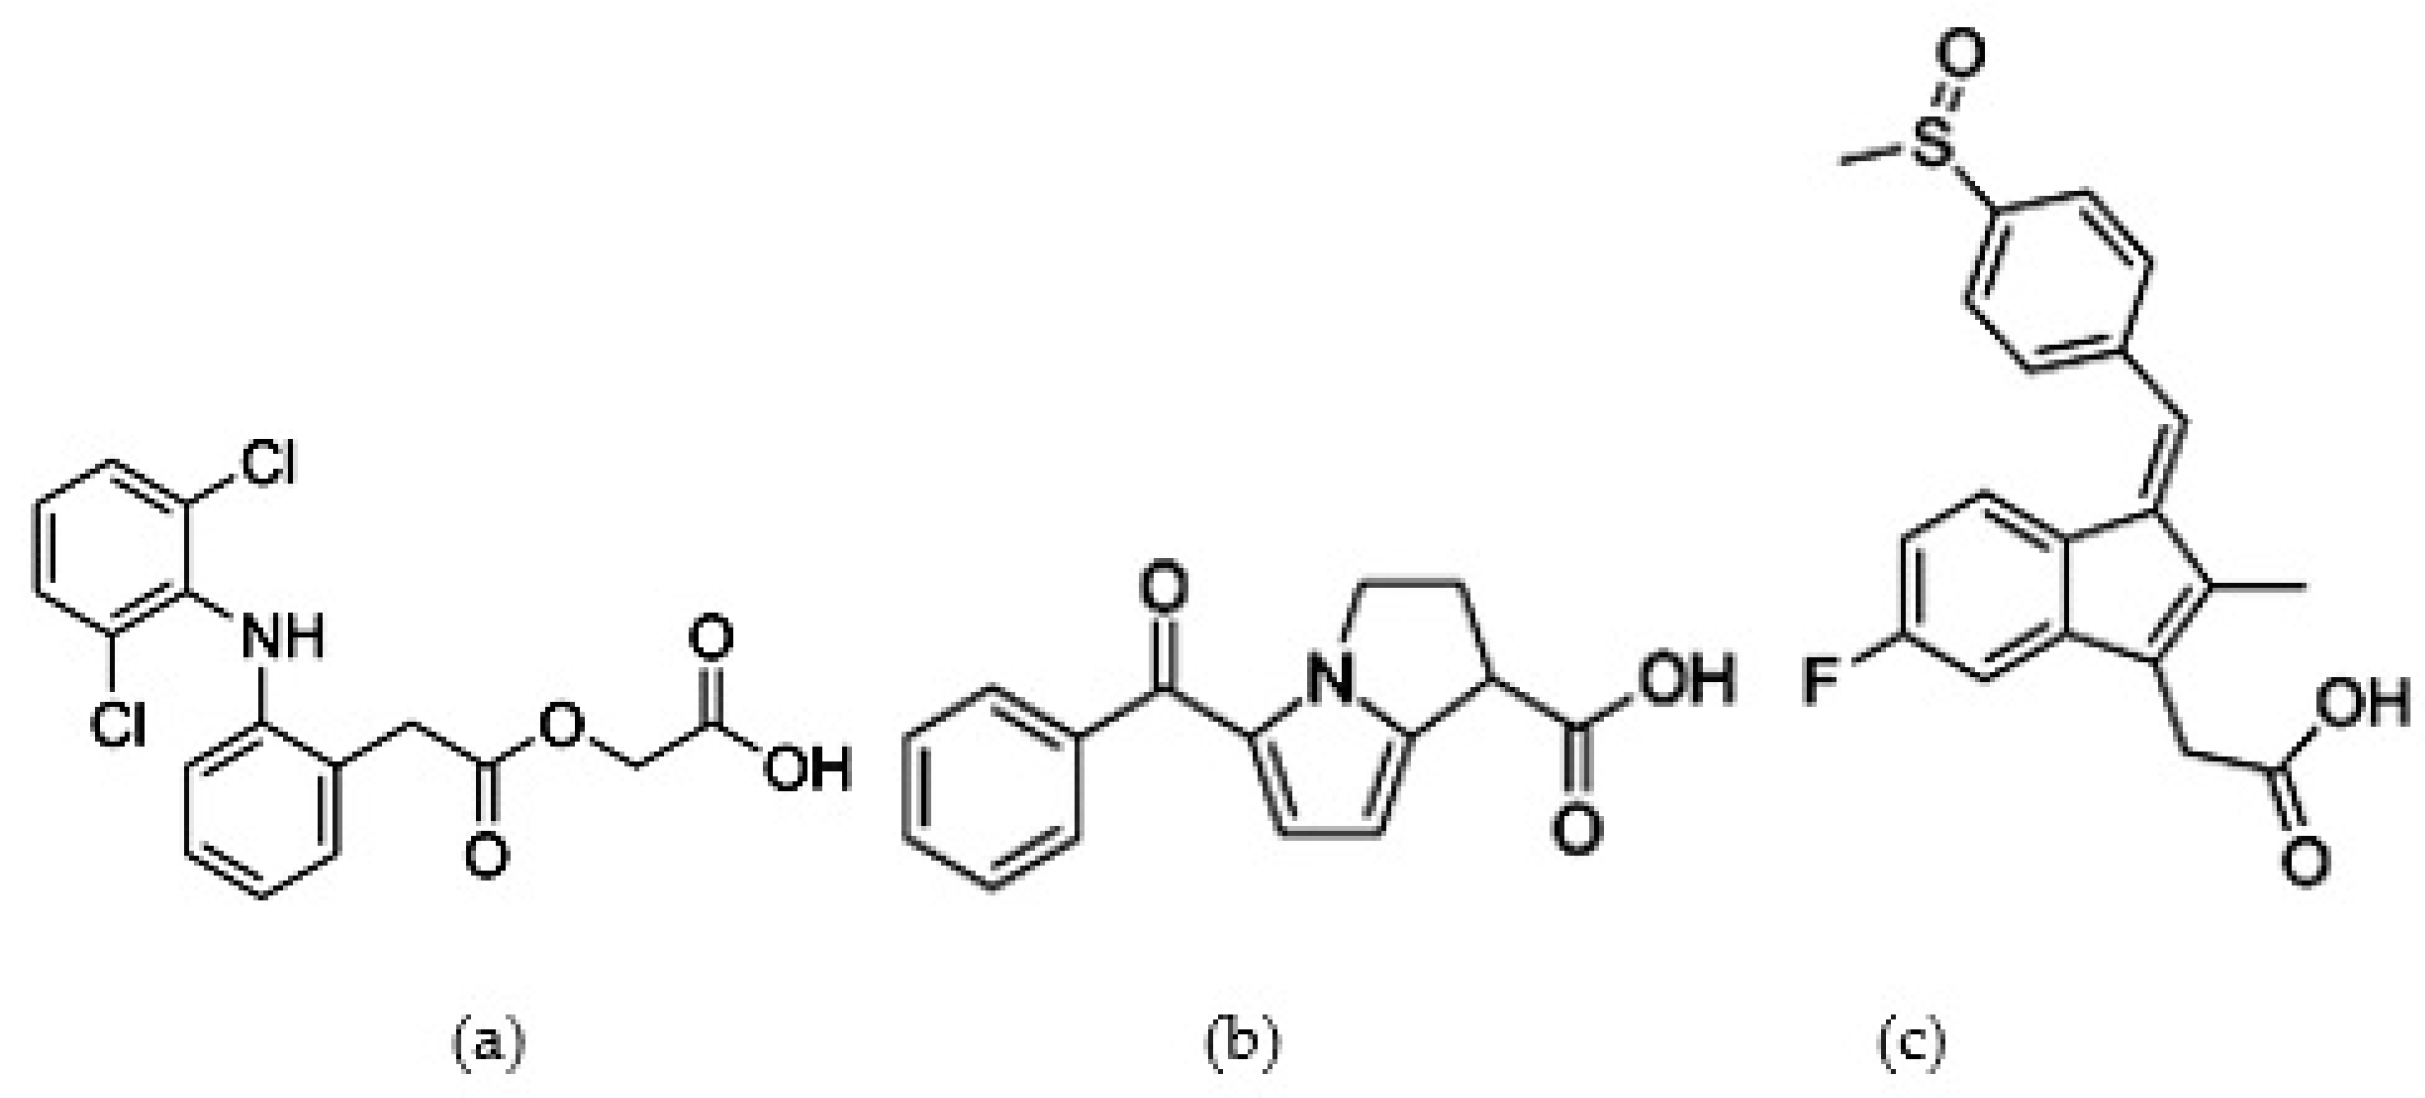
Figure 1. The chemical structures of (a) aceclofenac, (b) ketorolac, and (c) sulindac.
Analytica 05 00028 g001
Figure 2. Typical electropherogram of the selected drugs using the MEEKC method. Microemulsion composition (w/v): 0.5% SDS, 6.6% n-butanol, 6% acetonitrile, 0.8% ethyl acetate in borate buffer (10 mM borate salt, pH 9). CE condition: applied voltage of 30 kV, temperature of 25 °C, UV detection of 200 nm. Peaks identification: (1) sulindac, (2) ketorolac, and (3) aceclofenac (100 ppm of standards).
Analytica 05 00028 g002
Figure 3. Typical electropherogram of blank urine sample and spiked urine sample using the (a) SPE-MEEKC method and (b) SPMTE-MEEKC method. Peak identifications and MEEKC conditions, as in Figure 2. The concentration of analytes in the spiked urine sample was 1 ppm.
Analytica 05 00028 g003
Table 1. Optimization of borate buffer pH.
Peak *Buffer pHPeak Area *Rs **N **
1781.14-33,157
8103.21-44,168
9101.78-88,576
1077.85-55,300
2742.991.5139,996
853.682.0654,699
956.984.4097,422
1061.042.7966,220
37103.906.9025,785
8146.648.9433,289
9137.248.1869,081
10158.7911.1342,349
* Peak identification: (1) sulindac; (2) ketorolac; and (3) aceclofenac. Unit of peak area: (mAU × min). ** The number of theoretical plates (N) and the resolution (Rs) were calculated according to Equations (1) and (2), as follows [6]:
N = 16 (t/w)2
Rs = 2 (t2t1)/(w1 + w2)
where t is the migration time and w is the baseline width of the peak.
Table 2. Optimization of borate concentration *.
PeakBorate Concentration (mM)Peak AreaRsN
12.5103.15470-87,656
7.5106.29944-73,044
10.0117.34855-64,902
12.5112.99209-58,637
22.555.110033.7496,642
7.560.555863.2381,250
10.065.753393.2272,622
12.561.115773.3070,557
3 2.5136.203819.8668,994
7.5149.408669.9555,371
10.0157.868759.3545,543
12.5150.254408.4044,674
* Peak identification and notation, as in Table 1.
Table 3. Optimization of SDS concentration *.
PeakSDS (%)Peak AreaRsN
10.2598.32646-81,842
0.50110.29612-74,069
1.00111.29242-58,456
1.2590.98324-41,461
20.2535.996725.1994,659
0.5040.229634.7485,577
1.0059.737913.1568,264
1.2530.028281.5952,886
30.25122.891763.3776,173
0.50140.462584.7864,713
1.00150.520688.5442,739
1.25125.6208410.9830,540
* Peak identification and notation, as in Table 1.
Table 4. Optimization of temperature *.
PeakTemperature (°C)Migration Time (min)Peak AreaRsN
12011.88894.05359-112,363
2510.41197.88517-97,228
308.45190.45343-48,154
22012.77735.324126.25140,632
2511.16537.610955.63114,177
308.78133.548223.4545,076
32013.647131.101375.71103,746
2511.811135.422284.4288,639
309.596126.350673.6245,076
* Peak identification and notation, as in Table 1.
Table 5. Analytical performance of the optimized MEEKC method *.
ParameterPeak 1Peak 2Peak 3
Linearity range (ppm)25–20025–20025–200
r20.99990.99960.9998
RSD (%, n = 3)
Migration time0.701.650.97
Peak Area2.032.092.30
LOD3.514.752.72
LOQ11.7215.859.08
* Peak identifications and MEEKC conditions, as in Figure 2.
Table 6. Comparison between the SPE-MEEKC and the SPMTE-MEEKC methods *.
MethodParameterPeak 1Peak 2Peak 3
SPE-MEEKCRecovery (%)9198103
RSD (%, n = 3); (intra-day)1.332.331.26
RSD (%, n = 9); (inter-day)3.264.032.73
SPMTE-MEEKCRecovery (%)877996
RSD (%, n = 3); (intra-day)2.043.153.66
RSD (%, n = 9); (inter-day)5.335.804.93
* Peak identifications and conditions, as in Figure 3.
Disclaimer/Publisher’s Note: The statements, opinions and data contained in all publications are solely those of the individual author(s) and contributor(s) and not of MDPI and/or the editor(s). MDPI and/or the editor(s) disclaim responsibility for any injury to people or property resulting from any ideas, methods, instructions or products referred to in the content.