


Determination of Ethanol Content in Alcoholic Products by LF-NMR

 ,
,
Abstract

1. Introduction
2. Materials and Methods
2.1. Samples
2.2. Chemical Analysis
2.2.1. Chromatographic Method
2.2.2. Densimetric Method
2.2.3. Spectroscopic (LF-NMR) Method
- -
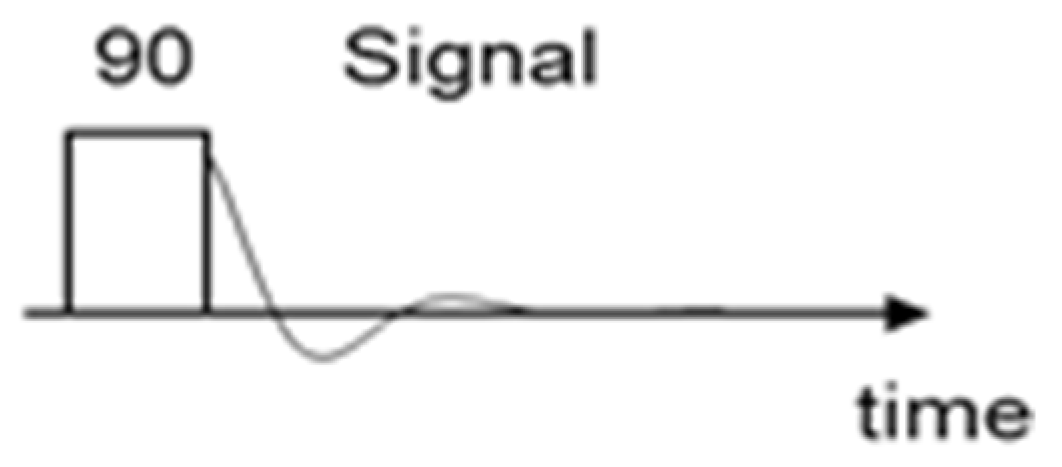
- pulse angle: 90°.
- -
- dwell time: 200 µs;
- -
- acquisition time: 6.4 s (for each scan);
- -
- n. of scans: 4;
- -
- repetition time (relaxation delay): 15 s;
3. Results and Discussion
- Precision data;
- Trueness;
- Specificity;
- Application field;
- Linearity;
- Robustness.
3.1. Precision Data (Repeatabilty and Uncertainty of Measurement)
3.2. Trueness
- Comparison with a PT sample (interlaboratory circuit residual);
- Comparison between results obtained by NMR spectroscopic and reference chromatographic methods, using both standards and real samples.
3.2.1. Comparison with a PT Sample
3.2.2. Comparison between Results Obtained by NMR Spectroscopic and Reference Chromatographic Methods
3.3. Specificity
- Ethanol standard solution containing all 14 denaturants mentioned above;
- Ethanol standard solution containing the two most common volatile substances generally found in crude alcohol: methanol and ethyl acetate;
- Ethanol standard solutions containing, singularly, common or critical denaturants as received by our laboratory.
3.3.1. Analysis of Ethanol Standard Solution Containing 14 Denaturants
3.3.2. Analysis of Ethanol Standard Solution Containing Methanol and Ethyl Acetate
3.3.3. Analysis of Ethanol Standard Solutions Containing, Singularly, Common or Critical Denaturants
3.4. Application Field
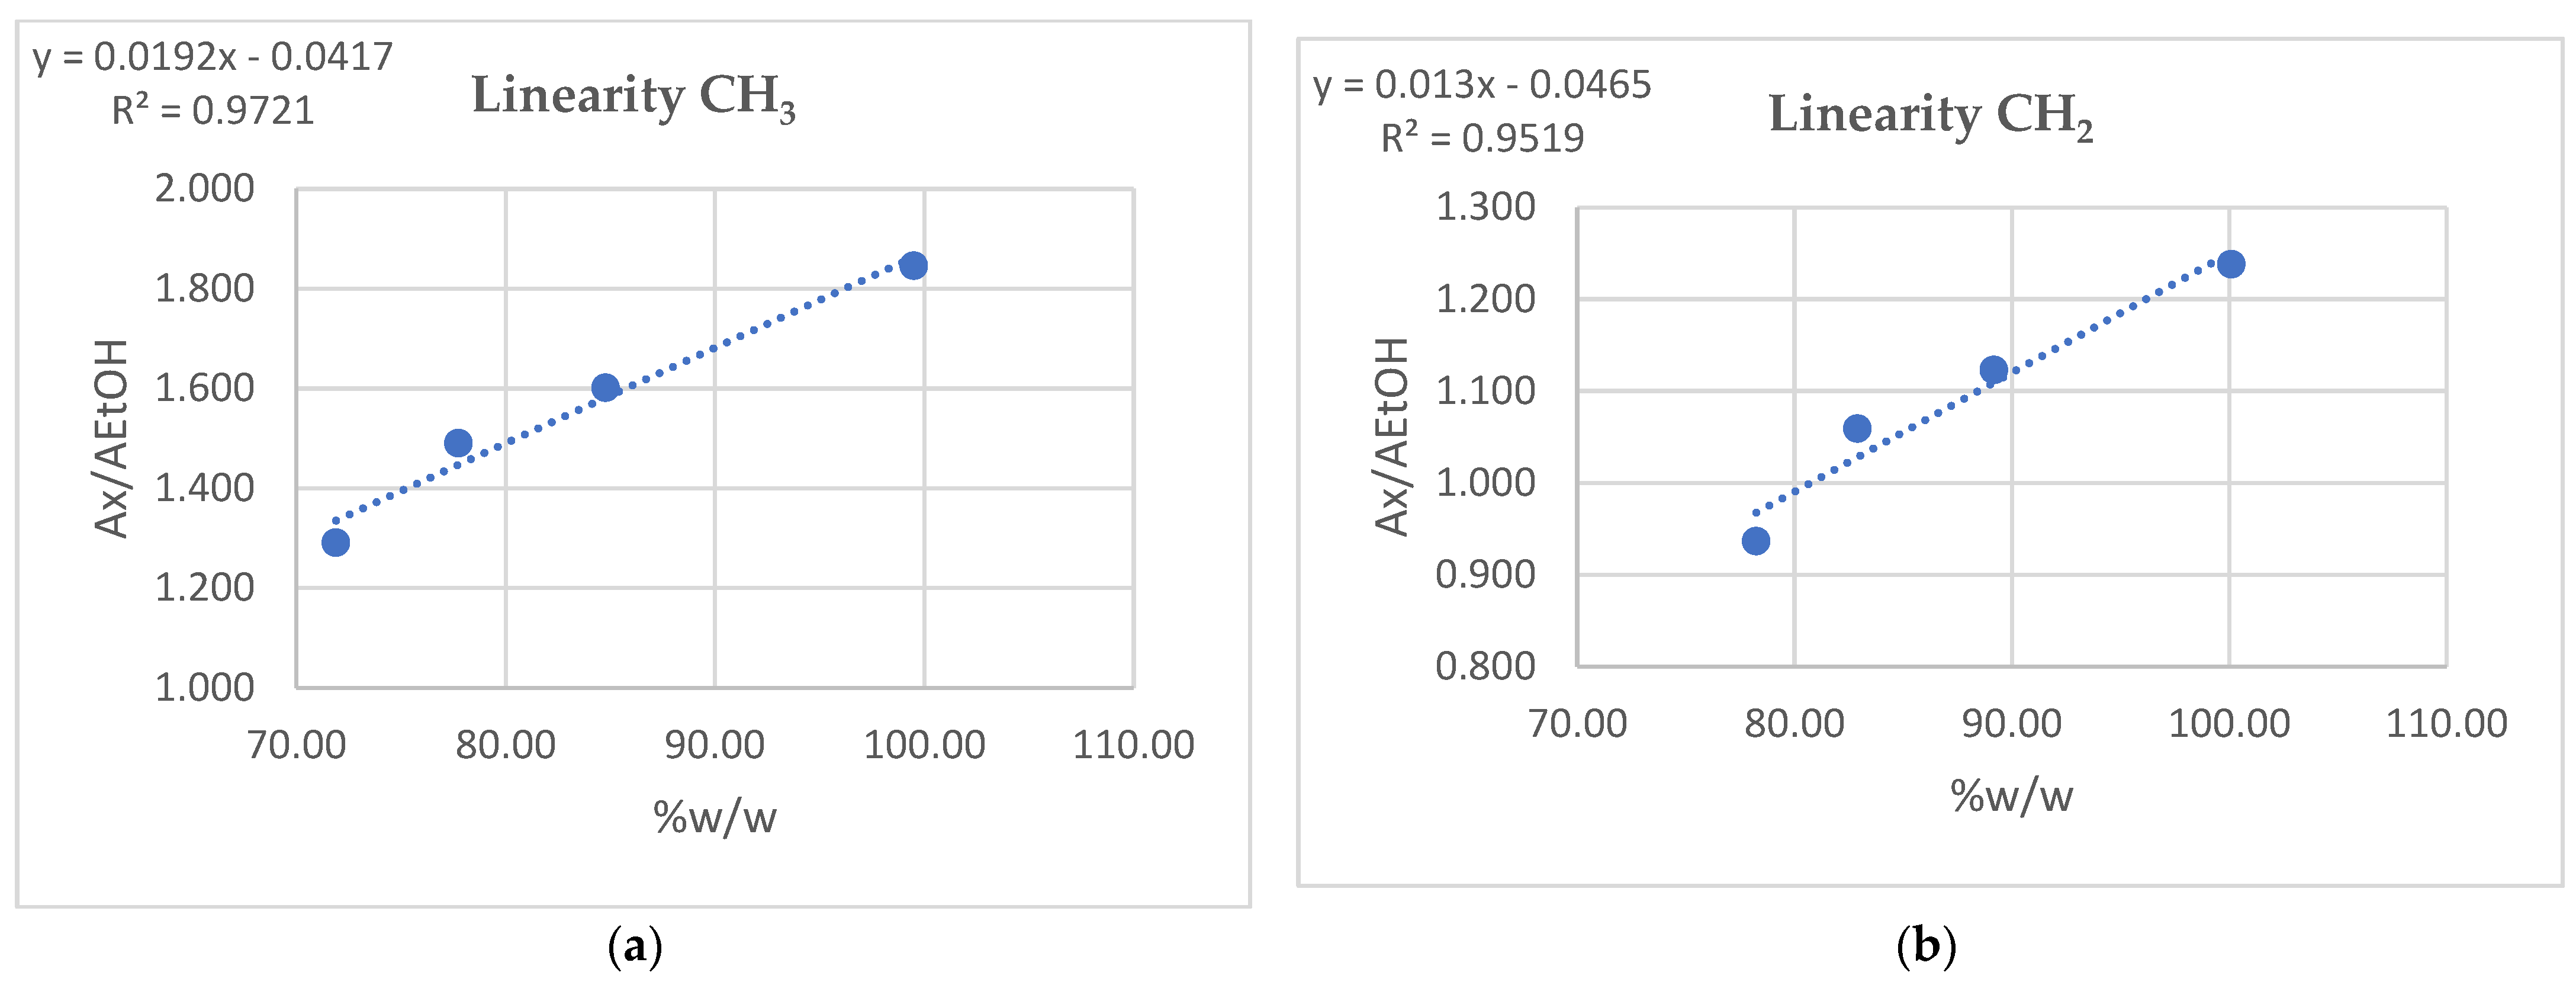
3.5. Linearity
3.6. Robustness
4. Conclusions
Supplementary Materials
Author Contributions
Funding
Data Availability Statement
Acknowledgments
Conflicts of Interest
References
- Council Directive 92/83/EEC of 19 October 1992 on the Harmonization of the Structures of Excise Duties on Alcohol and Alcoholic Beverages, OJ L 316, 31.10.1992, pp. 21–27 (ES, DA, DE, EL, EN, FR, IT, NL, PT). Available online: https://eur-lex.europa.eu/legal-content/EN/TXT/PDF/?uri=CELEX:31992L0083 (accessed on 20 July 2024).
- COMMISSION REGULATION (EC) No 3199/93 of 22 November 1993 on the Mutual Recognition of Procedures for the Complete Denaturing of Alcohol for the Purposes of Exemption from Excise Duty. Available online: https://eur-lex.europa.eu/legal-content/EN/TXT/PDF/?uri=CELEX:31993R3199 (accessed on 20 July 2024).
- Burton, I.W.; Quilliam, M.A.; Walter, J.A. Quantitative 1H NMRwith external standards: Use in preparation of calibrationsolutions for algal toxins and other natural products. Anal. Chem. 2005, 77, 3123–3131. [Google Scholar] [CrossRef] [PubMed]
- Bharti, S.K.; Roy, R. Quantitative 1H NMR spectroscopy. TrAC Trends Anal. Chem. 2012, 35, 5–26. [Google Scholar] [CrossRef]
- Son, H.-S.; Kim, M.K.; Van den Berg, F.; Hwang, G.S.; Park, W.M.; Lee, C.H.; Hong, Y.S. 1H nuclear magnetic resonance-based metabolomic characterization of wines by grape varieties and production areas. J. Agric. Food Chem. 2008, 56, 8007–8016. [Google Scholar] [CrossRef] [PubMed]
- Pauli, G.F.; Godecke, T.; Jaki, B.U.; Lankin, D.C. Quantitative 1H NMR. Development and potential of an analytical method: An update. J. Nat. Prod. 2012, 75, 834–851. [Google Scholar] [CrossRef] [PubMed]
- Edwards, J.C.; Hunter, J.M.; Nemzer, B.V. Multinuclear NMR of calcium fructoborate complex—Structure, stability, and quantitation in the presence of other ingredients, excipients or adulterants. J. Food Res. 2014, 3, 115–131. [Google Scholar] [CrossRef]
- Ramtahal, G.; Yen, I.C.; Bekele, I.; Bekele, F.; Wilson, L.; Sukha, B.; Maharaj, K. Cost-effective method of analysis for the determination of cadmium, copper, nickel and zinc in cocoa beans and chocolates. J. Food Res. 2014, 4, 193–199. [Google Scholar] [CrossRef]
- Bowyer, P.K. The measurement of alcohol levels in wine. In The AustralianGrapegrower and Winemaker; Annual Technical Issue; Ryan Publications: Paraparaumu, New Zealand, 2006; pp. 90–96. [Google Scholar]
- Maes, P.; Monakhova, Y.B.; Kuballa, T.; Reusch, H.; Lachenmeier, D.W. Qualitative and quantitative control of carbonated cola beverages using 1H NMR spectroscopy. J. Agric. Food Chem. 2012, 60, 2778–2784. [Google Scholar] [CrossRef] [PubMed]
- Lorrain, B.; Ky, I.; Pechamat, L.; Teissedre, P.-L. Evolution of analysis of polyphenols from grapes, wines, and extracts. Molecules 2013, 18, 1076–1100. [Google Scholar] [CrossRef] [PubMed]
- Leenders, J.; Grootveld, M.; Percival, B.; Gibson, M.; Casanova, F.; Wilson, P.B. Benchtop Low-Frequency 60 MHz NMR Analysis of Urine: A Comparative Metabolomics Investigation. Metabolites 2020, 10, 155. [Google Scholar] [CrossRef] [PubMed]
- Edgar, M.; Percival, B.C.; Gibson, M.; Jafari, F.; Grootveld, M. Low-field benchtop NMR spectroscopy as a potential non-stationary tool for point-of-care urinary metabolite tracking in diabetic conditions. Diabetes Res. Clin. Pract. 2021, 171, 108554. [Google Scholar] [CrossRef] [PubMed]
- Percival, B.C.; Grootveld, M.; Gibson, M.; Osman, Y.; Molinari, M.; Jafari, F.; Sahota, T.; Martin, M.; Casanova, F.; Mather, M.L.; et al. Low-Field, Benchtop NMR Spectroscopy as a Potential Tool for Point-of-Care Diagnostics of Metabolic Conditions: Validation, Protocols and Computational Models. High-Throughput 2019, 8, 2. [Google Scholar] [CrossRef] [PubMed]
- Grootveld, M.; Percival, B.; Gibson, M.; Osman, Y.; Edgar, M.; Molinari, M.; Mather, M.L.; Casanova, F.; Wilson, P.B. Progress in low-field benchtop NMR spectroscopy in chemical and biochemical analysis. Anal. Chim. Acta 2019, 1067, 11–30. [Google Scholar] [CrossRef] [PubMed]
- Schaeler, K.; Roos, M.; Micke, P.; Golitsyn, Y.; Seidlitz, A.; Thurn-Albrecht, T.; Schneider, H.; Hempel, G.; Saalwaechter, K. Basic principles of static proton low-resolution spin diffusion NMR in nanophase-separated materials with mobility contrast. Solid State Nucl. Magn. Reson. 2015, 72, 50–63. [Google Scholar] [CrossRef] [PubMed]
- Singh, K.; Blümich, B. Desktop NMR for structure elucidation and identification of strychnine adulteration. Analyst 2017, 142, 1459–1470. [Google Scholar] [CrossRef] [PubMed]
- ILIADe 143:2023|CLEN Method “Determination of Ethanol in Alcoholic Products by GC-FID” Version 25 July 2023. Available online: https://taxation-customs.ec.europa.eu/system/files/2023-09/ILIADe143_Ethanol_v25July2023_CLENmethod.pdf (accessed on 20 July 2024).
- EA Guidelines on the Expression of Uncertainty in Quantitative Testing, European Co-Operation for Accreditation, EA-4/16. Available online: http://www.sadcmet.org/SADCWaterLab/Archived_Reports/2006%20Reports%20and%20Docs/EA-4-16r.pdf (accessed on 20 July 2024).
- UNICHIM Manuals n. 179/0, 179/1, 179/2 2011 Edition “Guidelines for the Validation of Analytical Methods in Chemical Laboratories”. Available online: https://pubblicazioni.unichim.it/dettaglio/218 (accessed on 20 July 2024).
- COMMISSION IMPLEMENTING REGULATION (EU) 2017/2236 of 5 December 2017 Amending Regulation (EC) No 3199/93 on the Mutual Recognition of Procedures for the Complete Denaturing of Alcohol for the Purposes of Exemption from Excise Duty. Available online: https://eur-lex.europa.eu/eli/reg_impl/2017/2236/oj (accessed on 20 July 2024).

| Matrix | EtOH Content Determined by GC-FID |
|---|---|
| Anhydrous ethyl alcohol | EtOH: 99.9% v/v |
| Denatured ethyl alcohol (euro DG) | EtOH: 88.5% v/v |
| Crude alcohol | EtOH: 92.7% v/v |
| Hydroalcoholic mixture ethyl alcohol/water 80/20% v/v | EtOH: 82.7% v/v |
| Matrix | rLAB (%v/v) -CH3 Signal | rLAB (%v/v) -CH2 Signal | UH (%v/v) |
|---|---|---|---|
| Anhydrous ethyl alcohol | 1.64 | 0.74 | 2.00 |
| Denatured ethyl alcohol (euro DG) | 1.84 | ||
| Crude alcohol | 1.90 | ||
| Hydroalcoholic mixture ethyl alcohol/water 80/20% v/v | 1.76 |
| Matrix | X (%v/v) | Xpt (%v/v) | spt | Z-Score | Acceptability (−2 ≤ z ≤ +2) |
|---|---|---|---|---|---|
| PT CLEN 2019-Burning Alcohol (-CH3)–Repetition 1 | 86.76 | 89.62 | 0.65 | −4.40 | NO |
| PT CLEN 2019-Burning Alcohol (-CH3)–Repetition 2 | 87.61 | −3.09 | NO | ||
| PT CLEN 2019-Burning Alcohol (-CH3)–Repetition 3 | 86.31 | −5.09 | NO | ||
| PT CLEN 2019-Burning Alcohol (-CH2)–Repetition 1 | 89.25 | −0.57 | YES | ||
| PT CLEN 2019-Burning Alcohol (-CH2)–Repetition 2 | 90.04 | 0.65 | YES | ||
| PT CLEN 2019-Burning Alcohol (-CH2)–Repetition 3 | 88.78 | −1.30 | YES |
| -CH3 Signal | -CH3 Signal | -CH3 Signal | Acceptability | -CH2 Signal | -CH2 Signal | -CH2 Signal | Acceptability | ||
|---|---|---|---|---|---|---|---|---|---|
| Anhydrous ethyl alcohol | 100.88 | 99.49 | 1.39 | 0.16 | NO | 100.03 | 0.85 | 0.14 | NO |
| Denatured ethyl alcohol (euro DG) | 88.08 | 89.07 | 1.00 | 0.26 | NO | 88.28 | 0.20 | 0.40 | YES |
| Crude alcohol | 92.73 | 92.76 | 0.03 | 0.56 | YES | 92.92 | 0.19 | 0.65 | YES |
| Hydroalcoholic mixture ethyl alcohol/water 80/20% v/v | 82.72 | 81.32 | 1.40 | 0.25 | NO | 82.99 | 0.26 | 0.33 | YES |
| CH3 | Acceptability | CH2 | Acceptability | |
|---|---|---|---|---|
| Anhydrous ethyl alcohol—CRM | 0.47 | YES | 0.11 | YES |
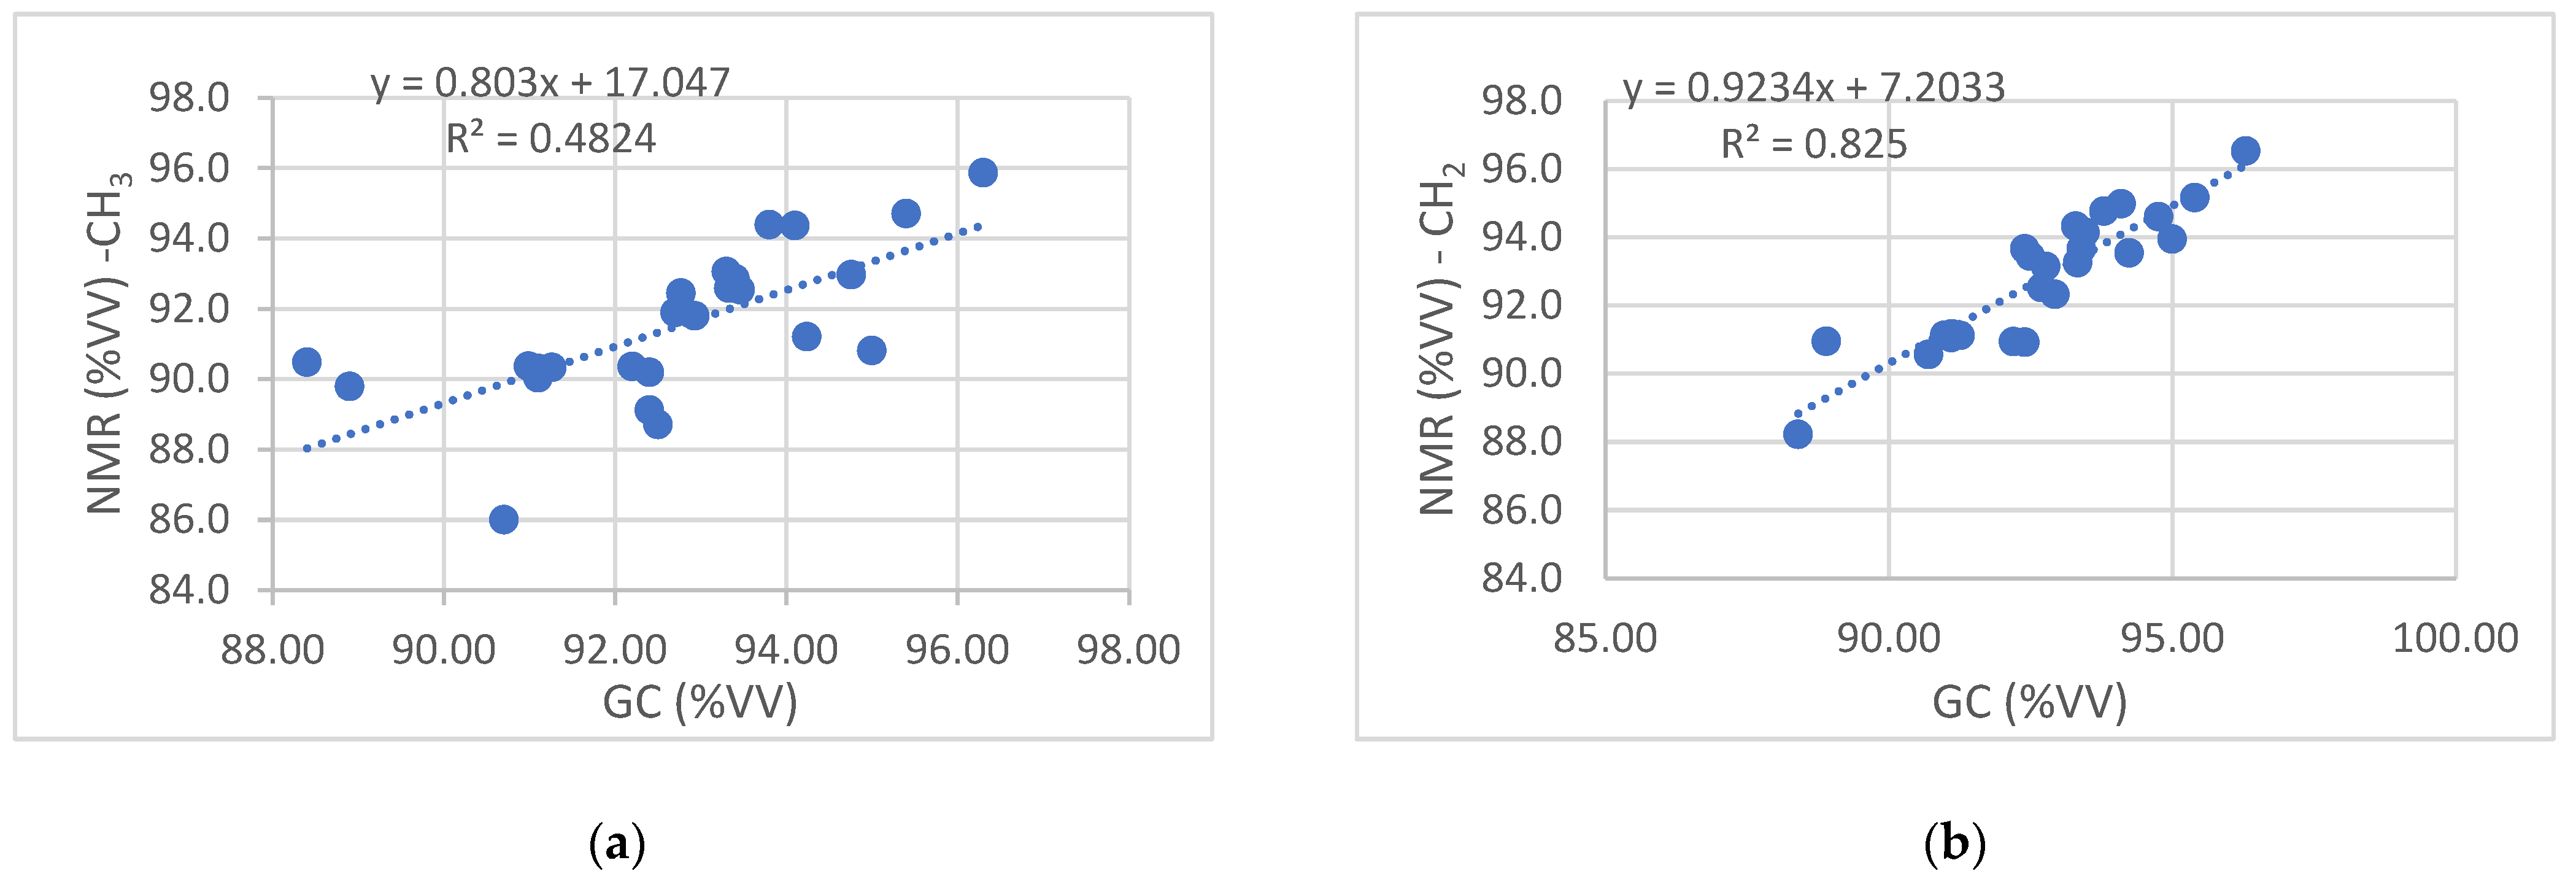
| Equation -CH3 Signal | a (Intercept) ± s(a) -CH3 Signal | b (Slope) ± s(b) -CH3 Signal | Equation -CH2 Signal | a (Intercept) ± s(a) -CH2 Signal | b (Slope) ± s(b) -CH2 Signal |
|---|---|---|---|---|---|
| y = 0.803x + 17.047 | 17.0 ± 16.1 | 0.80 ± 0.17 | y = 0.9234x + 7.2033 | 7.20 ± 8.22 | 0.92 ± 0.09 |
| Cexperimental -CH3 Signal | Cexperimental -CH2 Signal | Ctheoretical | Recovery -CH3 Signal | Recovery -CH2 Signal | |
|---|---|---|---|---|---|
| Ethanol standard solution containing 14 denaturants | 98.65% w/w | 103.41% w/w | 54.99% w/w | 179.39% | 188.06% |
| Cexperimental -CH3 Signal | Cexperimental -CH2 Signal | Ctheoretical | Recovery -CH3 Signal | Recovery -CH2 Signal | |
|---|---|---|---|---|---|
| Ethanol std + methanol & ethyl acetate | 83.13% w/w | 81.31% w/w | 80.26% w/w | 103.58% | 101.31% |
| Cexperimental -CH3 Signal | Cexperimental -CH2 Signal | Ctheoretical | Recovery -CH3 Signal | Recovery -CH2 Signal | |
|---|---|---|---|---|---|
| Ethanol std + acetone | 88.52 | 91.43 | 90.10 | 98.25 | 101.47 |
| Ethanol std + MEK | 89.99 | 90.53 | 89.99 | 100.60 | 101.75 |
| Ethanol std + 2-propanol | 103.69 | 92.69 | 90.25 | 114.89 | 102.70 |
| Ethanol std + ethylene glycol | 85.67 | 83.41 | 85.67 | 97.37 | 124.80 |
| Ethanol std + n-propanol | 89.54 | 90.95 | 89.54 | 101.58 | 109.98 |
Disclaimer/Publisher’s Note: The statements, opinions and data contained in all publications are solely those of the individual author(s) and contributor(s) and not of MDPI and/or the editor(s). MDPI and/or the editor(s) disclaim responsibility for any injury to people or property resulting from any ideas, methods, instructions or products referred to in the content. |
© 2024 by the authors. Licensee MDPI, Basel, Switzerland. This article is an open access article distributed under the terms and conditions of the Creative Commons Attribution (CC BY) license (https://creativecommons.org/licenses/by/4.0/).
Share and Cite
Farine, G.; Scilinguo, M.; Calvagna, C.; Romano, S.; Polito, M.; Sgrò, S. Determination of Ethanol Content in Alcoholic Products by LF-NMR. Analytica 2024, 5, 458-470. https://doi.org/10.3390/analytica5030031
Farine G, Scilinguo M, Calvagna C, Romano S, Polito M, Sgrò S. Determination of Ethanol Content in Alcoholic Products by LF-NMR. Analytica. 2024; 5(3):458-470. https://doi.org/10.3390/analytica5030031
Chicago/Turabian StyleFarine, Gianluca, Maria Scilinguo, Chiara Calvagna, Silvia Romano, Marco Polito, and Salvatore Sgrò. 2024. "Determination of Ethanol Content in Alcoholic Products by LF-NMR" Analytica 5, no. 3: 458-470. https://doi.org/10.3390/analytica5030031
APA StyleFarine, G., Scilinguo, M., Calvagna, C., Romano, S., Polito, M., & Sgrò, S. (2024). Determination of Ethanol Content in Alcoholic Products by LF-NMR. Analytica, 5(3), 458-470. https://doi.org/10.3390/analytica5030031