
Computer Vision Technique for Blind Identification of Modal Frequency of Structures from Video Measurements †


Abstract
:1. Introduction
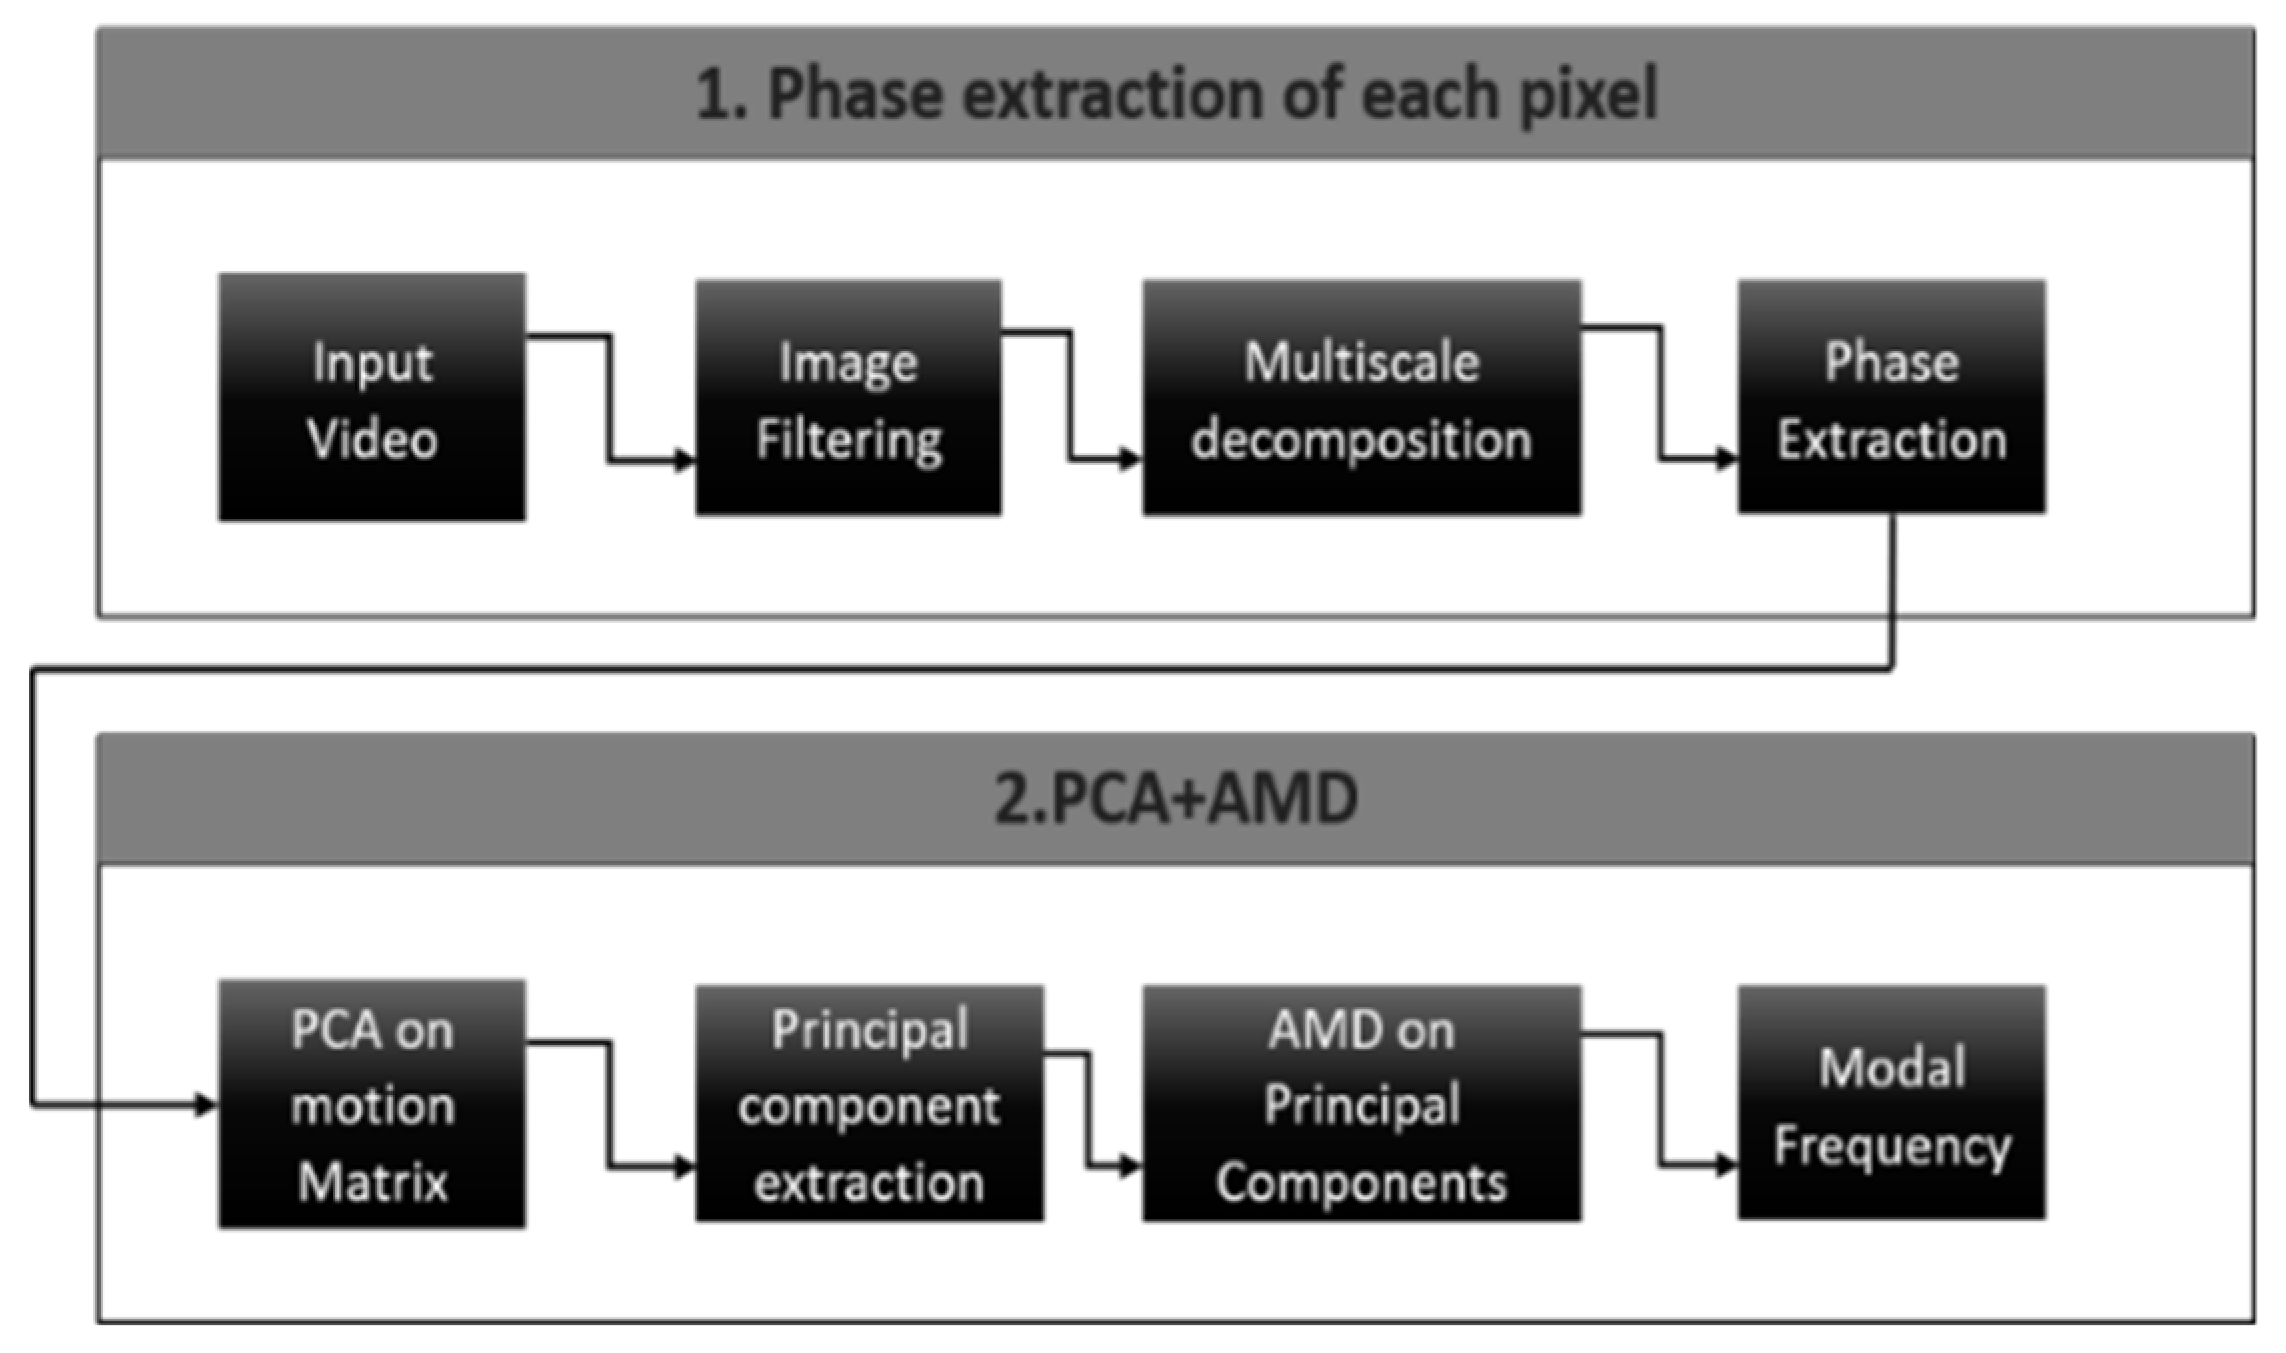
2. Methodologies
2.1. Phase Extraction Using Complex Steerable Pyramids
2.2. Principal Component Analysis
2.3. Analytical Mode Decomposition
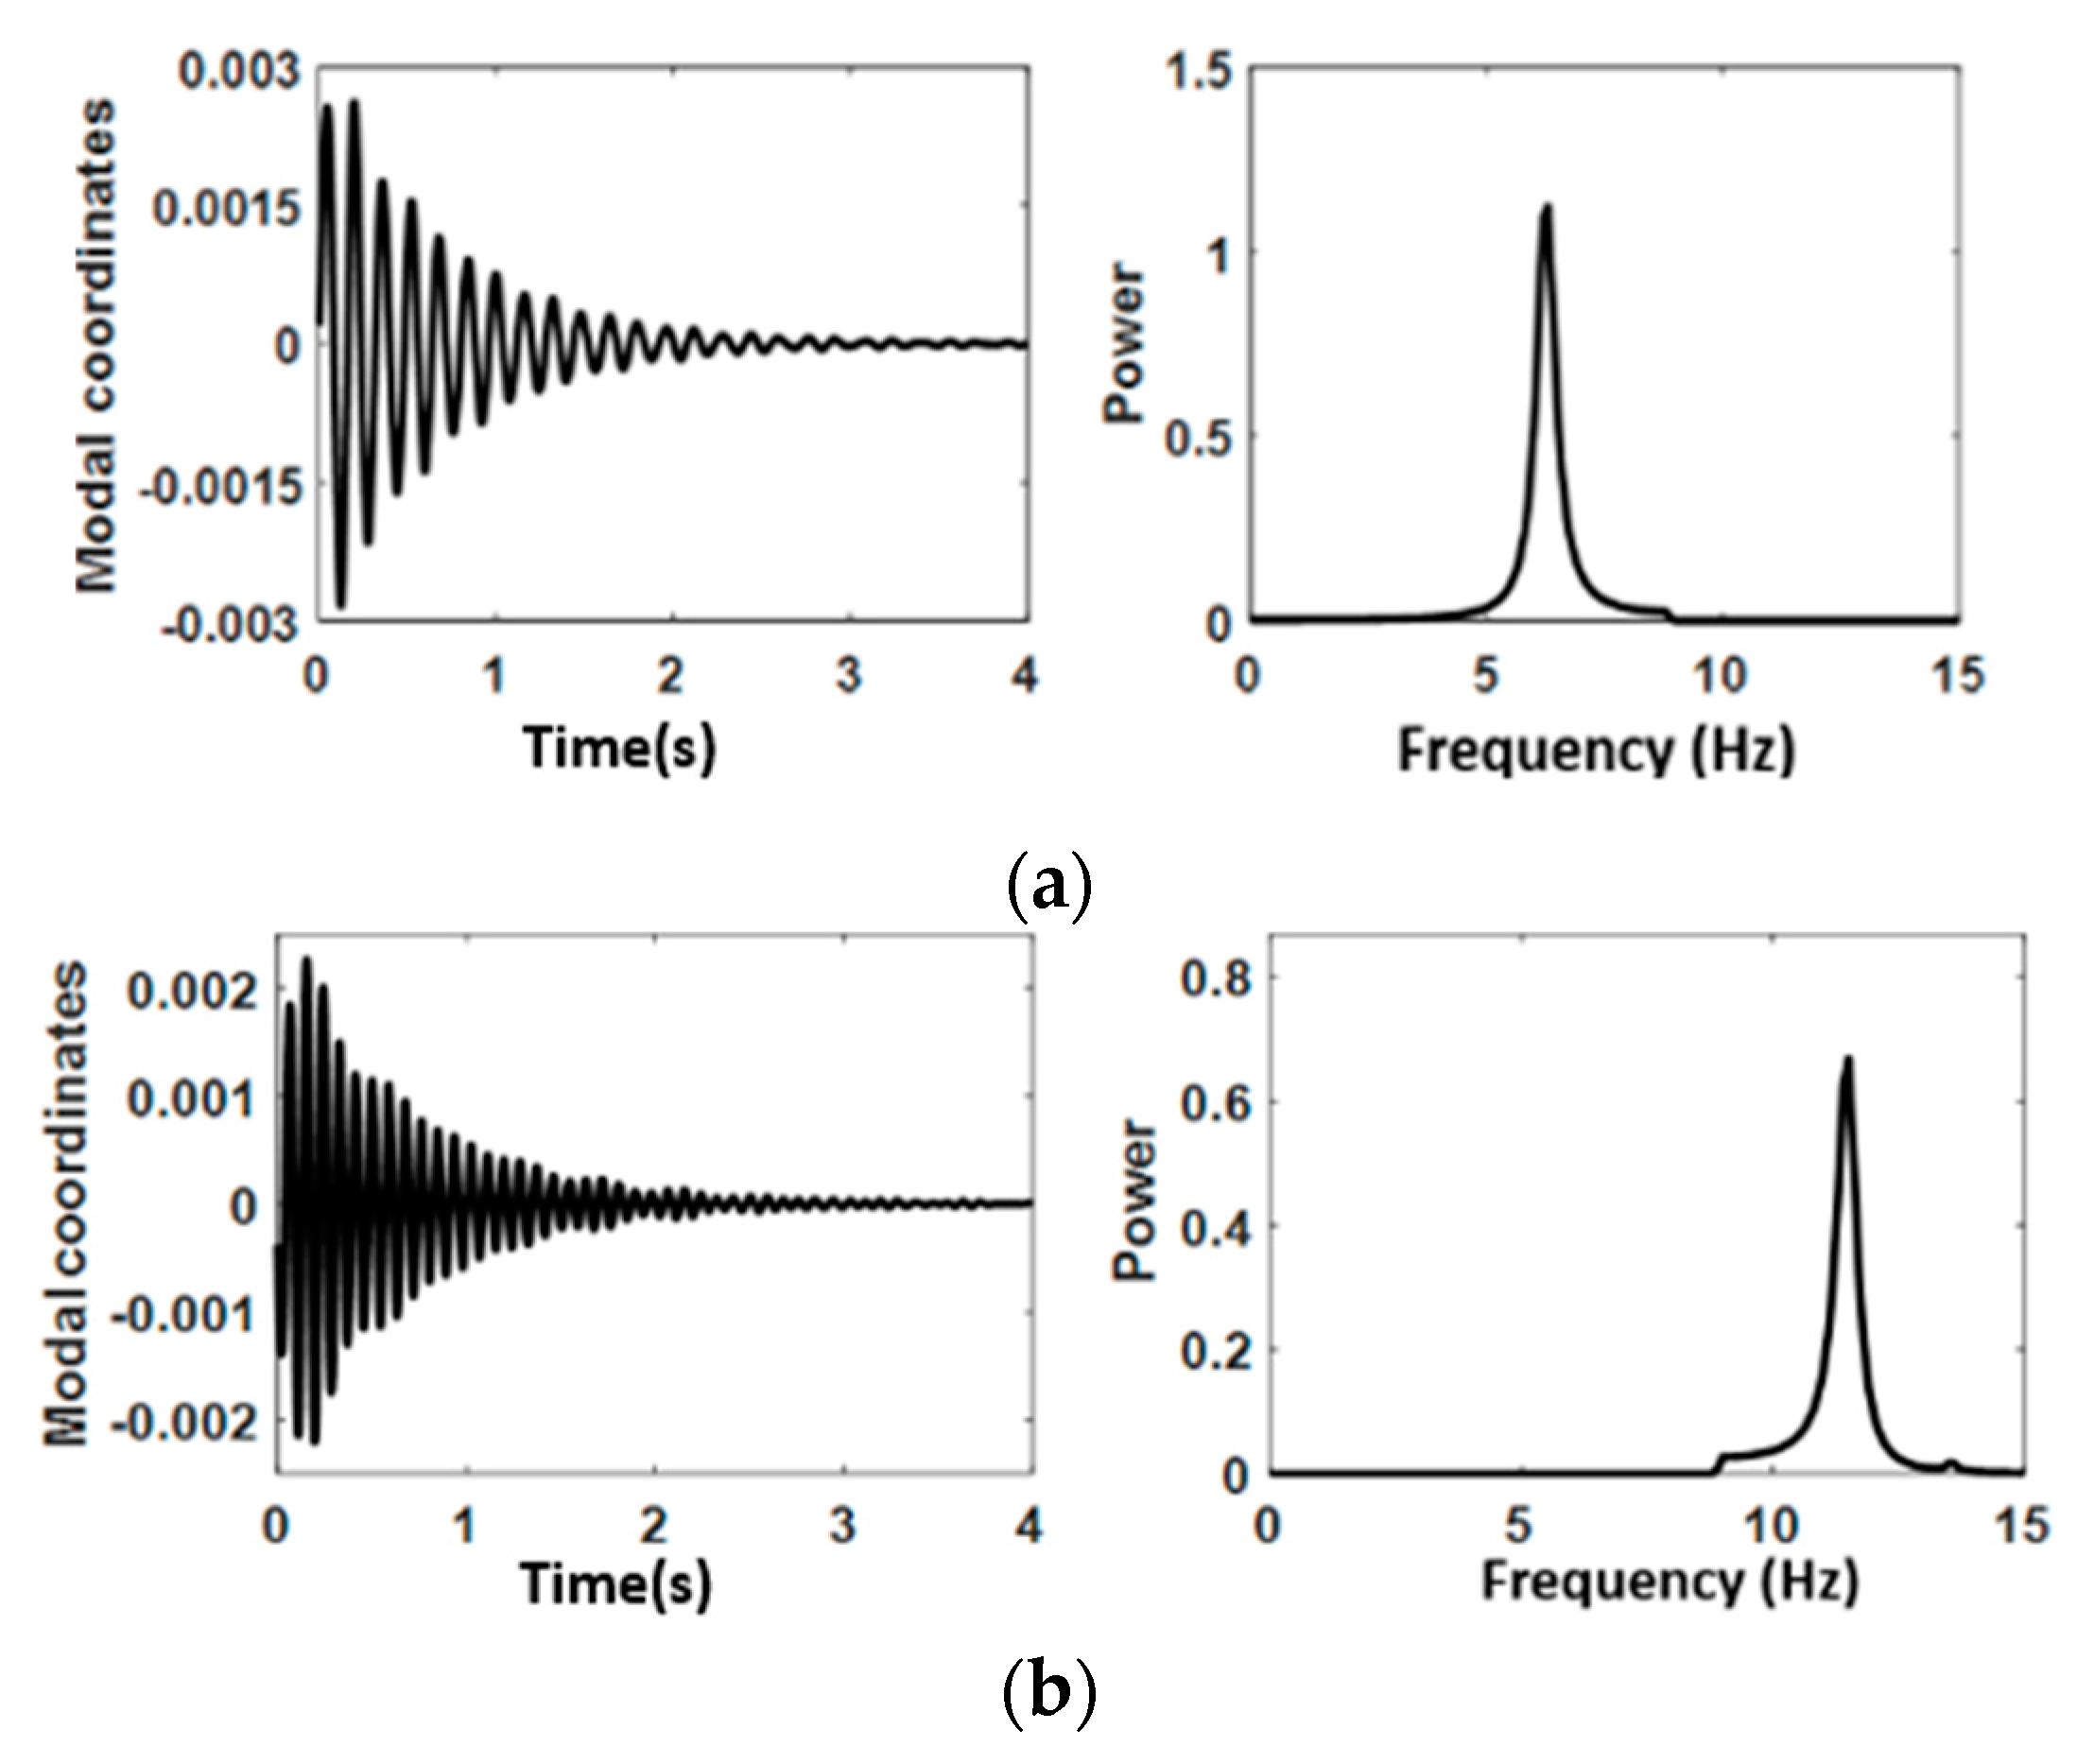
3. Validation of Proposed Method on Numerical Model
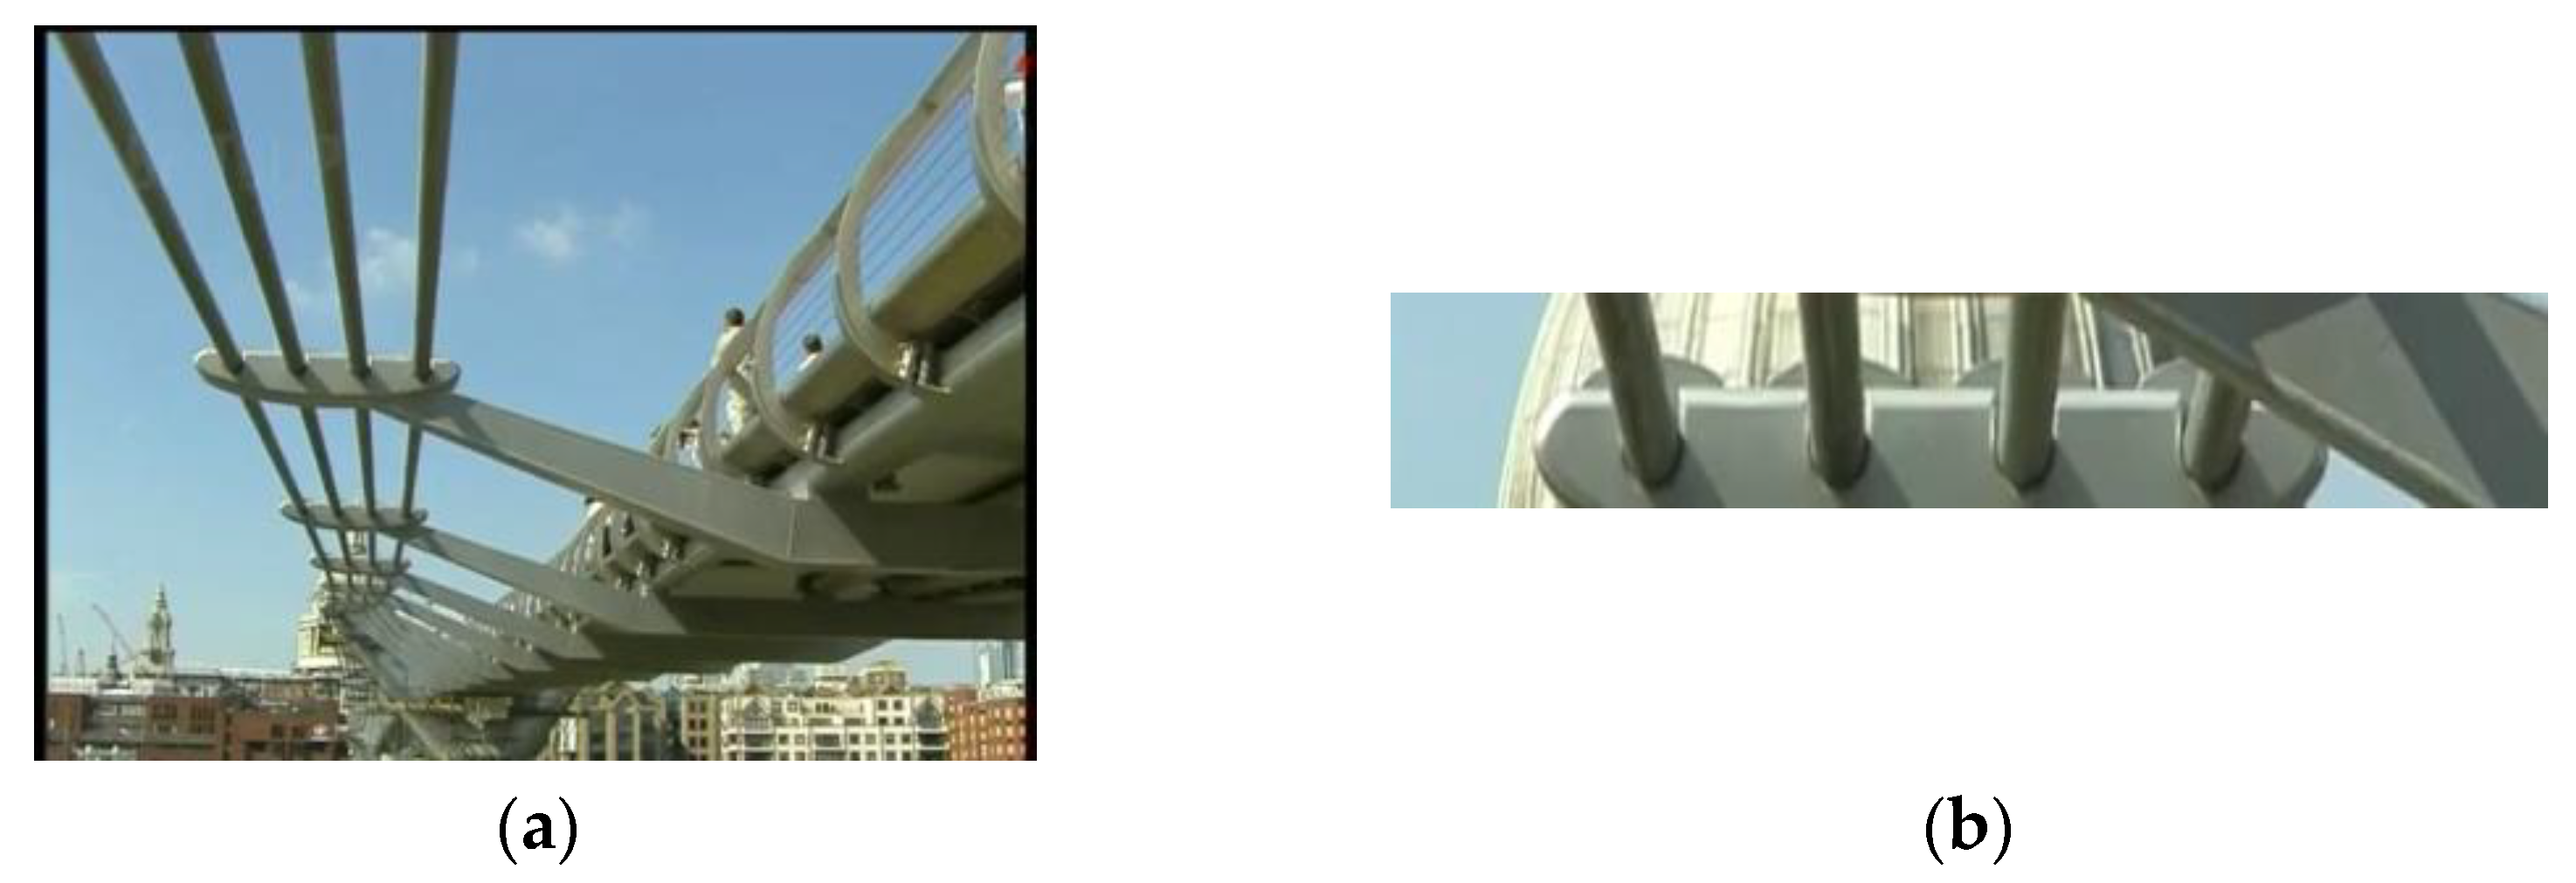
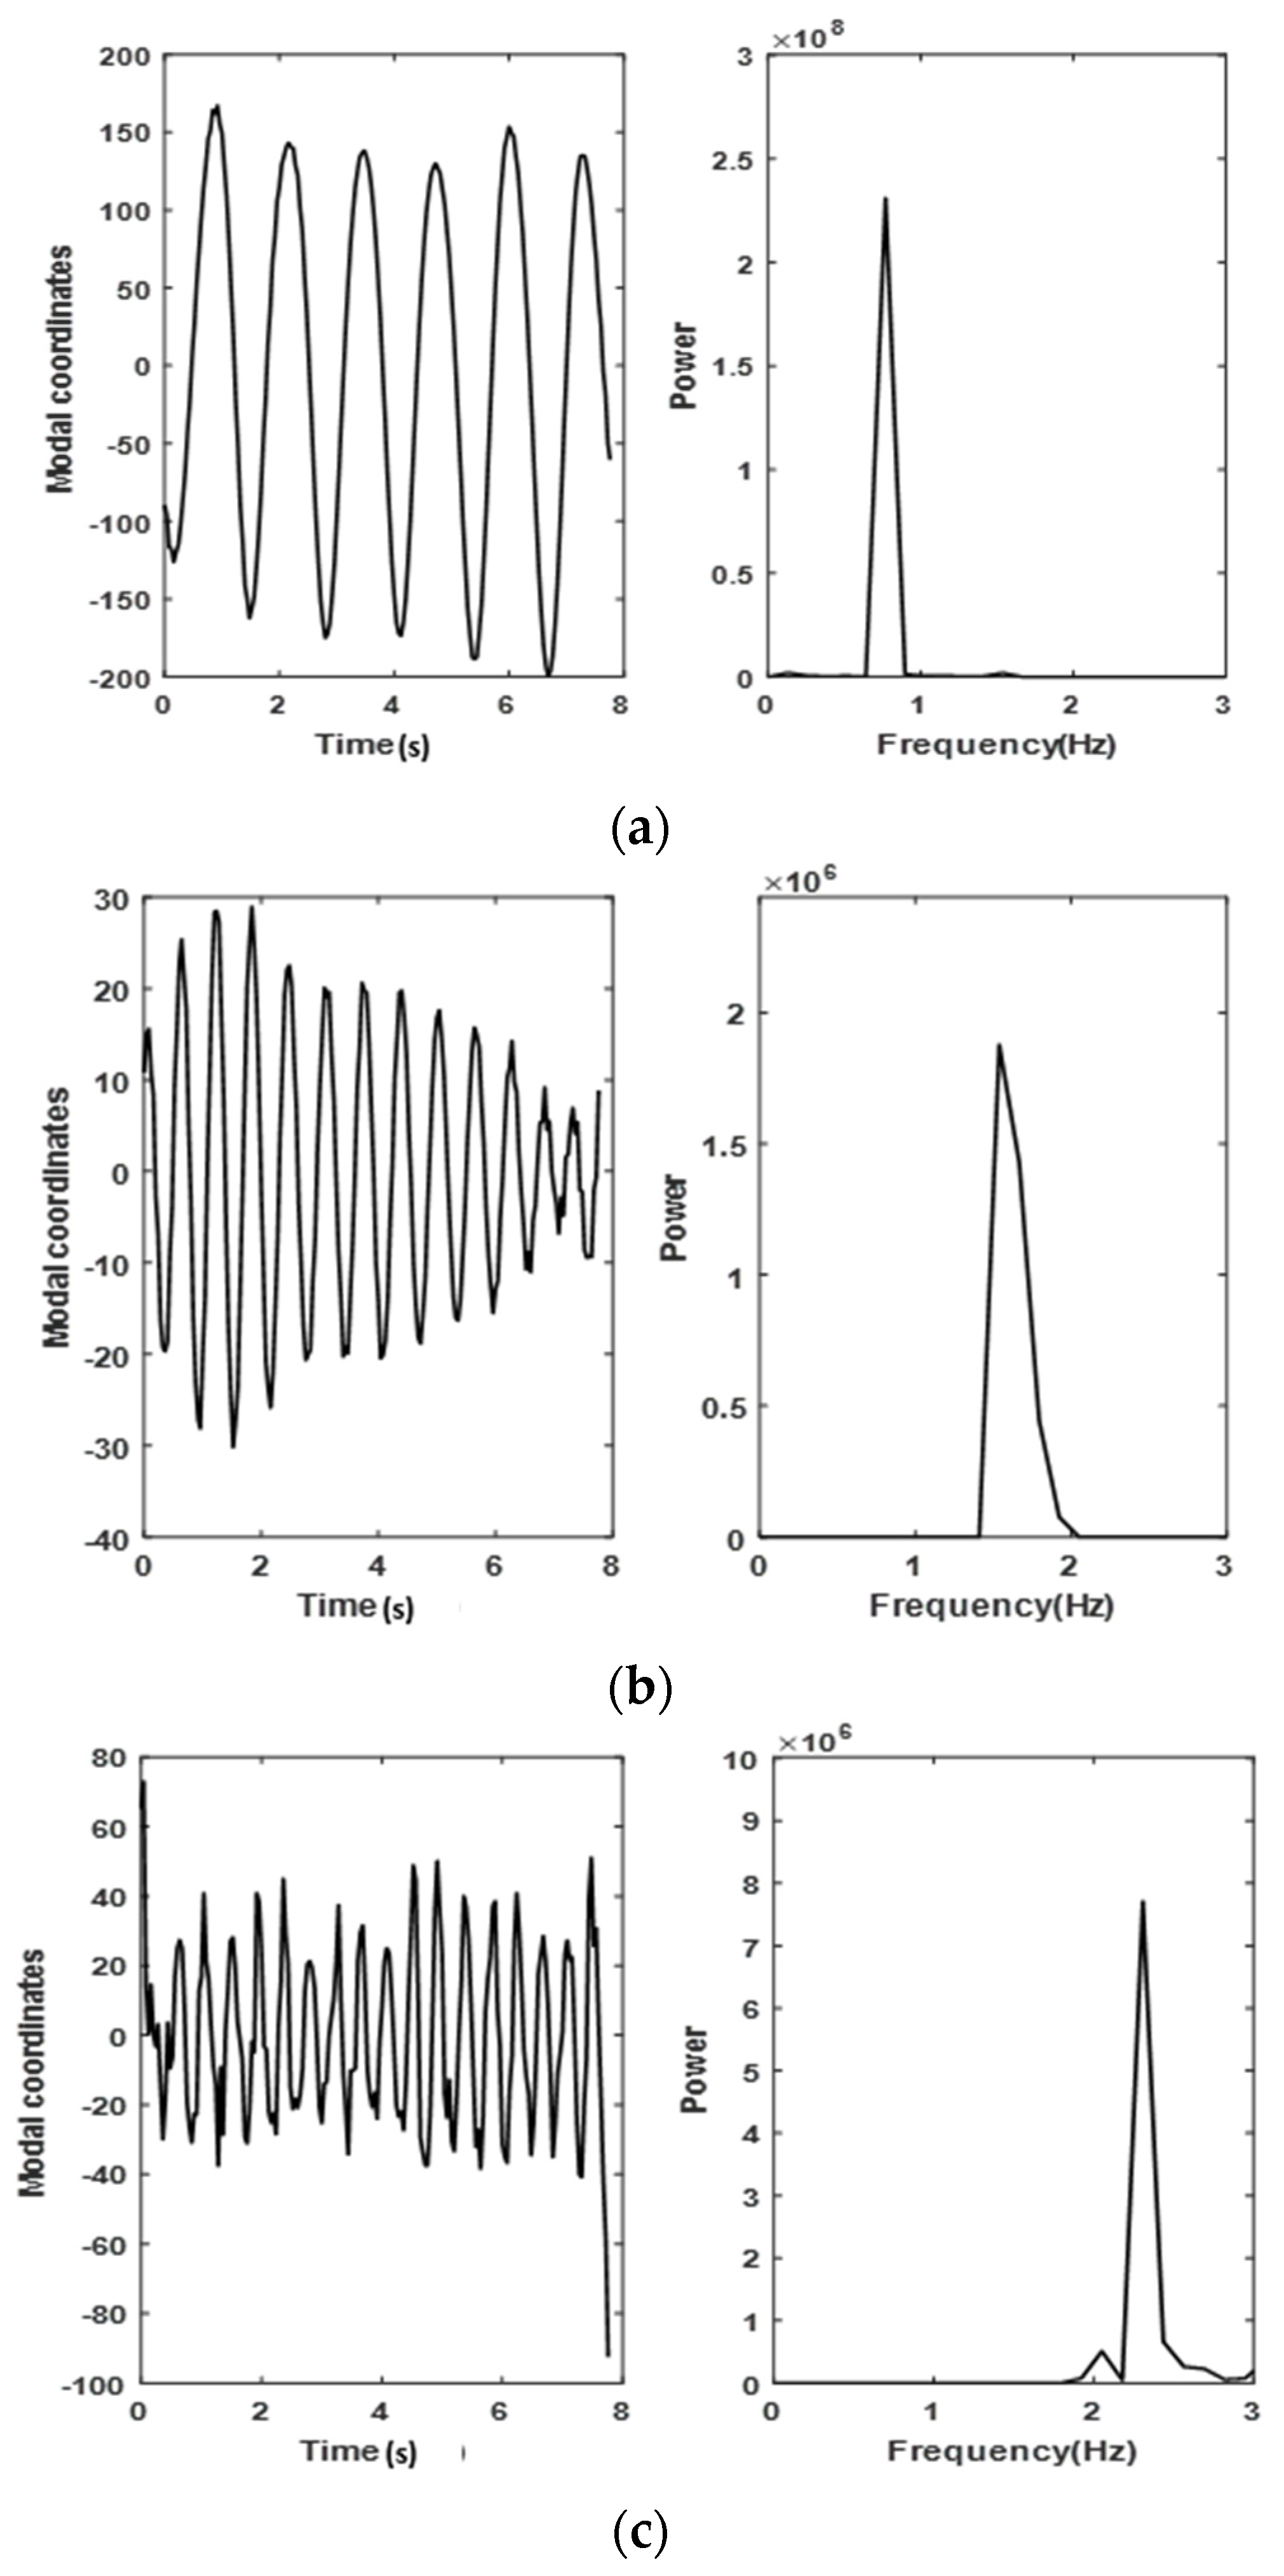
4. Implementation of Proposed Method on Full-Scale Video Measurement of London Millennium Bridge
5. Conclusions
Supplementary Materials
Author Contributions
Funding
Institutional Review Board Statement
Informed Consent Statement
Data Availability Statement
Conflicts of Interest
References
- Doebling, S.W.; Farrar, C.R.; Prime, M.B. A summary review of vibration-based damage identification methods. Shock. Vib. Dig. 1998, 30, 91–105. [Google Scholar] [CrossRef] [Green Version]
- Ashory, M.R. Correction of Mass-Loading Effects of Transducers and Suspension Effects in Modal Testing; SPIE Proceedings Series; SPIE: Bellingham, WA, USA, 1998; pp. 815–828. [Google Scholar]
- Fan, W.; Qiao, P. Vibration-based damage identification methods: A review and comparative study. Struct. Health Monit. 2011, 10, 83–111. [Google Scholar] [CrossRef]
- Farrar, C.R.; Darling, T.W.; Migliori, A.; Baker, W.E. Microwave interferometers for non-contact vibration measurements on large structures. Mech. Syst. Signal Process. 1999, 13, 241–253. [Google Scholar] [CrossRef] [Green Version]
- Stanbridge, A.B.; Ewins, D.J. Modal testing using a scanning laser Doppler vibrometer. Mech. Syst. Signal Process. 1999, 13, 255–270. [Google Scholar] [CrossRef]
- Saravanan, T.J.; Gopalakrishnan, N.; Hari, B.K. Damage identification in structural elements through curvature mode shapes and non-linear energy operator. Compos. Mater. Eng. 2019, 1, 33–48. [Google Scholar]
- Saravanan, T.J.; Gopalakrishnan, N.; Rao, N.P. Damage detection in structural element through propagating waves using radially weighted and factored RMS. Measurement 2015, 73, 520–538. [Google Scholar] [CrossRef]
- Saravanan, T.J.; Nishio, M.; Suzuki, T. Computer Vision based In-plane Strain Field Monitoring for Identification of Local Damages in Structural Members. Struct. Health Monit. 2019, 2019, 32465. [Google Scholar] [CrossRef]
- Saravanan, T.J.; Nishio, M. Estimation of In-Plane Strain Field Using Computer Vision to Capture Local Damages in Bridge Structures. In Advances in Condition Monitoring and Structural Health Monitoring; Springer: Singapore, 2021; pp. 461–469. [Google Scholar]
- Wadhwa, N.; Rubinstein, M.; Durand, F.; Freeman, W.T. Phase-based video motion processing. ACM Trans. Graph. (TOG) 2013, 32, 1–10. [Google Scholar] [CrossRef] [Green Version]
- Simoncelli, E.P.; Freeman, W.T. The steerable pyramid: A flexible architecture for multi-scale derivative computation. In Proceedings of the International Conference on Image Processing, Washington, DC, USA, 23–26 October 1995; Volume 3, pp. 444–447. [Google Scholar]
- Saravanan, T.J.; Siringoringo, D.M.; Fujino, Y.; Wangchuk, S. Operational modal analysis of light pole-viaduct system from video measurements using phase-based motion magnification. In Bridge Maintenance, Safety, Management, Life-Cycle Sustainability and Innovations; CRC Press: Boca Raton, FL, USA, 2021; pp. 1629–1637. [Google Scholar]
- Chen, J.G.; Wadhwa, N.; Cha, Y.J.; Durand, F.; Freeman, W.T.; Buyukozturk, O. Modal identification of simple structures with high-speed video using motion magnification. J. Sound Vib. 2015, 345, 58–71. [Google Scholar] [CrossRef]
- Thiyagarajan, J.S.; Siringoringo, D.M.; Wangchuk, S.; Fujino, Y. Implementation of video motion magnification technique for non-contact operational modal analysis of light poles. Smart Struct. Syst. 2021, 27, 227. [Google Scholar]
- Yang, Y.; Dorn, C.; Mancini, T.; Talken, Z.; Kenyon, G.; Farrar, C.; Mascareñas, D. Blind identification of full-field vibration modes from video measurements with phase-based video motion magnification. Mech. Syst. Signal Process. 2017, 85, 567–590. [Google Scholar] [CrossRef]
- Chen, G.; Wang, Z. A signal decomposition theorem with Hilbert transform and its application to narrowband time series with closely spaced frequency components. Mech. Syst. Signal Process. 2012, 28, 258–279. [Google Scholar] [CrossRef]
- Pavic, A.; Willford, M.; Reynolds, P.; Wright, J. Key results of modal testing of the Millennium Bridge, London. In Proceedings of the Footbridge, Paris, France, 20–22 November 2002. [Google Scholar]
- The Millennium Bridge in London. 2019. Available online: https://www.youtube.com/watch?v=y2FaOJxWqLE&t=2s (accessed on 4 May 2021).


| Mode | Frequency (Hz) | Error % | |
|---|---|---|---|
| Theoretical | Estimated | ||
| 1 | 6.25 | 6.30 | 0.8 |
| 2 | 11.45 | 11.50 | 0.09 |
| 3 | 15.62 | 15.60 | 0.13 |
| 4 | 20.03 | 20.00 | 0.15 |
| Mode | Frequency (Hz) | Error % | |
|---|---|---|---|
| From Ref. [17] | Estimated | ||
| 1 | 0.77 | 0.769 | 0.13 |
| 2 | 1.54 | 1.53 | 0.65 |
| 3 | 2.32 | 2.31 | 0.43 |
Publisher’s Note: MDPI stays neutral with regard to jurisdictional claims in published maps and institutional affiliations. |
© 2021 by the authors. Licensee MDPI, Basel, Switzerland. This article is an open access article distributed under the terms and conditions of the Creative Commons Attribution (CC BY) license (https://creativecommons.org/licenses/by/4.0/).
Share and Cite
Allada, V.; Saravanan, T.J. Computer Vision Technique for Blind Identification of Modal Frequency of Structures from Video Measurements. Eng. Proc. 2021, 10, 12. https://doi.org/10.3390/ecsa-8-11298
Allada V, Saravanan TJ. Computer Vision Technique for Blind Identification of Modal Frequency of Structures from Video Measurements. Engineering Proceedings. 2021; 10(1):12. https://doi.org/10.3390/ecsa-8-11298
Chicago/Turabian StyleAllada, Vishal, and Thiyagarajan Jothi Saravanan. 2021. "Computer Vision Technique for Blind Identification of Modal Frequency of Structures from Video Measurements" Engineering Proceedings 10, no. 1: 12. https://doi.org/10.3390/ecsa-8-11298