Proceeding Paper

Predictive Glucose Monitoring for People with Diabetes Using Wearable Sensors †

1
School of Computing, Ulster University, Newtownabbey BT37 0QB, UK
2
Nsugbe Research Labs, Swindon SN1 31G, UK
*
Author to whom correspondence should be addressed.
Presented at 8th International Electronic Conference on Sensors and Applications, 1–15 November 2021; Available online: https://ecsa-8.sciforum.net.
Eng. Proc. 2021, 10(1), 20; https://doi.org/10.3390/ecsa-8-11317
Published: 1 November 2021

Abstract

:
Diabetes is a chronic non-communicable disease resulting from pancreatic inability to produce the hormone insulin, or a physiological cellular inability to use this hormone effectively. This leads to unregulated blood glucose levels, which can cause significant and often irreversible physiological damage. Current means of glucose level monitoring range from infrequent capillary blood glucose sampling to continuous interstitial fluid glucose monitoring. However, the accuracy of these methods is limited by numerous factors. A potential solution to this shortcoming involves the use of wearable sensors that record an individual’s physiological responses to a range of daily activities, which are subsequently fused and processed with machine learning (ML) algorithms to provide a prediction of an individual’s glucose level and can provide an artificial intelligence-driven glucose monitoring platform. In this paper, we conduct a comparison case study using quadratic discriminant analysis (QDA) and support vector machine (SVM) algorithms for the classification of glucose levels with data acquired from the wearable sensors of a type 1 diabetic individual. Preliminary results demonstrate predicted glucose levels with >70% accuracy, indicating potential for this approach to be used in the design of an ergonomic glucose prediction platform utilizing wearable sensors. Further work will involve the exploration of additional datasets from affordable wearables to enhance and improve the prediction power of the ML algorithms.

1. Introduction

Type 1 diabetes (T1D) is a chronic condition which can develop at any stage of life. It is defined as an autoimmune condition caused by the destruction of pancreatic β-cells and requires the administration of manufactured biosimilar insulin for survival [1,2]. Insulin is responsible for maintaining biological homeostasis by enabling glucose to enter cells as their primary energy source. In the UK, 4.1 million people live with diabetes, while a further 850,000 are currently undiagnosed. Global estimates identify 1 in 11 people as having diabetes. Unregulated glucose levels cause significant, and often irreversible, damage to blood vessels in the eyes, kidneys, teeth, and skin.
The World Health Organisation (WHO) has identified diabetes as one of the four leading non-communicable diseases (NCD) leading to increased risk of premature death in people aged 30–69 annually [3]. Having an NCD increases cardiovascular risk in populations with diabetes. Reduced levels of physical activity results in increased blood pressure, increased blood glucose levels and increased lipids, which are metabolic factors that can contribute to cardio-vascular disease [3].
Physical activity is known to reduce metabolic risk factors by improving cardiovascular health [4]. However, many people with T1D are prevented from engaging in regular physical activity (PA) due to existing physiological and psychological limits, particularly the fear of reactive hypoglycemia [5]. Understanding the concerns of people with T1D around PA is key to understanding their needs in developing software applications to support food and lifestyle choices. It is also relevant in minimizing the potential for physical and emotional harm [3] due to the impact of various types of exercise on glycemic control [4,5].
The use of commercially available glucose monitoring devices and fitness or activity trackers may benefit people with T1D to support participation in PA. The long term benefits of PA are recognized as improving cardiovascular health within this population [5].
To date, numerous studies have been conducted on the use of ML in medicine and in the analysis of the multi-factorial nature of blood glucose dynamics, specifically combining chemical and physiological elements to predict blood glucose levels [6,7,8,9,10]. Woldergay et al. [6] recognised the challenges of ML against a backdrop of inaccurate carbohydrate entries and the lack of quantifiable measures to assess the impact of stress, physical activity, insulin therapy and the real life dietary choices of people with T1D on blood glucose levels [6]. The volume of data generated by glucose monitors, including but not limited to carbohydrate calculations, insulin therapy, etc., should enable a level of accuracy in future glucose predictions using appropriate modelling systems to reduce the burden of constant self-management [7].
Using ML to incorporate data from activity trackers to analyse the impact of the activities of daily living as modifying factors, or confounders, has the potential to demonstrate the impact on the glucose variability of such activities. As previously noted, the accuracy or otherwise of carbohydrate calculations is a major challenge to developing universal algorithms for blood glucose prediction [6]. The use of technology in managing diabetes has been highlighted as a significant adjunct to insulin in facilitating healthy lifestyle behaviours [11] as well as facilitating improved glucose control, specifically time in target range [12], through enhanced user awareness of insulin and carbohydrate requirements.
In the area of ML for diabetes monitoring, supervised learning approaches have been frequently adopted where support vector machines (SVM) have been successfully used as they frequently demonstrate enhanced classification accuracy [13], particularly when that data is lacking in structure [14]; decision trees have also proved useful in previous work regarding glucose prediction models by various researchers [8,14].
This paper aims to contribute to the pool of ML literature for diabetes monitoring by using lifestyle data from an ergonomic wearable device to observe the extent to which glucose levels can be predicted with the application of the discriminant analysis and a support vector machine (SVM) algorithm for type 1 diabetes.

2. Materials and Methods

The data used as part of this study was obtained from 60 days of using the Fitbit Versa 2 smartwatch, which is available in the range of GBP 150–200 [15]. The smartwatch is equipped with a 3-axis accelerometer, gyroscope, optical heart rate monitor, ambient light monitor, pulse oximeter, altimeter and vibration motor. The device possesses a data storage capacity of up to 4 GB and a charge time of 1–2 h which provides 5 days’ worth of battery life, and it is able to provide a number of lifestyle parameters to its users which range from direct measures to inferred estimation, spanning sleep tracking, number of steps climbed, heart rate monitor, calories burned, stress levels, distance covered, rate of oxygen expended during exercise and blood oxygen. The smartwatch also possesses a water-resistant property of up to 50 m as a means of electronic device robustness. An image of the Fitbit Versa 2 can be seen in Figure 1.
As mentioned, the data comprised 60 days’ worth of data from a type 1 diabetic individual acquired across the summer period. The glucose level distribution spanned 4–10 mmol/L, classification exercise involved the prediction of glucose level into two discrete bands comprising ‘Excellent’, with an associated glucose level measure in the range of 4–7 mmol/L; and ‘Good’, with an associated glucose level measure in the range of 7–10 mmol/L. It should be noted that further classes could not be created due to the effective management of glucose level within a tight band by the diabetic individual. The glucose readings were monitored by the Fitbit device, where 120 samples of the glucose levels were recorded daily, therein providing a glucose sample rate of 120/day. These 120 glucose readings were averaged out to produce a corresponding glucose level reading per day, which in turn contributes towards uncertainty reduction through lessening the effect of device drift from the readings provided by the device, as per ergodic theory. The inputs used to form a feature vector in this study correspond to solely physical activity features as reported by the Fitbit and can be seen in Table 1. These features are specific activity attributes which reflect an individual’s overall activity level, which can be said to influence a person’s glucose levels.

Classification Algorithms

Discriminant Analysis: the discriminant analysis is a computationally effective means towards data classification whose class boundaries can either be linear or non-linear. The algorithm works with the framework of the reduction of a high dimensional feature vector into a reduced subset, followed by the implementation of class boundaries [17,18]. Quadratic non-linear class boundaries were used for the case study conducted in this paper, in particular the quadratic discriminant analysis (QDA), which can be mathematically formulated as follows:
ð k ( x )   = 1 2 log | Σ k | 1 2 ( x µ k ) T Σ k 1 ( x µ k ) log π k
where ð k is the QDA discriminant function, µ k is a mean vector for a specific class, k, π k is a prior probability value for each class, k, x is a feature in the feature vector and Σ k represents the pooled covariance matrix.
Support Vector Machine (SVM): the SVM is a kernel-based classification method which works towards iteratively finding an optimal separation boundary for data classes, where class boundaries are fixed using a high dimensional projection of the dataset using a computationally efficient method known as the ‘kernel trick’, where the choice of kernels range from linear to highly non-linear polynomials [18]. The optimisation problem solved by the SVM can be formulated as Equation (2), assuming a linear model:
g ( x ) = w T ·   Φ ( x ) + b
where w represents a vector weight, Φ ( x ) is the kernel map and b is the offset. Assuming a sample feature vector containing training samples x ,   i = 1 , ,   N , the objective is to find the solution to an optimisation problem framed as Equation (3):
min 1 2 w t w + R i = 1 N ζ i
w , b , ζ
s · t · y i ( w T Φ ( x i ) + b ) 1 ζ i ,
ζ i 0 ,   i = 1 , , N
where ζ represents a slack variable introduced in the case of overlapping classes, R is a regularization parameter to prevent overfit and y is an indication vector. In this work, a non-linear quadratic kernel function was used alongside the one-vs-one multiclass method.
The training for both classifiers involved a data split of 80% for training, while the remainder 20% served as the test set; both classifiers were validated using a k fold cross validation method, with k selected to be 10. The SMOTE synthetic sample generator was used to increase the number of samples and serve as a means of effective class balancing for the dataset, as has been adopted in previous studies [19].

3. Results

Three key metrics were used to assess the effectiveness of the designed classifiers, as can be seen as follows:
Classification Accuracy (CA): provides a metric which reflects the number of correct predictions with respect to the total prediction.
Precision (PR): reflects the correctly classified positives provided by a classifier against the total number of samples that were predicted as positive.
Recall (RC): assesses the amount of correctly classified positives against the total number of positive samples.
The classification results can be seen in Table 2 for both sets of classifiers, where it can be seen that the input features used as training for the classifiers possess a good prediction, as evidenced by the results. Both sets of classifiers appear to be of equivalent classification capability, with the SVM providing a slightly higher uncertainty metric relative to the QDA and is expected to be more computationally intense due to the nature of the algorithm.
A somewhat considerable uncertainty is also projected in the results across all three classification metrics, the source of which is thought to be due to a combination of daily activity fluctuation from the diabetic individual, as shown in Table 2, alongside potential errors and uncertainties from the wearable device from actions such as device drift.
Figure 2 shows a confusion plot from the SVM (left) and QDA (right), where it can be seen that the QDA provides a more balanced means of prediction, with good predictability between both classes. On the other hand, the SVM appears to be astute at predicting the samples belonging to the second class correctly, but its performance degrades strongly when considering the first class.

4. Conclusions and Future Work

The results from this study have shown that it is possible to apply ML approaches, alongside select features from daily activity, from a wearable device to predict glucose levels. Further work would now involve the inclusion of further features from the Fitbit wearable device in order to observe if it is possible to enhance the prediction accuracy of the designed model. In addition to this, a feature selection exercise can also be conducted to assess and evaluate the impactful drivers which are key predictors for the glucose prediction, in addition to alternate ML methods such as regressions and unsupervised learning [20,21].
The work carried out in this paper can contribute towards a tailored means of glucose level prediction which can facilitate effective and enhanced glucose management strategies.

Author Contributions

Conceptualization, D.A. and E.N.; methodology, D.A. and E.N.; software, D.A. and E.N.; validation, D.A. and E.N.; formal analysis, D.A. and E.N.; investigation, D.A. and E.N.; resources, D.A. and E.N.; data curation, D.A. and E.N.; writing—original draft preparation, D.A. and E.N.; writing—review and editing, D.A. and E.N.; visualization, D.A. and E.N.; project administration, E.N.; All authors have read and agreed to the published version of the manuscript.

Funding

This research has received no external funding.

Institutional Review Board Statement

Ethical review and approval were not required for this study. All data sets provided were historical and are the personal property of the authors.

Informed Consent Statement

Written consent was obtained by the owner of the data to publish the results.

Data Availability Statement

Not applicable.

Acknowledgments

The authors would like to thank Brian Kerr for his contributions to this manuscript.

Conflicts of Interest

The authors declare no conflict of interest.

References

  1. Overview Type 1 Diabetes in Adults: Diagnosis and Management Guidance NICE. Available online: https://www.nice.org.uk/guidance/ng17 (accessed on 25 August 2021).
  2. Diabetes: The Basics. Available online: https://www.diabetes.org.uk/diabetes-the-basics (accessed on 25 August 2021).
  3. Non Communicable Diseases. Available online: https://www.who.int/news-room/fact-sheets/detail/noncommunicable-diseases (accessed on 25 August 2021).
  4. Myers, J. Exercise and Cardiovascular Health. Circulation 2003, 107, e2–e5. [Google Scholar] [CrossRef] [PubMed] [Green Version]
  5. Yardley, J.E.; Kenny, G.P.; Perkins, B.A.; Riddell, M.C.; Balaa, N.; Malcolm, J.; Boulay, P.; Khandwala, F.; Sigal, R.J. Resistance versus Aerobic Exercise: Acute Effects on Glycemia in Type 1 Diabetes. Diabetes Care 2013, 36, 537–542. [Google Scholar] [CrossRef] [PubMed] [Green Version]
  6. Woldaregay, A.Z.; Årsand, E.; Walderhaug, S.; Albers, D.; Mamykina, L.; Botsis, T.; Hartvigsen, G. Data-Driven Modeling and Prediction of Blood Glucose Dynamics: Machine Learning Applications in Type 1 Diabetes. Artif. Intell. Med. 2019, 98, 109–134. [Google Scholar] [CrossRef] [PubMed]
  7. Skovlund, S.E.; Peyrot, M. The Diabetes Attitudes, Wishes, and Needs (DAWN) Program: A New Approach to Improving Outcomes of Diabetes Care. Diabetes Spectr. 2005, 18, 136–142. [Google Scholar] [CrossRef] [Green Version]
  8. Leelarathna, L.; Wilmot, E.G. Flash Forward: A Review of Flash Glucose Monitoring. Diabetes Med. 2018, 35, 472–482. [Google Scholar] [CrossRef] [PubMed] [Green Version]
  9. Nsugbe, E.; Samuel, O.W.; Asogbon, M.G.; Li, G. Phantom Motion Intent Decoding for Transhumeral Prosthesis Control with Fused Neuromuscular and Brain Wave Signals. IET Cyber-Syst. Robot. 2021, 3, 77–88. [Google Scholar] [CrossRef]
  10. Nsugbe, E.; Obajemu, O.; Samuel, O.W.; Sanusi, I. Enhancing Care Strategies for Preterm Pregnancies by Using a Prediction Machine to Aid Clinical Care Decisions. Mach. Learn. Appl. 2021, 6, 100110. [Google Scholar] [CrossRef]
  11. Mancini, G.; Berioli, M.; Santi, E.; Rogari, F.; Toni, G.; Tascini, G.; Crispoldi, R.; Ceccarini, G.; Esposito, S. Flash Glucose Monitoring: A Review of the Literature with a Special Focus on Type 1 Diabetes. Nutrients 2018, 10, 992. [Google Scholar] [CrossRef] [PubMed] [Green Version]
  12. Moser, O.; Yardley, J.; Bracken, R. Interstitial Glucose and Physical Exercise in Type 1 Diabetes: Integrative Physiology, Technology, and the Gap In-Between. Nutrients 2018, 10, 93. [Google Scholar] [CrossRef] [PubMed] [Green Version]
  13. Kavakiotis, I.; Tsave, O.; Salifoglou, A.; Maglaveras, N.; Vlahavas, I.; Chouvarda, I. Machine Learning and Data Mining Methods in Diabetes Research. Comput. Struct. Biotechnol. J. 2017, 15, 104–116. [Google Scholar] [CrossRef] [PubMed]
  14. Sonar, P.; JayaMalini, K. Diabetes Prediction Using Different Machine Learning Approaches. In Proceedings of the 2019 3rd International Conference on Computing Methodologies and Communication (ICCMC), Erode, India, 27–29 March 2019; pp. 367–371. [Google Scholar]
  15. Fitbit Versa 2 Health & Fitness Smartwatch with Voice Control, Sleep Score & Music, Bordeaux, One Size, Exclusive to Amazon: Amazon.Co.Uk: Electronics & Photo. Available online: https://www.amazon.co.uk/Fitbit-Fitness-Smartwatch-Control-Bordeaux/dp/B07TWFWJDZ/ref=asc_df_B07TWFWJDZ/?tag=googshopuk-21&linkCode=df0&hvadid=381576046937&hvpos=&hvnetw=g&hvrand=1784791009843063600&hvpone=&hvptwo=&hvqmt=&hvdev=c&hvdvcmdl=&hvlocint=&hvlocphy=9045605&hvtargid=pla-817150174249&psc=1&th=1&psc=1&tag=&ref=&adgrpid=79549112322&hvpone=&hvptwo=&hvadid=381576046937&hvpos=&hvnetw=g&hvrand=1784791009843063600&hvqmt=&hvdev=c&hvdvcmdl=&hvlocint=&hvlocphy=9045605&hvtargid=pla-817150174249 (accessed on 25 August 2021).
  16. 233812-FITBIT Versa 2 with Amazon Alexa-Emerald & Copper Rose-Currys Business. Available online: https://business.currys.co.uk/catalogue/cameras-smart-tech/smart-tech/smart-watches-fitness/fitbit-versa-2-with-amazon-alexa-emerald-copper-rose/N555832W?cidp=Froogle&gclid=CjwKCAjwjJmIBhA4EiwAQdCbxpT0sUi09uhsVuglC3AaA6z7R6ivjTY2CwDagv-CcFVow3l3UfWjxRoCgqoQAvD_BwE&gclsrc=aw.ds (accessed on 25 August 2021).
  17. Nsugbe, E.; Phillips, C.; Fraser, M.; McIntosh, J. Gesture Recognition for Transhumeral Prosthesis Control Using EMG and NIR. IET Cyber-Syst. Robot. 2020, 2, 122–131. [Google Scholar] [CrossRef]
  18. Nsugbe, E.; Samuel, O.W.; Asogbon, M.G.; Li, G. Contrast of Multi-Resolution Analysis Approach to Transhumeral Phantom Motion Decoding. CAAI Trans. Intell. Technol. 2021, 6, 360–375. [Google Scholar] [CrossRef]
  19. Brownlee, J. SMOTE for Imbalanced Classification with Python; Machine Learning Mastery: San Juan, PR, USA, 2020. [Google Scholar]
  20. Nsugbe, E.; Ruiz-Carcel, C.; Starr, A.; Jennions, I. Estimation of Fine and Oversize Particle Ratio in a Heterogeneous Compound with Acoustic Emissions. Sensors 2018, 18, 851. [Google Scholar] [CrossRef] [PubMed] [Green Version]
  21. Nsugbe, E.; Samuel, O.W.; Asogbon, M.G.; Li, G. A Self-Learning and Adaptive Control Scheme for Phantom Prosthesis Control Using Combined Neuromuscular and Brain-Wave Bio-Signals. Eng. Proc. 2020, 2, 59. [Google Scholar] [CrossRef]
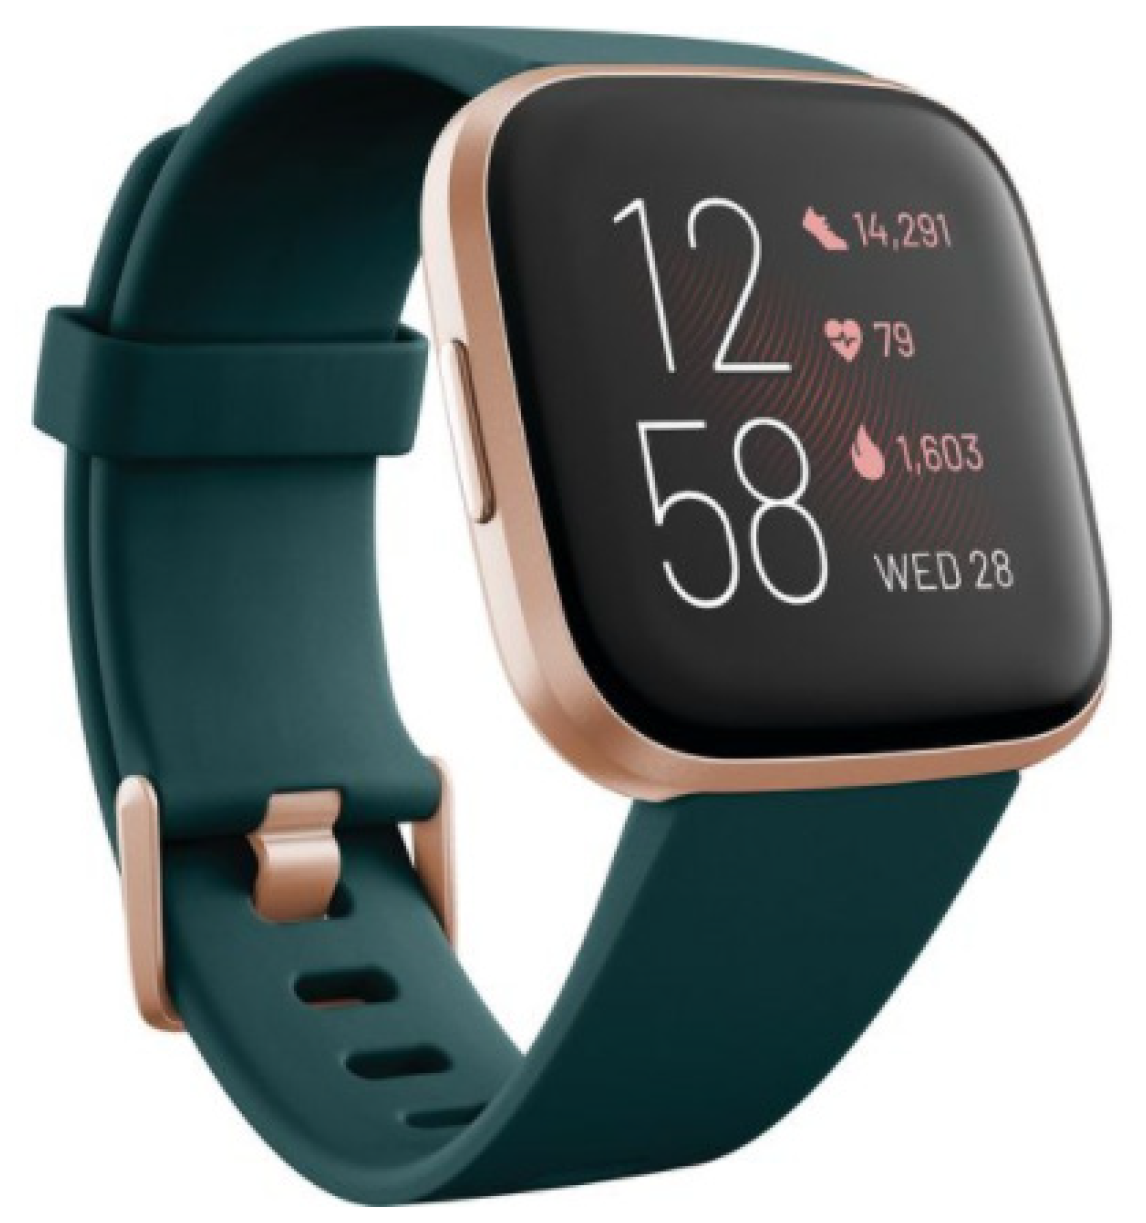
Figure 1. Image of Fitbit Versa 2 device [16].
Engproc 10 00020 g001
Figure 2. SVM confusion plot (Left) and QDA confusion plot (Right).
Engproc 10 00020 g002
Table 1. Features and associated range.
Feature *Range
Calories(kcal) 1500–2000
Number of steps1000–20,000
Distance(miles)0.70–13.50
Minutes sedentary300–1500
Activity calories(kcal)200–1500
* A cumulative daily value of each feature was produced by the Fitbit device.
Table 2. Results of the classification exercise alongside the various metrics.
ClassifierCAPRRC
QDA72.3 ± 1.668.9 ± 3.874.4 ± 1.8
SVM72.6 ± 2.469.0 ± 3.574.2 ± 2.3
Publisher’s Note: MDPI stays neutral with regard to jurisdictional claims in published maps and institutional affiliations.