Abstract
Forest areas are profoundly important to the planet, since they offer considerable advantages. The mapping and estimation of burned areas covered with trees are critical during decision making processes. In such cases, remote sensing can be of great help. This paper presents a method to estimate burned areas based on the Sentinel-2 imagery using a convolutional neural network (CNN) algorithm. The framework touches change detection using pre- and post-fire datasets. The proposed framework utilizes a multi-scale convolution block to extract deep features. We investigate the performance of the proposed method via visual and numerical analyses. The case study for this research is Golestan Forest, which is located in the north of Iran. The results of the burned area detection process show that the proposed method produces a performance accuracy rate of more than 97% in terms of overall accuracy, with a Kappa score greater than 0.933.
1. Introduction
Forest areas perform an irreplaceable role in maintaining ecological balance on earth, as well as in purifying the very air we breathe as humans; that is, they absorb the carbon dioxide that we breathe out and then convert it back to oxygen [1]. Accordingly, they help increase the quality of the air we use. Forests—areas of land dominated by trees—are multifunctional and multivalued ecosystems that are widely scattered across land surfaces, bringing enormous advantages to human life. The world’s forests cover about 4 billion hectares, which is equivalent to 29% of the Earth’s land area, playing an important role in the quality of human life [2]. The per capita forest area globally is 6 hectares.
Natural disasters are defined as unpredictable and uncontrollable events that threaten people’s lives and activities [3]. Forest fires are viewed as catastrophic events that cause extensive damage to the environment each year, having adverse effects on forest quality and public safety [4,5].
Since fire destroys vegetation and reduces diversity, it may lead to deforestation and desertification. Recent large-scale forest fires have had detrimental impacts on vegetation structures, forest fertility, and ecosystem carbon storage, and have led to potential increases in soil erosion and invasion of foreign plant species [6,7,8].
In recent decades, the use of remote sensing as an effective means of analysis and optimal fire management, both before and after fire occurrence, has increased [9,10]. Remote sensing satellite sensors with appropriate spatial and temporal resolution provide crucial information for early fire alarms. This technology enables one to examine the contributing factors to the occurrence of forest fires, and according to the obtained results, to provide effective solutions for the management and prediction of the risk factors [6,11,12].
The detection of burned forest areas by remote sensing imagery has drawn the attention of many researchers [4,13,14,15]. For this reason, a large number of studies have been conducted to estimate burned areas using remote sensing techniques [16,17,18].
The mentioned methods combine the original spectral bands with spatial and spectral features. In order to extract spectral features, spectral indices such as the normalized burned ratio index and normalized vegetation index are used. On the other hand, to extract spatial features, texture features such as the variance, mean, and correlation are employed. Furthermore, burned areas are often extracted using the most common classification methods, such as random forest (RF), support vector machine (SVM), and multi-layer perception (MLP) methods. Although these frameworks provide fairly acceptable results, producing more satisfactory outcomes demands a more sophisticated method. Achieving this aim depends on certain determining factors, including the classification algorithm and input features. Deep-learning-based methods, representing one of the main subsets of machine learning, have recently been capable of yielding reliable results, and in turn have been used in many remote sensing applications, such as environment monitoring [19,20], change detection [21,22,23], target detection [24], and damage detection [25]. This study proposes a framework based on a deep learning method that is able to detect burned areas using high-resolution Sentinel-2 imagery. In this study, the burned area mapping framework is applied in three phases, namely (1) pre-processing, (2) model optimization, and (3) burned area mapping, based on an optimized model. The key contributions of this research are as follows:
- (I)
- We present a CNN architecture framework to map burned forest areas;
- (II)
- The proposed framework is able to extract the burned areas using only three spectral bands.
2. Methodology
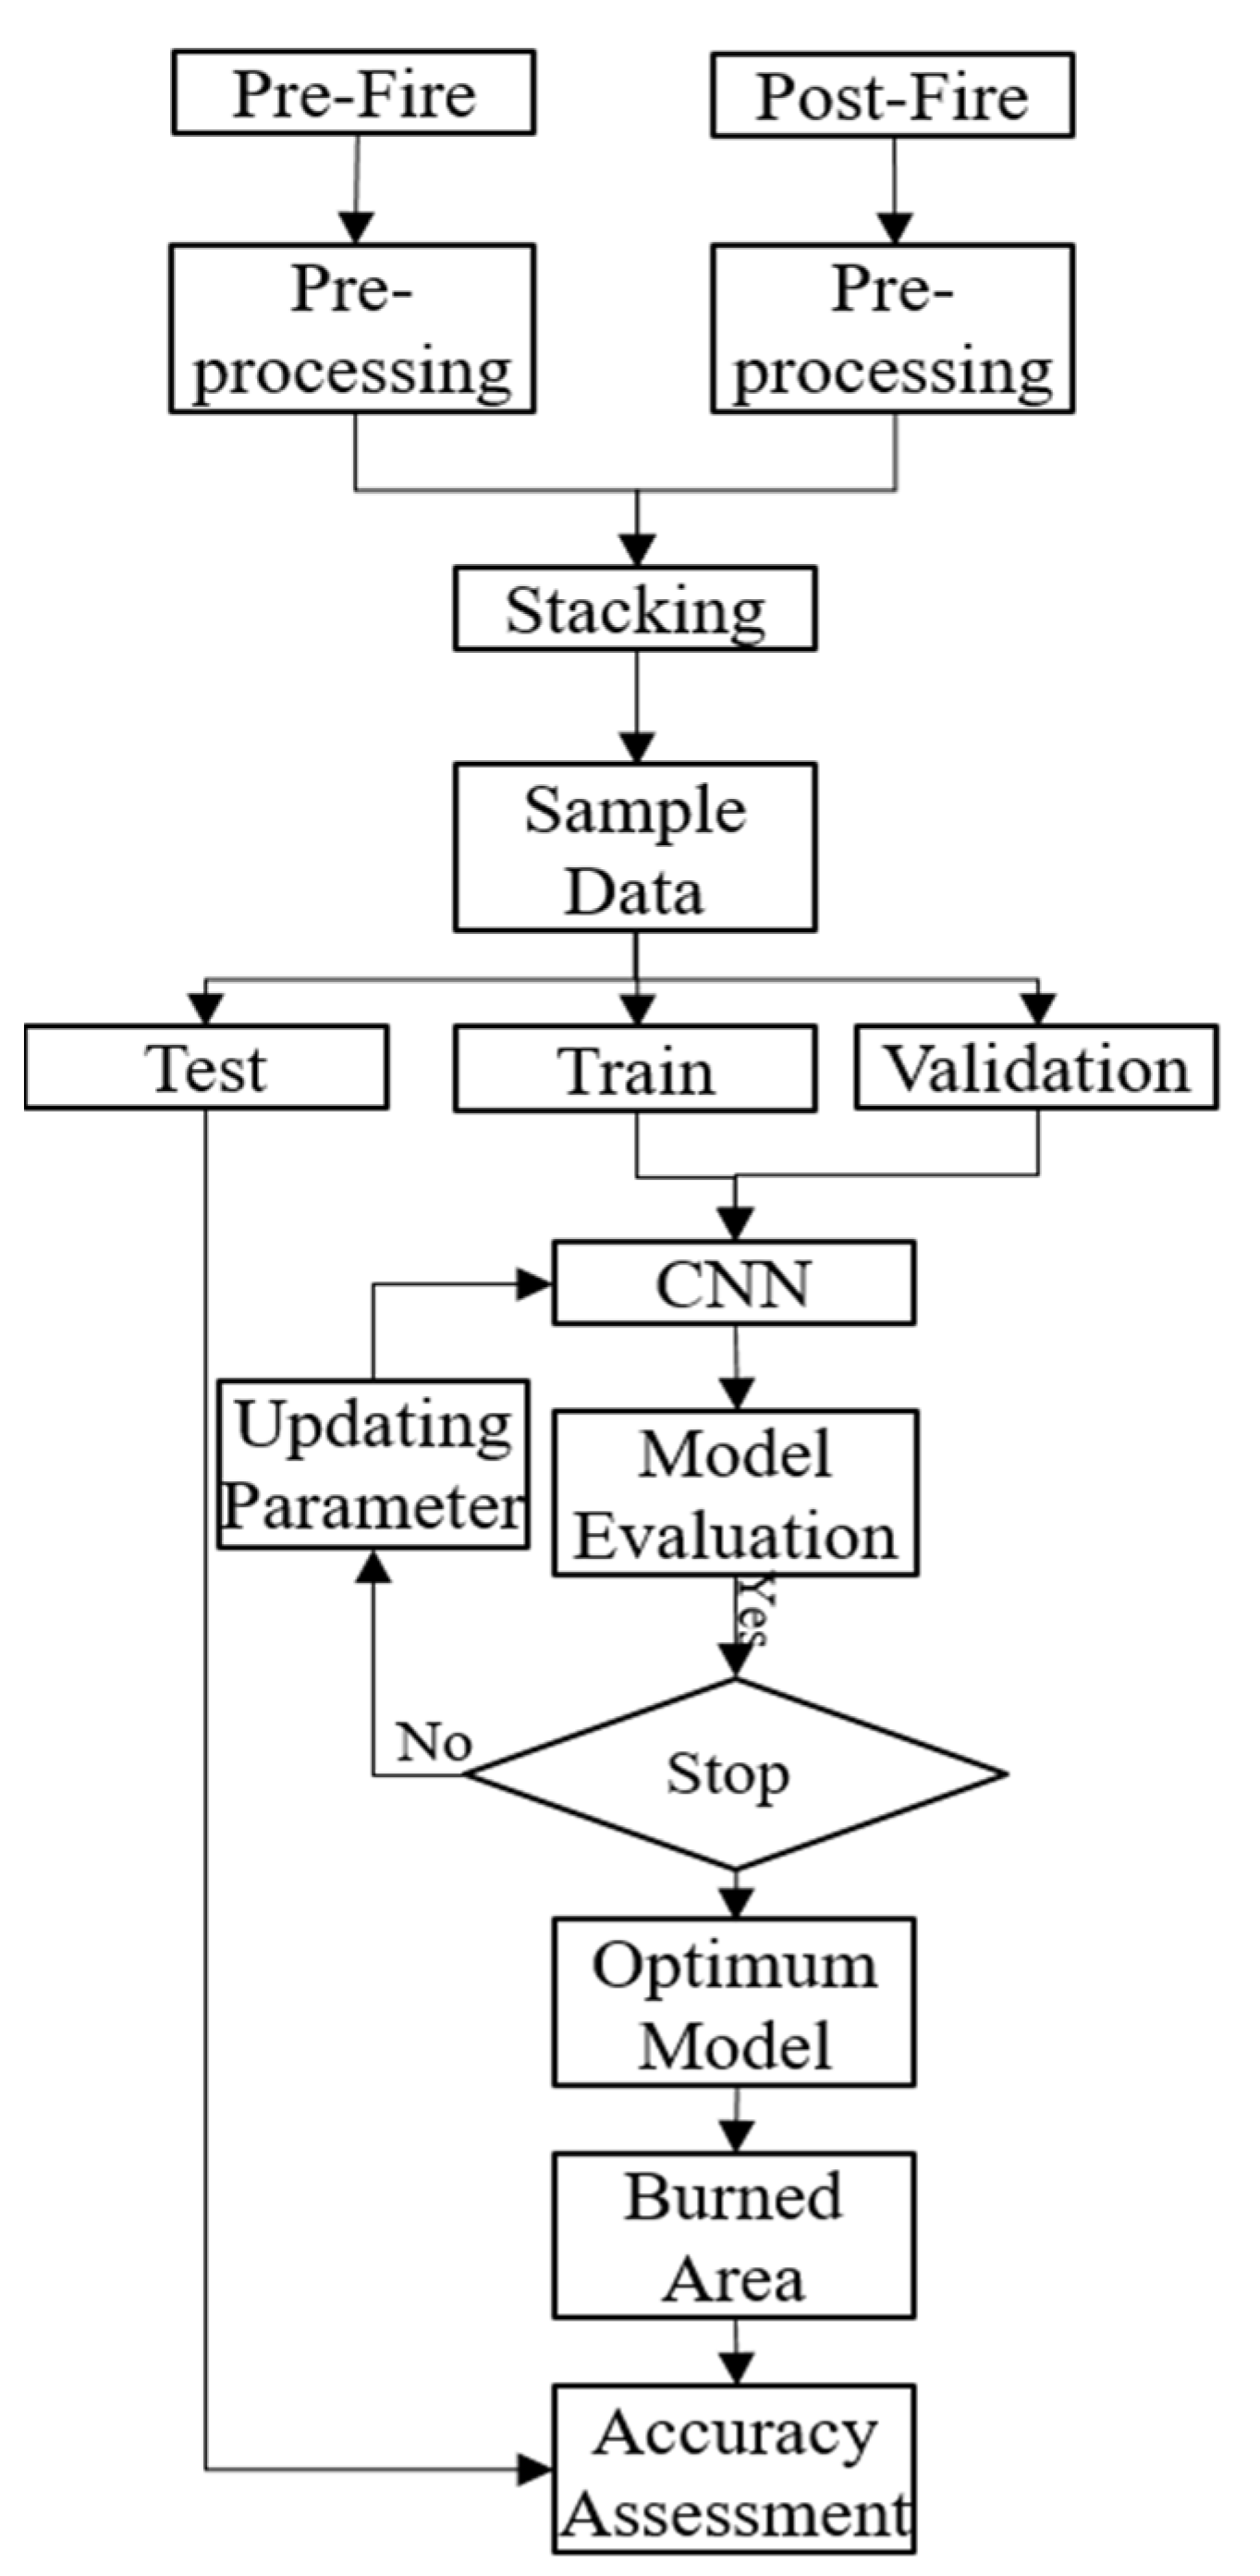
This section deals with the details of the proposed method, which can be applied based on the flowchart presented in Figure 1.

Figure 1.
General overview of the burned area detection process performed by the proposed framework.
Based on the flowchart, the pre-processing stage is first performed, which involves converting digital numbers to surface reflectance values. This is possible using the Sen2cor module in Snap software. Then, the pre-fire and post-fire datasets are stacked and used for the next analysis. The second step involves sample data collection (the method we propose operates in a supervised manner and requires training data). In the third step, the proposed deep leaning framework is trained to optimize the parameters. The final step is to detect burned areas using the trained CNN.
Proposed Architecture
Advanced deep-learning-based frameworks have many parameters that require numerous sample data. Collecting a large amount of sample data is very time-consuming and challenging. In this regard, we propose an efficient CNN framework to map the burned areas. The proposed approach employs a multi-scale convolution block to improve the efficiency of the proposed framework, resolving the issue of the variation in object size. Later on, the deep features are extracted using standard convolution layers.
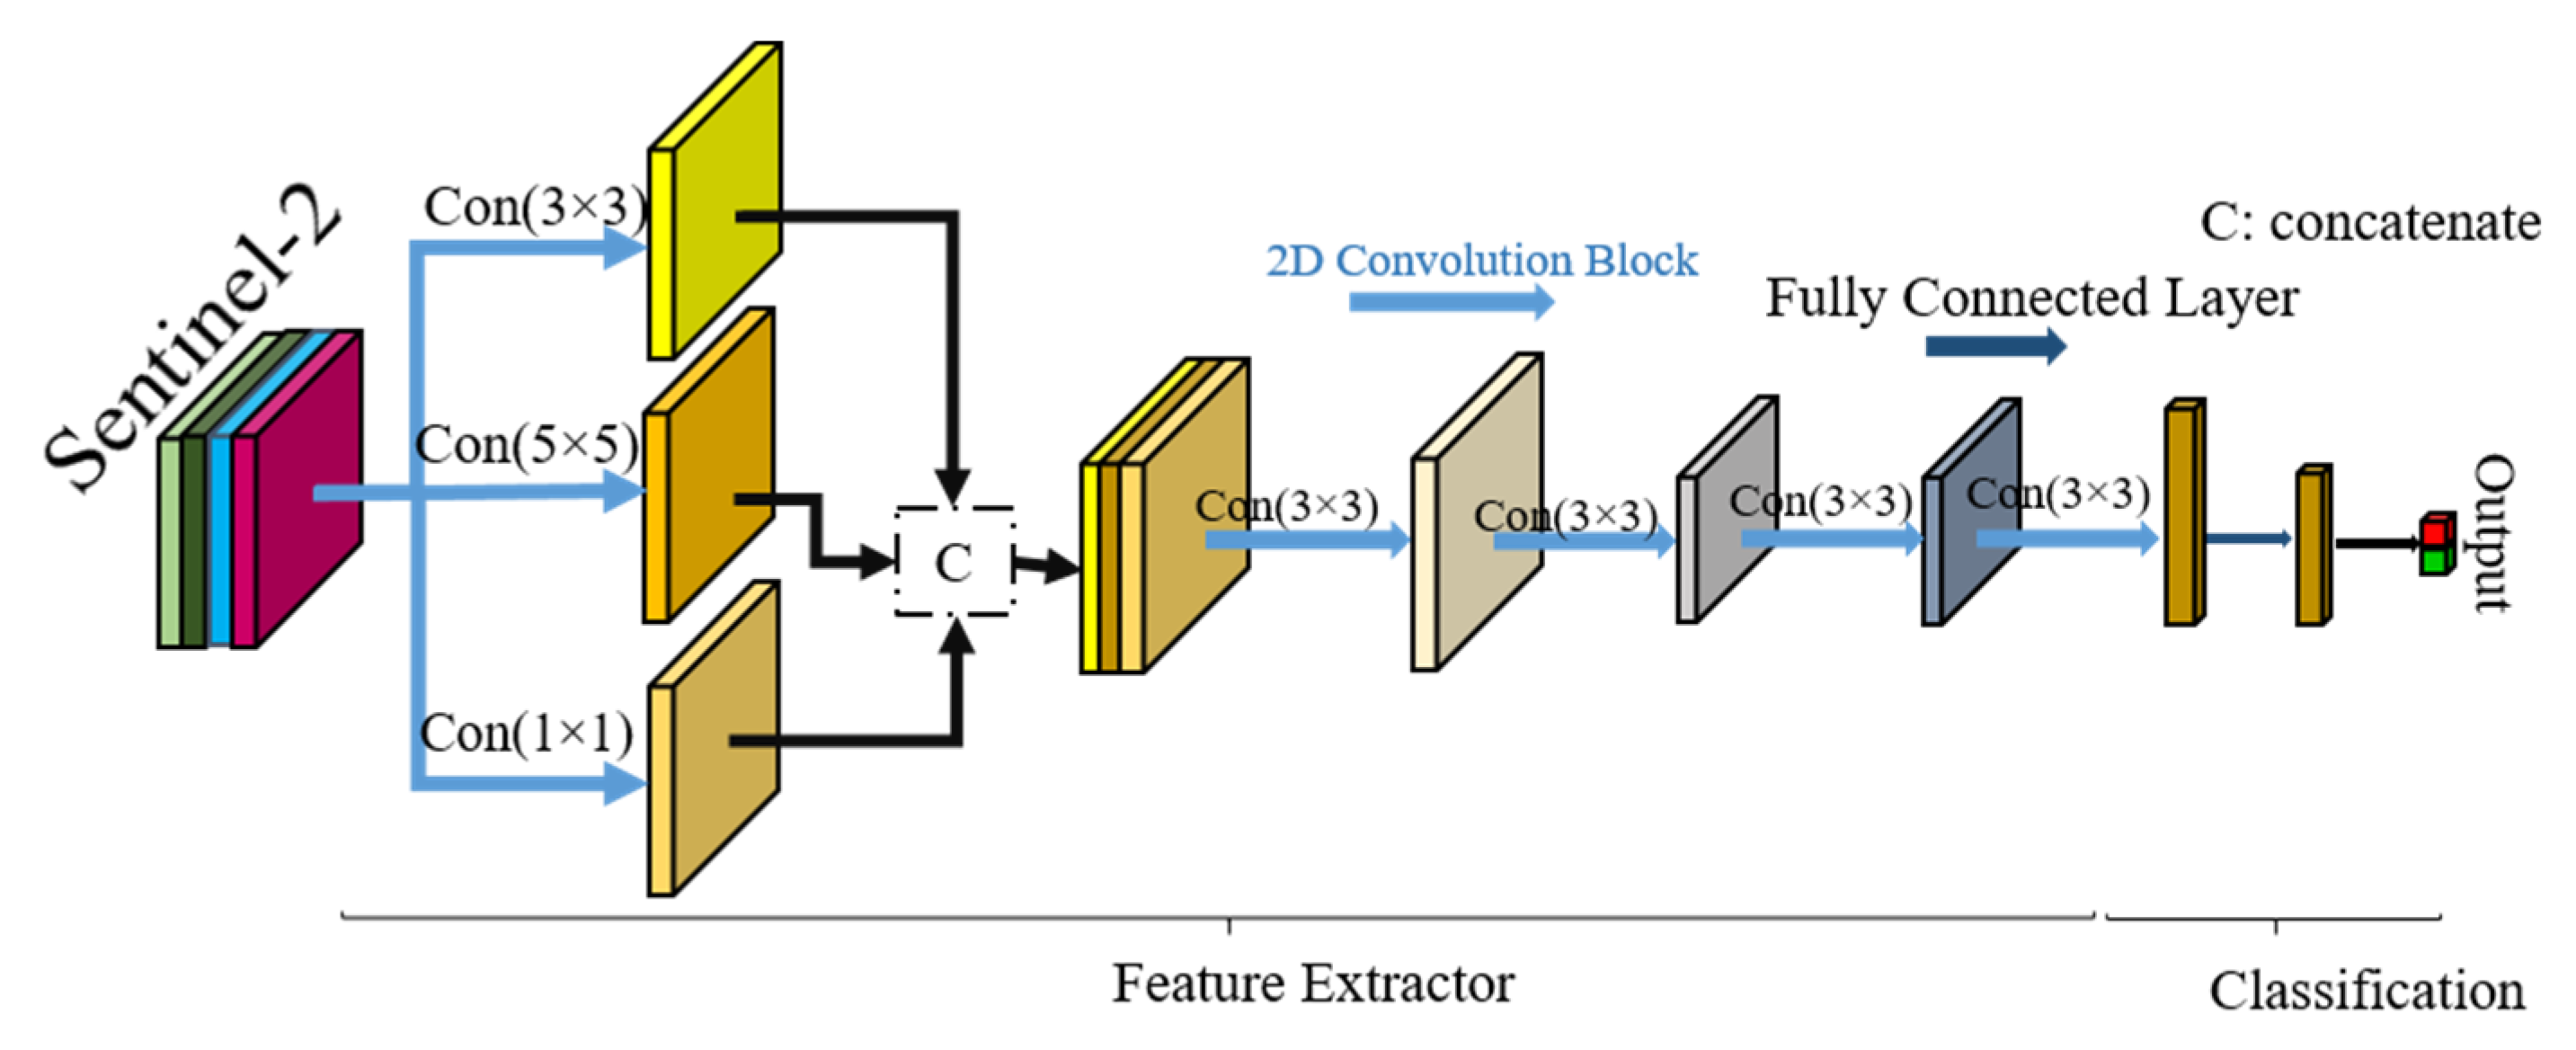
The CNN uses stacked convolutional kernels to extract deep features of the images. These convolution blocks can extract the spectral and spatial features automatically [10,15,25,26]. The CNN establishes a connection between the input data and the output labels to obtain the classification results. This framework consists of two main parts. The principal task of the first part is to extract the deep features using convolution layers [26,27]. The second part classifies these features. This stage takes extracted deep features as inputs and classifies them using a softmax layer [28,29]. Figure 2 illustrates the principal architecture of the proposed framework. The proposed CNN network has 5 convolution layers with a nonlinear activation function and batch normalization.
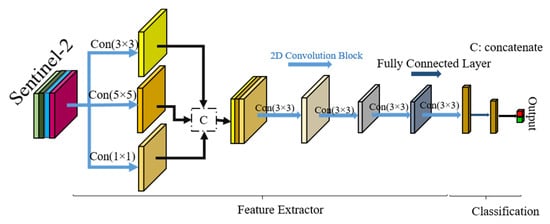
Figure 2.
Proposed CNN architecture for burned area detection.
Based on this architecture, the proposed framework offers five convolution layers with different kernel sizes ((1 × 1), (3 × 3), and (5 × 5)) and two fully connected layers (the first one holds 1500 neurons and the second layer holds 500 neurons). At first, the deep features are extracted by three multi-scale kernel convolution layers. The multi-scale kernel convolution increases the robustness of the network again to scale the objects. Then, three 2D convolution layers extract the deep features. Finally, the extracted deep features are fed to two fully connected layers. This architecture has an input with a patch size of (13 × 13) that finally assigns a label for the corresponding patch.
3. Case Study and Dataset
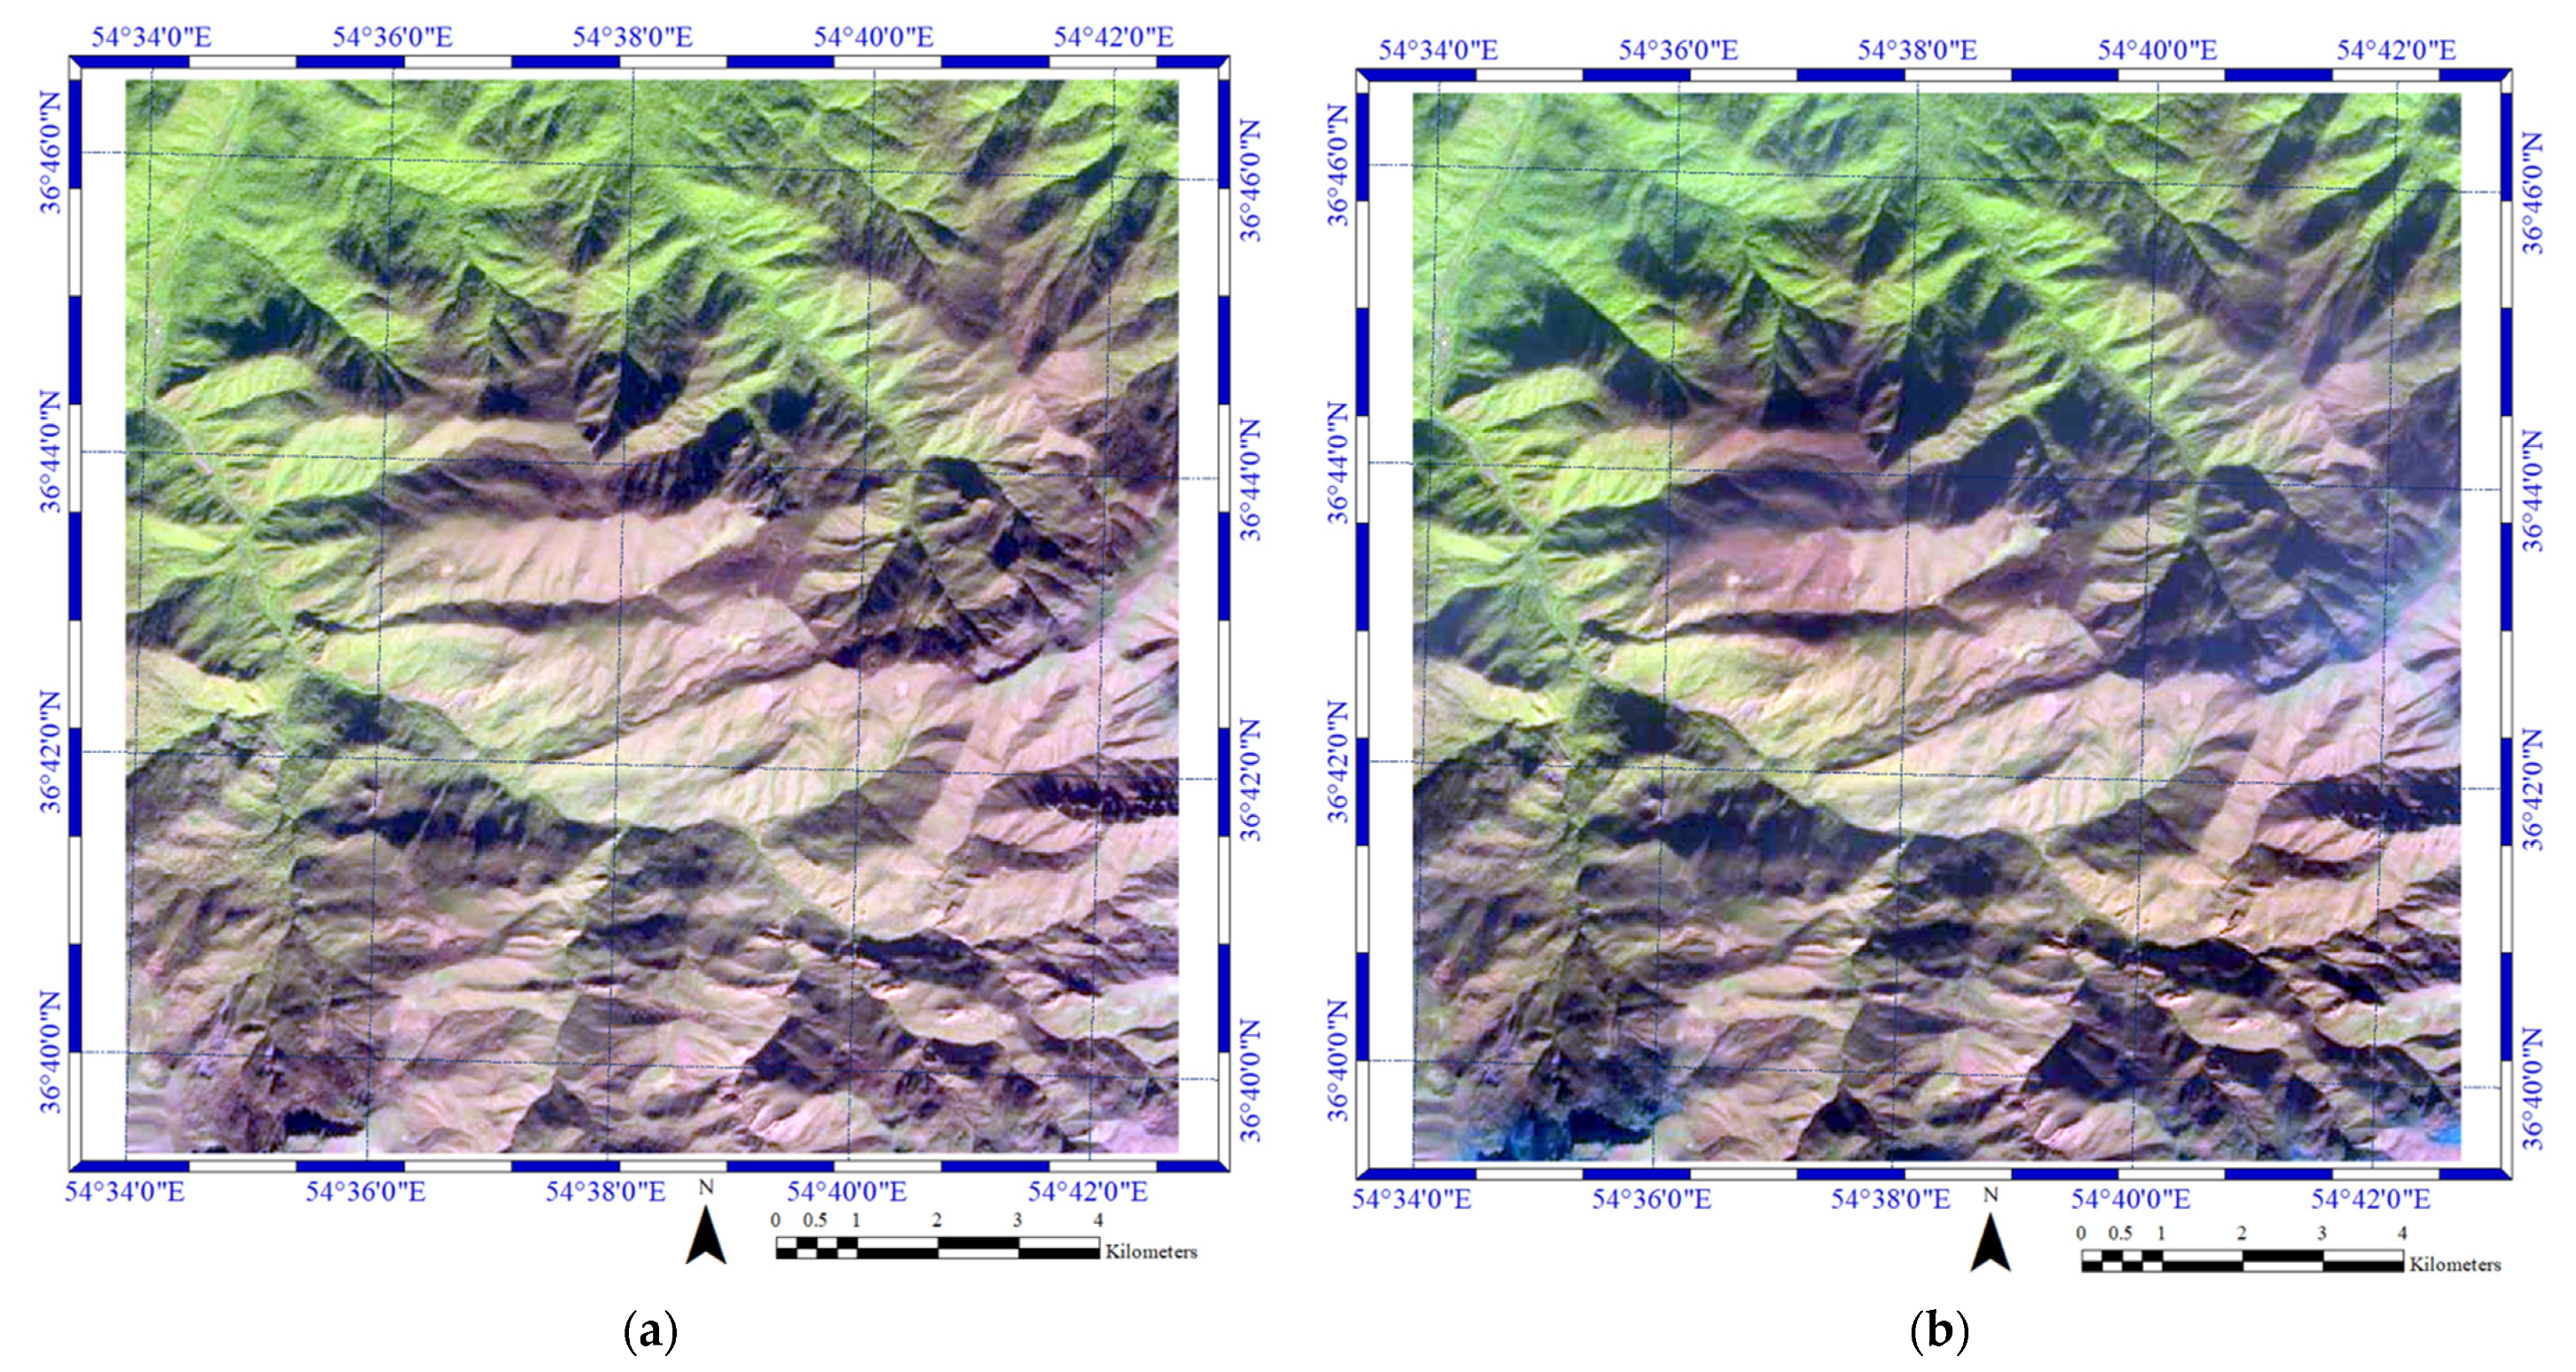
The study area of this dataset is located in the north of Iran in Golestan province. A forest fire occurred in this area and destroyed some parts of it. Figure 3 presents the pre- and post-fire datasets used in this research.

Figure 3.
(a,b) Pre-fire and prost-fire datasets for 31 October and 15 November 2020, respectively, in Golestan, Iran.
In this study, we employed the Sentinel-2 imagery, which was launched by the European Space Agency (ESA) on 23 June 2015. The Sentinel-2 sensor has 13 spectral bands with spatial resolutions of 10 to 60 m in the visible, near-infrared, and short-wave infrared bands of the electromagnetic spectrum. The temporal resolution of this sensor is around 5 days. It is worth mentioning that the Sentinel-2 dataset is free and can be downloaded from this website (https://scihub.copernicus.eu/, accessed on 1 November 2021). Table 1 presents the main characteristics of the dataset used in this research.

Table 1.
The characteristics of the dataset used in this research.
4. Experiment and Results
Data sampling is an impotent part of the burned area detection process. To this end, 4542 pixels are selected here as sample data to detect the burned area. Theses samples are obtained by field view from the burned areas. The sample data are divided into three main parts, including training data, validation data, and testing data. Table 2 presents the details of the sample data.
Table 2.
The characteristics of the dataset used in this research.
The optimum value of CNN parameters are: epochs = 500, weight initializer random, dropout rate = 0.3, initial learning = 10−3, epsilon value = 10−10, mini-batch size = 500, loss function = binary cross entropy, optimizers = stochastic gradient descent (SGD).
The results of the burned area detection process performed by the proposed framework are presented in Figure 4. The figure indicates that most burned areas are detected by this algorithm (Figure 4a shows active fire areas). In order to visually evaluate the presented algorithm, we used the images of where the fire was happening. Taking a closer look, we can see that the burned areas are perfectly matched with the positions of active fires in the figure. However, some false detection in the form of small areas can be seen around the burned areas.
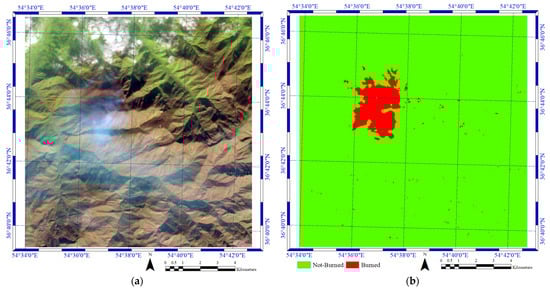
Figure 4.
(a) Active fires in the case study captured on 5 November 2020 and (b) the results of the burned area detection process performed by the proposed method.
The result of implementing this algorithm on the testing dataset demonstrated how efficient the proposed method is in detecting burned areas. We used the test data to evaluate the algorithm and reached an accuracy rate of 97.04% for the overall accuracy (O.A.) index, 0.933 for the Kappa, and 0.977 for the F1-Score.
The ablation analysis is crucial to artificial intelligence methods, the main purpose of which is to remove a part of the system to gain insights into its effects on overall performance. Table 3 presents the results of the ablation analysis performed by the proposed method to map the burned areas.
Table 3.
The results of the ablation analysis.
Based on the ablation analysis, the dropout has the greatest effect on the performance of the network in terms of classification. Furthermore, the impact of the fully connected layers is very low and can be ignored. Based on the obtained results, it turns out that the suggested method maintains high efficiency in identifying burned areas. The most important advantage of this method is that it operates with three spectral bands, while other methods are based on machine learning algorithms, such as support vector machine (SVM), random forest (RF), or multi-layer perceptron (MLP) methods. The burned area mapping was conducted based on the RF and SVM algorithms, and yielded an accuracy close to 95% in terms of the overall accuracy index. The proposed method achieved an accuracy higher than 97%, while it uses only three spectral bands. Additionally, the proposed approach is able to extract deep features automatically, while other machine learning methods need to extract features manually. The proposed method has a lower number of convolution layers, which helps expedite the training process. Additionally, the computational cost is lower than for other state-of-the-art deep-learning-based methods.
5. Conclusions
This paper presents a framework for burned area detection in Golestan Forest, which is located in the north of Iran. In order to detect burned areas, we utilized Sentinel-2 imagery so that only three bands were applied. According to the achieved results, 165.8 hectares of Golestan Forest was burned by recent fires.
The results of the proposed framework are assessed visually and numerically. Based on this analysis, the proposed CNN framework yields satisfactory results in mapping the burned areas, achieving an accuracy rate of more than 97% for the testing dataset, with low classification error. Overall, the proposed deep learning method offers some distinct advantages, namely that (1) it delivers great performance in mapping burned areas using only three spectral bands, (2) is robust and simple compared to other state-of-the-art methods, and (3) has the capacity to extract deep features automatically.
Author Contributions
Conceptualization, S.T.S. and F.H.M.; methodology, S.T.S. and F.H.M.; visualization, S.T.S.; supervision, F.H.M.; funding acquisition, F.H.M.; writing—original draft preparation, S.T.S. and F.H.M.; writing—review and editing, S.T.S. and F.H.M. All authors have read and agreed to the published version of the manuscript.
Funding
This research received no external funding.
Institutional Review Board Statement
Not applicable.
Informed Consent Statement
Not applicable.
Data Availability Statement
Publicly available datasets were analyzed in this study.
Acknowledgments
The authors would like to thank the European Space Agency (ESA) for providing the Sentinel-2 Level-1C products.
Conflicts of Interest
The authors declare no conflict of interest.
References
- Reichle, D. Relation of body size to food intake, oxygen consumption, and trace element metabolism in forest floor arthropods. Ecology 1968, 49, 538–542. [Google Scholar] [CrossRef]
- Poker, J.; MacDicken, K. Tropical Forest Resources: Facts and Tables. In Tropical Forestry Handbook; Springer: Berlin/Heidelberg, Germany, 2016; pp. 3–45. [Google Scholar]
- Abbott, P.L. Natural Disasters; McGraw-Hill: New York, NY, USA, 2008. [Google Scholar]
- Pulvirenti, L.; Squicciarino, G.; Fiori, E.; Fiorucci, P.; Ferraris, L.; Negro, D.; Gollini, A.; Severino, M.; Puca, S. An Automatic Processing Chain for Near Real-Time Mapping of Burned Forest Areas Using Sentinel-2 Data. Remote Sens. 2020, 12, 674. [Google Scholar] [CrossRef] [Green Version]
- Saulino, L.; Rita, A.; Migliozzi, A.; Maffei, C.; Allevato, E.; Garonna, A.P.; Saracino, A. Detecting Burn Severity across Mediterranean Forest Types by Coupling Medium-Spatial Resolution Satellite Imagery and Field Data. Remote Sens. 2020, 12, 741. [Google Scholar] [CrossRef] [Green Version]
- Gibson, R.; Danaher, T.; Hehir, W.; Collins, L. A remote sensing approach to mapping fire severity in south-eastern Australia using sentinel 2 and random forest. Remote Sens. Environ. 2020, 240, 111702. [Google Scholar] [CrossRef]
- Palaiologou, P.; Essen, M.; Hogland, J.; Kalabokidis, K. Locating Forest Management Units Using Remote Sensing and Geostatistical Tools in North-Central Washington, USA. Sensors 2020, 20, 2454. [Google Scholar] [CrossRef] [PubMed]
- Roteta, E.; Oliva, P. Optimization of A Random Forest Classifier for Burned Area Detection in Chile Using Sentinel-2 Data. In Proceedings of the 2020 IEEE Latin American GRSS & ISPRS Remote Sensing Conference (LAGIRS), Santiago, Chile, 22–26 March 2020; pp. 568–573. [Google Scholar]
- Seydi, S.T.; Hasanlou, M.; Amani, M. A New End-to-End Multi-Dimensional CNN Framework for Land Cover/Land Use Change Detection in Multi-Source Remote Sensing Datasets. Remote Sens. 2020, 12, 2010. [Google Scholar] [CrossRef]
- Seydi, S.; Hasanlou, M. Binary Hyperspectral Change Detection Based on 3d Convolution Deep Learning. Int. Arch. Photogramm. Remote Sens. Spat. Inf. Sci. 2020, 43, 1629–1633. [Google Scholar] [CrossRef]
- Chen, X.; Vogelmann, J.E.; Rollins, M.; Ohlen, D.; Key, C.H.; Yang, L.; Huang, C.; Shi, H. Detecting post-fire burn severity and vegetation recovery using multitemporal remote sensing spectral indices and field-collected composite burn index data in a ponderosa pine forest. Int. J. Remote Sens. 2011, 32, 7905–7927. [Google Scholar] [CrossRef]
- Chuvieco, E.; Congalton, R.G. Application of remote sensing and geographic information systems to forest fire hazard mapping. Remote Sens. Environ. 1989, 29, 147–159. [Google Scholar] [CrossRef]
- Pessôa, A.C.M.; Anderson, L.O.; Carvalho, N.S.; Campanharo, W.A.; Junior, C.H.; Rosan, T.M.; Reis, J.B.; Pereira, F.R.; Assis, M.; Jacon, A.D. Intercomparison of Burned Area Products and Its Implication for Carbon Emission Estimations in the Amazon. Remote Sens. 2020, 12, 3864. [Google Scholar] [CrossRef]
- Mpakairi, K.S.; Kadzunge, S.L.; Ndaimani, H. Testing the utility of the blue spectral region in burned area mapping: Insights from savanna wildfires. Remote Sens. Appl. Soc. Environ. 2020, 20, 100365. [Google Scholar] [CrossRef]
- Knopp, L.; Wieland, M.; Rättich, M.; Martinis, S. A Deep Learning Approach for Burned Area Segmentation with Sentinel-2 Data. Remote Sens. 2020, 12, 2422. [Google Scholar] [CrossRef]
- Zhang, Z.; Long, T.; He, G.; Wei, M.; Tang, C.; Wang, W.; Wang, G.; She, W.; Zhang, X. Study on Global Burned Forest Areas Based on Landsat Data. Photogramm. Eng. Remote Sens. 2020, 86, 503–508. [Google Scholar] [CrossRef]
- Boer, M.M.; Macfarlane, C.; Norris, J.; Sadler, R.J.; Wallace, J.; Grierson, P.F. Mapping burned areas and burn severity patterns in SW Australian eucalypt forest using remotely-sensed changes in leaf area index. Remote Sens. Environ. 2008, 112, 4358–4369. [Google Scholar] [CrossRef]
- Fraser, R.; Li, Z.; Cihlar, J. Hotspot and NDVI differencing synergy (HANDS): A new technique for burned area mapping over boreal forest. Remote Sens. Environ. 2000, 74, 362–376. [Google Scholar] [CrossRef]
- Hasanlou, M.; Seydi, S.T. Use of Multispectral and Hyperspectral Satellite Imagery for Monitoring Waterbodies and Wetlands. In Southern Iraq’s Marshes; Springer: Berlin/Heidelberg, Germany, 2021; pp. 155–181. [Google Scholar]
- Izadi, M.; Sultan, M.; Kadiri, R.E.; Ghannadi, A.; Abdelmohsen, K. A Remote Sensing and Machine Learning-Based Approach to Forecast the Onset of Harmful Algal Bloom. Remote Sens. 2021, 13, 3863. [Google Scholar] [CrossRef]
- Ahangarha, M.; Seydi, S.T.; Shahhoseini, R. Hyperspectral Change Detection in Wetland and Water-Body Areas Based on Machine Learning. In Proceedings of the International Archives of the Photogrammetry, Remote Sensing & Spatial Information Sciences, Karaj, Iran, 12–14 October 2019. [Google Scholar]
- Seydi, S.T.; Hasanlou, M. A New Structure for Binary and Multiple Hyperspectral Change Detection Based on Spectral Unmixing and Convolutional Neural Network. Measurement 2021, 186, 110137. [Google Scholar] [CrossRef]
- Seydi, S.T.; Shah-Hosseini, R.; Hasanlou, M. New framework for hyperspectral change detection based on multi-level spectral unmixing. Appl. Geomat. 2021, 13, 763–780. [Google Scholar] [CrossRef]
- Li, K.; Wan, G.; Cheng, G.; Meng, L.; Han, J. Object detection in optical remote sensing images: A survey and a new benchmark. ISPRS J. Photogramm. Remote Sens. 2020, 159, 296–307. [Google Scholar] [CrossRef]
- Seydi, S.; Rastiveis, H. A deep learning framework for roads network damage assessment using post-earthquake lidar data. Int. Arch. Photogramm. Remote Sens. Spat. Inf. Sci. 2019, 42, 955–961. [Google Scholar] [CrossRef] [Green Version]
- Ozdemir, A.; Polat, K. Deep learning applications for hyperspectral imaging: A systematic review. J. Inst. Electron. Comput. 2020, 2, 39–56. [Google Scholar] [CrossRef]
- Khelifi, L.; Mignotte, M. Deep Learning for Change Detection in Remote Sensing Images: Comprehensive Review and Meta-Analysis. arXiv 2020, arXiv:2006.05612. Available online: https://arxiv.org/abs/2006.05612 (accessed on 10 June 2020). [CrossRef]
- Hong, S.; Zhou, Y.; Shang, J.; Xiao, C.; Sun, J. Opportunities and challenges of deep learning methods for electrocardiogram data: A systematic review. Comput. Biol. Med. 2020, 103801. [Google Scholar] [CrossRef] [PubMed]
- Yuan, Q.; Shen, H.; Li, T.; Li, Z.; Li, S.; Jiang, Y.; Xu, H.; Tan, W.; Yang, Q.; Wang, J. Deep learning in environmental remote sensing: Achievements and challenges. Remote Sens. Environ. 2020, 241, 111716. [Google Scholar] [CrossRef]

Publisher’s Note: MDPI stays neutral with regard to jurisdictional claims in published maps and institutional affiliations. |
© 2021 by the authors. Licensee MDPI, Basel, Switzerland. This article is an open access article distributed under the terms and conditions of the Creative Commons Attribution (CC BY) license (https://creativecommons.org/licenses/by/4.0/).