Abstract
Optical spectroscopy is a versatile analytical technique with a diverse range of applications. Point-of-need systems are required to be affordable, miniaturized instruments that are easy to use. This paper proposes using an array of LEDs to create paired emitter detector diodes where commercial LEDs function as both a light source and detector. This system can measure the concentration of different chemicals via a set of discrete wavelengths. Calibration curves are presented for series of known concentrations of three water treatment chemicals using the K-matrix method. The spectral fingerprint identifies the chemical correctly with 99% accuracy using the Pearson correlation.
1. Introduction
Spectroscopy uses the unique interactions of light with molecules to make non-intrusive measurements. This property is used to dictate the characteristics of a sample, measuring the influence that the sample has over the electromagnetic spectrum (EM) without contaminating the sample [1,2]. Photodiodes (PDs) are commonly used as sensors to detect the power of light. However, PD EM sensitivity is relatively wide-band, and extra filter equipment or methods need to be implemented to make wavelength-specific measurements [3]. A light emitting diode (LED)’s detection spectral sensitivity is similar to the emission spectrum of the LED [2,4]. When the LED is reverse-biased, it can function as a sensor. As a result, an array of LEDs can be used to measure discrete wavelengths, and the relative intensity of these wavelengths could be quantified. The use of LEDs as both detectors and emitters in a spectroscopy device is known as a paired emitter–detector diode (PEDD) configuration [2,5]. Thus, in this study, narrow-band LEDs are used as narrow-spectral-band detectors, reducing the spectral noise detected by the system. These narrow-spectral-band measurements are used to analyze chemicals in liquids and determine their concentrations [1,2,6]. The effect of discrete spectral components could be measured when using an array configuration of the PEDD system. These components allow the system to identify chemicals through absorption patterns.
Clean water resources are vital for the agriculture industry, as they play a crucial role in maintaining crop health and productivity. In agriculture, water treatment chemicals, such as copper sulfate (CuSO4) which is used to control organic matter and parasites [7], iodine (I2) which is used as a water disinfectant [8,9], and potassium permanganate (KMnO4) which acts as an oxidant by binding to toxic ions [10], are commonly used for water treatment. However, these chemicals can be helpful or harmful based on their concentrations [11].
The use of a PEDD-configured spectroscopy device provides accurate measurements as an alternative system to standard measuring equipment [2,3]. LED measurement devices have been used to estimate the concentration of particles in a solution accurately, presuming that the chemical in the solution is known [6].
2. Materials and Methods
2.1. Chemical Preparation and Identification
Standard concentrations of CuSO4, I2, and KMnO4 were created by mixing the compounds with distilled water. Other concentrations of these compounds were achieved by further diluting the standard concentrations with distilled water. Each substance interacts uniquely with the optical spectrum, and this property is used for chemical identification [12]. The PEDD array enables the measurement of multiple spectral components, effectively creating an optical fingerprint reader for various materials. The Pearson correlation coefficient compares different absorption patterns and identifies the corresponding chemical, which is used to classify the sample in solution in the chemical identification process.
2.2. PEDD Array System and Calibration Curves
The PEDD array sensors had central wavelengths of 385 nm, 426 nm, 470 nm, 530 nm, 562 nm, and 572 nm. The main light source was a white LED, but a similar setup to that of the detector LEDs was also used as a light source. The complete system comprised the light source, color sensors, a microcontroller, a 3D-printed device container, and analog and bias circuitry. Figure 1a shows the digital model, and Figure 1b depicts the physical device. The container aligned sensors and sources for liquid absorption measurements using a cuvette in the optical path, as seen in Figure 1.
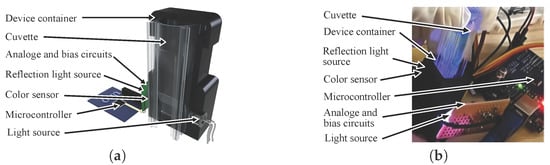
Figure 1.
The PEDD array system: (a) Design. (b) Experimental setup.
The Beer–Lambert Law states that there is a direct relationship between the absorption and concentration of chemicals [12]. This principle was implemented with the PEDD system to determine the concentration of the solute in the absorption measurements. The K-matrix method was used as a mathematical tool to find the linear relationship between sensor readings and solute concentration. It was expected that the optical noise of the sensors would have less effect on the final results, providing more accurate results. This linear expression was used as a calibration curve to translate absorption measurement to concentrations. In essence, the K-matrix method ensured the effective utilization of all sensors in the array of the PEDD system.
3. Results
The PEDD system chemical identification performance is illustrated in Table 1, whereas the discrete spectra for various concentrations of target chemicals are depicted in Figure 2.

Table 1.
Sample identification confusion matrix.
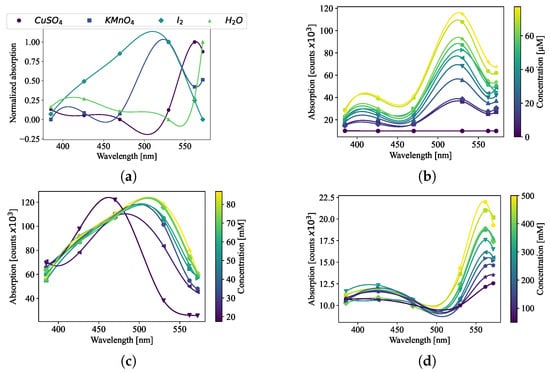
Figure 2.
The absorption spectra at discrete points for (a) the standard samples. (b) Concentration measurements of KMnO4 that range from 0.4 μM to 15.44 μM with 0.4 μM increments, (c) I2 concentration measurements that range from 3.94 mM to 157.6 mM with a resolution of 3.94 mM, and (d) concentration measurements of CuSO4 that range from 12.5 mM to 0.5 M with 12.5 mM steps.
Table 2 visually represents the normalized correlation and standard deviation of the concentration measurements for all samples using both a selected color (470 nm, 562 nm, 572 nm) sensor and the K-matrix method with all sensors.
Table 2.
PEDD system normalized measurement results.
4. Discussion
The current PEDD system enables the identification and measurement of chemicals. While the concentrations of some tested elements could be determined with high precision using only selective sensors, the use of the K-matrix method improved the device’s accuracy, as shown in Table 2.
The current system cannot measure chemical mixtures but has the potential for future enhancement. By isolating different spectral components and employing a classifier, the system could analyze the unique spectral signatures of various samples, enabling accurate identification of chemicals and determination of their concentrations. For real-world application, particularly in water treatment, sensitivity in concentration measurements is essential. The data collected demonstrates the system’s promise and justifies further investigation and development to meet these requirements.
The resin-printed container complements the microfabrication strategy by enabling fabrication in areas with low levels of infrastructure. Additionally, the use of additive manufacturing for the container and printed electronics for the bias and analog circuits demonstrates a comprehensive approach to microfabrication within the system.
Author Contributions
Methodology, software, validation, formal analysis, investigation, data curation, writing—original draft preparation, writing—review and editing, visualization, funding acquisition, D.O.; conceptualization, methodology, resources, writing—review and editing, supervision, project administration, T.-H.J. All authors have read and agreed to the published version of the manuscript.
Funding
This research was funded by the South African Department of Science and Innovation Nano and Micro Manufacturing Facility grant.
Data Availability Statement
Additional data can be obtained from the authors.
Acknowledgments
We would like to thank Brent Brown and Lucka Straten for their invaluable assistance with data acquisition and coding the system to package the data for subsequent post-processing. We also extend our gratitude to Nomakhosi N. Ndiweni for her significant contributions in developing the methodology and experimental planning, as well as for her assistance in editing and proofreading this paper.
Conflicts of Interest
The authors declare no conflicts of interest. The funders had no role in the design of this study; in the collection, analyses, or interpretation of data; in the writing of the manuscript; or in the decision to publish the results.
References
- Rabe, M.; Krüger, H.; Ebert, E.; Damaschke, N.; Ewald, H. Mode filter for LED-based absorption spectroscopy. In Proceedings of the 2016 IEEE International Instrumentation and Measurement Technology Conference Proceedings, Taipei, Taiwan, 23–26 May2016; pp. 1–5. [Google Scholar] [CrossRef]
- Barreto, D.N.; Leal, V.G.; Conrado, J.A.M.; Fernandes, G.M.; Machado, C.C.S.; Batista, A.D.; Silva, S.G.d.; Petruci, J.F.d.S. Performing Reliable Absorbance and Fluorescence Measurements with Low Budget—A Tutorial for Beginners. Química Nova 2021, 44, 1184–1191. [Google Scholar] [CrossRef]
- Yokota, T.; Fukuda, K.; Someya, T. Recent Progress of Flexible Image Sensors for Biomedical Applications. Adv. Mater. 2021, 33, 2004416. [Google Scholar] [CrossRef] [PubMed]
- Shin, D.Y.; Eom, I.Y. A Pair of Light Emitting Diodes for Absorbance Measurement. Bull. Korean Chem. Soc. 2013, 34, 3150–3152. [Google Scholar] [CrossRef]
- Fay, C.D.; Nattestad, A. LED PEDD Discharge Photometry: Effects of Software Driven Measurements for Sensing Applications. Sensors 2022, 22, 1526. [Google Scholar] [CrossRef] [PubMed]
- Bui, D.A.; Hauser, P.C. Absorbance measurements with light-emitting diodes as sources: Silicon photodiodes or light-emitting diodes as detectors? Talanta 2013, 116, 1073–1078. [Google Scholar] [CrossRef]
- Holmes, S.; CSIR Environmental Services. South African Water Quality Guidelines (Second Edition): Agricultural Use: Livestock Watering. Department ofWater Affairs and Forestry: South Africa, 1996; Volume 5. Available online: https://www.dws.gov.za/iwqs/wq_guide/edited/Pol_saWQguideFRESH_vol5_Livestockwatering.pdf (accessed on 30 August 2024).
- Li, J.; Qian, K.; Yang, Y.; Xie, X. Iodine speciation and its potential influence on iodine enrichment in groundwater from North China Plain. Procedia Earth Planet. Sci. 2017, 17, 312–315. [Google Scholar] [CrossRef]
- Smedley, P. Water Quality Fact Sheet: Iodine; British Geological Survey: Keyworth, UK, 2000; Available online: https://nora.nerc.ac.uk/id/eprint/516302/1/Iodine.pdf (accessed on 2 July 2024).
- Banerjea, R. The use of potassium permanganate in the disinfection of water. Indian Med. Gaz. 1950, 85, 214. [Google Scholar]
- Willhite, C.; Bhat, V.; Ball, G.; McLellan, C. Emergency Do Not Consume/Do Not Use concentrations for potassium permanganate in drinking water. Hum. Exp. Toxicol. 2013, 32, 275–298. [Google Scholar] [CrossRef] [PubMed]
- Pingitore, N.E., Jr.; Meitzner, G.; Love, K.M. Identification of sulfate in natural carbonates by X-ray absorption spectroscopy. Geochim. Cosmochim. Acta 1995, 59, 2477–2483. [Google Scholar] [CrossRef]


Disclaimer/Publisher’s Note: The statements, opinions and data contained in all publications are solely those of the individual author(s) and contributor(s) and not of MDPI and/or the editor(s). MDPI and/or the editor(s) disclaim responsibility for any injury to people or property resulting from any ideas, methods, instructions or products referred to in the content. |
© 2025 by the authors. Licensee MDPI, Basel, Switzerland. This article is an open access article distributed under the terms and conditions of the Creative Commons Attribution (CC BY) license (https://creativecommons.org/licenses/by/4.0/).