Proceeding Paper

Sensorized T-Shirt for Cardiological Patients in Telemonitoring †

by
Noemi D’Abbondanza
1,2,
Martina Ferrazza
1,2,
Leandro Lucangeli
2,3,
Emanuele Piuzzi
4 and
Antonio Pallotti
2,5,6,*
1
Department of Basic and Applied Sciences for Engineering, Sapienza University of Rome, Via Eudossiana 18, 00184 Rome, Italy
2
Technoscience—Consorzio Parco Scientifico e Tecnologico Pontino, Via di Val Cannuta 247, 00166 Rome, Italy
3
Department of Motor, Human and Health Sciences, “Foro Italico” University of Rome, Piazza Lauro de Bosis 15, 00135 Rome, Italy
4
Department of Information Engineering, Electronics and Telecommunications, Sapienza University of Rome, Via Eudossiana 18, 00184 Rome, Italy
5
Department of Management and Law, University of Rome Tor Vergata, Via Columbia 2, 00133 Rome, Italy
6
Department of Human Sciences and Promotion of Life Quality, “San Raffaele” University of Rome, Via di Val Cannuta 247, 00166 Rome, Italy
*
Author to whom correspondence should be addressed.
Presented at the 2nd International Electronic Conference on Applied Sciences, 15–31 October 2021; Available online: https://asec2021.sciforum.net/.
Eng. Proc. 2021, 11(1), 48; https://doi.org/10.3390/ASEC2021-11130
Published: 15 October 2021
(This article belongs to the Proceedings of The 2nd International Electronic Conference on Applied Sciences)

Abstract

:
Technological innovations in the development of wearable sensors have led to advancements in smart wearable devices targeted at health monitoring. In this work, a multisensor T-shirt for remote telemonitoring of vital signs related to cardiovascular diseases was developed. The prototype includes a single-lead electrocardiogram (ECG), a pulse oximeter, a temperature sensor, and a three-axis accelerometer. Data collected are sent by a Bluetooth module, then filtered and visualized thanks to a MATLAB script to provide information about heart rhythm, average temperature and oxygen saturation, and respiratory rate. The result is a simple, low-cost, and low-power system; an easily applicable solution within everyone’s reach.

1. Introduction

The term telemedicine, coined in the 1970s, means “healing at a distance” [1], and the World Health Organization (WHO) defines health telematics as “health-related activities, services and systems carried out over a distance by means of information and communications technologies” [2]. Smart wearable devices targeted at health monitoring can be used in telemonitoring systems to reduce healthcare system costs and to provide remote and personalized patient care that is accessible to all [3]. These devices are particularly useful for the follow-up of chronic diseases because they offer the possibility of continuous remote assistance [4,5,6]. There are several applications reported in literature, such as chronic obstructive pulmonary disease, diabetes, end-stage kidney disease, hypertension, or heart failure [6,7,8]. Evidence supports the use of wearable devices, particularly successful for exploring cardiac health and detecting arrhythmias [9,10,11,12]. Cardiovascular diseases (CVDs) are the major cause of death: in 2019, 32% of all global deaths were due to CVDs [13]. Detecting these diseases as early as possible leads to several benefits in prevention, diagnosis, and management.
In Ref. [14] the 12-lead electrocardiogram (ECG) is presented as the noninvasive gold standard for detecting several heart conditions. On the other hand, the use of the ECG machine does not offer the possibility of continuous and remote monitoring. When a longer recording during daily activities is needed, such as in arrhythmias detection, Holter monitoring or external cardiac event recorders can be used for noninvasive monitoring. The ambulatory ECG (Holter) can record multiple leads over 24–72 h, but it could have problems in terms of comfort because the patient must carry the device and keep sticky electrodes for all the recording duration [15]. The use of wearable devices can allow the overcoming of these limitations: in [16] the state of art of wearables in cardiovascular care is presented. Most of the common smart wearable devices on the market provide information about heart rate (HR) and heart rhythm through electrocardiography (ECG). In fact, common arrhythmias, such as atrial fibrillation (AF), can be detected using at least a single-lead ECG during their occurrences [17]. AF is associated to stroke and heart failure, so ECG monitoring through wearable devices can play an important role in early diagnosis [18].
Another interesting vital sign associated with adverse cardiac events is the Respiratory rate (RR): it can be used to identify heart failure or heart attack [19,20,21] because RR can increase even hours before the event, so frequent monitoring can be fundamental. Although respiratory-rate estimation is possible with ECG signal-processing algorithms [22], there are different ways to measure RR: Ref. [21] provides an overview of the available contact-based methods, while [20] presents a comprehensive overview of the design of respiratory-sensing system, describing the results of literature research.
Other vital signs can be provided to assess patient health condition: a review on the state of research and development in these wearable systems for health monitoring is presented in [21]. Concerning CVDs, it is important to monitor oxygenated hemoglobin in the blood through blood oxygen-saturation (SpO2)-monitoring systems because these diseases can provoke a reduction in oxygen levels in blood [23,24].
In Ref. [23], the state of the art of body-temperature-monitoring systems is also reported. It is difficult to establish a relation between body temperature and heart diseases: some researchers report a relationship with heart rate and respiration rate [25], others [26] consider temperature monitoring as a useful tool for detecting symptoms of medical stress related to stroke and heart attacks. However, there is an interesting correlation between temperature and strokes [27]: for example, in Ref. [28] it was found that monitoring—and thus preventing—high temperatures days after ischemic strokes can improve outcome.
The aim of this work is the development of a multisensor T-shirt for telemonitoring vital signs in cardiological patients. We developed a system including a single-lead ECG, a pulse oximeter, a temperature sensor, and a triaxial accelerometer. The more general goal concerns the development of an inexpensive and highly versatile wearable device, adaptable to the individual patient both from a firmware and hardware point of view. Its accessibility and low energy consumption will allow the collection of a large amount of data remotely, which can be directly accessible by the doctor for continuous and daily monitoring and used in the development of ML models for the automatic follow-up of the patient’s health status.

2. Materials and Methods

In this section, we discuss the details of hardware, firmware, and software of the developed prototype T-shirt (Figure 1a) for telemonitoring of cardiological patients. The design developed presents an acquisition unit, a transmission unit, and an elaboration unit (Figure 1b).

2.1. Sensors

A single-lead ECG, a pulse oximeter, a temperature sensor, and a 3-axis accelerometer were used to monitor cardiac health.
The AD8232 SparkFun Single Lead Heart Rate Monitor [29,30,31,32,33] was chosen to measure the electrical activity of the heart. The AD8232 is an integrated signal-conditioning block for ECG that acts as an operational amplifier to extract, amplify, and filter biopotential signals in the presence of noisy conditions, such as those created by motion or remote electrode placement. The advantage of this sensor is that the electronic components needed for the ECG acquisition, such as amplifiers and filters, are contained in a 35.6 mm × 27.8 mm board, powered with a 3.3 V supply voltage. Data acquisition is made through three disposable foam solid hypoallergenic-gel electrodes of FIAB SpA. These electrodes are CE marked according to the directive 93/42/EEC and low cost (€0.20/electrode).
To monitor blood-oxygen saturation, the SparkFun Pulse Oximeter and Heart Rate Sensor, a 3.3 V sensor, were used. This board integrates two Maxim Integrated chips: the MAX32664 Biometric Sensor Hub and the MAX30101 Pulse Oximetry and Heart Rate Module [34]. The MAX30101 has an internal LED to light the finger and measures absorbed light through its photodetectors, while the MAX32664 processes the data and provides heart rate and blood-oxygen saturation (SpO2), reported as percentage of hemoglobin that is saturated with oxygen. An interesting feature of this sensor is the possibility of reporting measurements’ confidence and information about correct finger position. The MAX30101 has an internal analog-to-digital converter (ADC) with 18-bit resolution; the device is easy to use and set, and it is very small (25.4 mm × 12.7 mm), so it is comfortable for the patient.
The DS18B20 digital thermometer [35,36] was chosen as temperature sensor because it provides up to 12-bit measurements and ±0.5 °C accuracy from −10 °C to +85 °C. Moreover, thanks to its size (5 mm × 4 mm × 6 mm.), it does not cause discomfort.
For an easy and fast evaluation of respiratory rate (RR), it was decided to use an accelerometer, like in more than 11% of works analyzed in Ref. [20]. The ADXL335, a 3-axis accelerometer [21,37] powered with 3.3 V, was chosen. It can measure acceleration with a minimum full-scale range of ±3 g, so it is used to measure the dynamic acceleration resulting from torso motion.

2.2. Control Board and Connectivity

The sensors were connected to an Arduino Mega 2560, a microcontroller board based on the ATmega2560. The choice was due to its 16 analog inputs, each of which provide 10 bits of resolution, useful for the future integration of other sensors. The Mega 2560 also supports two-wire interface (TWI) communication through the pins SDA (data line) and SCL (clock line), so it can communicate with I2C devices such as the pulse oximeter. The microcontroller board is powered by a rechargeable battery with a capacity of 10,000 mAh. A consumption test was conducted by measuring the current absorbed by the electronics. The resulting current was 100 mA and the estimated battery life in continuous acquisition was at least 48 h.
Data acquired from the sensors were transmitted through HC-05 Bluetooth Module, a Serial Port Protocol module designed for wireless communication. It supports different baud rates [38], which can be set in AT mode. The minimum baud rate sufficient to send all the data was chosen—that is, 115,200. This module was already used in other ECG applications [32,33].

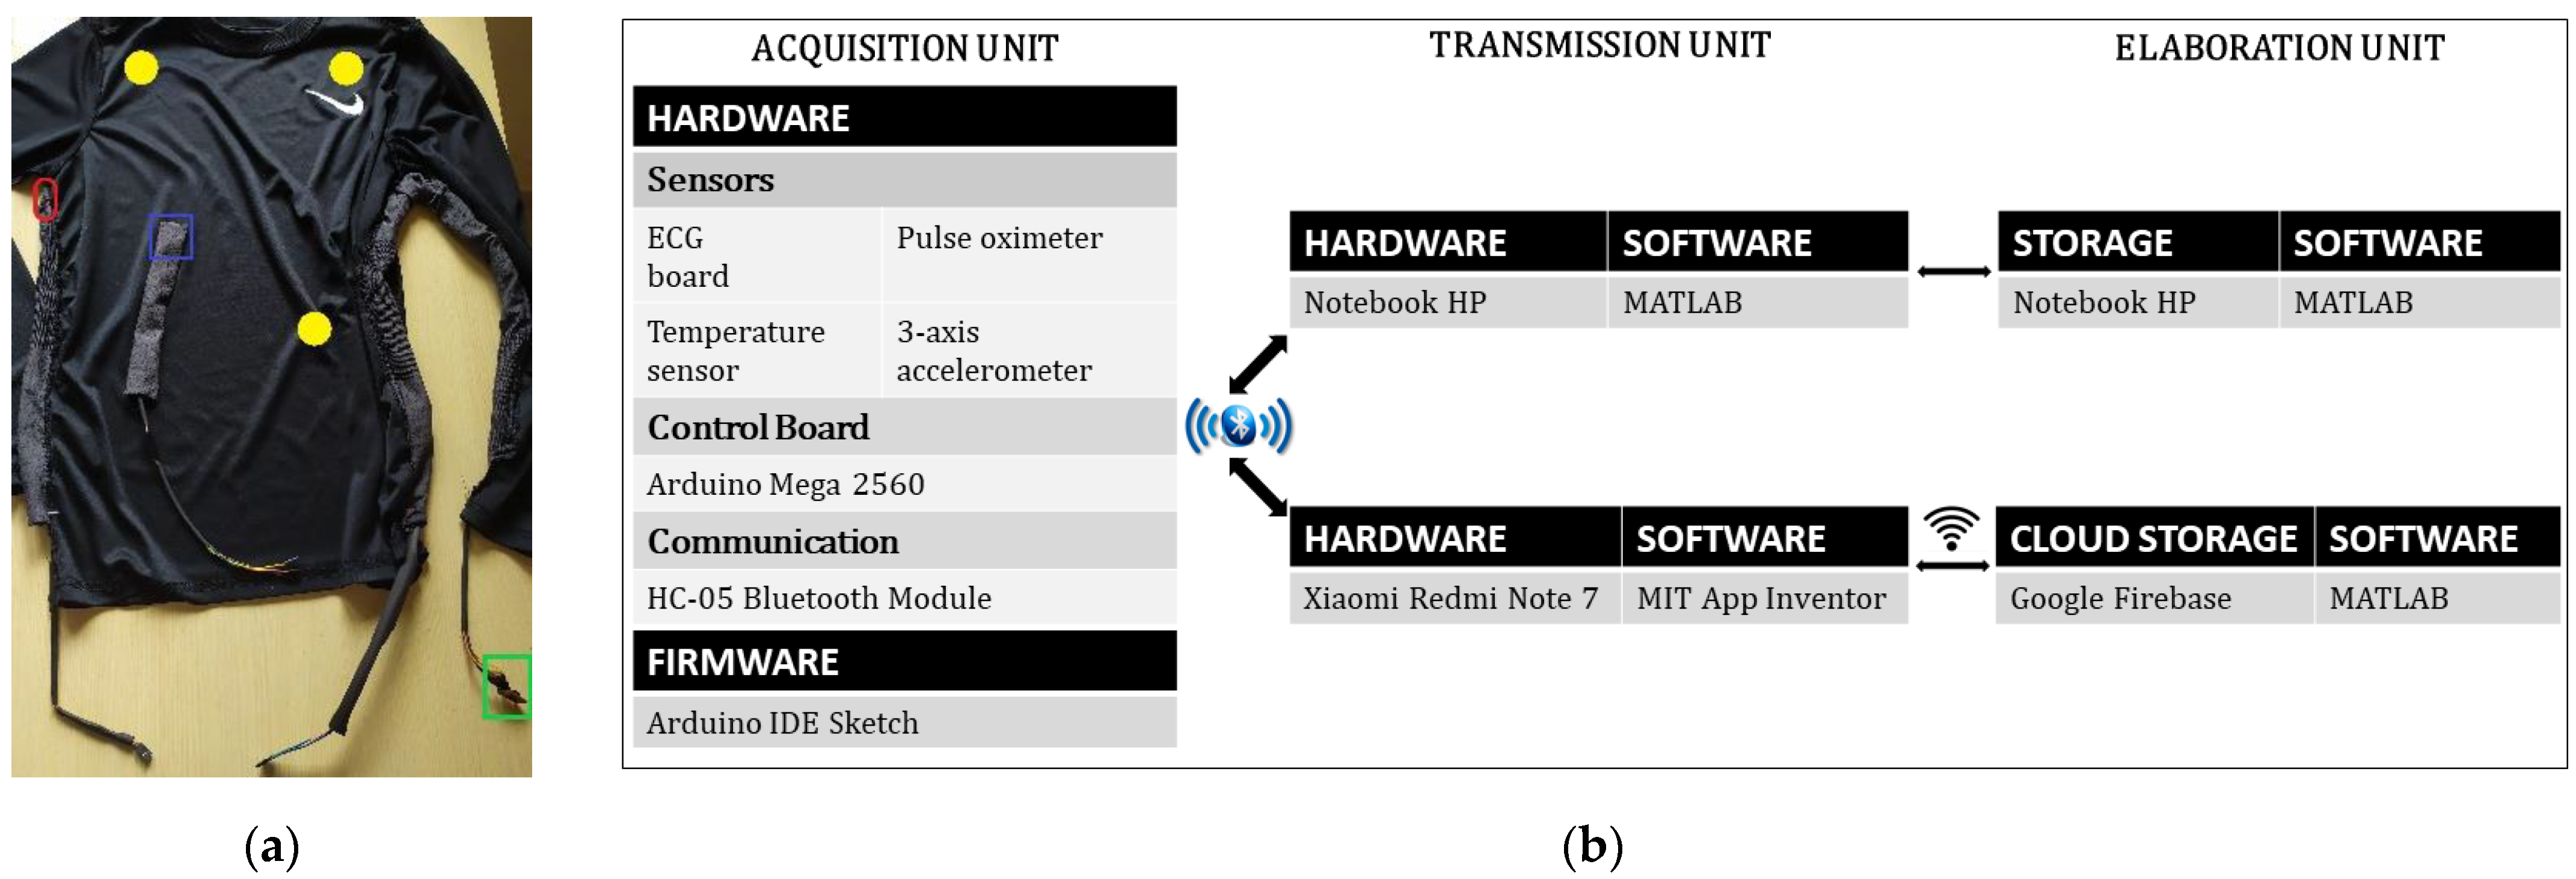
2.3. Acquisition Unit

The prototype was tested using disposable electrodes: for this reason, they were not integrated in the T-shirt. Einthoven’s lead II configuration was used for electrodes positioning, as also suggested in the Sparkfun Hookup Guide. Therefore, two electrodes were placed on the chest near the arms, while the right leg electrode was placed on the right lower abdomen (Figure 1a).
After electrode positioning, the patient can put on the sensorized T-shirt, in which pockets for the cables are sewn. The sensors can be connected after the fitting, so they cannot be damaged during the operation. Furthermore, to wash the T-shirt, every electronic component of the device can be easily removed and replaced.
The temperature sensor was fixed under the left armpit, while the pulse oximeter was in contact with the right index finger. For the accelerometer positioning, Ref. [39] reports that respiration frequency can be accurately measured from the placement “at the clavicular, pectoral and lateral sites on the chest as well the mid abdominal site”. The accelerometer was fixed on the left costal margin in order to not interfere with ECG cables.
An Arduino sketch was written to acquire data from sensors at different frequencies. A different timer was activated for each sensor thanks to the use of the “timer.setInterval” function of the “SimpleTimer.h” library for Arduino Mega 2560. The temperature sensor and pulse oximeter were acquired every 1 s (1 Hz); the accelerometer every 200 ms (5 Hz); and the ECG every 4 ms (250 Hz). In this way, every second the firmware collected 270 samples: 1 start character “s”, 1 temperature sample, 1 heart rate and 1 SpO2 samples from pulse oximeter, 15 samples from accelerometer (5 for each axis), 250 samples from ECG board, and 1 blank space as end character. Data were directly transmitted through HC-05 Bluetooth Module.

2.4. Transmission and Elaboration Unit

A serial connection between Arduino board and PC was created through the Bluetooth module. The transmission was managed by a MATLAB script, which allows for the selection of acquisition time and the saving of data in a .txt file at the end of the procedure.
As an alternative transmission mode, an Android application was developed, using MIT App Inventor, to have a transmission unit usable in remote monitoring. The app receives data from the Arduino board and saves them in completely anonymous form using an identification index into Google Firebase database. Using appropriate credentials (username and password), it is possible to access the database via MATLAB script and then process the data.
Depending on the modality of transmission, stored signals are processed with a MATLAB algorithm, allowing the filtering and the visualization of data and the extraction of parameters.

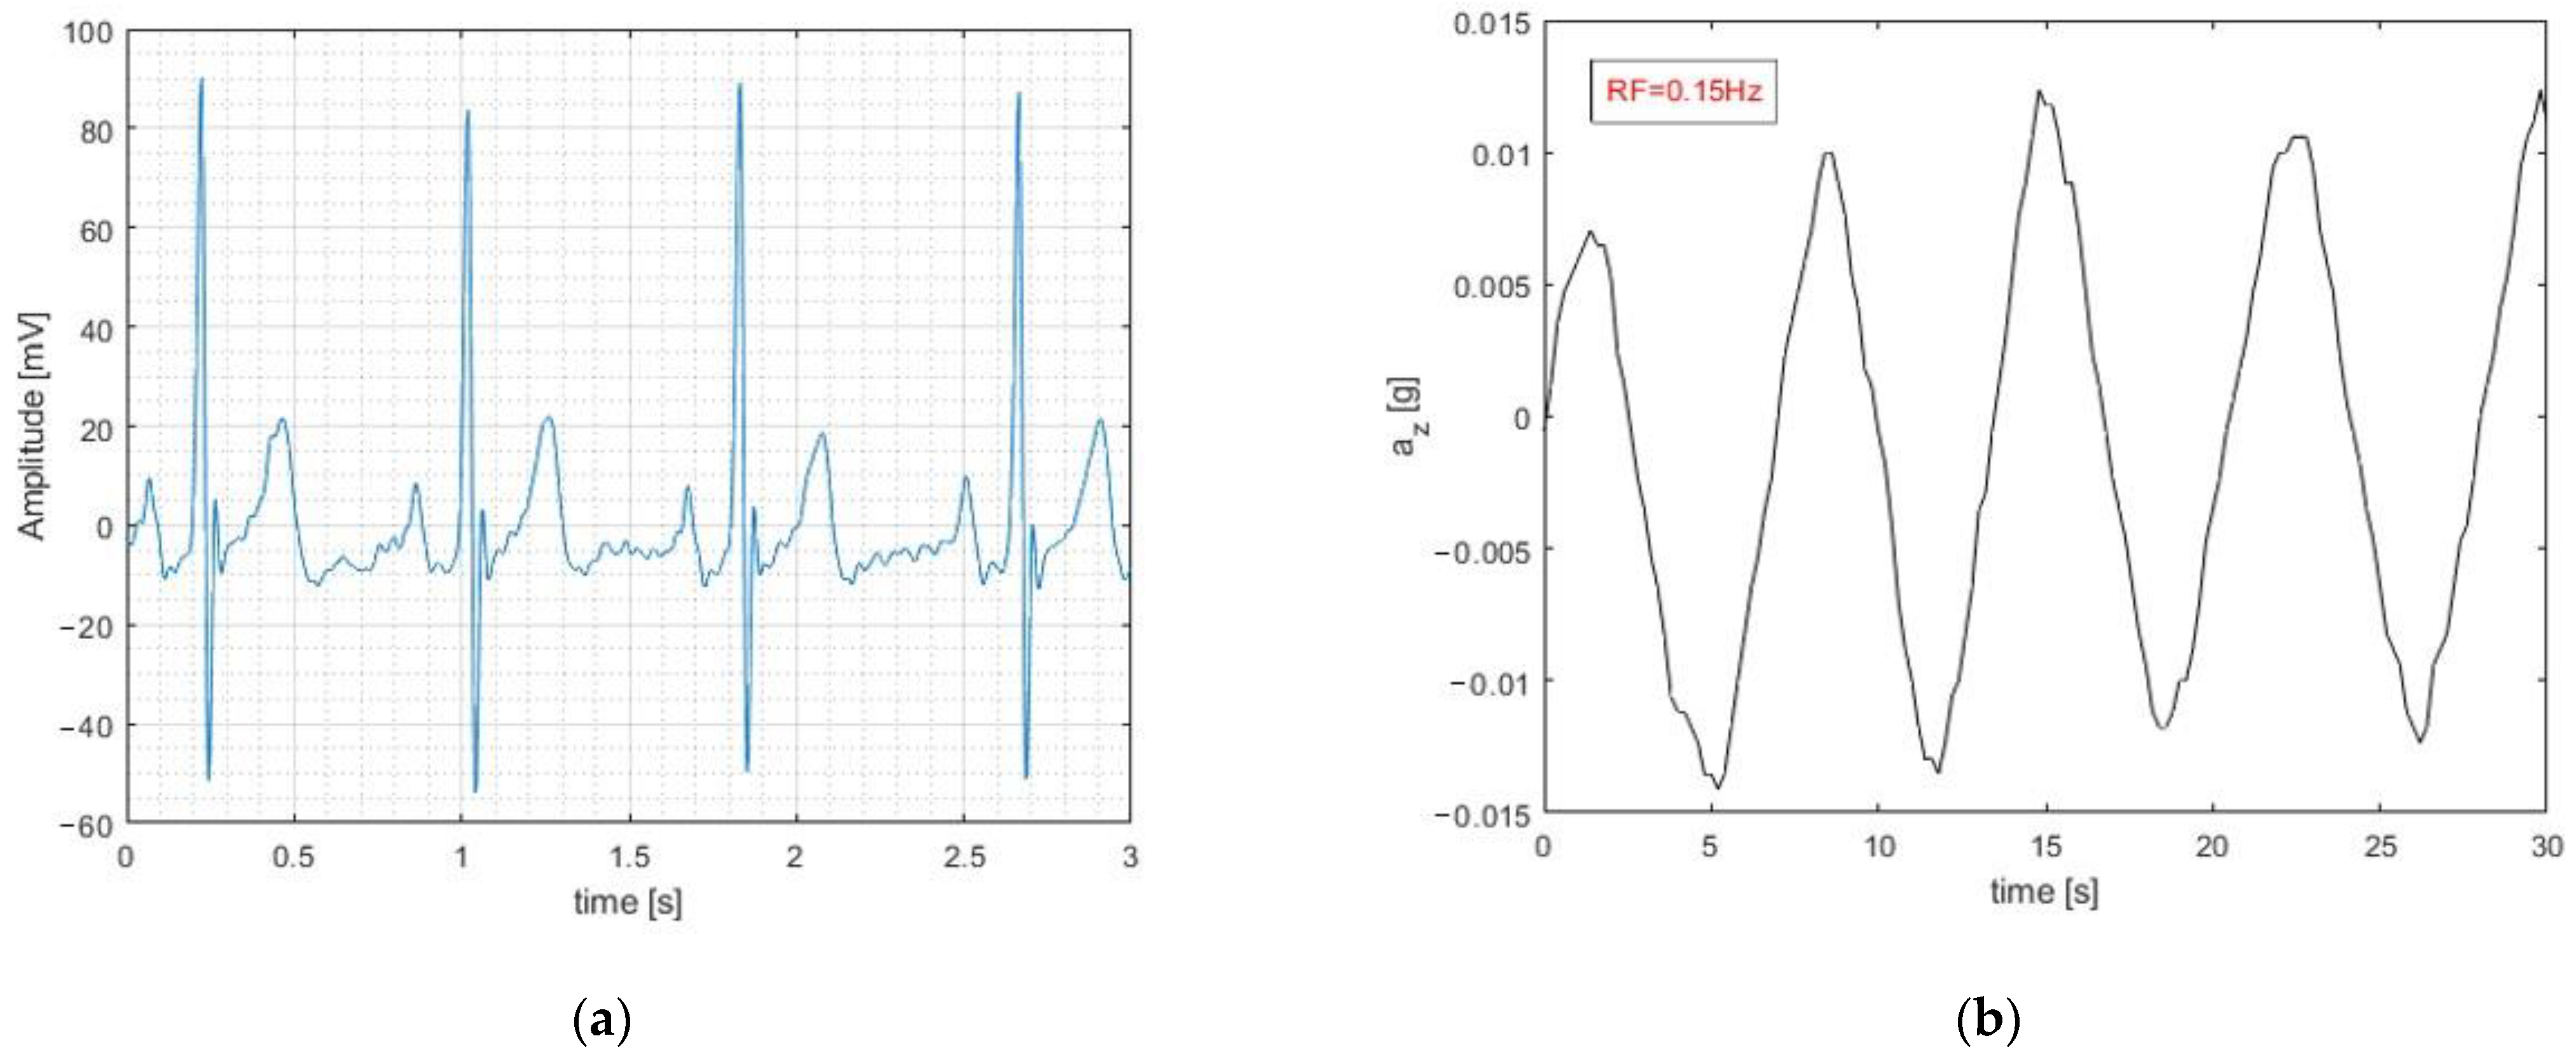
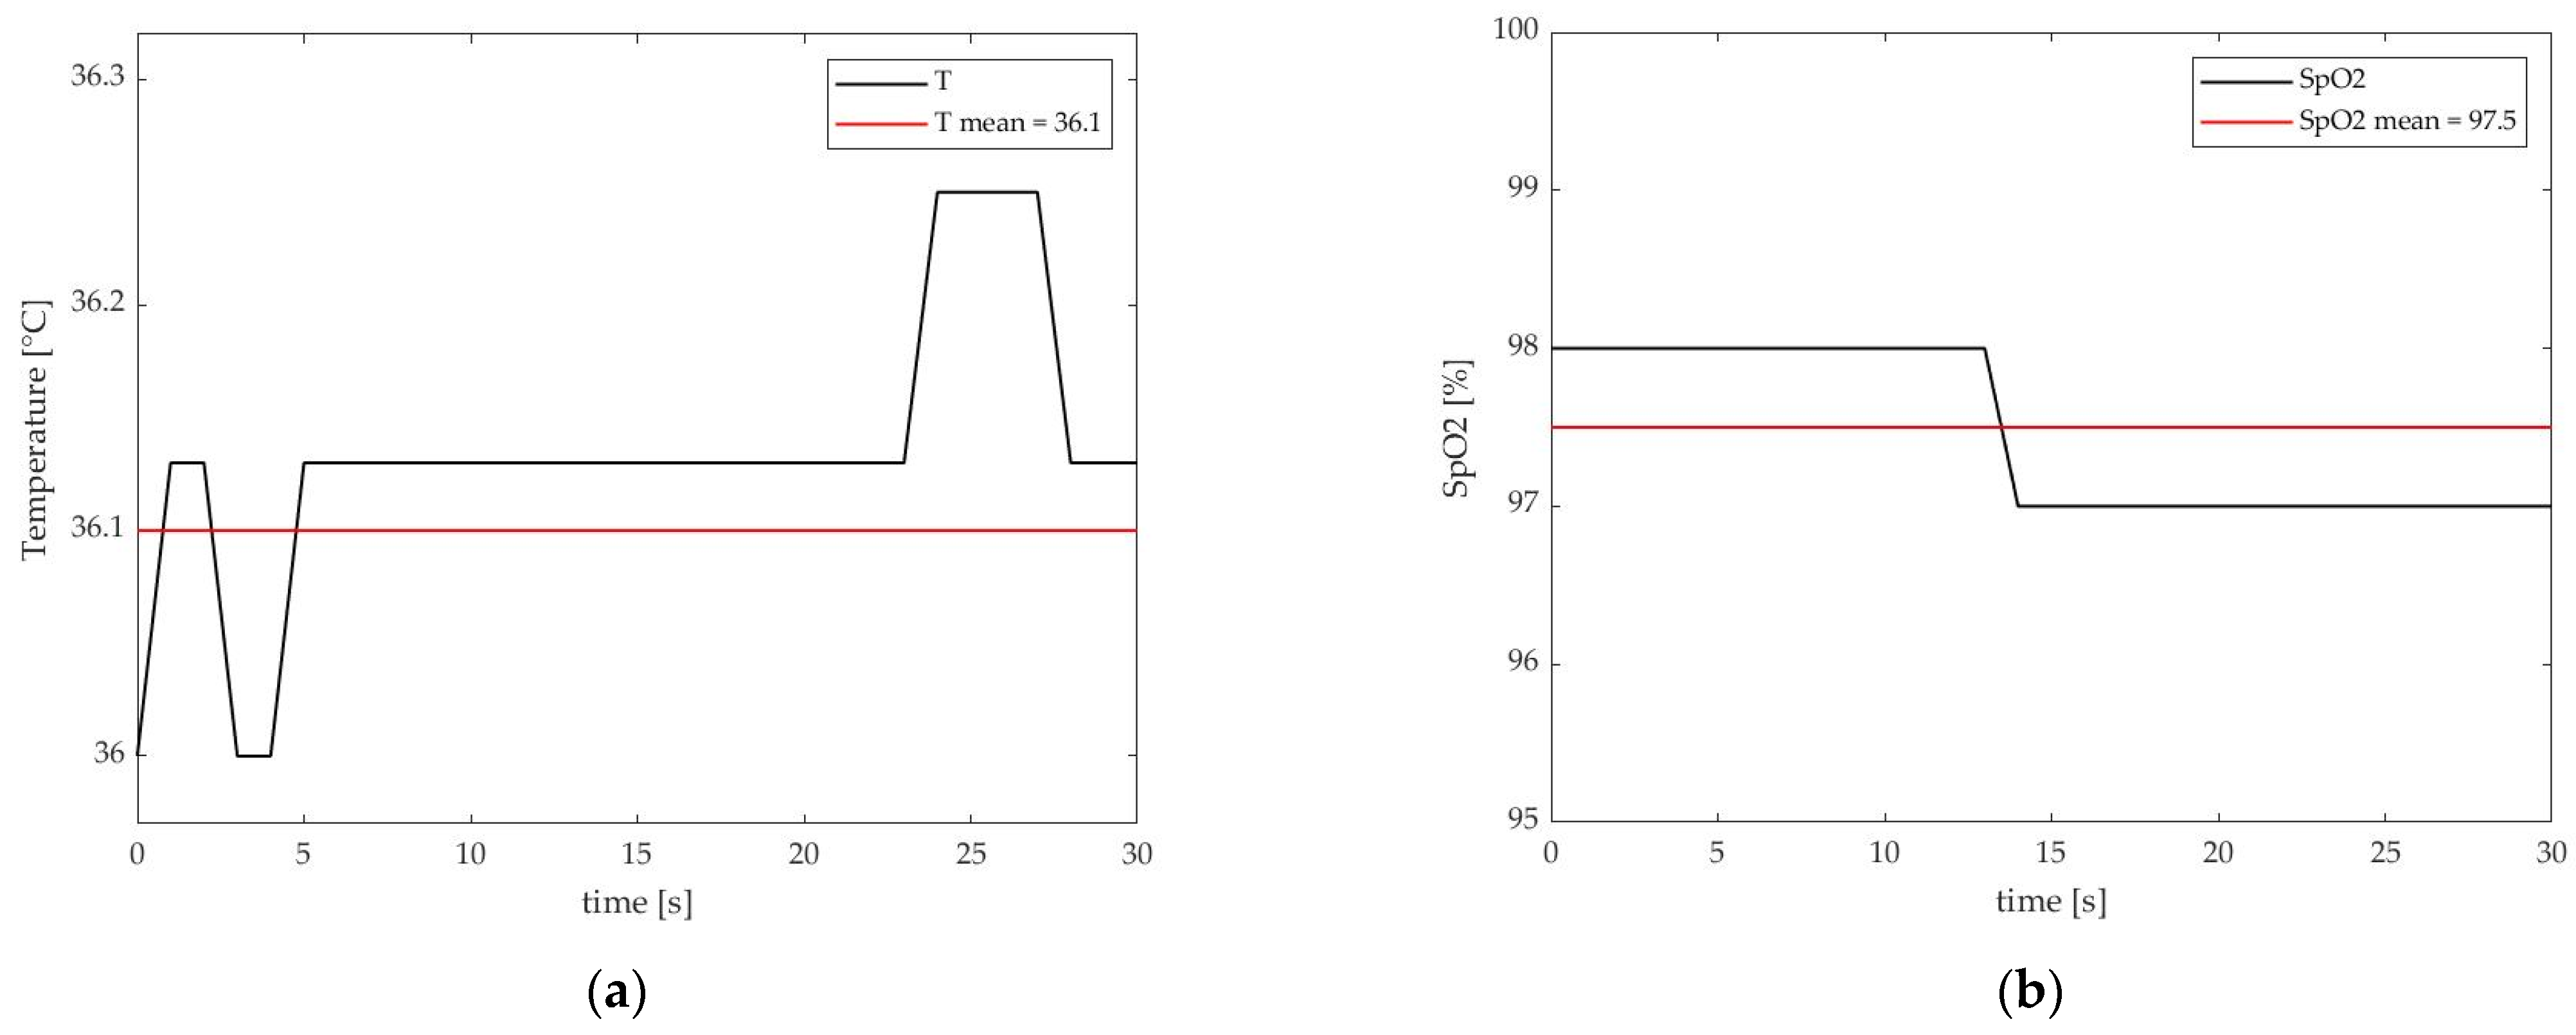
3. Results and Discussion

The system described in this work was tested on a participant and the obtained signals were compared with similar monitoring devices, including medical devices. The duration of the validation test was 30 s for ECG, temperature, and SpO2, while it continued for 60 s for breathing.
The signal obtained from the AD8232 SparkFun Single Lead Heart Rate Monitor was compared with the GIMA Cardio-B ECG, a medical device compliant with 93/42/CEE Directive for monitoring the heart signal. Both devices detected 33 cardiac cycles in 30 s, returning a heart rate of ∼66 bpm. Furthermore, by comparing the time interval between the R peaks, it appears that the average of the errors was (6.125 ± 3.70) ms, while the maximum percentage error was 1.36%. The average of all the intervals between the peaks calculated with the GIMA ECG is (883.94 ± 41.17) ms, while for the SparkFun ECG it was (883.13 ± 40.12) ms. The amplitude of the two traces is of the same order: 0.4 mV for the GIMA ECG, and between 0.3 and 0.35 mV for the SparkFun one, which was slightly lower because the electrodes were positioned more externally.
For the validation of the SparkFun Pulse Oximeter sensor, the Oxy-2 Pulsoximeter by GIMA (medical device compliant with Directive 93/42/CEE) was used. The latter provides the measurement of saturation with an uncertainty of ±2%, and heart-rate measurement with an accuracy of ±2 bpm. The comparison of the sensors was carried out wearing the devices on the right- and left-hand indexes, respectively. Both devices showed the same SpO2 measurement for the entire acquisition. The heart rate measured by the SparkFun was within the range with an underestimation of the average rate by the sensor integrated in the T-shirt. The average frequencies calculated were in fact (64.39 ± 1.09) bpm for the GIMA and (62.81 ± 1.28) bpm for the SparkFun.
The DS18B20 temperature sensor was compared to a thermistor (with a resolution of 0.0001 °C) with both sensors positioned under the left armpit. The average temperatures obtained by the two sensors differed by 0.4 °C, with (36.32 ± 0.01) °C for the thermistor and (35.89 ± 0.03) °C for DS18B20.
The estimated respiratory rate obtained from the accelerations measured with the integrated ADXL335 was compared with the information provided by the UFI-1132 Pneumotrace II™, a piezoelectric breathing belt. Both devices recorded the same number of breaths (10 breaths in one minute), with similar power spectra and in particular with the same predominant frequency content. In fact, the respiratory rate was calculated as the frequency corresponding to the maximum value of the acceleration power spectrum. The prototype provided sufficient information to identify heart-rhythm disturbances, such as atrial fibrillation, by acquiring the single-lead ECG (Figure 2a). The acceleration perpendicular to the chest (Figure 2b) allowed for evaluation of the respiratory rate, that is, the number of breaths taken per minute. Finally, the temperature sensor and the pulse oximeter were integrated into the T-shirt to have additional parameters in the monitoring phase. After processing, the mean values of the acquired samples were calculated. In Figure 3, an extract of sensors output plotted with the mean values is reported.
Furthermore, the framework and the prototype developed in this work were used in the Ref. [40] study for the classification of healthy and arrhythmic subjects. The protocol provided for the acquisition of a population of 20 control participants, by means of a 2 min static test with the subject seated. The data obtained, together with signals from arrhythmic patients taken from public databases, were used for the development of classification models. The results obtained in Ref. [40] show the potential of the device developed and described in this work.

4. Conclusions

In this work, a multisensor T-shirt was developed to measure vital signs important for heart monitoring: the prototype integrated a single-lead ECG, a pulse oximeter, a temperature sensor, and a triaxial accelerometer. The result was a simple, low-cost, and low-power telemonitoring system, able to collect enough data for machine-learning applications. The acquisition of a single-lead ECG signal is sufficient to detect heart rhythm diseases but it is also a limitation. Future developments will concern the measure of 12-lead ECG and the use of the prototype in dynamic tests, for the evaluation of health conditions during daily activities. The prototype described in this work has limitations in terms of wearability, but in the next versions particular attention will be paid to integrate noninvasive and flexible sensors and to reduce the size of the electronics used.

Author Contributions

Conceptualization, A.P. and E.P.; methodology, A.P.; software, N.D.; validation, N.D., E.P.; formal analysis, N.D. and M.F.; investigation, N.D., M.F. and L.L.; resources, N.D.; data curation, A.P.; writing—original draft preparation, N.D.; writing—review and editing, L.L.; visualization, N.D.; supervision, A.P. and E.P.; project administration, A.P.; funding acquisition, A.P. All authors have read and agreed to the published version of the manuscript.

Funding

This research received no external funding.

Institutional Review Board Statement

The protocol was approved by the Consorzio Parco Scientifico e Tecnologico Pontino Technoscience, with the code PST/205/P/140322.

Informed Consent Statement

Informed consent was obtained from the subject involved in the study.

Data Availability Statement

The datasets underpinning this work are available from the corresponding author upon request (agreement signing).

Acknowledgments

We thank Engineering Emanuele D’Angelantonio for his support and contribution in the research work.

Conflicts of Interest

The authors declare no conflict of interest.

References

  1. Strehle, E.M.; Shabde, N. One hundred years of telemedicine: Does this new technology have a place in paediatrics? Arch. Dis. Child. 2006, 91, 956–959. [Google Scholar] [CrossRef] [PubMed] [Green Version]
  2. World Health Organization. A Health Telematics Policy in Support of WHO’s Health-For-All Strategy for Global Health Development: Report of the WHO Group Consultation on Health Telematics, 11–16 December, Geneva, 1997; World Health Organization: Geneva, Switzerland, 1998.
  3. Deen, M.J. Information and communications technologies for elderly ubiquitous healthcare in a smart home. Pers. Ubiquitous Comput. 2015, 19, 573–599. [Google Scholar] [CrossRef]
  4. Asua, J.; Orruño, E.; Reviriego, E.; Gagnon, M.P. Healthcare professional acceptance of telemonitoring for chronic care patients in primary care. BMC Med. Inform. Decis. Mak. 2012, 12, 1–10. [Google Scholar] [CrossRef] [PubMed] [Green Version]
  5. Li, J.; Varnfield, M.; Jayasena, R.; Celler, B. Home telemonitoring for chronic disease management: Perceptions of users and factors influencing adoption. Health Inform. J. 2021, 27, 1460458221997893. [Google Scholar] [CrossRef]
  6. Queirós, A.; Pereira, L.; Dias, A.; Rocha, N.P. Technologies for Ageing in Place to Support Home Monitoring of Patients with Chronic Diseases. In Proceedings of the 10th International Joint Conference on Biomedical Engineering Systems and Technologies, Porto, Portugal, 21–23 February 2017; pp. 66–76. [Google Scholar] [CrossRef]
  7. Walker, R.C.; Tong, A.; Howard, K.; Palmer, S.C. Patient expectations and experiences of remote monitoring for chronic diseases: Systematic review and thematic synthesis of qualitative studies. Int. J. Med. Inform. 2019, 124, 78–85. [Google Scholar] [CrossRef] [PubMed]
  8. Lucangeli, L.; D’Angelantonio, E.; Camomilla, V.; Pallotti, A. SISTINE: Sensorized Socks for Telemonitoring of Vascular Disease Patients. In Proceedings of the 2021 IEEE International Workshop on Metrology for Industry 4.0 & IoT (MetroInd4.0&IoT), Rome, Italy, 7–9 June 2021; pp. 192–197. [Google Scholar] [CrossRef]
  9. Henriques, J.; Carvalho, P.; Paredes, S.; Rocha, T.; Habetha, J.; Antunes, M.; Morais, J. Prediction of Heart Failure Decompensation Events by Trend Analysis of Telemonitoring Data. IEEE J. Biomed. Health Inform. 2014, 19, 1757–1769. [Google Scholar] [CrossRef]
  10. Dunn, J.; Runge, R.; Snyder, M. Wearables and the medical revolution. Pers. Med. 2018, 15, 429–448. [Google Scholar] [CrossRef] [Green Version]
  11. Eletter, S.; Yasmin, T.; Elrefae, G.; Aliter, H.; Elrefae, A. Building an Intelligent Telemonitoring System for Heart Failure: The Use of the Internet of Things, Big Data, and Machine Learning. In Proceedings of the 2020 21st International Arab Conference on Information Technology (ACIT), Giza, Egypt, 28–30 November 2020; pp. 1–5. [Google Scholar] [CrossRef]
  12. Kitsiou, S.; Paré, G.; Jaana, M. Effects of Home Telemonitoring Interventions on Patients with Chronic Heart Failure: An Overview of Systematic Reviews. J. Med. Internet Res. 2015, 17, e63. [Google Scholar] [CrossRef] [Green Version]
  13. World Health Organization. Cardiovascular Diseases (CVDs). 2021. Available online: https://www.who.int/news-room/fact-sheets/detail/cardiovascular-diseases-(cvds) (accessed on 1 August 2021).
  14. Khunti, K. Accurate interpretation of the 12-lead ECG electrode placement: A systematic review. Health Educ. J. 2013, 73, 610–623. [Google Scholar] [CrossRef]
  15. Kwon, S.; Lee, S.-R.; Choi, E.-K.; Ahn, H.-J.; Song, H.-S.; Lee, Y.-S.; Oh, S. Validation of Adhesive Single-Lead ECG Device Compared with Holter Monitoring among Non-Atrial Fibrillation Patients. Sensors 2021, 21, 3122. [Google Scholar] [CrossRef]
  16. Bayoumy, K.; Gaber, M.; Elshafeey, A.; Mhaimeed, O.; Dineen, E.H.; Marvel, F.A.; Martin, S.S.; Muse, E.D.; Turakhia, M.P.; Tarakji, K.G.; et al. Smart wearable devices in cardiovascular care: Where we are and how to move forward. Nat. Rev. Cardiol. 2021, 18, 581–599. [Google Scholar] [CrossRef] [PubMed]
  17. Kirchhof, P.; Benussi, S.; Kotecha, D.; Ahlsson, A.; Atar, D.; Casadei, B.; Castella, M.; Diener, H.C.; Heidbuchel, H.; Hendriks, J.; et al. 2016 ESC Guidelines for the Management of Atrial Fibrillation Developed in Collaboration with EACTS. Eur. Heart J. 2016, 37, e636–e683. [Google Scholar] [CrossRef] [Green Version]
  18. Duncker, D.; Ding, W.Y.; Etheridge, S.; Noseworthy, P.A.; Veltmann, C.; Yao, X.; Jared Bunch, T.; Gupta, D. Smart Wearables for Cardiac Monitoring—Real-World Use beyond Atrial Fibrillation. Sensors 2021, 21, 2539. [Google Scholar] [CrossRef] [PubMed]
  19. Nicolò, A.; Massaroni, C.; Schena, E.; Sacchetti, M. The Importance of Respiratory Rate Monitoring: From Healthcare to Sport and Exercise. Sensors 2020, 20, 6396. [Google Scholar] [CrossRef] [PubMed]
  20. Vanegas, E.; Igual, R.; Plaza, I. Sensing Systems for Respiration Monitoring: A Technical Systematic Review. Sensors 2020, 20, 5446. [Google Scholar] [CrossRef] [PubMed]
  21. Massaroni, C.; Nicolò, A.; Presti, D.L.; Sacchetti, M.; Silvestri, S.; Schena, E. Contact-Based Methods for Measuring Respiratory Rate. Sensors 2019, 19, 908. [Google Scholar] [CrossRef] [Green Version]
  22. Orphanidou, C.; Fleming, S.; Shah, S.A.; Tarassenko, L. Data Fusion for Estimating Respiratory Rate from a Single-Lead ECG. Biomed. Signal Process. Control 2013, 8, 98–105. [Google Scholar] [CrossRef]
  23. Majumder, S.; Mondal, T.; Deen, M.J. Wearable Sensors for Remote Health Monitoring. Sensors 2017, 17, 130. [Google Scholar] [CrossRef]
  24. Masip, J.; Gayà, M.; Páez, J.; Betbesé, A.; Vecilla, F.; Manresa, R.; Ruíz, P. Pulsioximetría en el diagnóstico de insuficiencia cardiaca aguda. Rev. Esp. Cardiol. 2012, 65, 879–884. [Google Scholar] [CrossRef]
  25. Kirschen, G.W.; Singer, D.D.; Thode, H.C.; Singer, A.J. Relationship between body temperature and heart rate in adults and children: A local and national study. Am. J. Emerg. Med. 2020, 38, 929–933. [Google Scholar] [CrossRef]
  26. Mukhopadhyay, S.C. Wearable Sensors for Human Activity Monitoring: A Review. IEEE Sens. J. 2014, 15, 1321–1330. [Google Scholar] [CrossRef]
  27. Reith, J.; Jørgensen, H.; Pedersen, P.; Nakamaya, H.; Jeppesen, L.; Olsen, T.; Raaschou, H. Body temperature in acute stroke: Relation to stroke severity, infarct size, mortality, and outcome. Lancet 1996, 347, 422–425. [Google Scholar] [CrossRef]
  28. Geurts, M.; on behalf of the DUST investigators; Scheijmans, F.E.V.; van Seeters, T.; Biessels, G.J.; Kappelle, L.J.; Velthuis, B.K.; van der Worp, H.B. Temporal profile of body temperature in acute ischemic stroke: Relation to infarct size and outcome. BMC Neurol. 2016, 16, 233. [Google Scholar] [CrossRef] [Green Version]
  29. Chowdhury, M.H.; Hossain, Q.D.; Saha, P.; Rahaman, M. Design, fabrication and performance evaluation of a three electrode ECG recorder. In Proceedings of the 2016 International Conference on Innovations in Science, Engineering and Technology (ICISET), Dhaka, Bangladesh, 28–29 October 2016; pp. 1–4. [Google Scholar] [CrossRef]
  30. Guvenc, H. Wireless ECG Device with Arduino. In Proceedings of the 2020 Medical Technologies Congress (TIPTEKNO), Antalya, Turkey, 19–20 November 2020; pp. 1–4. [Google Scholar] [CrossRef]
  31. Gifari, M.W.; Zakaria, H.; Mengko, R. Design of ECG Homecare:12-lead ECG acquisition using single channel ECG device developed on AD8232 analog front end. In Proceedings of the 2015 International Conference on Electrical Engineering and Informatics (ICEEI), Denpasar, Indonesia, 10–11 August 2015; pp. 371–376. [Google Scholar] [CrossRef]
  32. Prasad, A.S.; Kavanashree, N. ECG Monitoring System Using AD8232 Sensor. In Proceedings of the 2019 International Conference on Communication and Electronics Systems (ICCES), Coimbatore, India, 17–19 July 2019; pp. 976–980. [Google Scholar] [CrossRef]
  33. Ghifari, A.F.; Perdana, R.S. Minimum System Design of The IoT-Based ECG Monitoring. In Proceedings of the 2020 International Conference on ICT for Smart Society (ICISS), Bandung, Indonesia, 19–20 November 2020; pp. 1–6. [Google Scholar] [CrossRef]
  34. Penica, M.; Mohandas, R.; Bhattacharya, M.; Vancamp, K.; Hayes, M.; O’Connell, E. A Covid-19 viral transmission prevention system for embedded devices utilising deep learning. In Proceedings of the 2021 32nd Irish Signals and Systems Conference (ISSC), Athlone, Ireland, 10–11 June 2021; pp. 1–8. [Google Scholar] [CrossRef]
  35. Saha, R.; Biswas, S.; Sarmah, S.; Karmakar, S.; Das, P. A Working Prototype Using DS18B20 Temperature Sensor and Arduino for Health Monitoring. SN Comput. Sci. 2021, 2, 33. [Google Scholar] [CrossRef]
  36. Fajrin, H.R.; Ilahi, M.R.; Handoko, B.S.; Permatasari, I. Body temperature monitoring based on telemedicine. J. Phys. Conf. Ser. 2019, 1381, 012014. [Google Scholar] [CrossRef]
  37. Bates, A.; Ling, M.J.; Mann, J.; Arvind, D. Respiratory Rate and Flow Waveform Estimation from Tri-axial Accelerometer Data. In Proceedings of the 2010 International Conference on Body Sensor Networks, Singapore, 7–9 June 2010; pp. 144–150. [Google Scholar] [CrossRef]
  38. Ahsanuzzaman, S.; Ahmed, T.; Rahman, A. Low Cost, Portable ECG Monitoring and Alarming System Based on Deep Learning. In Proceedings of the 2020 IEEE Region 10 Symposium (TENSYMP), Dhaka, Bangladesh, 5–7 June 2020; pp. 316–319. [Google Scholar] [CrossRef]
  39. Hughes, S.; Liu, H.; Zheng, D. Influences of Sensor Placement Site and Subject Posture on Measurement of Respiratory Frequency Using Triaxial Accelerometers. Front. Physiol. 2020, 11, 823. [Google Scholar] [CrossRef] [PubMed]
  40. Ferrazza, M.; D’Abbondanza, N.; Piuzzi, E.; Pallotti, A. Statistical classification for the screening of cardiological patients by means of a sensorized T-shirt. In Proceedings of the 2021 International Electronic Conference on Applied Sciences, Online, 15–31 October 2021. [Google Scholar]
Figure 1. (a) Sensorized T-shirt integrating temperature sensor (red), triaxial accelerometer (blue), pulse oximeter (green), and electrode placement (yellow). (b) Illustration of system design with both transmission units. In particular, the Android App has been created for telemonitoring applications.
Engproc 11 00048 g001
Figure 2. (a) Three cardiac cycles extracted from an ECG acquisition. (b) Accelerometer output along z-axis, perpendicular to the torso. In the first 5 s, the subject was not breathing.
Engproc 11 00048 g002
Figure 3. (a) Temperature sensor output and mean value; (b) Pulse oximeter output and SpO2 mean value.
Engproc 11 00048 g003
Publisher’s Note: MDPI stays neutral with regard to jurisdictional claims in published maps and institutional affiliations.

