Proceeding Paper

The Relationship between the Degree of Conversion in Dental Dimethacrylate Polymers Determined by Infrared Spectroscopy and Polymerization Shrinkage †

by
Marta W. Chrószcz
*,
Izabela M. Barszczewska-Rybarek
and
Promise Wori
Department of Physical Chemistry and Technology of Polymers, Silesian University of Technology, Strzody 9, 44-100 Gliwice, Poland
*
Author to whom correspondence should be addressed.
Presented at the 2nd International Electronic Conference on Applied Sciences, 15–31 October 2021; Available online: https://asec2021.sciforum.net/.
Eng. Proc. 2021, 11(1), 52; https://doi.org/10.3390/ASEC2021-11151
Published: 15 October 2021
(This article belongs to the Proceedings of The 2nd International Electronic Conference on Applied Sciences)

Abstract

:
In this work, the relationship between the degree of conversion (DC) in the Bis-GMA/TEGDMA polymer networks, determined by two methods—Fourier transform infrared spectroscopy (DCIR) and polymerization shrinkage (DCS)—was studied. The DCIR was calculated by using the internal standard method, whereas the DCS was calculated by measuring differences in the monomer and polymer densities, resulting in the polymerization shrinkage. Both methods revealed the same trend in the DC changes with alterations in the Bis-GMA/TEGDMA ratio. However, the DCS values were lower, in comparison to the DCIR values on average by 18%.

1. Introduction

The degree of conversion (DC) is the most useful parameter in the characterization of dental composite restorative materials based on dimethacrylates. Its value informs about curing efficiency. If the curing level is insufficient, the physicochemical and mechanical properties of the composite can significantly deteriorate [1]. Inadequate curing also decreases the biocompatibility of the material, due to an increase in free monomer content, which tends to leach from the composite matrix [2,3].
It is known from the literature that the DC depends on the monomer chemical structure [1,3,4]. Monomers of highly elastic molecules polymerize to higher DCs, whereas those of stiff molecules polymerize to lower DCs. In particular, bisphenol A glycerolate dimethacrylate (Bis-GMA), the most important and commonly used dental monomer, has a stiff and spacious molecule, willing to form hydrogen bonds, which causes a serious DC limitation. Therefore, it can achieve a limiting DC of 39% when homopolymerized [4]. It is the major drawback of Bis-GMA because the DC below 55% is not acceptable in practical applications [5]. To achieve a sufficiently high DC, Bis-GMA has to be copolymerized with monomers of more elastic and smaller molecules [6,7]. Triethylene glycol dimethacrylate (TEGDMA) is the most commonly used in this field. In addition to the monomer chemical structure, several other factors influence the DC. They include (i) initiation method and initiator type [8,9], (ii) irradiation time [7], (iii) sample thickness [10], (iv) irradiation lamp [11], and (v) filler type and content [12].
The most popular techniques used for the DC determination include (i) Fourier transform infrared spectroscopy (FTIR), (ii) Raman spectroscopy (RS), (iii) solid-state nuclear magnetic resonance (ssNMR), and (iv) differential scanning calorimetry (DSC).
The DC determination method that uses FTIR is the most common, simple, and gives the most reliable results [1]. It is based on the monitoring of changes in the absorption intensity of several bands resulting from vibrations of the C=C double bond, present in the methacrylate group. They include: (i) twisting vibrations (816 cm−1), (ii) wagging vibrations (948 cm−1), and (iii) stretching vibrations (1637 cm−1) [1,13]. The intensity of these bands decreases due to polymerization. As the band located at 1637 cm−1 is the most resolved and intense, it is the most commonly used for DC determination [13]. However, to comply with the Beer–Lambert law, the C=C absorption intensity has to be related to the absorption intensity of an internal standard—the band whose absorption intensity does not alter due to the polymerization [14]. The band corresponding to the skeletal stretching vibrations of the C–C bonds in the aromatic ring, located at 1608 cm−1, usually serves as an internal standard [4]. If the system lacks an aromatic ring, the band corresponding to the C=O stretching vibrations, located within 1715 and 1720 cm−1, can be used [4]. However, this method produces underestimated DC values and therefore it is recognized as less reliable compared to that using aromatic internal standard [15,16].
An alternative solution for the DC determination in dimethacrylate composites might be a method based on measuring differences in the monomer and polymer densities resulting from the polymerization shrinkage and calculating its theoretical value (DCS). The calculation of the latter uses the literature information that the molar volume of one mole of the methacrylate group decreases by 22.5 cm3 [17] due to polymerization, in the course of which van der Waals forces that occur between monomer molecules turn into covalent bonds that constitute crosslinks of hardened composite matrix [1]. This method has already been applied in the survey on the DC of dimethacrylate systems, however, its reliability has not yet been established.
In this study, a series of dimethacrylate copolymers consisting of various Bis-GMA/TEGDMA various ratios were subjected to FTIR and polymerization shrinkage analyses to determine the DC and relationship between the results from both methods.

2. Materials and Methods

2.1. Materials

Bis-GMA, camphorquinone (CQ), dimethylaminoethyl methacrylate (DMAEMA), and TEGDMA were purchased from Sigma Aldrich (St. Louis, MO, USA).

2.2. Sample Preparation

Seven Bis-GMA/TEGDMA mixtures were prepared. The Bis-GMA weight fraction ranged from 20 to 80% and increased by 10% each time. TEGDMA content decreased proportionally. The mixtures were admixed with the 0.4 wt.% CQ and 1 wt.% DMAEMA that was a photoinitiating system, composed of, respectively, initiator/and accelerator. Thus, prepared compositions were introduced into silicon molds with a diameter of 15 cm and 5 cm thick, covered with PET film to prevent oxygen inhibition, and irradiated with the UV-VIS lamp (Ultra Vitalux 300, Osram, Munich, Germany, 280 to 750 nm, 2400 mW/cm2) for 1h, from a distance of 15 cm.

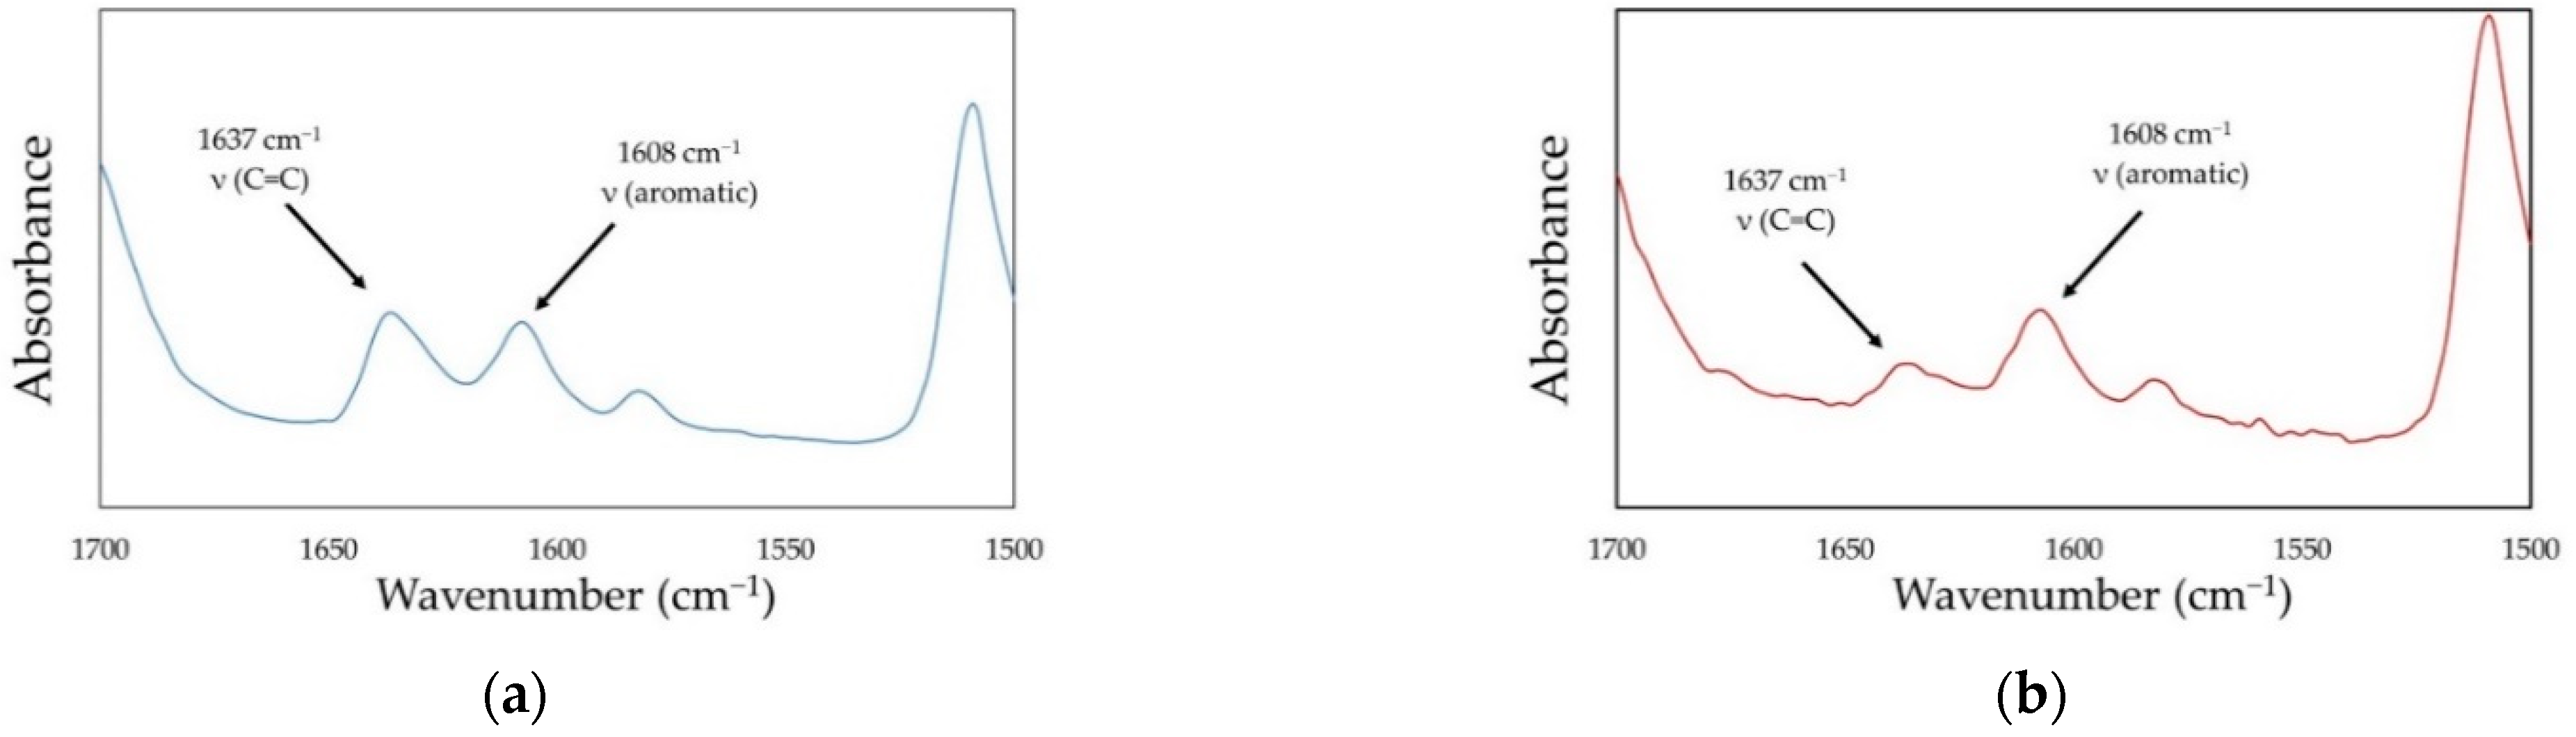
2.3. Fourier Transform Infrared Spectroscopy (FTIR)

2.3.1. Instrumentation

FTIR spectra were recorded with the use of a Spectrum Two (Perkin-Elmer, Waltham, MA, USA) spectrometer, with 128 scans at a resolutions of 1cm−1. Monomers and polymers were tested as KBr pellets. A thin layer of a monomer was placed between two KBr pellets, whereas a polymer was ground into a fine powder with a grain size smaller than 25 µm, mixed with KBr powder, and pressed into a pellet.

2.3.2. Calculation of the Degree of Conversion (DCIR)

The DCIR was calculated with the use of the following equation:
DC IR ( % ) = ( ( A C = C A A r ) p o l y m e r ( A C = C A A r ) m o n o m e r ) × 100 ,
where AC=C is the absorption intensity of the band resulting from the carbon–carbon double bond stretching vibrations, located at 1637 cm−1, and AAr is the absorption intensity of the internal standard—the band resulting from the skeletal stretching vibrations of the carbon–carbon bonds in the aromatic rings, located at 1608 cm−1.

2.4. Polymerization Shrinkage

2.4.1. Density Measurements

Densities of monomers (dm) were measured with the use of a 1 mL pyknometer, according to the ISO 1675 standard [18]. Densities of polymers (dp) were determined with the use of an analytical balance (XP balance, Mettler Toledo, Greifensee, Switzerland), equipped with a density determination kit that uses the Archimedes’ principle.

2.4.2. Calculation of the Polymerization Shrinkage

The experimental polymerization shrinkage (S) was calculated with the use of the following equation:
S ( % ) = ( 1 d m d p ) × 100 ,
where dm is the density of a monomer mixture, and dp is the density of the corresponding polymer.
The theoretical polymerization shrinkage (Stheor) was calculated on the assumption that the volumetric shrinkage of one mole of the methacrylate double bonds is equal to 22.5 cm3 [17], according to the following equation:
S t h e o r ( % ) = ( 1 M W d m 2 × 22.5 M W d m ) × 100 ,
where MW is the molecular weight of a monomer mixture, dm is the density of a monomer mixture, 2 is the number of double bonds in the monomer molecule, and 22.5 is the volumetric contraction of one mole of the methacrylate group due to its polymerization [17].

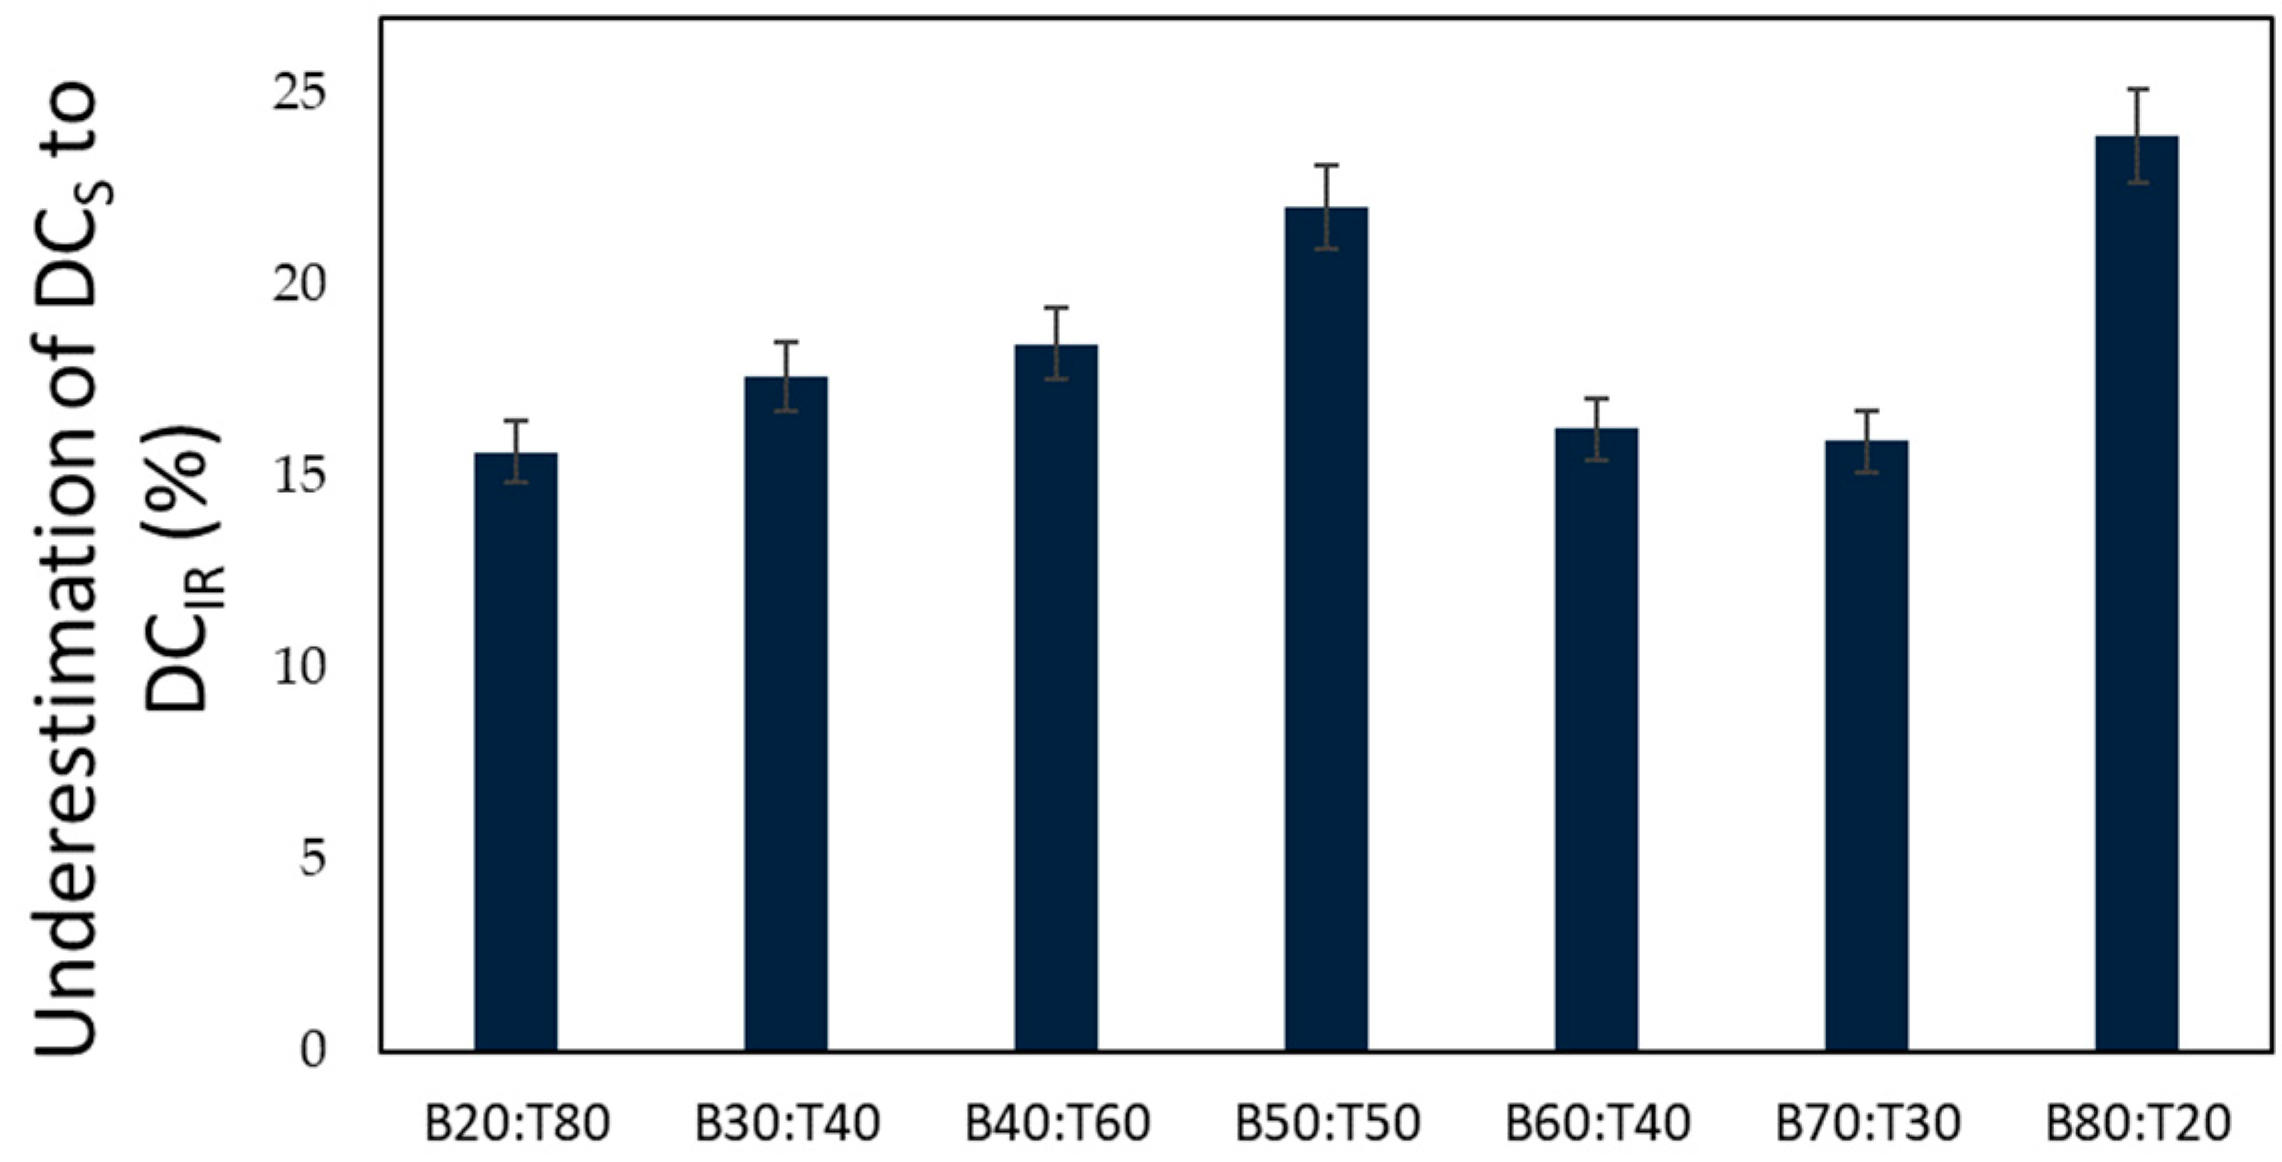
2.4.3. Calculation of the Degree of Conversion (DCS)

The DCS was calculated according to the following equation:
D C S ( % ) = S S t h e o r × 100 ,
where S is the experimental polymerization shrinkage, and Stheor is the theoretical polymerization shrinkage.

3. Results and Discussion

In this study, seven compositions of Bis-GMA and TEGDMA monomers were prepared, polymerized, and characterized for the density, polymerization shrinkage, and degree of conversion. The latter was determined by two methods—Fourier transform infrared spectroscopy and polymerization shrinkage.
The weight ratios of prepared compositions, their molecular weights (MW), concentrations of double bonds (xDB), and densities of the samples, before and after curing, are summarized in Table 1. The xDB values ranged from 4.52 to 6.37 mol/kg. Its value decreased as the Bis-GMA content increased. The percentage difference between the xDB of the B20:T80 and B80:T20 samples was 41%. As the xDB value informs about the theoretical crosslink density of the dimethacrylate polymer network, it can be said that the greater the Bis-GMA concentration in the monomer mixture, the lower the crosslink density in the resulting polymer network [1,4,8].
As can be seen from Table 1, the densities of monomer mixtures (dm) ranged from 1.106 to 1.147 g/cm3. The dm value increased as the Bis-GMA content increased. The percentage difference between the dm values determined for the B20:T80 and B80:T20 samples was 4%. As expected, polymerization resulted in tighter packing, which was reflected in higher densities of cured materials compared to the densities of their uncured counterparts (on average by 7.5%). The polymer densities (dp) ranged from 1.194 to 1.233 g/cm3. Its value increased with the increase of the Bis-GMA content up to 70 wt.% and then decreased. The percentage difference between the largest and the smallest dp values was 3%. The density values of cured and uncured samples were used to determine the experimental and theoretical polymerization shrinkages (respectively, S and Stheor). These results are summarized in Table 2.
The S values ranged from 5.44 to 7.57%. They showed no clear trend throughout the studied series. The highest S value was determined for the B70:T30 sample, whereas the lowest S value was determined for the B80:T20 sample. The percentage difference between the largest and smallest S values was 40%. The Stheor values ranged from 11.66 to 15.85% and decreased with the increase in the Bis-GMA content. This relationship resulted from a decreasing concentration of double bonds in this order, because the lower the concentration of double bonds, the lower the volumetric contraction can occur. The percentage difference between the lowest and highest Stheor values was 34%. Stheor and S were further used to determine the DCS (Table 2). The DCS values ranged from 46.68 to 61.23%. It can be seen that the DCS increased with the increasing Bis-GMA content up to 70 wt.% and then decreased.
The degree of conversion was also examined by using the FTIR technique (DCIR). Representative FTIR spectra of the B80:T20 uncured and cured samples are shown in Figure 1. The FT IR spectra of the remaining compositions in their cured and uncured forms can be found in the Supplementary Materials (Figures S1–S6). The results obtained for the DCIR are summarized in Table 2. DCIR values ranged from 55.30 to 61.34%. As can be seen from Table 2, the DCIR values were higher than the corresponding DCS values. Nevertheless, it is worth noting that a similar tendency was observed in both methods. The DCIR values increased as the Bis-GMA content increased up to 70% and then decreased when the Bis-GMA content exceeded 70%. The difference between the DCS and DCIR values ranged from 15.66 to 23.90% (Figure 2).
The underestimation of the DCS values to the DCIR values can be explained by the fact that the volumetric contraction does not only depend on the concentration of double bonds, but that other factors, too, play an essential role in this phenomenon. They include dimensions, shapes, and hydrophilicity of monomer molecules [19]. The Bis-GMA molecule is large, stiff, and hydrophilic. On the contrary, the TEGDMA molecule is small, elastic, and much less hydrophilic. By increasing the Bis-GMA content, its molecular features increase their impact on the ability to pack tightly. This probably resulted in lower dp values than expected. In addition, the increase in the Bis-GMA content caused an increase in the viscosity of the monomer mixture, which might increase the inaccuracy of the dp measurement (the higher the viscosity, the higher the air trapping probability that decreases density). However, the literature shows that the DCIR values calculated with the use of the carbonyl internal standard (instead of the aromatic one) are also underestimated. Collares et al. [16] found that the DCIR values of the Bis-GMA/TEGDMA compositions, determined with the use of carbonyl internal standard, were lower by 23% in comparison to the DCIR determined with the use of the aromatic internal standard.

4. Conclusions

The methodology of the degree of conversion determination in dimethacrylate polymers based on the measurements of the polymerization shrinkage can be a valuable alternative to the methodology based on the FTIR measurements. It produces underestimated results compared to the methodology by using an aromatic internal standard. However, the results achieved with the use of the carbonyl internal standard can be less consistent.

Supplementary Materials

The following supporting information can be downloaded at: https://www.mdpi.com/article/10.3390/ASEC2021-11151/s1, Figure S1: The FTIR spectra of the B20:T80 composition in its uncured (a) and cured (b) forms; Figure S2: The FTIR spectra of the B30:T70 composition in its uncured (a) and cured (b) forms; Figure S3: The FTIR spectra of the B40:T60 composition in its uncured (a) and cured (b) forms; Figure S4: The FTIR spectra of the B50:T50 composition in its uncured (a) and cured (b) forms; Figure S5: The FTIR spectra of the B60:T40 composition in its uncured (a) and cured (b) forms; Figure S6: The FTIR spectra of the B70:T30 composition in its uncured (a) and cured (b) forms.

Author Contributions

Conceptualization, I.M.B.-R.; methodology, I.M.B.-R. and M.W.C.; investigation, M.W.C. and P.W.; resources, I.M.B.-R. and M.W.C.; data curation, I.M.B.-R., M.W.C. and P.W.; writing—original draft preparation, I.M.B.-R. and M.W.C.; writing—review and editing, I.M.B.-R.; visualization, M.W.C.; supervision, I.M.B.-R.; project administration, I.M.B.-R. All authors have read and agreed to the published version of the manuscript.

Funding

This research was funded by the Rector’s grant for the scientific research and development activities in the Silesian University of Technology, grant number: 32/014/RGJ22/2004.

Institutional Review Board Statement

Not applicable.

Informed Consent Statement

Not applicable.

Data Availability Statement

Data supporting reported results are available from the authors.

Conflicts of Interest

The authors declare no conflict of interest. The funders had no role in the design of the study; in the collection, analyses, or interpretation of data; in the writing of the manuscript, or in the decision to publish the results.

References

  1. Barszczewska-Rybarek, I.M. A Guide through the Dental Dimethacrylate Polymer Network Structural Characterization and Interpretation of Physico-Mechanical Properties. Materials 2019, 12, 4057. [Google Scholar] [CrossRef] [PubMed] [Green Version]
  2. Gajewski, V.E.S.; Pfeifer, C.S.; Fróes-Salgado, N.R.G.; Boaro, L.C.C.; Braga, R.R. Monomers used in resin composites: Degree of conversion, mechanical properties and water sorption/solubility. Braz. Dent. J. 2012, 23, 508–514. [Google Scholar] [CrossRef] [PubMed]
  3. Kannurpatti, A.; Anseth, J.; Bowman, C.H.N. A study of the evolution of mechanical properties and structural heterogeneity of polymer networks formed by photo-polymerizations of multifunctional (meth)acrylates. Polymer 1998, 39, 2507–2513. [Google Scholar] [CrossRef]
  4. Sideridou, I.; Tserki, V.; Papanastasiou, G. Effect of chemical structure on degree of conversion in light-cured dimethacrylate-based dental resins. Biomaterials 2002, 23, 1819–1829. [Google Scholar] [CrossRef]
  5. Alshali, R.Z.; Silikas, N.; Satterthwaite, J.D. Degree of conversion of bulk-fill compared to conventional resin-composites at two time intervals. Dent. Mater. 2013, 29, e213–e217. [Google Scholar] [CrossRef] [PubMed]
  6. Dickens, H.; Stansbury, J.W.; Choi, K.M.; Floyd, C.J.E. Photopolymerization kinetics of methacrylate dental resins. Macromolecules 2003, 36, 6043–6053. [Google Scholar] [CrossRef]
  7. Pfeifer, C.S.; Shelton, Z.R.; Braga, R.R.; Windmoller, D.; Machado, J.C.; Stansbury, J.W. Characterization of dimethacrylate polymeric networks: A study of the crosslinked structure formed by monomers used in dental composites. Eur. Polym. J. 2011, 47, 162–170. [Google Scholar] [CrossRef] [PubMed] [Green Version]
  8. Stansbury, J.W. Dimethacrylate network formation and polymer property evolution as determined by the selection of monomers and curing conditions. Dent. Mater. 2012, 28, 13–22. [Google Scholar] [CrossRef] [PubMed] [Green Version]
  9. Barszczewska-Rybarek, I.; Chladek, G. Studies on the curing efficiency and mechanical properties of Bis-GMA and TEGDMA nanocomposites containing silver nanoparticles. Int. J. Mol. Sci. 2018, 19, 3937. [Google Scholar] [CrossRef] [PubMed] [Green Version]
  10. Par, M.; Gamulin, O.; Marovic, D.; Klaric, E.; Tarle, Z. Raman spectroscopic assessment of degree of conversion of bulk-fill resin composites—Changes at 24 hours post cure. Open. Dent. 2015, 40, e92–e101. [Google Scholar] [CrossRef] [PubMed]
  11. Randolph, L.D.; Palin, W.M.; Bebelman, S.; Devaux, J.; Gallez, B.; Leloup, G.; Leprince, J.G. Ultra-fast light-curing resin composite with increased conversion and reduced monomer elution. Dent. Mater. 2014, 30, 594–604. [Google Scholar] [CrossRef] [PubMed]
  12. Halvorson, R.H.; Erickson, R.L.; Davidson, C.L. The effect of filler and silane content on conversion of resin-based composite. Dent. Mater. 2003, 19, 327–333. [Google Scholar] [CrossRef]
  13. Lin-Vien, D.; Colthup, N.B.; Fateley, W.G.; Grasselli, J.G. The Handbook of Infrared and Raman Characteristic Frequencies of Organic Molecules; Academic Press: London, UK, 1991; pp. 137–281. [Google Scholar]
  14. Moraes, L.G.; Rocha, R.S.; Menegazzo, L.M.; de Araújo, E.B.; Yukimito, K.; Moraes, J.C. Infrared spectroscopy: A tool for determination of the degree of conversion in dental composites. J. Appl. Oral. Sci. 2008, 16, 145–149. [Google Scholar] [CrossRef] [PubMed]
  15. Barszczewska-Rybarek, I.M. Quantitative determination of degree of conversion in photocured poly(urethane-dimethacrylate)s by FTIR spectroscopy. J. Appl. Polym. Sci. 2012, 123, 1604–1611. [Google Scholar] [CrossRef]
  16. Collares, F.M.; Portella, F.F.; Leitune, V.C.B.; Samuel, S.M.W. Discrepancies in degree of conversion measurements by FTIR. Braz. Oral. Res. 2014, 28, 9–15. [Google Scholar]
  17. Patel, M.P.; Braden, M.; Davy, K.W.M. Polymerization shrinkage of methacrylate esters. Biomaterials 1987, 8, 53–56. [Google Scholar] [CrossRef]
  18. ISO 1675:1985; Plastics—Liquid Resins—Determination of Density by the Pyknometer Method. International Standard Organisation: London, UK, 1985.
  19. Oliveira, K.M.; Lancellotti, A.C.; Ccahuana-Vásquez, R.A.; Consani, S. Shrinkage stress and degree of conversion of dental composite submitted to different photoactivation protocols. Acta. Odontol. Latinoam. 2012, 25, 115–122. [Google Scholar] [PubMed]
Figure 1. The representative FTIR spectra of the B80:T20 composition in its uncured (a) and cured (b) forms.
Engproc 11 00052 g001
Figure 2. The percentage of underestimation of the DCS values to the DCIR values.
Engproc 11 00052 g002
Table 1. Sample names, their chemical compositions, and properties: MW, molecular weight, xDB, concentration of double bonds, dm, density of uncured samples, and dp, density of cured samples.
Sample NameWeight RatiosMW (g/mol)xDB (mol/kg)dm (g/cm3)dp (g/cm3)
Bis-GMATEGDMAavg.SDavg.SD
B20:T802080314.076.371.1060.0241.1940.029
B30:T703070330.096.061.1130.0521.2040.025
B40:T604060347.785.751.1210.0721.2070.061
B50:T505050367.515.441.1270.0461.2100.014
B60:T406040389.605.131.1330.0621.2190.016
B70:T307030414.504.831.1410.0941.2330.033
B80:T208020442.814.521.1470.1351.2160.019
Table 2. The theoretical (Stheor) and experimental polymerization shrinkage (S) as well as the degree of conversion, calculated from the polymerization shrinkage (DCS) and absorption intensity (DCIR).
Sample NameStheor (%)S (%)DCS (%)DCIR (%)
avg.SDavg.SDavg.SD
B20:T8015.857.390.4546.642.3255.305.23
B30:T7015.177.550.5249.812.5660.474.78
B40:T6014.497.210.4149.752.3161.015.23
B50:T5013.806.890.4649.883.0463.973.56
B60:T4013.097.110.3954.334.3464.874.87
B70:T3012.387.570.5561.233.4572.835.44
B80:T2011.665.440.2546.682.9861.345.34
Publisher’s Note: MDPI stays neutral with regard to jurisdictional claims in published maps and institutional affiliations.

