Abstract
Implementing “first-time-right” production processes increases a production line’s sustainability and minimizes rejects. Multi-camera systems are a key element since they can quickly detect defects without contact. However, it is still a time-consuming challenge to determine the correct number and position of cameras to achieve gapless surface monitoring of complex components. This proposal aims to develop a new software tool that automatically calculates and visualizes surface coverage by using bipolar plates as an example. With this method, 100% surface coverage inspections become feasible, and the cost of commissioning multi-camera inspection systems can be significantly decreased.
1. Introduction
Currently, quality inspection takes place in many industries and is mainly performed manually by trained employees [1]. However, this process is time-consuming and represents a potential “bottleneck” in the production line. To ensure this does not have a negative impact on production speed, 100% inspections of complex components are either not carried out or are only done on partial quantities. The inspection of all components would require more employees, which is time-consuming and costly. To overcome this, so-called inline-capable multi-camera inspection systems are used [2]. One disadvantage of such systems is that they are often not available as standard solutions, and therefore customer-specific solutions have to be developed [3]. The challenge here is to determine suitable sensor placement (usually camera placement) that covers the entire surface to be monitored without gaps. For static (non-moving) parts, various methods already exist for automatic planning camera placement and optimization of surface coverage [3,4,5,6]. An overview of the different methods is presented in [7].
In practice, static solutions are only applicable to a limited extent since multi-camera inspection systems are mainly used in the quality assurance of moving parts to meet the high production rates. In the static approach, one camera is responsible for only one area of the part being inspected, while in the dynamic approach, one camera is responsible for multiple areas (as the part moves along the conveyor belt, multiple images are captured). The development of such complex multi-camera systems is either based on expert knowledge or an iterative trial-and-error process [8]. A particular challenge here is the non-trivial manual calculation of the entire surface coverage. In addition, each time the camera position is changed, the calculations must be performed again. With a large number of cameras and a complex surface geometry, this process can take several weeks or even months. Errors that occur during the design phase and persist until the deployment phase, can lead to time-consuming commissioning and significant delays in the ramp-up phase. The simulation of the surface coverage using 3D CAD data could ease this process. The scope of this paper is the development of a software tool for simulating the surface coverage of multi-camera inspection systems for dynamic (moving) parts using their 3D CAD data. By using the software tool, design errors can be identified and eliminated at an early stage. Thin formed bipolar plates (BPP) with fine structures, which are to be used in novel polymer electrolyte membrane electrolyzers (PEM-EL), serve as an application example.
2. Surface Coverage Simulation
When calculating the surface coverage, each point of the surface is assigned a value between zero and one. Two different grading functions exist for the evaluation of surface coverage, which are shown in Figure 1 [9]. In a bivalent function (Figure 1a), only two values are considered, namely one (covered) and zero (not covered). In contrast, the real-valued function (Figure 1b) assigns a real value to each point. This allows prioritizing specific points within the coverage area.
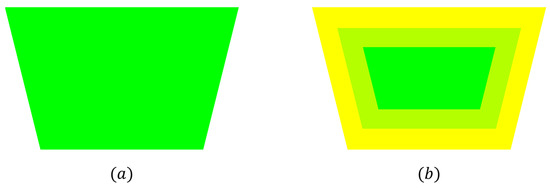
Figure 1.
Graded coverage valuation modeled as: (a) bivalent function, (b) real-valued function.
To calculate and simulate the surface coverage of multi-camera systems, it is necessary to define the camera, environment, and task model [10]. A pinhole camera is used as the camera model, in which the points are projected through the optical center onto the image plane [11]. The camera model is described by intrinsic (internal camera specific parameters like focal length) and extrinsic parameters (like position and orientation) [11,12]. In the developed software tool, the environment model consists of a 3D mesh of triangles. Finally, a task model must be defined to consider certain requirements of the image processing algorithms for surface coverage. The following aspects are crucial: field of view, focus, resolution, and view angle of the camera as well as occlusion.
The field of view determines which points are captured by the camera and which are not. Therefore, the camera field of view is modeled as a bivalent function and can be calculated using the four direction vectors and (Figure 2a). The four direction vectors are computed using the intrinsic camera parameters and the direction vector . Pairwise, the direction vectors span four planes. All points located within the four planes are captured by the camera. A detailed calculation is shown in [13].
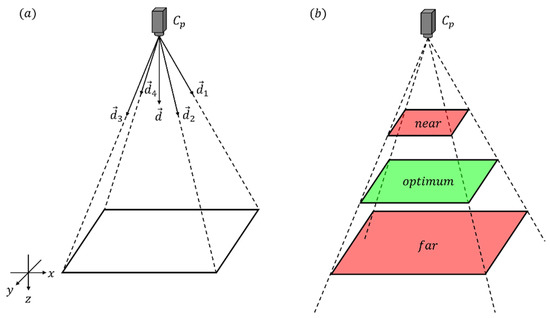
Figure 2.
Visualization of the camera parameters for: (a) field of view, (b) focus.
In order for an object to be focused and displayed sharply, it must be located in the depth-of-field range of the camera. Resolution will not be considered further, since an increase in resolution is meaningless if the object is out-of-focus. To calculate the focus, two planes must be determined: the near and far planes (Figure 2b). Based on the distance of the object and the intrinsic camera parameters, two constants (and ) can be calculated, which correspond to the distance between the camera and the two planes [10,14]. Assuming that an optimal focus lies in the middle of the two planes, the optimal opt is defined as the average of near and far. The focus is calculated using the function , which is defined as:
where is the z-coordinate of the camera position .
Another important aspect of surface coverage is the view angle of the camera. This is considered optimal when the optical axis of the camera is orthogonal to the surface. The calculation of the view angle δ is shown in Figure 3. For this purpose, the angle between the surface normal from the point P and the vector connecting P and the optical center of the camera are determined [10]. Like the focus, the view angle is defined as a real-valued function .
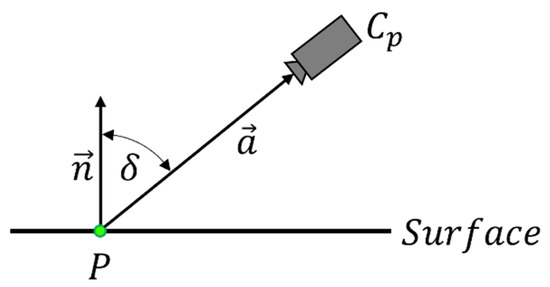
Figure 3.
Calculation of the view angle.
Occlusion computes whether the surface that is going to be covered is obscured or not. Like the camera field of view, occlusion is defined as a bivalent function . Point P is occluded, if and only if the segment between the optical center of the camera and P intersects a surface [10].
The evaluation of the surface coverage considering all the presented aspects is per-formed with the function , defined as:
3. Results and Discussion
In this section, the results of the surface coverage simulation are presented. For visu-alization purposes the output of the evaluation function was converted to color values. See Table 1.

Table 1.
Conversion of the output values to color values and their meaning.
To better understand the influence of the view angle and focus as a function of tilt angle and camera distance to the object surface, Figure 4 illustrates examples of different camera configurations on a flat surface. The first row shows the influence of the view angle. The second row demonstrates the influence of focus, and the last row combines both factors and shows their impact on surface coverage. Furthermore, surface coverages for four different camera tilt angles (45°, 60°, 75°, and 90°) have been considered in each series. Figure 4a shows the results for a camera distance of 200 mm and Figure 4b of 160 mm. It can be seen from Figure 4 (first row) that the view angle depends only on the tilt angle and not on the distance. In contrast to the view angle, the focus depends on both the tilt angle and the distance. Changing the tilt angle also affects the distance of certain areas of the field of view from the camera’s optical center (Figure 4—second row). This effect is clearly visible, especially in the second row of Figure 4a, for the tilt angles 45° and 60°. The combination of view angle and focus results in a degradation of the surface coverage. Figure 4b demonstrates the negative influence of an out-of-focus working distance between camera and object, and clearly shows the importance of this parameter for the design of multi-camera systems. Optimal coverage is achieved at a tilt angle of 90° and a distance of 200 mm.
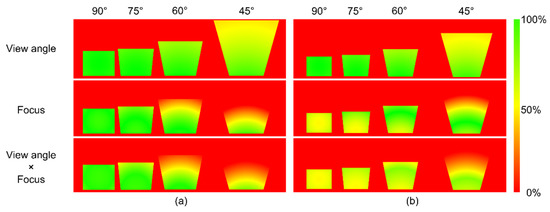
Figure 4.
Visualization of the field of view on a flat surface under the impact of view angle (first row), focus (second row) and combination of both (third row) for four different camera tilt angles: (a) distance between camera and surface is 200 mm and (b) distance between camera and surface is 160 mm.
The implementation of a surface coverage simulation with the developed software tool is performed using a 3D CAD model. In this paper, a prototype 3D CAD model of a BPP for a PEM-EL was used (see Figure 5). The BPP handles the mechanical and electrical interconnection of adjacent single cells. The metallic multi-part assembly consists primarily of two materially joined half plates, the anode, and the cathode. Both half plates have channel structures and contact surfaces. Two different camera configurations were tested to investigate the BPP (see Figure 6). The first configuration (Figure 6a) is a so-called orthogonal model (camera tilt angle of 90°). In the second configuration (Figure 6b), the cameras are arranged in a “V”, briefly referred to as a V-model (camera tilt angle of 60°). A surface coverage simulation is performed in the developed software tool by passing the BPP under the two camera configurations and calculating the surface coverage. The result is shown at the bottom of Figure 6. In both configurations, the BPP is fully covered, but a direct comparison shows that the V-model is more suitable for the inspection of BPP due to the better coverage of the walls of the channel structures. The only disadvantage of the V-model compared to the orthogonal model is that it requires twice as many cameras, which in turn leads to doubled investment costs.
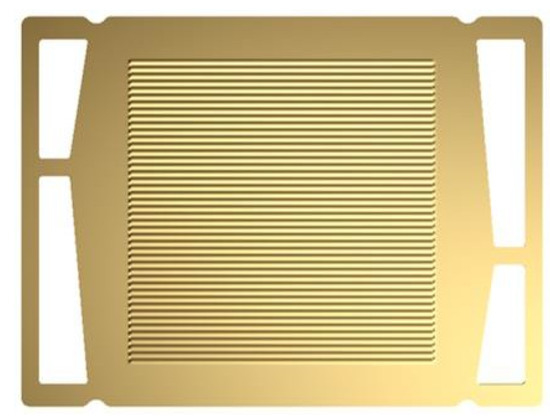
Figure 5.
3D model of a prototype of titan made bipolar plate. Reprinted with permission from Ref. [15]. 2022, Sebastian Melzer.
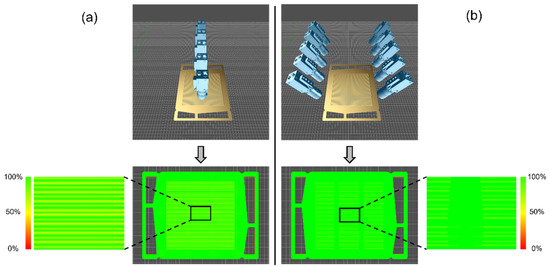
Figure 6.
Two different camera configurations and the result of their coverage simulation: (a) orthogonal model with a camera tilt angle of 90° and (b) V-model with a camera tilt angle of 60°.
As shown, in the developed software tool, a position and/or orientation change of the camera is implemented via the input of parameters, which enables a quick adjustment of the configuration. In contrast, the manual configuration of the camera system, which is still common in practice, involves fine-tuning each individual camera by hand. Adding further cameras is also associated with high (mechanical) effort. To obtain a surface coverage, first the part needs to be passed under the camera configuration to record all images. In the next step, experts carry out a manual calculation and evaluation of the surface coverage for the test configuration. Any camera adjustment results in the need to repeat this process. The execution of several iteration loops significantly delays the commissioning. The solution presented here remedies this by making all adjustments visually available to the user in real time.
4. Conclusions and Future Work
In summary, a software tool has been developed which allows the surface coverage of moving parts to be evaluated for various camera configurations, using BPP as an example. A user-friendly determination of the suitability of various camera configurations can be achieved on the basis of a color scale. The dependence of central parameters, such as the working distance, view angle, and tilt in connection with the focus, could also be shown. Consequently, using the software tool, the commissioning time of multi-camera systems can be significantly reduced by determining a suitable configuration for the desired level of surface coverage. In addition, the tool increases the reliability of optical inspection systems, as complete surface coverage can be verified during the design phase. The number of undetected defects due to insufficient coverage can be significantly reduced.
A possible extension is the implementation of illumination and the calculation of its influence on the surface analysis. Furthermore, there is development potential in the automated determination of a minimum number of cameras including the camera position in space for new unknown objects. After entering an individual coverage rate for specific regions with the corresponding 3D CAD data, the system should calculate a suggestion for a suitable configuration and propose it to the user. It is also conceivable to implement interfaces to hardware manufacturers’ databases to provide an estimate of the investment required for the created configurations. Future work will also include experimental data to validate the efficiency of the presented approach.
Author Contributions
L.G.: Conceptualization, method development, design and implementation of the software tool for surface coverage simulation. R.L.: Method and design validation for the bipolar plate application, interpretation of results. P.K. and M.D.: Project management, critical revision of the article and final approval of the version to be published. All authors were involved in drafting and writing the manuscript. All authors have read and agreed to the published version of the manuscript.
Funding
The project “H2-Giga” Sub-Project “FRHY—Reference Factory for High-Rate Electrolyzer Production” is supported by the German Federal Ministry of Education and Research (BMBF) on the basis of a decision by the German Bundestag.
Institutional Review Board Statement
Not applicable.
Informed Consent Statement
Not applicable.
Data Availability Statement
Not applicable.
Conflicts of Interest
The authors declare no conflict of interest.
References
- Kujawińska, A.; Vogt, K.; Hamrol, A. The Role of Human Motivation in Quality Inspection of Production Processes. In Advances in Ergonomics of Manufacturing: Managing the Enterprise of the Future; Schlick, C., Trzcieliński, S., Eds.; Springer International Publishing: Cham, Switzerland, 2016; pp. 569–579. [Google Scholar]
- Pierer, A.; Wiener, T.; Gjakova, L.; Koziorek, J. Zero-error-production through inline-quality control of presshardened automotive parts by multi-camera systems. IOP Conf. Ser. Mater. Sci. Eng. 2021, 1157, 12074. [Google Scholar] [CrossRef]
- Gospodnetic, P.; Mosbach, D.; Rauhut, M.; Hagen, H. Flexible Surface Inspection Planning Pipeline. In Proceedings of the 2020 6th International Conference on Control, Automation and Robotics (ICCAR), Singapore, 20–23 April 2020; IEEE: Piscataway, NJ, USA, 2020; pp. 644–652. [Google Scholar]
- Zhang, X.; Alarcon-Herrera, J.L.; Chen, X. Optimization for 3D Model-based Multi-Camera Deployment. IFAC Proc. Vol. 2014, 47, 10126–10131. [Google Scholar] [CrossRef]
- Zhang, X.; Alarcon-Herrera, J.L.; Chen, X. Coverage enhancement for deployment of multi-camera networks. In Proceedings of the 2015 IEEE International Conference on Advanced Intelligent Mechatronics (AIM), Busan, Korea, 7–11 July 2015; IEEE: Piscataway, NJ, USA, 2015; pp. 909–914. [Google Scholar]
- Alarcon-Herrera, J.L.; Chen, X.; Zhang, X. Viewpoint selection for vision systems in industrial inspection. In Proceedings of the 2014 IEEE International Conference on Robotics and Automation (ICRA), Hong Kong, China, 31 May–7 June 2014; IEEE: Piscataway, NJ, USA, 2014; pp. 4934–4939. [Google Scholar]
- Tarabanis, K.A.; Allen, P.K.; Tsai, R.Y. A survey of sensor planning in computer vision. IEEE Trans. Robot. Automat. 1995, 11, 86–104. [Google Scholar] [CrossRef]
- Gierecker, J.; Schüppstuhl, T. Assembly specific viewpoint generation as part of a simulation based sensor planning pipeline. Procedia CIRP 2021, 104, 981–986. [Google Scholar] [CrossRef]
- Mavrinac, A.; Chen, X. Modeling Coverage in Camera Networks: A Survey. Int. J. Comput. Vis. 2013, 101, 205–226. [Google Scholar] [CrossRef]
- Mavrinac, A.; Chen, X.; Tan, Y. Coverage quality and smoothness criteria for online view selection in a multi-camera network. ACM Trans. Sen. Netw. 2014, 10, 1–19. [Google Scholar] [CrossRef]
- Ma, Y.; Soatto, S.; Košecká, J.; Sastry, S.S. An Invitation to 3-D Vision: From Images to Geometric Models; Springer: New York, NY, USA; Berlin/Heidelberg, Germany, 2004. [Google Scholar]
- Zhang, Z. A flexible new technique for camera calibration. IEEE Trans. Pattern Anal. Mach. Intell. 2000, 22, 1330–1334. [Google Scholar] [CrossRef]
- Gjakova, L.; Wiener, T. Methode zur Generierung virtueller Ansichten für die Bauteilla-geerkennung und zur Simulation der Oberflächenabdeckung von Multi-Kamerasystemen. Master’s Thesis, Chemnitz University of Technology, Chemnitz, Germany, 2018. [Google Scholar]
- Zhang, X.; Chen, X.; Alarcon-Herrera, J.L.; Fang, Y. 3-D Model-Based Multi-Camera Deployment: A Recursive Convex Optimization Approach. IEEE/ASME Trans. Mechatron. 2015, 20, 3157–3169. [Google Scholar] [CrossRef]
- Research Project “H2-Giga” Sub-Project “FRHY—Reference Factory for High-Rate Electrolyzer Production”, FraunhoferGesellschaft zur Förderung der Angewandten Forschung e. V. Available online: https://www.ipt.fraunhofer.de/en/projects/frhy.html (accessed on 28 July 2022).
Publisher’s Note: MDPI stays neutral with regard to jurisdictional claims in published maps and institutional affiliations. |
© 2022 by the authors. Licensee MDPI, Basel, Switzerland. This article is an open access article distributed under the terms and conditions of the Creative Commons Attribution (CC BY) license (https://creativecommons.org/licenses/by/4.0/).