Proceeding Paper

Applications of the Internet of Things (IoT) in Real-Time Monitoring of Contaminants in the Air, Water, and Soil †

by
Abhiram S. P. Pamula
1,*,
Achyuth Ravilla
2 and
Saisantosh Vamshi Harsha Madiraju
3
1
School of Civil and Environmental Engineering, Oklahoma State University, Stillwater, OK 74075, USA
2
Department of Civil and Environmental Engineering, South Dakota School of Mines and Technology, Rapid City, SD 57701, USA
3
Department of Civil and Environmental Engineering, University of Toledo, Toledo, OH 43606, USA
*
Author to whom correspondence should be addressed.
Presented at the 9th International Electronic Conference on Sensors and Applications, 1–15 November 2022; Available online: https://ecsa-9.sciforum.net/.
Eng. Proc. 2022, 27(1), 26; https://doi.org/10.3390/ecsa-9-13335
Published: 1 November 2022

Abstract

:
Sensor networks using the Internet of Things (IoT) are gaining momentum for real-time monitoring of the environment. Increased use of natural resources due to a rise in agriculture production, manufacturing, and civil infrastructure poses a challenge to sustainable growth and development of the global economy. For sustainable use of natural resources (including air, soil, and water), data-driven modeling is needed to understand and simulate contaminant transport and proliferation. Different logging devices are specifically designed to integrate with environmental sensors that send real-time data to the cloud using IoT systems for monitoring. The IoT systems use an LTE network or Wi-Fi to transmit air, water, and soil quality data to the cloud networks. This seamless integration between the logging devices and IoT sensors creates an autonomous monitoring system that can observe environmental parameters in real-time. Various federal organizations and industries have implemented the IoT-based sensor network to monitor real-time air quality parameters (particulate matter, gaseous pollutants), water quality parameters (turbidity, pH, temperature, and specific conductance), and soil parameters (moisture content, soil nutrients). Although several organizations have used IoT systems to monitor environmental parameters, a proper framework to make the monitoring systems reliable and cost-efficient was not explored. The main objective of this study is to present a framework that combines a sensing layer, a network layer, and a visualization layer, allowing modelers and other stakeholders to observe a progressive trend in environmental data while being cost-efficient. This efficient real-time monitoring framework with IoT systems helps in developing robust statistical and mathematical models. The sustainable development of smart cities while maintaining public health requires reliable environmental monitoring data that can be possible by the proposed IoT framework.

1. Introduction

Globalization with the increase in product demand resulted in excessive manufacturing and service provisions due to the rise in global consumption. This unwarranted product manufacturing without environmental concern while lacking user necessity can cause an increased risk of natural resource pollution due to complex manufacturing processes and lack of regulations. Stationary and mobile pollution sources in the areas of agriculture, industries, and other land management activities produce contaminants that can cause adverse health effects to humans [1,2,3]. Maintaining the quality of air, water, and soil is crucial for sustainable development since it is crucial for human health [4,5]. To protect human health, regulatory agencies such as the Environmental Protection Agency (EPA) and the United States Department of Agriculture (USDA) have established guidelines to prevent ecological and environmental stress on natural land, ambient air, and water resources in the United States (US). In compliance with the regulations, individuals and other stakeholders that use natural resources as ecosystem service provisions should monitor the environmental quality parameters regularly. Since environmental monitoring is critical in understanding the contaminant behavior in natural ecosystems, different monitoring methods are needed to be explored from a scientific perspective. In addition, the environmental monitoring systems are expensive with little involvement by common individuals to set up a monitoring station [6]. Therefore, there is a growing demand for environmental pollution monitoring systems with IoT. Conventional monitoring systems are relatively complex, time-taking, and expensive when compared to IoT-based systems which can equip stakeholders and facilities to detect the sources of contaminants quickly [7,8]. The current study provides information on the application of IoT-based systems for low-cost environmental monitoring. In addition to that, a reliable IoT framework that has applications in developing mathematical and statistical models to understand the pollution source and their behavior is proposed.

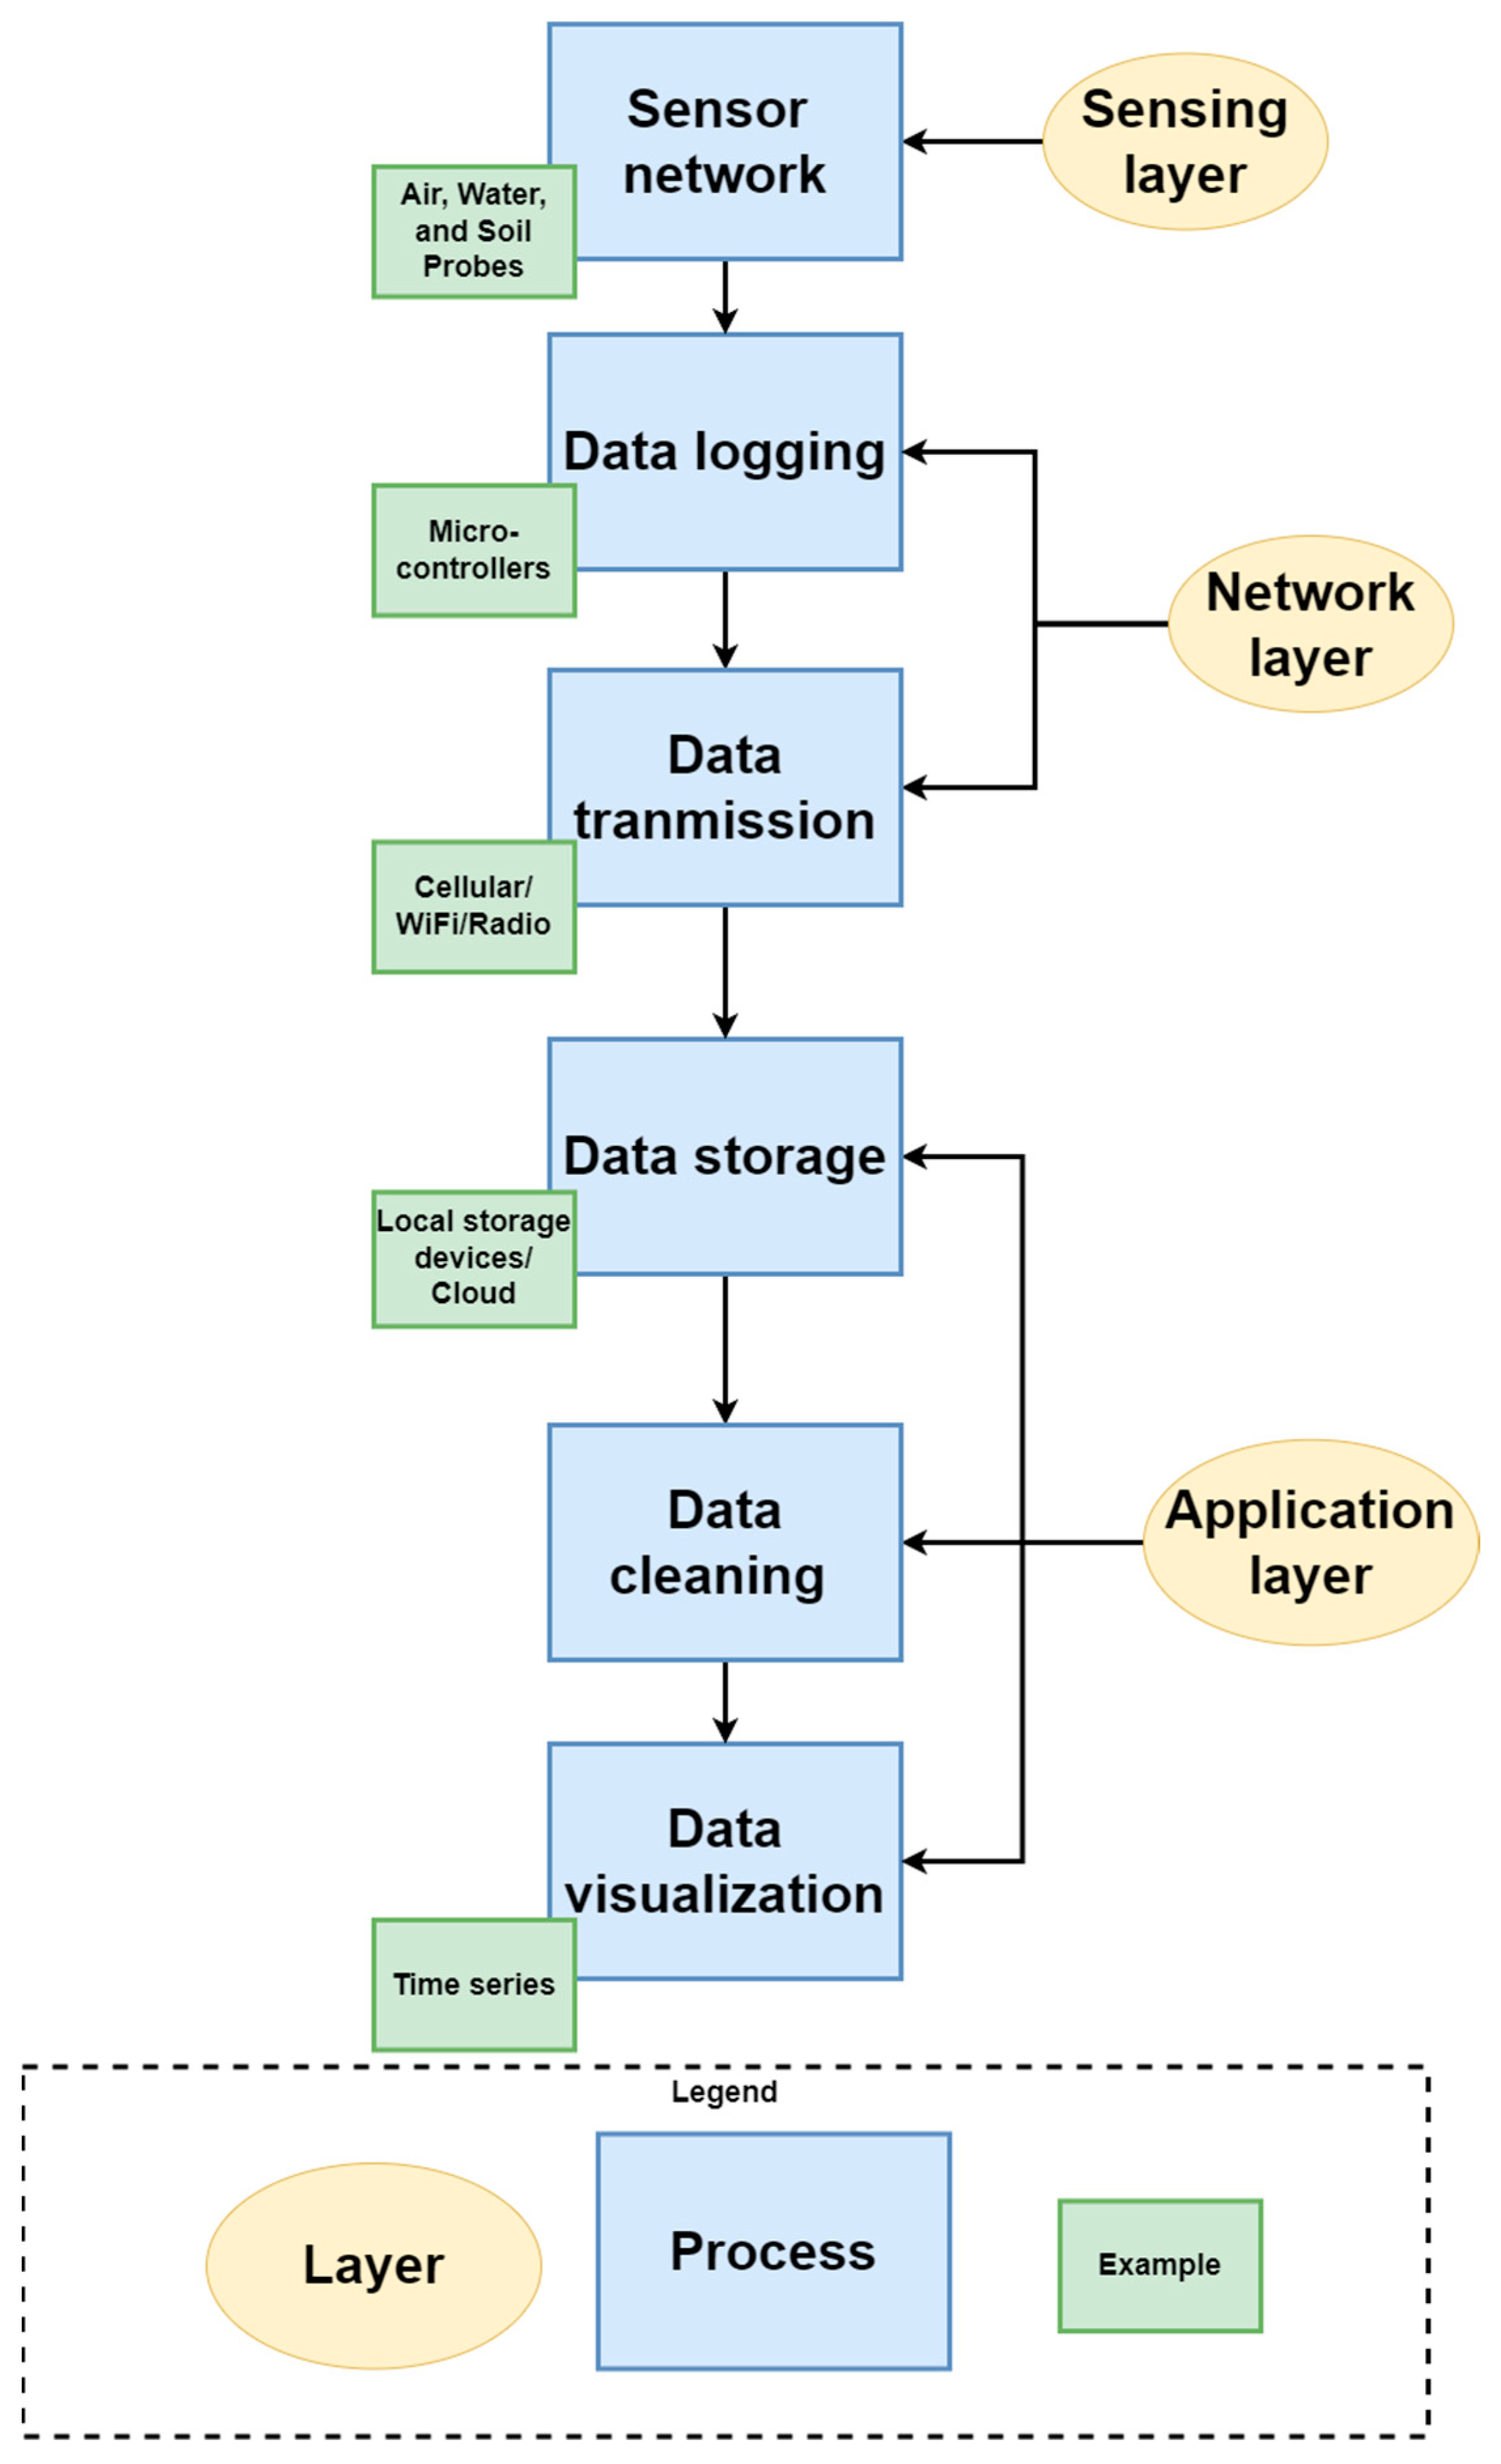
2. System Design and Implementation
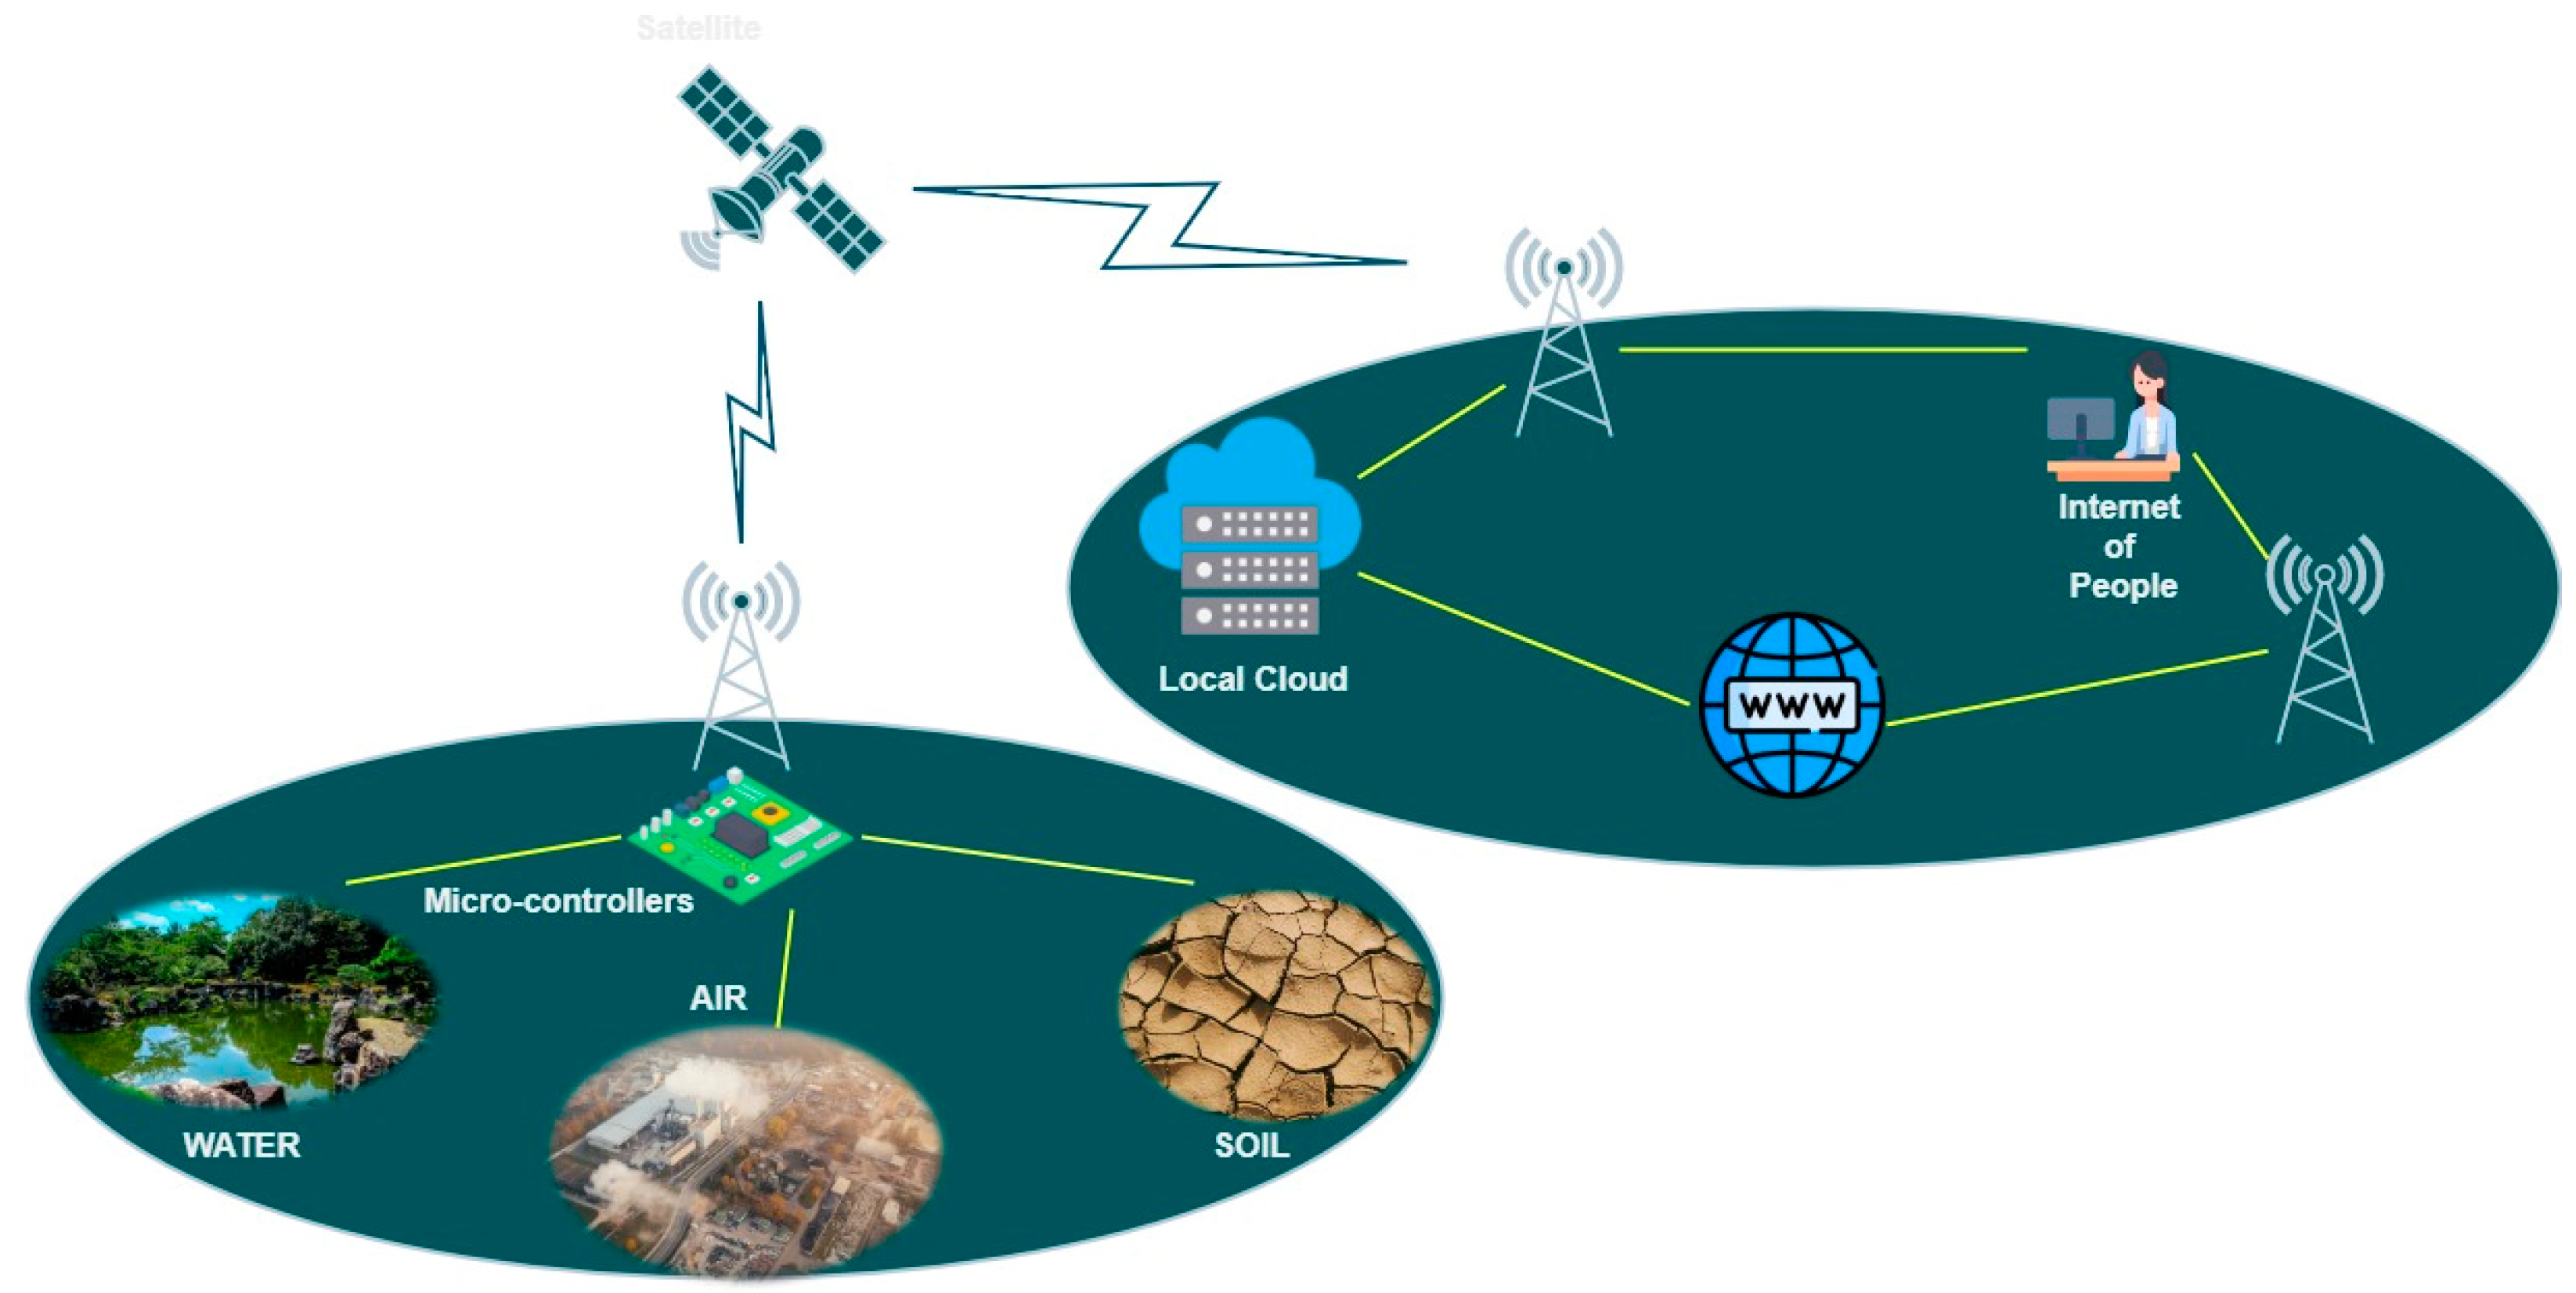
2.1. Framework

The traditional architecture for an IoT-based monitoring system involves three layers that include a sensing layer, network layer, and application layer as shown in Figure 1. The sensing layer consists of environmental sensors that measure the concentrations of the desired pollutants and other quality parameters. Currently, custom-designed sensors are being developed which are efficient and cost-effective compared to commercial probes [9,10,11,12]. The open-source Arduino platform is integrated with microcontrollers’ log data utilizing IoT architecture to account for real-time natural resource monitoring. All Arduino-programmed microcontrollers have the ability to execute extensive code in seconds, making it an efficient resource for collecting data in seconds [13]. Arduino can support several custom-designed sensors that are supported by humongous communities to develop libraries that help in the integration of sensors into IoT architecture.
Recent advancements show that these microcontrollers are integrated with telemetry to send the collected data to a known cloud server for data transmission. The telemetry used for data transmission includes radio communication, Global System for Mobile communication (GSM), and WiFi. Moreover, the rise in IoT networks created momentum in subscriber identity module manufacturing companies such as Hologram, TRUPHONE, SORACOM, and Things Mobile [14]. This increase in telemetry capability with rising cellular internet connectivity makes the IoT architecture ideal for real-time monitoring of air, water, and soil.
As shown in Figure 1, the data transmitted to the cloud can be saved online, or data loggers have the capability to use microSD cards to store data. Most microSD cards need voltage in the range between 2.7 and 3.6 volts such that local hardware storage is a possibility [15]. Since most of the environmental sensors collect data as plain text in bytes as a Comma Separated Value file, microSD provides large amounts of storage options. In addition to storage, the cloud server for IoT architecture needs to have data visualization as a time series to look at the data trend collected by sensors. If the trend in environmental data collected does not stay in a statistically significant range, then post-processing needs to be integrated into the IoT network. The post-processing includes machine learning methods such as non-parametric random forests and artificial neural networks (ANN) to denoise data and remove anomalies. Quality assurance/Quality control (QA/QC) of the data collection is very important when it comes to reliable environmental data collected by smart environmental monitoring networks using IoT systems [16].
After post-processing, visualizing collected data in real-time can provide stakeholders and environmental modelers with an overview of the sensor network’s operational status. If the sensors require maintenance or the station goes down, the modeler or the monitoring individual can address the problem. This seamless real-time data visualization can enable quick response times to maintain the sensor station and reduce data gaps during the monitoring process.

2.2. Smart Monitoring Systems Using IoTs

Environmental monitoring systems have advanced significantly thanks to IoT architecture’s smart monitoring options. Some of the most focused regions of smart environmental monitoring systems using IoT architecture include air quality monitoring, water quality monitoring, and soil quality monitoring as shown in Figure 2. In this study, all the major findings of the proposed IoT architecture are reported. Monitoring the environment using smart IoT systems provides an integrated approach to collecting and improving reliable data collection for modeling purposes [17,18]. Based on the previous literature, we found that there are challenges that need to be addressed with smart monitoring systems.
Quality parameter monitoring using IoT systems is implemented using heterogeneous sensors and machine learning. A brief discussion is provided in this section about the critical quality parameters that can be measured using IoT sensors to assess the quality of air, water, and soil. These critical quality parameters can be used to compute the quality index of different media including air, water, and soil. (Note: The Quality Index (QI) is a measure to assess the contamination of the media. QI is also used as a common indicator for comparison across media geospatially and temporally).

2.2.1. Air Quality

Air IoT systems collect real-time data including the critical quality parameters such as Temperature (in °C or °F), Humidity (in %), CO₂ (in ppm), Pressure (in hPa), TVOC (=total concentration of volatile organic compounds such as asbestos, for example, in ppb), eCO₂ (=estimated concentration of CO₂ calculated from TVOC; in ppm), Particulate matter (in µ/m2). The sensors can be altered based on the prioritization of the air quality parameters [19]. The application of IoT systems in air quality helps to identify the air toxins from various air polluting sources including stationary sources (such as industries, agriculture, commercial kitchens, etc.) and mobile sources (such as cars, trucks, ships, etc.) [20]. An example of an air quality monitoring sensor is presented in Figure 3. The information collected from the IoT systems can be used to prevent the significant deterioration of air quality and is helpful to determine revised standards of public health.
There are many indicators to identify the air quality. One of the main and commonly used indicators to identify the concentration of air pollutants at a specific location is Air Quality Index (AQI). AQI ranges from 0 to 100. The least number (0) represents good air quality, and the highest number (500) represents hazardous air quality that represents an emergency (See Table 1). AQI numbers are determined by hourly measurements of five major pollutants based on geographic location such as fine particles (PM2.5), ground-level ozone (O3), sulfur dioxide (SO2), nitrogen dioxide (NO2), carbon monoxide (CO) [21]. The formulation to compute AQI is represented in Equation (1).
AQI = I Hi I lo BP Hi BP Lo ( C p BP Lo ) + I Lo
where,
  • C p = the rounded concentration of the pollutant;
  • BP Hi = the breakpoint that is greater than or equal to C p ;
  • BP Lo = the breakpoint that is less than or equal to C p ;
  • I Hi = the AQI value corresponding to BP Hi ;
  • I Lo = the AQI value corresponding to BP Lo .
(Note: The pollutant with the highest AQI value is used to characterize the overall AQI.)

2.2.2. Freshwater Quality

Maintaining surface water quality in streams and rivers is necessary to maintain watershed and ecosystem health. Water impairment issues due to different land management practices in a watershed can deteriorate the ecosystem and watershed health downstream. Major surface water quality problems associated with freshwater bodies in the US include increasing concentrations of toxic contaminants such as heavy metals and poly-fluoroalkyl substances (PFAS). The clean water act requires the EPA to regulate surface water quality based on multiple criteria that include aquatic life, biological species, human health, and recreational criteria. The primary surface water quality parameters include pH, temperature, dissolved oxygen, specific conductance, turbidity, nitrates, phosphates, and heavy metals. These critical parameters are measured using IoT system sensors. An example of a water quality monitoring sensor is presented in Figure 3. Most of the aforementioned water quality parameters are used in developing a water quality index by researchers to evaluate water quality in surface freshwater bodies. This index summarizes the different water quality data into a single score ranging from 0 to 100 (See Table 2). This index is highly useful when comparing surface water quality across different rivers and streams. All of these surface water bodies have a large spatial extent. and to understand the behavior of contaminant transport, large amounts of data are needed. When it comes to data, both spatial resolution and temporal resolution are important to understand how the changes in land management activities impair surface water quality within the watershed. The WQI formulation is presented in Equation (2) [23].
WQI = n = 1 n q n W n n = 1 n W n

2.2.3. Soil Quality

Soil management choices affect the amount of soil organic matter, the soil structure, the soil depth, the water- and nutrient-holding capacity, and also the pollutant concentrations in the soil. The soil quality index (SQI) is developed to measure soil quality in terms of soil functioning [24]. The suggested standard ranges of SQI to assess soil quality are mentioned in Table 3 [25]. Some of the critical parameters required to compute SQI are pH, Electric conductivity, Soil temperature, Bulk density, a fraction of water stable aggregates, geometric mean diameter, mean weight diameter, penetration resistance, soil organic carbon, concentration, Nitrogen concentration, C-Stock, N-Stock, available water content, and soil water content. These parameters can be measured with the use of IoT sensors [26]. An example of a soil quality monitoring sensor is presented in Figure 3. Ambient atmospheric parameters such as Solar radiation, Weather (Precipitation, Temperature, Humidity, Air pressure, Wind speed, and Wind direction) which affect the critical parameters can also be measured with the IoT sensors [27]. The formulation to compute SQI is presented in Equation (3).
SQI = Individual   soil   parameter   index   values

3. Challenges to Applying IoT Architecture for Environmental Monitoring

3.1. Identification and Scalability

The number of devices that can connect to an IoT system can be large, and the address space should be able to accommodate all the connected devices. Moreover, the issue of scalability arises when large devices are connected such that data generated by the combined sensor network is humongous. In IoT systems, there are two types of scalability issues including horizontal scalability and vertical scalability. Horizontal scalability refers to the addition or removal of IoT nodes to the IoT network. Vertical scalability refers to the addition or removal of computational capabilities to a single IoT node or a group of IoT nodes. Most of the horizontal and vertical scalability issues are addressed with the increase in computing capability of the cloud [29]. Although there is substantial improvement in cloud computing, some challenges remain such as data storage, functional scalability, control access, and so on.

3.2. Data Management

As sensor networks generate large amounts of data, errors and duplicates in the data need to be cleaned before use. The unreliability of data that is produced by IoT systems is called dirty data. The categorization of dirty data can be in four forms including False positive, False negative, Invalid, and Redundant [30]. False positive data is also referred to as noise where the IoT system collects excessive data that are not expected. False negative is the interference of signal between the sensors and the complex sensing environment. Both false positives and false negatives can produce data that need to be removed from the actual sensing data for modeling purposes. In addition, the sensing network can collect data that are away from the normal range resulting in invalid data. Moreover, if there is more than one sensor that collects data to ensure signal coverage, this might result in data redundancy. However, there are several frameworks that are being studied to improve data quality. Some of the frameworks that can be used to eliminate data quality issues include stream data cleaning, temporal granule, and spatial granule frameworks.

3.3. Security and Privacy of Sensitive Data

A lack of privacy and security has been an issue of concern when it comes to using conventional IoT systems. Recently, both hardware and software solutions are able to solve problems associated with security and privacy. When it comes to hardware, new 5G technology, enhanced local network protocols, and improved Radio Frequency Identification (RFID) are prominent in tackling data privacy. Software solutions such as reinforced security features, zero-trust security, and key management systems improve the security features of IoT systems [31,32]. However, most of the environmental data collected should be open source, but the data regarding the people involved must be protected to prevent an unwarranted invasion of privacy.

3.4. Energy Efficiency

IoT systems usually involve a large number of sensors that are expected to operate for years. The sensor nodes demand transmission schemes that are usually energy-efficient and address the problem of excess energy use in IoT networks. Previous researchers have investigated several approaches to address the excess energy use problem by IoT networks, and there are three significant developments. The first development includes finding efficient routing protocols for the IoT nodes [33]. Optimizing the communication link between the sensors and the microcontroller can reduce unnecessary data transmission by adopting sleep and wake strategies based on the network. In addition to network protocols, using renewable energy devices in the IoT network can reduce the energy requirement for data storage and transmission [34]. An increase in the use of renewable energy devices has been a formidable development when it comes to reducing unnecessary energy use by sensor networks. A recent major development includes using wireless charging mechanisms to overcome power management issues, especially for a large sensor network [35,36]. However, using wireless charging networks with zero-energy sensor nodes can cause reliability issues with data transmission.

3.5. Adaptive Sensing

Adaptive sensing minimizes the number of active nodes to measure the environmental parameters. Using stochastic processes, the level of redundancy in the sensor measurements can be minimized. In addition to data, the adaptive sensing framework results in significant energy savings while maintaining the data quality (Table 4). As adaptive sensing uses prediction to determine the sampling rate, there is a tradeoff between the amount of energy consumed and the quality of data recorded. The adaptive sensing algorithms should be tailored in such a way that dynamic environmental data are captured while saving energy use significantly. This study does not include adaptive sensing in the framework which needs to be investigated further.

3.6. Discussion

Water quality monitoring has been expanded in the US using free online data portals to discover and explore stream monitoring networks. The server currently holds more than five hundred datasets from several researchers, citizens, and resource personnel. The main objective of the growing community of users who share public stream quality data is made possible using smart IoT networks with low-cost sensors. This do-it-yourself philosophy of educators in the field of environmental monitoring has paved the way for smart IoT networks to be used by common individuals. In addition to the user-friendly IoT systems, the data loggers developed use Arduino-based, open-source software for simple integration between sensor networks and IoT applications. The result of these open-source IoT monitoring networks is the ability to provide environmental data for time series analysis and long-term data visualizations.

4. Test Case of IoT Monitoring Network for Water Quality

In this study, a stream monitoring station on the border of Idaho and Utah is considered to visualize the time series of water quality parameters. The water quality parameters collected by the stream monitoring networks provide important information on stage, specific conductance, and water temperature.

4.1. Geo-Spatial Watershed Monitoring

With the increase in applications of smart environmental monitoring using IoT systems, scientific educators such as Stroud Water Research Center have taken an initiative to create an open-source cloud platform to share water quality data. This open-source data initiative resulted in a huge number of individuals placing monitoring stations and sharing their monitoring data online using IoT systems as shown in Figure 4. This open-source data sharing for environmental monitoring results in data that can be shared and used based on user preference.
The water quality data collected by stream monitoring sensors can help develop watershed models. These watershed models are very important when it comes to understanding the fate and transport of contaminants in the stream networks. Some of the most notable watershed models in the field of water quality modeling include the Soil and water assessment tool and the Hydrologic simulation program in Fortran. These simulation models simulate the water quantity and quality of surface and groundwater within the watershed. Most of these models require discharge data of stream network which can be obtained from stage data collected by IoT systems. This case study shows the importance of stream monitoring to understand both water quantity and water quality for modeling contaminant and sediment transport in surface water. Furthermore, frequently monitoring a stream network close to a surface water body, as shown in Figure 5, helps in understanding the dynamics of surface water quality issues that negatively impact ecosystem service provisions and human health.

4.2. Water Quality Time Series

Visualization of the time series can provide continuous measurements of observed environmental data that can be used to see the simulated model performance. The framework provided in this study uses open-source Python tools to clean and visualize a continuous time series of water quality parameters as shown in Figure 6. Some of the outliers in the data have been visualized and removed such that the result is smooth, continuous observed data that can be used for model performance evaluation and comparison.

5. Conclusions

A framework of IoT systems in environmental monitoring applications using low-cost sensors is presented in the current study. In addition to the traditional framework, a few critical suggestions were recommended to overcome the challenges involved in the IoT systems to improve data reliability while being economically efficient. The critical suggestions involve the need to perform extensive research on the following:
  • Data-driven deep learning for adaptive sensing applications and improving the functional capability of IoT systems with minimum human interference;
  • Big data cleaning is necessary due to a large sensor network collecting diverse information such that cloud computing can play a vital role in providing processing power for data cleaning and visualization;
  • Data denoising is necessary while dealing with big data of IoT networks especially while collecting dynamic environmental systems which are affected by external climatic and weather events.
When it comes to environmental monitoring applications, the current study focused mainly on air, water, and soil monitoring for sustainable growth and development. The framework proposed encourages individuals and all the other stakeholders who are interested in environmental monitoring applications to use the IoT systems to better understand the behavior of contaminants’ fate and transport within a system boundary.
A test case for stream monitoring has been discussed in detail which incorporates the use of IoT systems to improve watershed health based on building water quality models using monitored data. These water quality models developed based on data-driven models help us understand contaminant transport within the streams that ultimately end in surface water bodies. A similar approach can be applied to air and soil modeling applications which assist in building models that help recommend best management practices to meet sustainable development goals while coordinating with different land management activities.
The future scope of this work is to focus on studying the data collected by these IoT systems to improve the modeling aspects of the environment to simulate the behavior of contaminants. These modeling aspects have a significant role concerning the increasing intensity of weather events by climate change and global warming.

Author Contributions

Conceptualization, A.S.P.P.; methodology, A.S.P.P., A.R. and S.V.H.M.; software, A.S.P.P., A.R. and S.V.H.M.; validation, A.S.P.P., A.R. and S.V.H.M.; formal analysis, A.S.P.P.; investigation, A.S.P.P., A.R. and S.V.H.M.; resources, A.S.P.P., A.R. and S.V.H.M.; data curation, A.S.P.P.; writing—original draft preparation, A.S.P.P., A.R. and S.V.H.M.; writing—review and editing, A.S.P.P., A.R. and S.V.H.M.; visualization, A.S.P.P. All authors have read and agreed to the published version of the manuscript.

Funding

This research has no external funding.

Institutional Review Board Statement

Not applicable.

Informed Consent Statement

Not applicable.

Data Availability Statement

The data presented in this study are available at https://monitormywatershed.org/browse/.

Acknowledgments

The authors acknowledge EnviroDIY for educating the best management practices of installing stream monitoring stations. The authors thank flaticon.com for providing open-source icons for visualization. We are very thankful to the open-source communities using smart IoT systems for providing data for user flexible applications of environmental monitoring and modeling.

Conflicts of Interest

The authors declare no conflict of interest.

References

  1. Kirkhorn, S.R.; Schenker, M.B. Current Health Effects of Agricultural Work: Respiratory Disease, Cancer, Reproductive Effects, Musculoskeletal Injuries, and Pesticide–Related Illnesses. J. Agric. Saf. Health 2002, 8, 16. [Google Scholar] [CrossRef]
  2. Nordberg, G.F. Human Health Effects of Metals in Drinking Water: Relationship to Cultural Acidification. Environ. Toxicol. Chem. 1990, 9, 887–894. [Google Scholar] [CrossRef]
  3. Calderon, R.L.; Johnson, C.C.; Craun, G.F.; Dufour, A.P.; Karlin, R.J.; Sinks, T.; Valentine, J.L. Health Risks from Contaminated Water: Do Class and Race Matter? Toxicol. Ind. Health 1993, 9, 879–900. [Google Scholar] [CrossRef]
  4. Fulekar, M.; Pathak, B.; Kale, R.K. Environment and Sustainable Development; Springer: Berlin/Heidelberg, Germany, 2014; ISBN 81-322-1166-9. [Google Scholar]
  5. Carley, M.; Christie, I. Managing Sustainable Development; Routledge: London, UK, 2017; ISBN 1-315-09152-6. [Google Scholar]
  6. Lovett, G.M.; Burns, D.A.; Driscoll, C.T.; Jenkins, J.C.; Mitchell, M.J.; Rustad, L.; Shanley, J.B.; Likens, G.E.; Haeuber, R. Who Needs Environmental Monitoring? Front. Ecol. Environ. 2007, 5, 253–260. [Google Scholar] [CrossRef]
  7. Behera, T.M.; Mohapatra, S.K.; Samal, U.C.; Khan, M.S.; Daneshmand, M.; Gandomi, A.H. I-SEP: An Improved Routing Protocol for Heterogeneous WSN for IoT-Based Environmental Monitoring. IEEE Internet Things J. 2019, 7, 710–717. [Google Scholar] [CrossRef]
  8. Rajalakshmi, P.; Mahalakshmi, S.D. IOT Based Crop-Field Monitoring and Irrigation Automation. In Proceedings of the 10th International Conference on Intelligent Systems and Control (ISCO), Coimbatore, India, 7–8 January 2016; pp. 1–6. [Google Scholar]
  9. Parra, L.; Sendra, S.; García, L.; Lloret, J. Design and Deployment of Low-Cost Sensors for Monitoring the Water Quality and Fish Behavior in Aquaculture Tanks during the Feeding Process. Sensors 2018, 18, 750. [Google Scholar] [CrossRef] [Green Version]
  10. Karagulian, F.; Barbiere, M.; Kotsev, A.; Spinelle, L.; Gerboles, M.; Lagler, F.; Redon, N.; Crunaire, S.; Borowiak, A. Review of the Performance of Low-Cost Sensors for Air Quality Monitoring. Atmosphere 2019, 10, 506. [Google Scholar] [CrossRef] [Green Version]
  11. Liu, X.; Jayaratne, R.; Thai, P.; Kuhn, T.; Zing, I.; Christensen, B.; Lamont, R.; Dunbabin, M.; Zhu, S.; Gao, J.; et al. Low-Cost Sensors as an Alternative for Long-Term Air Quality Monitoring. Environ. Res. 2020, 185, 109438. [Google Scholar] [CrossRef]
  12. Marios, S.; Georgiou, J. Precision Agriculture: Challenges in Sensors and Electronics for Real-Time Soil and Plant Monitoring. In Proceedings of the 2017 IEEE Biomedical Circuits and Systems Conference (BioCAS), Turin, Italy, 19–21 October 2017; pp. 1–4. [Google Scholar]
  13. Schubert, T.W.; D’Ausilio, A.; Canto, R. Using Arduino Microcontroller Boards to Measure Response Latencies. Behav. Res. 2013, 45, 1332–1346. [Google Scholar] [CrossRef] [Green Version]
  14. Yang, Z.; Yue, Y.; Yang, Y.; Peng, Y.; Wang, X.; Liu, W. Study and Application on the Architecture and Key Technologies for IOT. In Proceedings of the 2011 International Conference on Multimedia Technology, Hangzhou, China, 26–28 July 2011; pp. 747–751. [Google Scholar]
  15. Pi, R. Raspberry Pi 3 Model. Available online: https://www.raspberrypi.com/products/raspberry-pi-3-model-b/ (accessed on 2 October 2022).
  16. Hyun Park, S.; Seon Shin, W.; Hyun Park, Y.; Lee, Y. Building a New Culture for Quality Management in the Era of the Fourth Industrial Revolution. Total Qual. Manag. Bus. Excell. 2017, 28, 934–945. [Google Scholar] [CrossRef]
  17. Nie, X.; Fan, T.; Wang, B.; Li, Z.; Shankar, A.; Manickam, A. Big Data Analytics and IoT in Operation Safety Management in Under Water Management. Comput. Commun. 2020, 154, 188–196. [Google Scholar] [CrossRef]
  18. Materne, N.; Inoue, M. IoT Monitoring System for Early Detection of Agricultural Pests and Diseases. In Proceedings of the 2018 12th South East Asian Technical University Consortium (SEATUC), Yogyakarta, Indonesia, 12–13 March 2018; pp. 1–5. [Google Scholar]
  19. Taştan, M. An IoT Based Air Quality Measurement and Warning System for Ambient Assisted Living. Avrupa Bilim Ve Teknol. Derg. 2019, 960–968. [Google Scholar] [CrossRef]
  20. Zhang, H.; Srinivasan, R. A Systematic Review of Air Quality Sensors, Guidelines, and Measurement Studies for Indoor Air Quality Management. Sustainability 2020, 12, 9045. [Google Scholar] [CrossRef]
  21. US EPA, O. Air Data Basic Information. Available online: https://www.epa.gov/outdoor-air-quality-data/air-data-basic-information (accessed on 13 September 2022).
  22. US EPA. Technical Assistance Document for the Reporting of Daily Air Quality | AirNow.Gov. Available online: https://www.airnow.gov/sites/default/files/2020-05/aqi-technical-assistance-document-sept2018.pdf (accessed on 2 September 2022).
  23. US EPA. R. 10 Freshwater Quality. Available online: https://www.epa.gov/salish-sea/freshwater-quality (accessed on 13 September 2022).
  24. Soil Health | NRCS Arkansas. Available online: https://www.nrcs.usda.gov/wps/portal/nrcs/ar/soils/health/ (accessed on 13 September 2022).
  25. Amacher, M.C.; O’Neil, K.P.; Perry, C.H. Soil Vital Signs: A New Soil Quality Index (SQI) for Assessing Forest Soil Health; U.S. Department of Agriculture, Forest Service: Fort Collins, CO, USA, 2007; 12p.
  26. Chellappa, J.; Sagar, K.L.; Sekaran, U.; Kumar, S.; Sharma, P. Soil Organic Carbon, Aggregate Stability and Biochemical Activity under Tilled and No-Tilled Agroecosystems. J. Agric. Food Res. 2021, 4, 100139. [Google Scholar] [CrossRef]
  27. de Melo, G.C.G.; Torres, I.C.; de Araújo, Í.B.Q.; Brito, D.B.; Barboza, E.d.A. A Low-Cost IoT System for Real-Time Monitoring of Climatic Variables and Photovoltaic Generation for Smart Grid Application. Sensors 2021, 21, 3293. [Google Scholar] [CrossRef]
  28. Mulyono, A.; Suriadikusumah, A.; Harriyanto, R.; Djuwansah, M.R. Soil Quality under Agroforestry Trees Pattern in Upper Citarum Watershed, Indonesia. J. Ecol. Eng. 2019, 20, 203–213. [Google Scholar] [CrossRef]
  29. Nandgaonkar, S.V.; Raut, A. A Comprehensive Study on Cloud Computing. Int. J. Comput. Sci. Mob. Comput. 2014, 3, 733–738. [Google Scholar]
  30. DeSimone, J.A.; Harms, P. Dirty Data: The Effects of Screening Respondents Who Provide Low-Quality Data in Survey Research. J. Bus. Psychol. 2018, 33, 559–577. [Google Scholar] [CrossRef]
  31. Jain, P.; Gyanchandani, M.; Khare, N. Big Data Privacy: A Technological Perspective and Review. J. Big Data 2016, 3, 1–25. [Google Scholar] [CrossRef] [Green Version]
  32. Kindervag, J. No More Chewy Centers: The Zero Trust Model of Information Security. Available online: https://www.forrester.com/report/No-More-Chewy-Centers-The-Zero-Trust-Model-Of-Information-Security/RES56682 (accessed on 24 March 2016).
  33. Safara, F.; Souri, A.; Baker, T.; Al Ridhawi, I.; Aloqaily, M. PriNergy: A Priority-Based Energy-Efficient Routing Method for IoT Systems. J. Supercomput. 2020, 76, 8609–8626. [Google Scholar] [CrossRef]
  34. Hossein Motlagh, N.; Mohammadrezaei, M.; Hunt, J.; Zakeri, B. Internet of Things (IoT) and the Energy Sector. Energies 2020, 13, 494. [Google Scholar] [CrossRef]
  35. Chittoor, P.K.; Chokkalingam, B.; Mihet-Popa, L. A Review on UAV Wireless Charging: Fundamentals, Applications, Charging Techniques and Standards. IEEE Access 2021, 9, 69235–69266. [Google Scholar] [CrossRef]
  36. Kobeissi, A.H.; Bellotti, F.; Berta, R.; De Gloria, A. IoT Grid Alignment Assistant System for Dynamic Wireless Charging of Electric Vehicles. In Proceedings of the 2018 Fifth International Conference on Internet of Things: Systems, Management and Security, Valencia, Spain, 15–18 October 2018; pp. 274–279. [Google Scholar]
  37. Chandre, P.R.; Mahalle, P.N.; Shinde, G.R. Deep Learning and Machine Learning Techniques for Intrusion Detection and Prevention in Wireless Sensor Networks: Comparative Study and Performance Analysis. In Design Frameworks for Wireless Networks; Das, S.K., Samanta, S., Dey, N., Kumar, R., Eds.; Lecture Notes in Networks and Systems; Springer: Singapore, 2020; pp. 95–120. ISBN 9789811395741. [Google Scholar]
  38. Dhingra, S.; Madda, R.B.; Gandomi, A.H.; Patan, R.; Daneshmand, M. Internet of Things Mobile–Air Pollution Monitoring System (IoT-Mobair). IEEE Internet Things J. 2019, 6, 5577–5584. [Google Scholar] [CrossRef]
  39. Kamaludin, K.H.; Ismail, W. Water Quality Monitoring with Internet of Things (IoT). In Proceedings of the 2017 IEEE Conference on Systems, Process and Control (ICSPC), Meleka, Malaysia, 15–17 December 2017; pp. 18–23. [Google Scholar]
Figure 1. Schematic diagram of IoT architecture for real-time environmental monitoring applications.
Engproc 27 00026 g001
Figure 2. Sample IoT systems for environmental monitoring applications.
Engproc 27 00026 g002
Figure 3. Schematic diagram of environmental sensors for IoT applications.
Engproc 27 00026 g003
Figure 4. Geo-spatial locations of stream monitoring stations in the United States from EnviroDIY data sharing portal.
Engproc 27 00026 g004
Figure 5. Sample monitoring station used in the current study.
Engproc 27 00026 g005
Figure 6. Time series of water quality parameters collected by the smart IoT network.
Engproc 27 00026 g006
Table 1. Air Quality Index characterization [22].
Ambient Air QualityAQI
Good0–50
Moderate51–100
Unhealthy for sensitive groups101–150
Unhealthy151–200
Very Unhealthy201–300
Hazardous301–500
Table 2. Water Quality Index characterization.
Water QualityWQI
Excellent95–100
Good80–94
Fair60–79
Marginal45–59
Poor0–44
Table 3. Soil Quality Index Characterization [28].
Soil QualitySQI
Very Good0.80–1.00
Good0.60–0.79
Moderate0.40–0.59
Low0.20–0.39
Very Low0.00–0.19
Table 4. Challenges with smart monitoring technologies using IoT architecture.
Soil QualitySQIMethods UsedReference
Soil monitoring for farming0.80–1.00Wireless sensor network with IoT[37]
Air pollution monitoring0.60–0.79Air pollution sensors integrated with IoT[38]
Water pollution monitoring0.40–0.59Stream monitoring sensors integrated with IoT[39]
Publisher’s Note: MDPI stays neutral with regard to jurisdictional claims in published maps and institutional affiliations.

