Abstract
Affect recognition is a signal and pattern recognition problem that plays a major role in affective computing. The affective state of a person reflects their emotional state, which could be measured through the arousal and valence dimensions, as per the circumplex model. We attempt to predict the arousal and valence values by exploiting the Remote Collaborative and Affective Interactions (RECOLA) data set RECOLA is a publicly available data set of spontaneous and natural interactions that represent various human emotional and social behaviours, recorded as audio, video, electrodermal activity (EDA) and electrocardiogram (ECG) biomedical signals. In this work, we focus on the biomedical signal recordings contained in RECOLA. The signals are processed, accompanied with pre-extracted features, and accordingly labelled with their corresponding arousal or valence annotations. EDA and ECG features are fused at feature-level. Ensemble regressors are then trained and tested to predict arousal and valence values. The best performance is achieved by optimizable ensemble regression, with a testing root mean squared error (RMSE) of 0.0154 for arousal and 0.0139 for valence predictions. Our solution has achieved good prediction performance for the arousal and valence measures, using EDA and ECG features. Future work will integrate visual data into the solution.
1. Introduction
Affect recognition (AR) is a signal and pattern recognition problem that plays a major role in affective computing [1]. Affective computing inspires the development of devices that are capable of detecting, processing, and interpreting human affective states. As such, AR is an interdisciplinary research area which includes signal processing, machine learning, psychology, and neuroscience. The affective state of a person reflects their emotional state [1,2]. AR is the process of detecting the affective state of a person by monitoring their activity and vital signs through sensors. Machines can detect/recognize affective states by analyzing physiological data, and/or audio-visual data [3,4].
Wearable sensors are sensors that can be worn on the human body or inserted into clothing. Most state-of-the-art studies rely on wearable sensors for their low cost, rich functionality, and valuable insights [1]. Integrated wearable sensor applications can be used in daily lives as they are portable and non-intrusive. They can be used to measure physiological data such as electroencephalography (EEG), electrooculography (EOG), electrocardiography (ECG), electromyography (EMG), respiratory inductive plethysmography (RIP), blood oxygen, blood pressure, photoplethysmography (PPG), temperature, electrodermal activity (EDA), inertia, position, voice, etc. Wearable-based AR systems can be used in healthcare applications to monitor the state of patients with mental disorders [1]. These data help therapists to track behavioural changes. AR systems facilitate tele-mental and tele-medical applications. They can enhance self-monitoring to provide users with better insights on their affective states and behavioural changes. AR systems are utilized in urban planning or human-machine interfaces as well. AR can also be based on audio-visual data, which depend on multimodal features. These features are extracted from images, audio, or video. The visual features used for AR include information about facial expressions, eye gaze and blinking, pupil diameter, and hand/body gestures and poses [4]. Multimodal fusion is an extra step that is usually performed to combine multiple data modalities [3]. There are three types of multimodal fusion: early, late, and sequential fusion. Early fusion combines the modalities at the feature level, while late fusion combines the modalities at the decision level. Sequential fusion combines different modality predictions sequentially. We apply early, feature-level fusion in this work.
Researchers have developed emotion models to describe humans’ affective states [1,3]. There are two types of emotion models: categorical, and dimensional models. In categorical models, discrete categories are used to express different emotions. In dimensional models, “emotions are mapped into a multidimensional space, where each of the axis represents a continuous variable.” The circumplex model is a dimensional model [1], presented by Russell in [5]. Within the circumplex model, affective states are characterized as discrete points in a two-dimensional space of valence and arousal axes. Valence is used to rate the positivity of the affective state. Arousal is used to rate the activity/energy level of the affective state. There are four quadrants in the circumplex model [6,7,8,9]: low arousal/low valence, low arousal/high valence, high arousal/low valence, and high arousal/high valence. They are attributed with the sad, relaxed, angry, and happy affective states, respectively. The circumplex model is used in this work.
1.1. Data
The application of AR requires a large amount of data, collected from a diverse group of subjects. Researchers have published data sets to enable the validation and comparison of results. The data sets can consist of posed, induced, and/or natural emotions. Data sets can be grouped based on content, data modality, and/or participants [3]. They are composed of posed or spontaneous facial expressions, primary expressions or facial action units (FAU) as labels, still images or video sequences (i.e., static/dynamic data), and controlled laboratory or uncontrolled non-laboratory environments.
The remote collaborative and affective interactions (RECOLA) data set was recorded at the University of Fribourg, Switzerland, to study socio-affective behaviours from multimodal data in the context of computer supported collaborative work [6,10,11]. Spontaneous and naturalistic interactions were collected during the resolution of a collaborative task that was performed in pairs and remotely through a video conference. This comprises of 27 5-min synchronous audio, video, ECG and EDA recordings. Even though all subjects speak French fluently, they have different nationalities (i.e., French, Italian or German), which provides some diversity in the expression of emotion. The data were labelled in the arousal and valence affective dimensions, and manually annotated using a slider-based labelling tool. Each recording was annotated by six native French speakers. A combination of these individual ratings is used as ground truth label. The RECOLA data set is obtained, from [12], to assist in the analysis of continuous emotion dimensions, such as the arousal and valence dimensions. The RECOLA data set includes recordings of 27 subjects, where data from 23 subjects are publicly available. The recordings of only 18 subjects contain all types of data modalities (i.e., audio, video, ECG, and EDA), so we use the records of those 18 subjects in our work.
1.2. State-of-the-Art on RECOLA
The baseline results achieved by the individual models for the gold-standard emotion sub-challenge (GES) in 2018’s audio/visual emotion challenge (AVEC) [13] are reported in terms of Concordance’s correlation coefficient (CCC). For EDA, they achieved a CCC of 0.029 and 0.058 for arousal and valence predictions, respectively. For ECG, they achieved a CCC of 0.065 and 0.043 for arousal and valence predictions, respectively. These results are obtained through an emotion recognition system based on support vector machines (SVMs), used as static regressors. The End2You tool [14] is a toolkit for multimodal profiling that was developed by the Imperial College of London to perform continuous dimensional emotion labels of arousal and valence values. It utilizes raw audio, visual information (i.e., video), and physiological EDA and ECG signals as input. For ECG signals, it achieved a CCC of 0.154 for arousal, and 0.052 for valence. Brady et al. [15] utilized RECOLA’s physiological data and baseline features, as specified in AVEC 2016 [11], to apply regression over arousal and valence values via a long short-term memory (LSTM) network. For ECG, they achieved a root mean squared error (RMSE), Pearson’s correlation coefficient (PCC), and CCC of 0.218, 0.407, and 0.357 at predicting arousal values, respectively. They achieved an RMSE, PCC, and CCC of 0.117, 0.412, and 0.364 at predicting valence values, respectively. For EDA, they achieved an RMSE, PCC, and CCC of 0.250, 0.089, and 0.082 at predicting arousal values, respectively. They achieved an RMSE, PCC, and CCC of 0.124, 0.267, and 0.177 at predicting valence values, respectively.
1.3. Proposed Solution
This work is part of a larger interdisciplinary initiative with the Royal Hospital’s Institute of Mental Health Research in Ottawa, the Department of Psychiatry of the University of Ottawa, and the Department of Psychoeducation and Psychology at the University of Quebec in Outaouais (UQO). It is aimed at the design and development of a novel adaptable intervention to treat cognitive impairments using virtual reality (VR), based on synergistic computer science and psychology approaches. A novel machine learning approach using visual and physiological sensory data is required to adaptively adjust the virtual environment to the user’s cognitive effort. Our ultimate goal is to automatically optimize the level of cognitive effort requested by VR users, while avoiding discouragement. In that case, AR will help determine the user’s emotion and/or cognitive state. This paper presents the first milestone of this larger project. We aim to test an initial multi-sensory system through classical and deep machine learning techniques that we could later use to improve the measurement of mental/cognitive states in VR. Figure 1. displays a high-level diagram of our proposed solution. It is composed of subsystems: one system for each data modality, namely the visual (video) and physiological (EDA and ECG) data modalities.
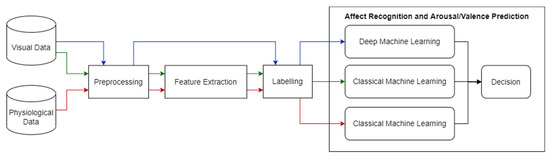
Figure 1.
Overview of Proposed Solution. The red line represents the work done in this paper, while the blue and green lines represent future work.
We chose to focus on one data modality at a time to perfect the results for each modality first, before we combine all modalities in our final system. In this work, we operate on physiological data from RECOLA’s biomedical signal recordings of EDA and ECG. We exploit multiple ensemble regression methods for the purpose of predicting continuous dimensional emotion annotations in terms of arousal and valence values. We use early fusion to combine the EDA and ECG modalities at the feature level. We are going to work with the other data modalities, contained within RECOLA, at later stages of the project. We initially use data from RECOLA as a proof-of-concept mechanism. In the future, we will operate on real data that we will collect in our laboratory.
2. Methods
As further presented in this section, we process the biomedical signal recordings and label them. Then, we perform continuous dimensional emotion predictions of arousal and valence values, through classical machine learning techniques. Specifically, we experiment with ensemble regression. We choose to work with ensemble models because they are known to be fast and effective [16].
2.1. Processing of Biomedical Signals
In our work, RECOLA recordings of 18 subjects are used for training and validation, as well as testing purposes. All records are preprocessed by applying: (1) time delay; (2) early features fusion; (3) arousal and valence annotation labelling; and (4) data shuffling and splitting.
2.1.1. Time Delay and Sequencing
RECOLA’s biomedical recordings (i.e., EDA and ECG) are sampled at a rate of 1000 samples/s. This means that one sample is captured every 1 ms. On the other hand, RECOLA’s audio and video recordings are sampled every 40 ms (25 frames/s). Similarly, the biomedical features are calculated every 40 ms as well. To enable a synchronous use of data, we subsampled the EDA and ECG signals by considering only the readings that occur every 40 ms. However, the corresponding EDA and ECG features in RECOLA, are only calculated after 2 s (2000 ms) of recording. Therefore, we skipped the readings that are collected before that time. As a result, the first 50 samples (2 s × 25 samples/s) of the recordings are discarded.
2.1.2. Early Features Fusion
We utilize the baseline EDA and ECG features of RECOLA, as described in [11]. Skin conductance response (SCR) is EDA’s rapid, transient response, whereas skin conductance level (SCL) is EDA’s slower, basal drift. In [11], both SCR and SCL are extracted from the EDA signal through a third order Butterworth filter, at different cut-off frequencies. In addition to the EDA readings, there are 62 EDA features, which include: slope; fast Fourier transform (FFT) entropy and mean frequency of the SCR; mean, its first order derivative, and the negative part of its derivative for EDA, SCR, and SCL; standard deviation, kurtosis, and skewness of EDA, SCR, and SCL; proportion of EDA, SCR, and SCL; x-bound of EDA, SCR, and SCL; non-stationary index (NSI) and normalized length density (NLD) of EDA, SCR, and SCL; and deltas of all of the above. Besides the ECG readings, there are 54 ECG features, which consist of: heart rate and heart rate variability; zero-crossing rate; first 12 FFTs; entropy, mean frequency, and slope of ECG’s FFT; the first four statistical moments (mean, standard deviation, kurtosis, skewness); NSI and NLD; power at very low, low, high, and low/high frequencies; and deltas of all of the above. For detailed explanations of these features, please refer to [11]. We fused the EDA and ECG features together into one matrix that is 132,751 × 118 (1 EDA reading + 1 ECG reading + 62 EDA features + 54 ECG features) in size.
2.1.3. Annotation Labelling
The data in RECOLA are labelled in the arousal and valence affective dimensions, and manually annotated using ANNEMO, a web slider-based annotation tool, developed by Ringeval et al. [6]. Each recording was annotated by six native French speakers. The average of these six ratings is used to label the data in our work. These arousal and valence annotations are also sampled every 40 ms. Again, as we proceeded in Section 2.1.1, the first 50 annotations are ignored. The remaining annotations are accordingly used to label the corresponding EDA and ECG samples. All labelling and fusion of data samples and features are done based on the recordings time.
2.1.4. Data Shuffling and Splitting
Data shuffling is necessary to ensure the randomization and diversity of the data. The data are shuffled and split, where 80% are used for training and validation, and 20% are used for testing. Table 1 displays the dimensions of the data sets we used.

Table 1.
Summary of Data Sets.
2.2. Ensemble Regression
We exploit classical machine learning methods to perform continuous dimensional emotion predictions of arousal and valence values. We trained and validated three ensemble regressors, namely boosted trees, bagged trees, and an optimizable ensemble. Boosted trees represent an ensemble of regression trees using the LSBoost algorithm [16]. Bagged trees represent a bootstrap-aggregated ensemble of regression trees. An optimizable regression ensemble optimizes training hyperparameters (method, number of learners, learning rate, minimum leaf size, and number of predictors) using Bayesian optimization. We performed 5-fold cross validation during training to protect against overfitting and computed the average validation error over all folds.
3. Results and Discussion
After training the aforementioned models, we tested them by predicting the arousal and valence values on the testing sets to evaluate the performance when presented with new data. Table 2 summarizes the validation and testing results in terms of the RMSE, PCC, and CCC performance measures. The RMSE simply measures the root of the mean of squared difference between the set of arousal/valence predictions and the set of the actual values [11,16]. PCC measures the linear correlation between the set of arousal/valence predictions and the set of the actual values. CCC measure combines PCC with the square difference between the mean of the set of arousal/valence predictions and the set of the actual values. A smaller RMSE value represents better performance, whereas larger PCC and CCC values represent better performance.
Table 2.
Regression Results.
In Table 2, the validation results are computed through 5-fold cross validation over the training data. The testing results are obtained by having the trained model predict arousal and valence values on the testing set. The row corresponding to the highest prediction performance is displayed in bold font in Table 2. According to Table 2, the optimizable ensemble regressor outperforms the other models. For arousal predictions, it achieves an RMSE, PCC, and CCC of 0.0154, 0.9976, and 0.9967, respectively. For valence predictions, it achieves a RMSE, PCC, and CCC of 0.0139, 0.9954, and 0.9946, respectively. These results are better than any results reported on RECOLA in other state-of-the-art studies, as far as we know. Table 3 compares our results with some results from literature.
Table 3.
Results Comparison.
4. Conclusions
In conclusion, we performed continuous dimensional emotion predictions by exploiting the RECOLA data set. More specifically, we focused on the EDA and ECG recordings of RECOLA and their features. The signals were processed, accompanied with pre-extracted features, and accordingly labelled with their corresponding arousal or valence annotations. Multiple regressors were trained, validated, and tested to predict arousal and valence values. We applied feature fusion to combine EDA and ECG features. The best performance was achieved by optimizable ensemble regression, with a testing RMSE, PCC, and CCC of 0.0154, 0.9976, and 0.9967 on arousal predictions, and 0.0139, 0.9954, and 0.9946 on valence predictions. To the best of our knowledge, these results provide the best arousal and valence predictions’ performance as compared to the literature. Going forward, we will carry out our project with the optimizable ensemble as the AR mechanism for physiological data. Now that we have attained good prediction performance for the EDA and ECG data modalities, we can proceed our work with the visual data. Then we can apply our findings on real data, which will be part of a VR system.
Author Contributions
Conceptualization, I.O.J., A.-M.C., S.G. and S.B.; methodology, I.O.J.; software, I.O.J.; validation, I.O.J.; formal analysis, I.O.J.; investigation, I.O.J.; resources, A.-M.C., S.G. and S.B.; data curation, I.O.J.; writing—original draft preparation, I.O.J.; writing—review and editing, I.O.J., A.-M.C., S.G. and S.B.; visualization, I.O.J.; supervision, A.-M.C. and S.B.; project administration, A.-M.C., S.G. and S.B.; funding acquisition, A.-M.C., S.G. and S.B. All authors have read and agreed to the published version of the manuscript.
Funding
This study was funded by the New Frontiers in Research Fund, grant number NFRFE-2018-00973, and the Canada Research Chairs Program, grant number 950-231039.
Institutional Review Board Statement
Not applicable.
Informed Consent Statement
Patient consent was not applicable for this study since the data was provided and available, by another study.
Acknowledgments
A special thank you to the providers of the RECOLA data set, F. Ringeval, A. Sonderegger, J. Sauer, and D. Lalanne.
Conflicts of Interest
Stéphane Bouchard is the President of, and owns equity in, In Virtuo Clinics and Development, a spin-off company from the university that distributes virtual environments designed for the treatment of mental disorders. The terms of these arrangements have been reviewed and approved by the University of Québec in Outaouais in accordance with its conflict of interest policies. Stéphane Bouchard has received honoraria for presenting research and providing workshops. He also receives royalties from books.
References
- Schmidt, P.; Reiss, A.; Dürichen, R.; Laerhoven, K.V. Wearable-Based Affect Recognition—A Review. 2019. Available online: https://www.mdpi.com/1424-8220/19/19/4079 (accessed on 28 May 2020).
- Ayoub, I. Multimodal Affective Computing Using Temporal Convolutional Neural Network and Deep Convolutional Neural Networks. 2019. Available online: https://ruor.uottawa.ca/bitstream/10393/39337/1/Ayoub_Issa_2019_Thesis.pdf (accessed on 28 May 2020).
- Corneanu, C.A.; Simon, M.O.; Cohn, J.F.; Guerrero, S.E. Survey on RGB, 3D, Thermal, and Multimodal Approaches for Facial Expression Recognition: History, Trends, and Affect-Related Applications. IEEE Trans. Pattern Anal. Mach. Intell. 2016, 38, 1548–1568. [Google Scholar] [CrossRef] [PubMed]
- Al Osman, H.; Falk, T.H. Multimodal affect recognition: Current approaches and challenges. In Emotion and Attention Recognition Based on Biological Signals and Images; IntechOpen: London, UK, 2017; pp. 59–86. [Google Scholar]
- Russell, J. Affective Space Is Bipolar; American Psychological Association: Washington, DC, USA, 1979. [Google Scholar]
- Ringeval, F.; Sonderegger, A.; Sauer, J.; Lalanne, D. Introducing the RECOLA multimodal corpus of remote collaborative and affective interactions. In Proceedings of the 2013 10th IEEE International Conference and Workshops on Automatic Face and Gesture Recognition (FG), Shanghai, China, 22–26 April 2013; pp. 1–8. [Google Scholar]
- Sun, B.; Li, L.; Zhou, G.; Wu, X.; He, J.; Yu, L.; Li, D.; Wei, Q. Combining multimodal features within a fusion network for emotion recognition in the wild. In Proceedings of the 2015 ACM on International Conference on Multimodal Interaction, Seattle, WA, USA, 9–13 November 2015; pp. 497–502. [Google Scholar]
- Sun, B.; Li, L.; Zhou, G.; He, J. Facial expression recognition in the wild based on multimodal texture features. J. Electron. Imaging 2016, 25, 61407. [Google Scholar] [CrossRef]
- Dhall, A.; Goecke, R.; Ghosh, S.; Joshi, J.; Hoey, J.; Gedeon, T. From individual to group-level emotion recognition: EmotiW 5.0. In Proceedings of the 19th ACM International Conference on Multimodal Interaction, Glasgow, UK, 13–17 November 2017; pp. 524–528. [Google Scholar]
- Amirian, M.; Kächele, M.; Thiam, P.; Kessler, V.; Schwenker, F. Continuous Multimodal Human Affect Estimation Using Echo State Networks. In Proceedings of the 6th International Workshop on Audio/Visual Emotion Challenge, Amsterdam, The Netherlands, 15–19 October 2016; pp. 67–74. [Google Scholar]
- Valstar, M.; Gratch, J.; Schuller, B.; Ringeval, F.; Lalanne, D.; Torres Torres, M.; Scherer, S.; Stratou, G.; Cowie, R.; Pantic, M. AVEC 2016—Depression, Mood, and Emotion Recognition Workshop and Challenge. In Proceedings of the 6th International Workshop on Audio/Visual Emotion Challenge, Amsterdam, The Netherlands, 15–19 October 2016; pp. 3–10. [Google Scholar]
- Recola Database. Available online: https://diuf.unifr.ch/main/diva/recola/ (accessed on 28 May 2020).
- Ringeval, F.; Schuller, B.; Valstar, M.; Cowie, R.; Kaya, H.; Schmitt, M.; Amiriparian, S.; Cummins, N.; Lalanne, D.; Michaud, A.; et al. AVEC 2018 Workshop and Challenge: Bipolar Disorder and Cross-Cultural Affect Recognition. In Proceedings of the 2018 on Audio/Visual Emotion Challenge and Workshop, Seoul, Republic of Korea, 22 October 2018; ACM: New York, NY, USA, 2018. [Google Scholar]
- Tzirakis, P.; Zafeiriou, S.; Schuller, B.W. End2You—The Imperial Toolkit for Multimodal Profiling by End-to-End Learning. arXiv 2018, arXiv:1802.01115. [Google Scholar]
- Brady, K.; Gwon, Y.; Khorrami, P.; Godoy, E.; Campbell, W.; Dagli, C.; Huang, T.S. Multi-Modal Audio, Video and Physiological Sensor Learning for Continuous Emotion Prediction. In Proceedings of the 6th International Workshop on Audio/Visual Emotion Challenge, Amsterdam, The Netherlands, 15–19 October 2016; pp. 97–104. [Google Scholar]
- Help Center. Help Center for MATLAB, Simulink, and Other MathWorks Products. Available online: https://www.mathworks.com/help/ (accessed on 2 September 2022).

Publisher’s Note: MDPI stays neutral with regard to jurisdictional claims in published maps and institutional affiliations. |
© 2022 by the authors. Licensee MDPI, Basel, Switzerland. This article is an open access article distributed under the terms and conditions of the Creative Commons Attribution (CC BY) license (https://creativecommons.org/licenses/by/4.0/).