Proceeding Paper

Cobalt Detection Using Fluorescent Dye Layers †

by
Fernando Arturo Armenta-Serna
1,
Yadira Aracely Fuentes-Rubio
1,
René Fernando Domínguez-Cruz
1,*,
Luis Antonio García-Garza
1,
Oscar Baldovino-Pantaleón
1 and
Carlos Ruiz-Zamarreño
2
1
Centro de Innovación Tecnológica en Eléctrica y Electrónica, Universidad Autónoma de Tamaulipas, Carr. a San Fernando Cruce con Canal Rodhe S/N. Col. Arcoiris, Reynosa 88779, Mexico
2
Electrical and Electronic Engineering Department, UPNA, Campus Arrosadia, 31006 Pamplona, Spain
*
Author to whom correspondence should be addressed.
Presented at the 9th International Electronic Conference on Sensors and Applications, 1–15 November 2022; Available online: https://ecsa-9.sciforum.net/.
Eng. Proc. 2022, 27(1), 67; https://doi.org/10.3390/ecsa-9-13217
Published: 1 November 2022

Abstract

:
In this paper, we report the preliminary results regarding the use of fluorescent dye calcein (C30H26N2O13) as a sensor for the detection of cobalt levels in aqueous solutions. The sensor cell based on calcein is built by fixed-in layers by means of thermoplastic polyurethane (TPU) and adjusted to pH = 7. The layer shows a fluorescence emission in the range of λ = 545 nm to 570 nm when it is excited by optical fields at a wavelength centered at 465 nm. By the contact of different cobalt concentrations with the calcein layer structure, quenching of the fluorescence intensity is observed. The results indicate that the sensor exhibits a linear response of the fluorescence quenching related to the cobalt concentration level in the range of 10−5 to 10−3 mol/L. Additionally, the proposed sensor has a simple experimental set-up, low cost, and does not require additional complex instrumentation.

1. Introduction

In the natural environment, animal life is surrounded by biological and chemical resources. Due to the exploitation of resources, the environment has been affected by the pollution generated by their extraction, which is a problem that has been increasing significantly in recent years. The release of non-biodegradable substances in natural spaces, the emission and spillage of industrial waste, and the extraction and processing of fossil fuels are examples of environmental pollution. Many of these mechanisms directly affect water bodies which are consumed by fauna, flora, and humans [1,2,3].
One of the most common contaminants found in aquifers are heavy metals [4]. These are found naturally in the earth and in the soil, but human activities have caused their exposure to be even greater due to their exploitation. Heavy metals such as cobalt (Co), copper (Cu), chromium (Cr), iron (Fe), magnesium (Mg), manganese (Mn), nickel (Ni), selenium (Se), and zinc are known to (Zn) are essential nutrients for the normal functioning of living beings. However, high exposure to these heavy metals can cause metabolic problems in humans and in the planet’s fauna, as well as the poisoning of living beings [5,6,7].
Cobalt (Co) is a heavy metal found naturally on the earth’s surface. Its exposure at controlled levels helps in the metabolism of living beings. Additionally, cobalt is used as part of the treatment of some diseases [8]. However, the excess release of this element has reached maritime bodies, such as rivers, lakes and oceans, and its high exposure causes the development of cardiac anomalies and carcinomas in living beings due to its constant exposure to this material [9]. In this way, it is a priority to have monitoring tools that allow the detection of the presence of cobalt levels, which implies an area of opportunity in the scientific and technological field by providing solutions to public health problems. In this paper, we present the preliminary results regarding the sensing of cobalt concentration using calcein layers fixed using thermoplastic polyurethane. The principle of operation is based on the stimulation of the calcein cell for the emission of fluorescence. Then, the cell is surrounded by an aqueous medium with different levels of cobalt concentration, which quenches the stimulated fluorescence. The quench level is a function of cobalt concentration.

2. Materials

2.1. Fluorescense Quenching

The intensity of induced fluorescence in a material can be reduced by interaction with media that absorb it. The decrease in intensity is called extinction or quenching. This process occurs when the excited state fluorophore is deactivated when it is contact with molecules in solution, called quenching. For the quenching mechanism, the intensity decrease is described by the Stern–Volmer equation [10]:
F 0 F = 1 + K [ Q ] = 1 + k q τ 0 [ Q ]
where F0 is the emission intensity in the absence of the quencher, F is the emission intensity in the presence of the quencher, K is the Stern–Volmer extinction constant, kq is the bimolecular extinction constant, τ0 is the non-quenched lifetime and Q is the concentration of the quencher. The Stern–Volmer extinction constant K is a measure of the sensitivity of the fluorophore to a quencher [10].

2.2. Calcein: Fluorescence Emission and Preparation

Calcein is a dye which exhibits a fluorescence emission from 520 nm to 560 nm when it is pumped using a wavelength around to 460 nm. Calcein has been commonly used for cell tracing and in studies of endocytosis, cell migration, and gap junctions [11]. We prepared 0.004015 g/L dissolved in distilled water, which was provided by Sigma-Aldrich® (St. Louis, MI, USA). Additionally, the pH of the mixture was adjusted to level 7.

2.3. Cobalt Solutions Preparation

According to the Agency for Toxic Substances and Disease Registry (ATSDR), a federal public health agency of the U.S., the maximum permissible concentration of cobalt for the human being is around 16 µmol/L [12]. Using this value as reference, we prepare cobalt concentrations in a range from 10−5 to 10−3 in mol/L using distilled water (99% purity) and a cobalt nitrate hexahydratade, both provided by Sigma-Aldrich®.

2.4. Experimental Set-Up

The first phase of our experiments was the spectroscopy response of calcein when it is in contact with cobalt solutions. The experiments were carried out using a LED Pyrois® as optical pumping source (wavelength peak @ 460 nm), which is pigtailed by multimode SMA cables (see Figure 1a). The pumping field is launched until it reaches the quartz cuvette, where it stimulates the calcein solution. The induced fluorescence signal travels along the second SMA cable and is collected by the Ocean Optics USB4000 spectrometer and stored using a personal computer. In Figure 1b, we show the spectrum of the LED pumping source centered at 465 nm (black line) and the fluorescence signal (red line) in the presence of calcein in the cuvette.

3. Results and Discussion

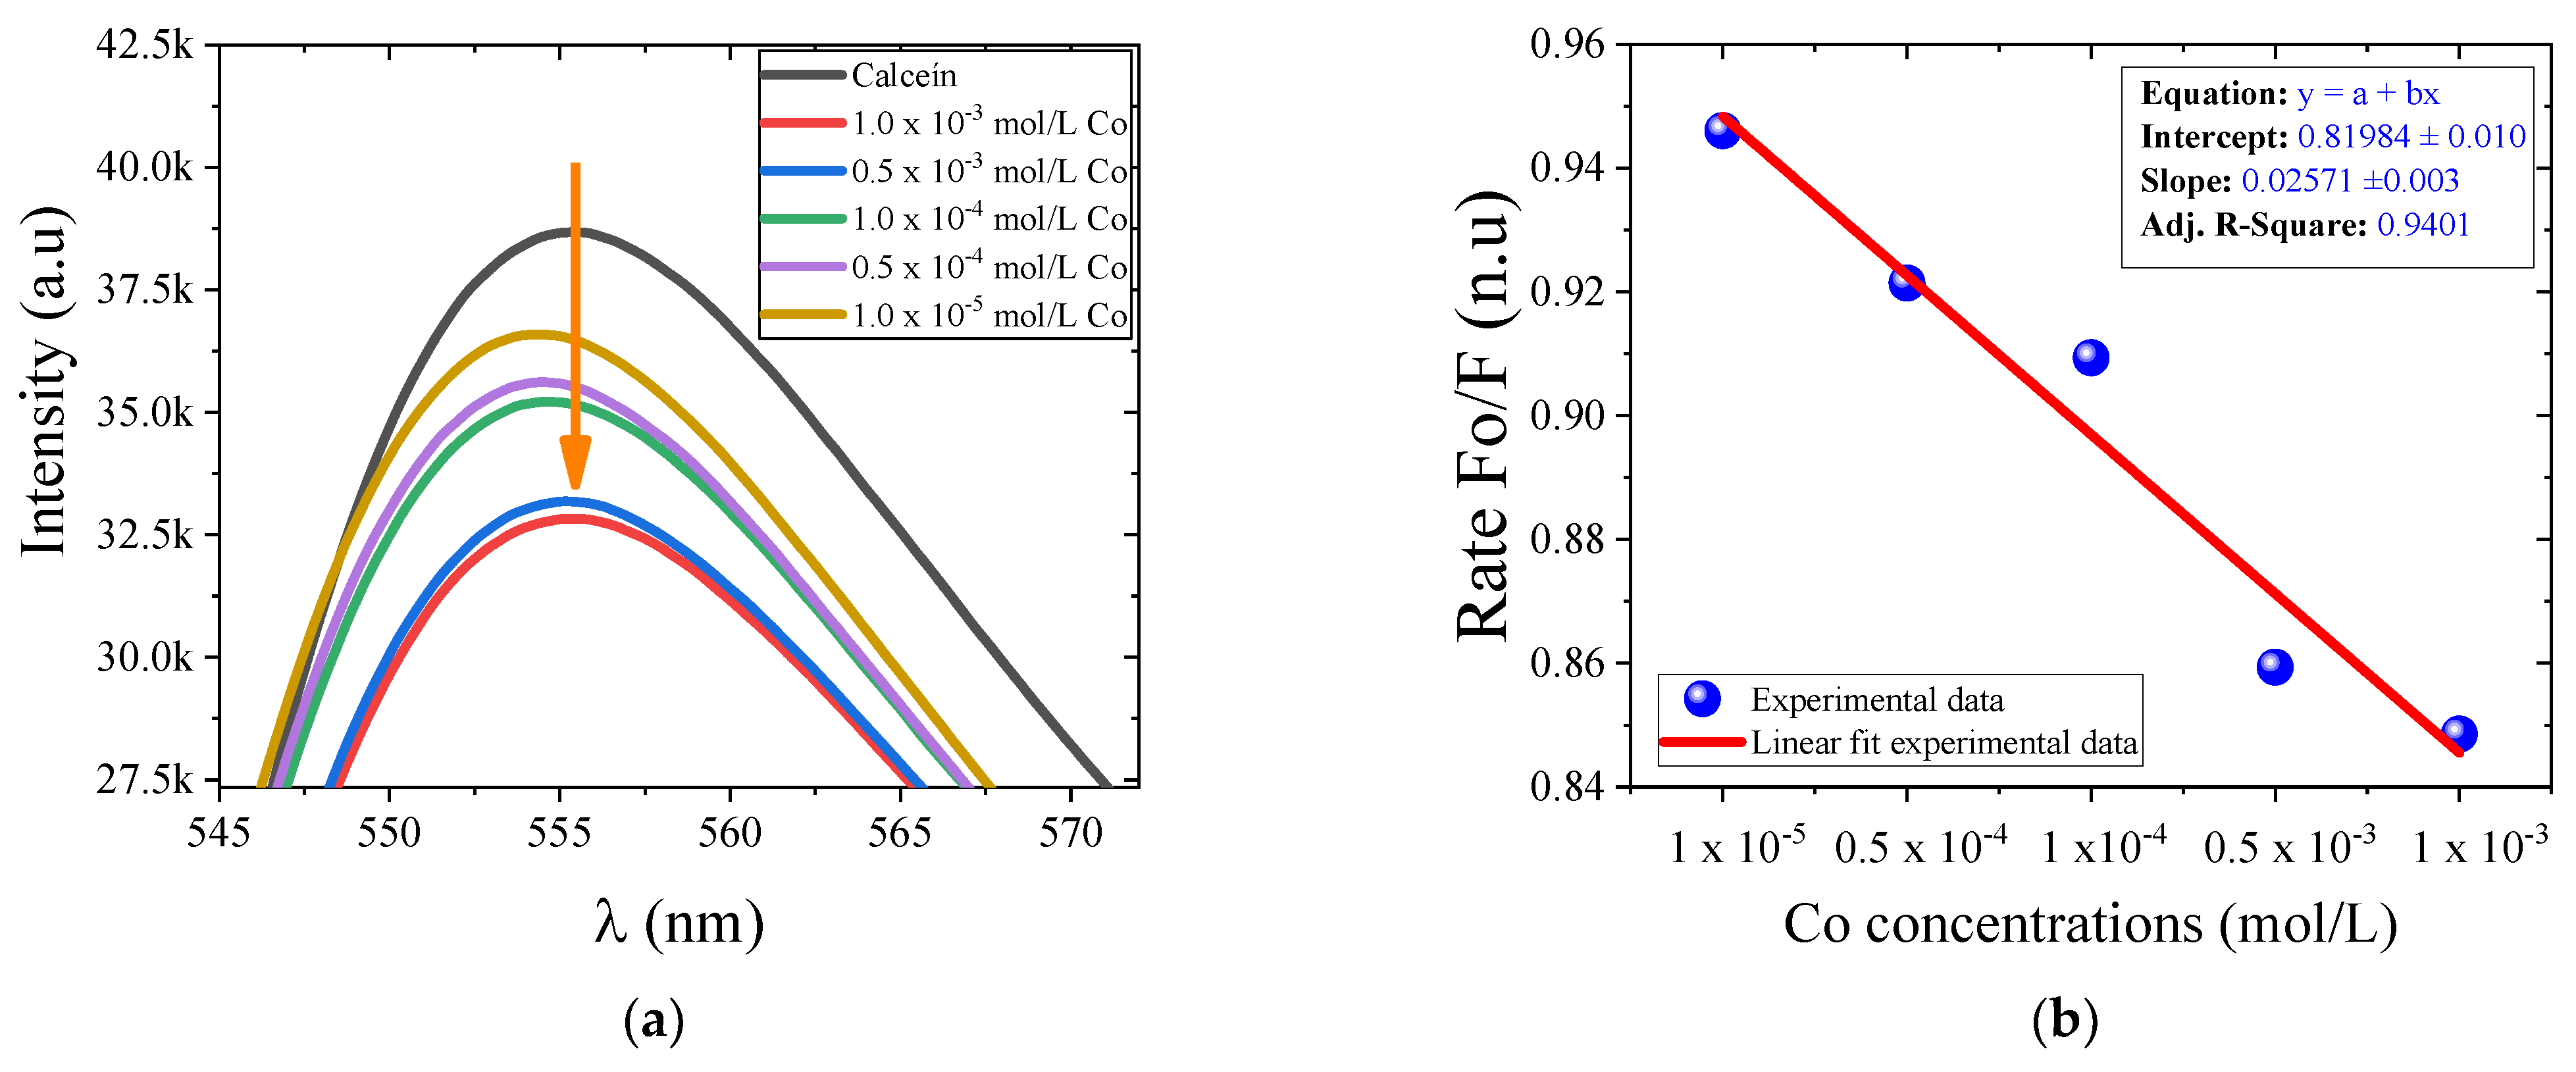
The second stage of our experiments was the spectral response of calcein for different concentrations of cobalt. Using the preparations described in Section 2.3, we obtained each fluorescence spectrum, which is shown in Figure 2a. We observe a progressive fluorescence quenching due to different Co concentrations added.
However, for a better description of the fluorescence decrement, we use the Stern–Volmer graph based in Equation (1) (Figure 2b). This analysis is obtained from the experimental data of each curve, specifically, the maximum fluorescence peak and the maximum intensity of the pumping beam. The calculation shows that they follow a linear dependence between rate Fo/F and concentration levels.
Finally, we built a layer of calcein on a glass plate. The coating was prepared using 0.02075 g/mL dissolved in ethanol. To immobilize calcein on the glass, we used 3.6 g thermoplastic polyurethane (TPU), Tecoflex®, provided by Lubrizol®. The mixture was stirred for 2 h at 80 °C until it obtained a homogeneous solution. To maintain the same conditions as in the previous tests, the pH level was adjusted at 7.
We used three representative samples of sets of cobalt concentrations described in Section 2.3. Then, we immersed the plate into the samples, and we obtained each fluorescence spectra (Figure 3). We noted that the quenching feature is present again. However, we reported some instabilities such as the fixing and stabilization of the calcein layer over the plate. The provisional reasons attributed to it are that the deposition process has not been standardized, or an additional chemical reaction has not been considered. As immediate tasks to be carried out, we are planning to optimize the fabrication process of our detector cell and test it in a broader range of cobalt concentrations.

4. Conclusions

We report the fluorescence quenching in a calcein sample induced by the presence of cobalt. The decrease in stimulated optical signal is a function of the cobalt concentration in an aqueous solution. The results indicate a linear response of the induced fluorescence quenching to the molar concentration of Co. We report the first results in the fabrication of a cell with calcein deposition, which is fixed using an immobilizing matrix based on thermoplastic polyurethane. Testing our device in a broader range of Co concentrations and optimizing the construction stage will be the next target. Preliminary results suggest that the cell can sense cobalt levels in real time using low-cost components.

Author Contributions

Conceptualization, C.R.-Z., Y.A.F.-R. and R.F.D.-C.; methodology, Y.A.F.-R. and F.A.A.-S.; formal analysis, Y.A.F.-R. and R.F.D.-C.; data curation, L.A.G.-G. and O.B.-P.; writing—original draft preparation, Y.A.F.-R., F.A.A.-S. and R.F.D.-C.; writing—review and editing, Y.A.F.-R., R.F.D.-C. and F.A.A.-S.; visualization, C.R.-Z. All authors have read and agreed to the published version of the manuscript.

Funding

This research was partially funded by the UNIVERSIDAD AUTÓNOMA DE TAMAULIPAS, grant titled: Expansion of the Research Capacity of the Electronics group at UAM Reynosa-Rodhe through infrastructure improvement (2022–2023).

Institutional Review Board Statement

Not applicable.

Informed Consent Statement

Not applicable.

Data Availability Statement

Not applicable.

Acknowledgments

R.F.D.-C., Y.A.F.-R., F.A.A.-S., L.G.-G. and O.B.-P. express acknowledgement to the UPNA and Pyrois® for the facilities provided in carrying out this work.

Conflicts of Interest

The authors declare no conflict of interest.

References

  1. Michalski, R.; Ficek, A. Environmental pollution by chemical substances used in the shale gas extraction—A review. Desalination Water Treat. 2015, 57, 1336–1343. [Google Scholar] [CrossRef]
  2. Qiu, Q.; Tan, Z.; Wang, J.; Peng, J.; Li, M.; Zhan, Z. Extraction, enumeration and identification methods for monitoring microplastics in the environment. Estuar. Coast. Shelf Sci. 2016, 176, 102–109. [Google Scholar] [CrossRef]
  3. Xu, X.; Nie, S.; Ding, H.; Hou, F.F. Environmental pollution and kidney diseases. Nat. Rev. Nephrol. 2018, 14, 313–324. [Google Scholar] [CrossRef] [PubMed]
  4. Zamora-Ledezma, C.; Negrete-Bolagay, D.; Figueroa, F.; Zamora-Ledezma, E.; Ni, M.; Alexis, F.; Guerrero, V.H. Heavy metal water pollution: A fresh look about hazards, novel and conventional remediation methods. Environ. Technol. Innov. 2021, 22, 101504. [Google Scholar] [CrossRef]
  5. Tchounwou, P.B.; Yedjou, C.G.; Patlolla, A.K.; Sutton, D.J. Heavy metal toxicity and the environment. Exp. Suppl. 2012, 101, 133–164. [Google Scholar] [CrossRef] [PubMed] [Green Version]
  6. Gumpu, M.B.; Sethuraman, S.; Krishnan, U.M.; Rayappan, J.B.B. A review on detection of heavy metal ions in water—An electrochemical approach. Sens. Actuators B Chem. 2015, 213, 515–533. [Google Scholar] [CrossRef]
  7. Valko, M.; Morris, H.; Cronin, M.T. Metals, toxicity and oxidative stress. Curr. Med. Chem. 2005, 12, 1161–1208. [Google Scholar] [CrossRef] [PubMed] [Green Version]
  8. Yamada, K. Cobalt: Its role in health and disease. Met. Ions. Life Sci. 2013, 13, 295–320. [Google Scholar] [CrossRef] [PubMed]
  9. Leyssens, L.; Vinck, B.; Van Der Straeten, C.; Wuyts, F.; Maes, L. Cobalt toxicity in humans-A review of the potential sources and systemic health effects. Toxicology 2017, 387, 43–56. [Google Scholar] [CrossRef] [PubMed]
  10. Lakowicz, J.R. Principles of Fluorescence Spectroscopy, 3rd ed.; Springer Science & Business Media: Berlin/Heidelberg, Germany, 2013. [Google Scholar]
  11. Wiederschain, G.Y. The Molecular Probes handbook. A guide to fluorescent probes and labeling technologies. Biochemistry 2011, 76, 1276–1277. [Google Scholar] [CrossRef]
  12. (ATSDR), U.S. Department of Health and Human Services. Toxicological Profile for Cobalt. 2004. Available online: https://wwwn.cdc.gov/Tsp/ToxProfiles/ToxProfiles.aspx?id=373&tid=64 (accessed on 15 September 2022).
Figure 1. (a) Experimental set-up; (b) Spectral of pump beam (black line) and fluorescence emission (red line).
Engproc 27 00067 g001
Figure 2. (a) The fluorescence signal for different levels of cobalt concentration; (b) Stern–Volmer trace based in experimental calculations generated by cobalt concentrations.
Engproc 27 00067 g002
Figure 3. Fluorescence spectra of a calcein cell for different concentrations of cobalt.
Engproc 27 00067 g003
Publisher’s Note: MDPI stays neutral with regard to jurisdictional claims in published maps and institutional affiliations.