
Arduino-Based Sensing Platform for Rapid, Low-Cost, and High-Sensitivity Detection and Quantification of Analytes in Fluidic Samples †

Abstract
1. Introduction
2. Methods
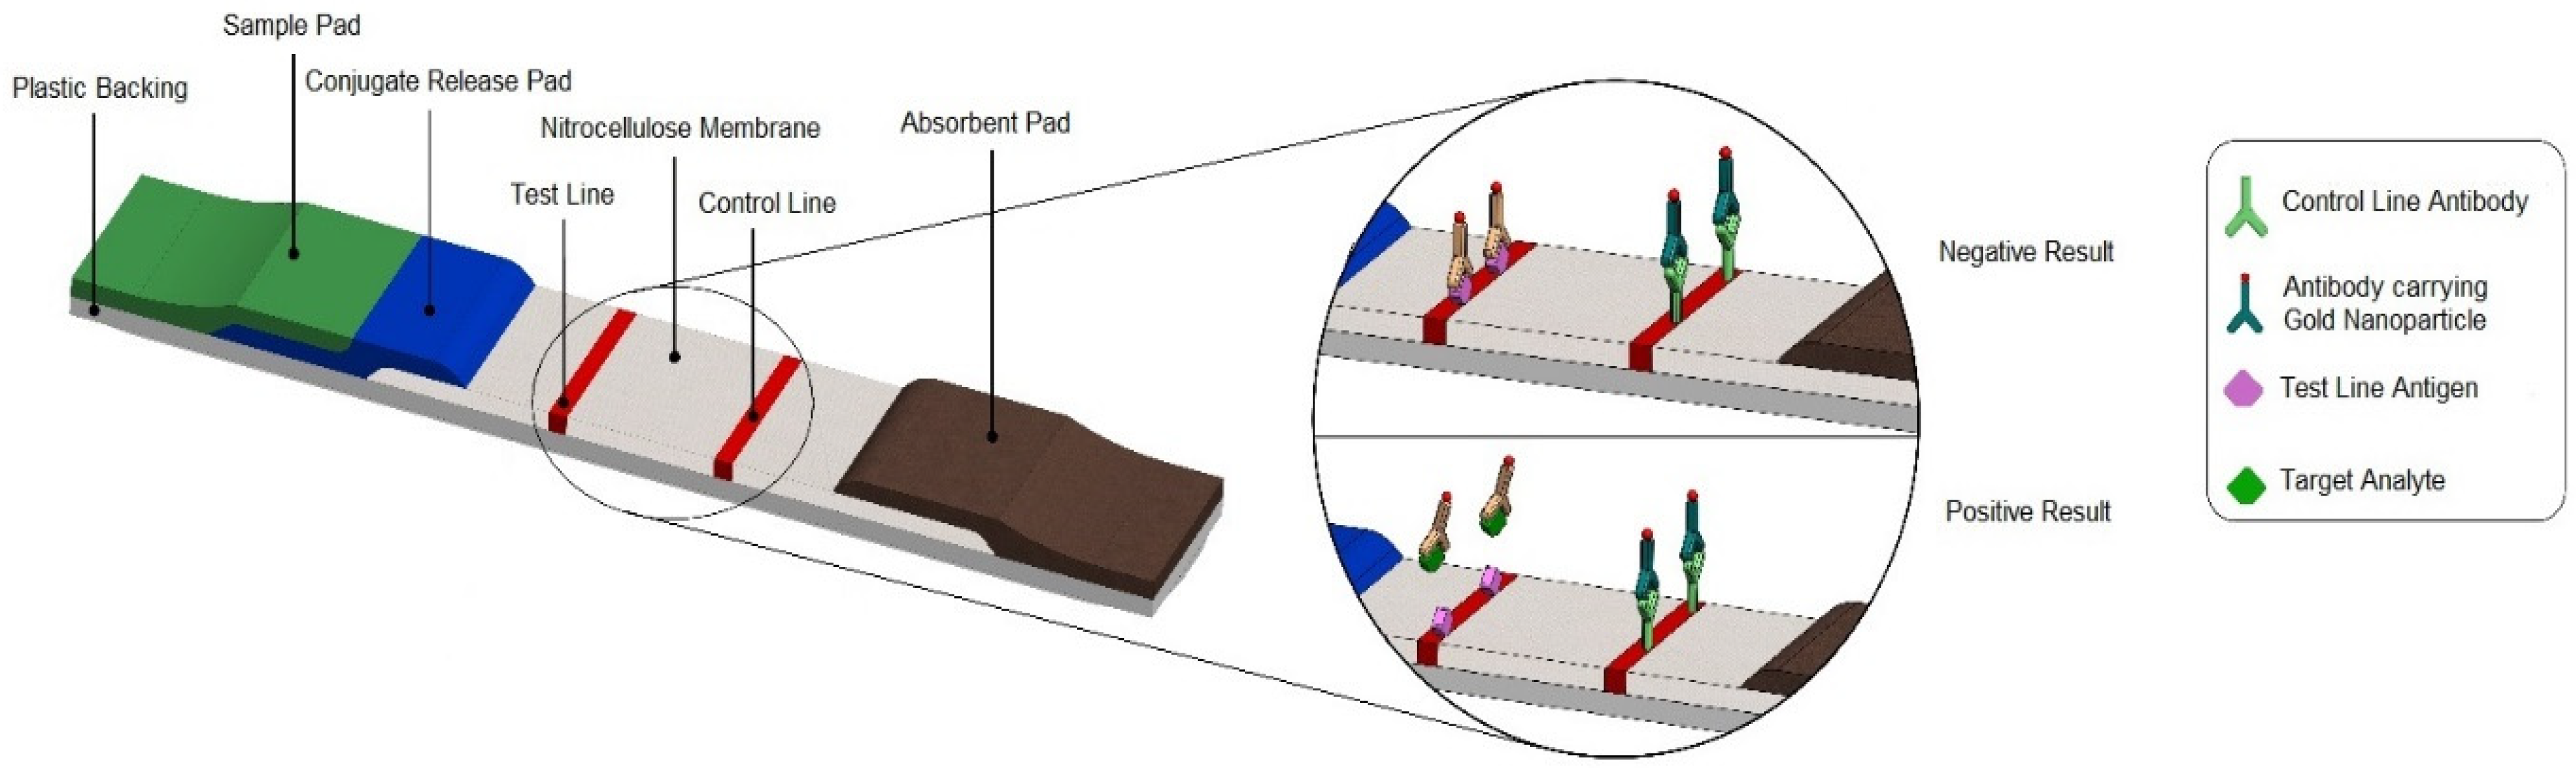
2.1. LFA Principles
2.2. LFA Sensing via Photothermal Radiometry (PTR)
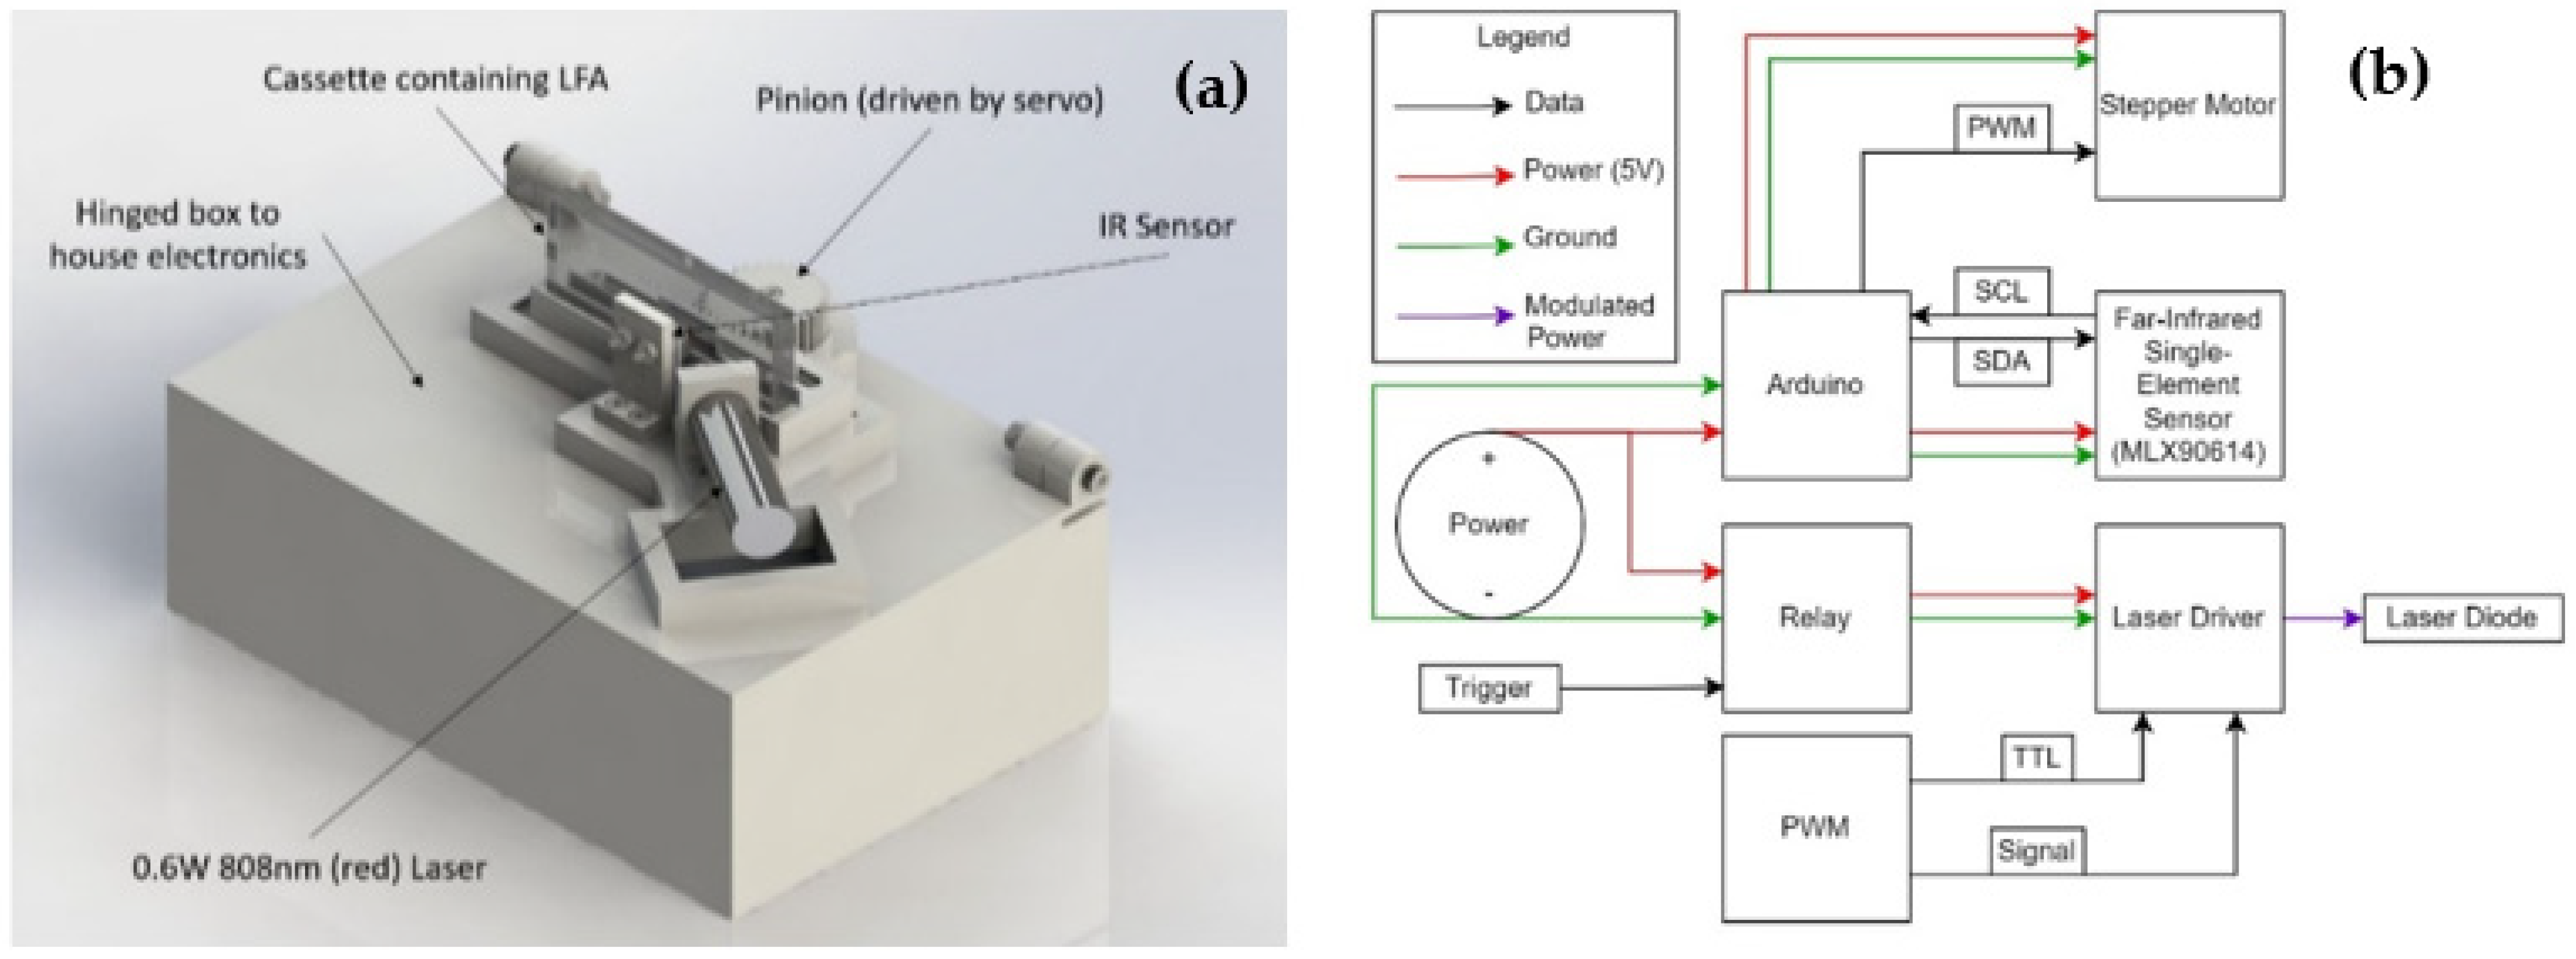
2.3. Sensor Design Process and Final Design
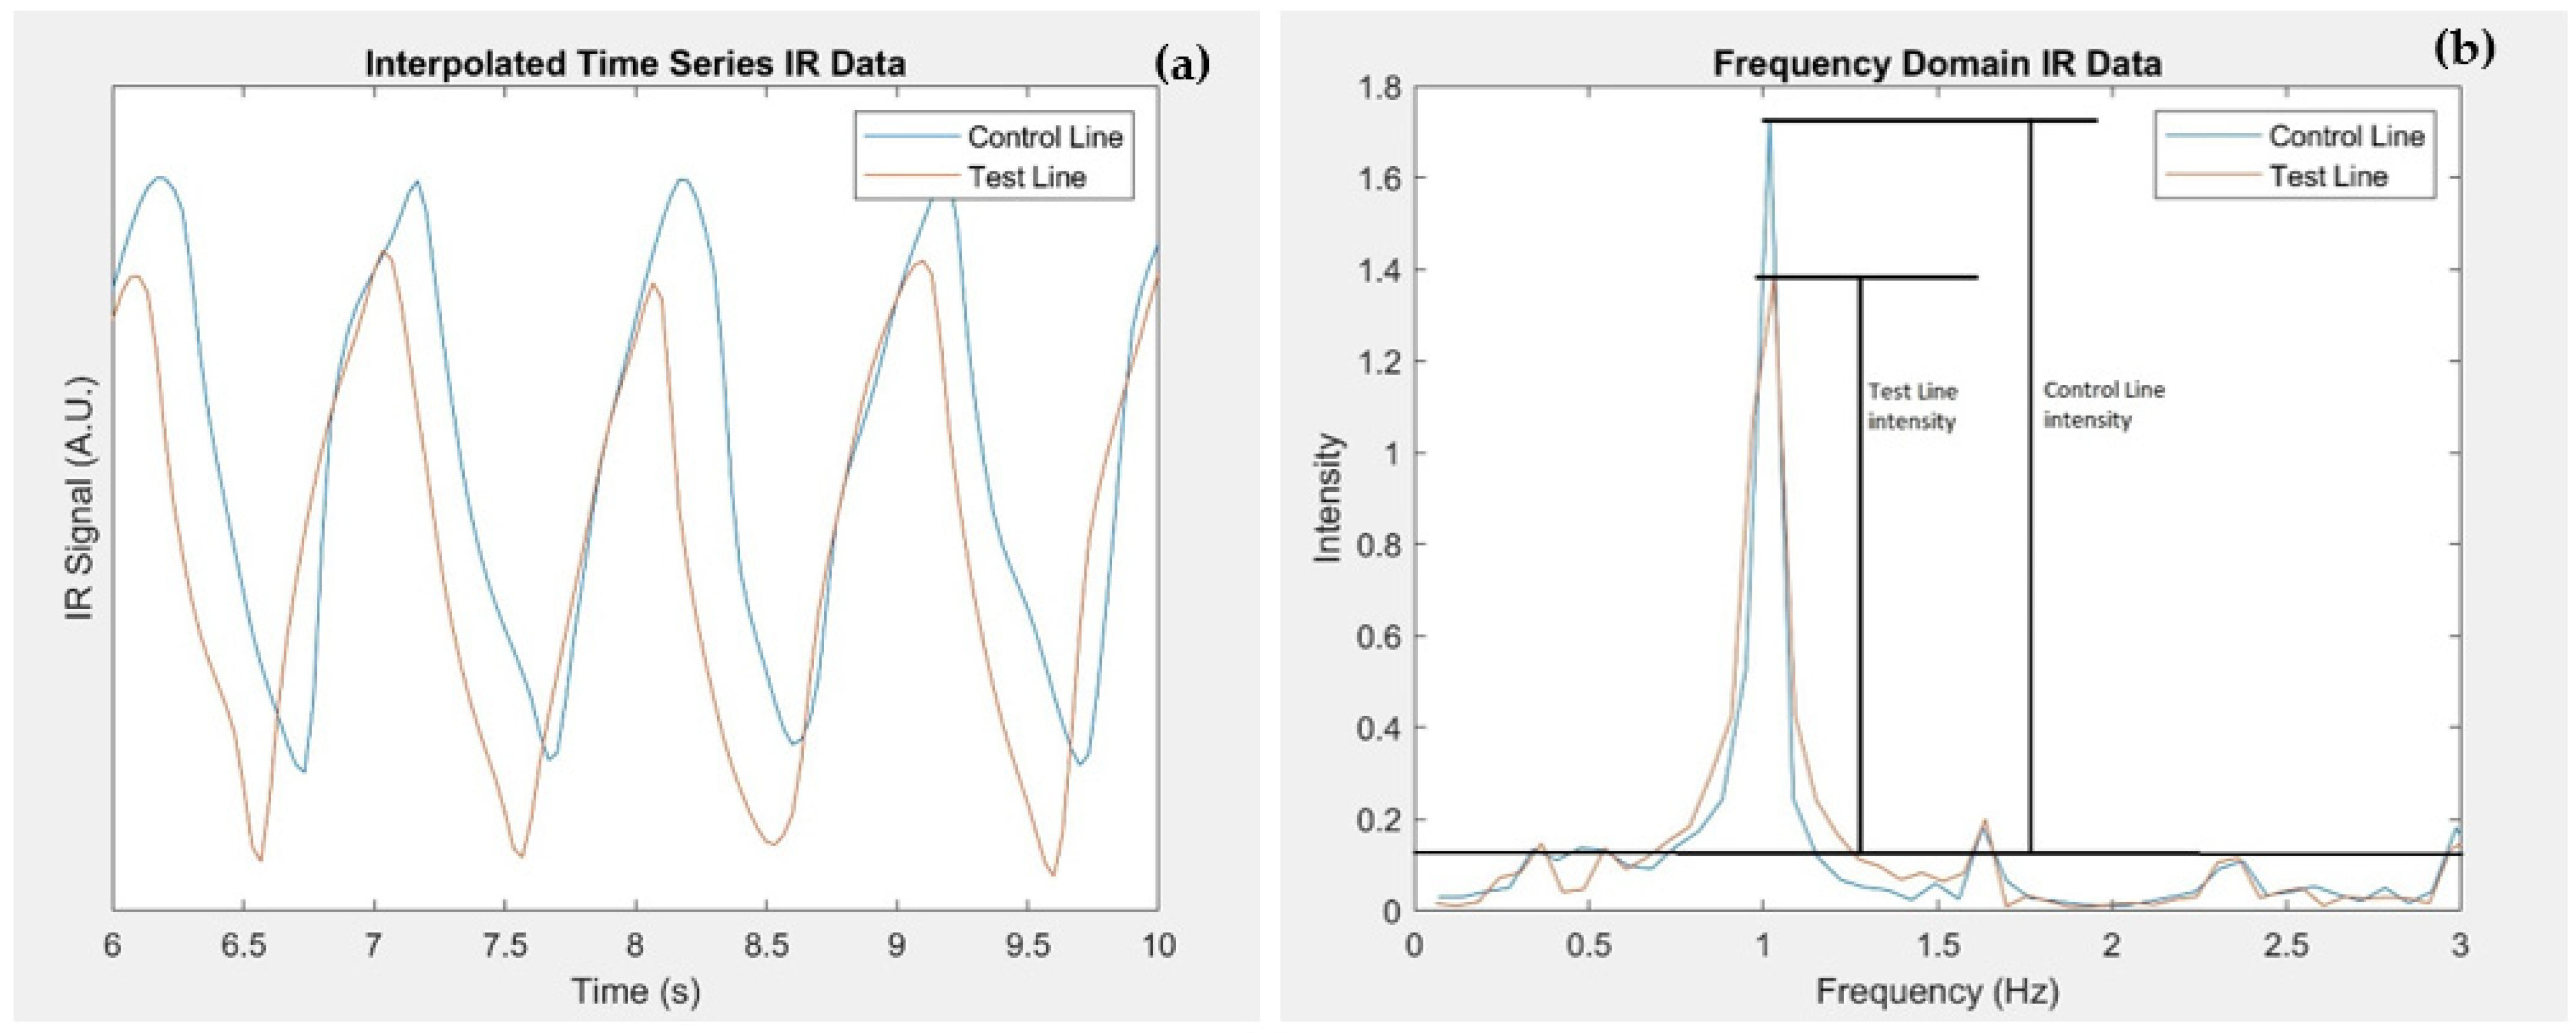
2.4. Data Processing
2.5. LFA Preparation/Samples
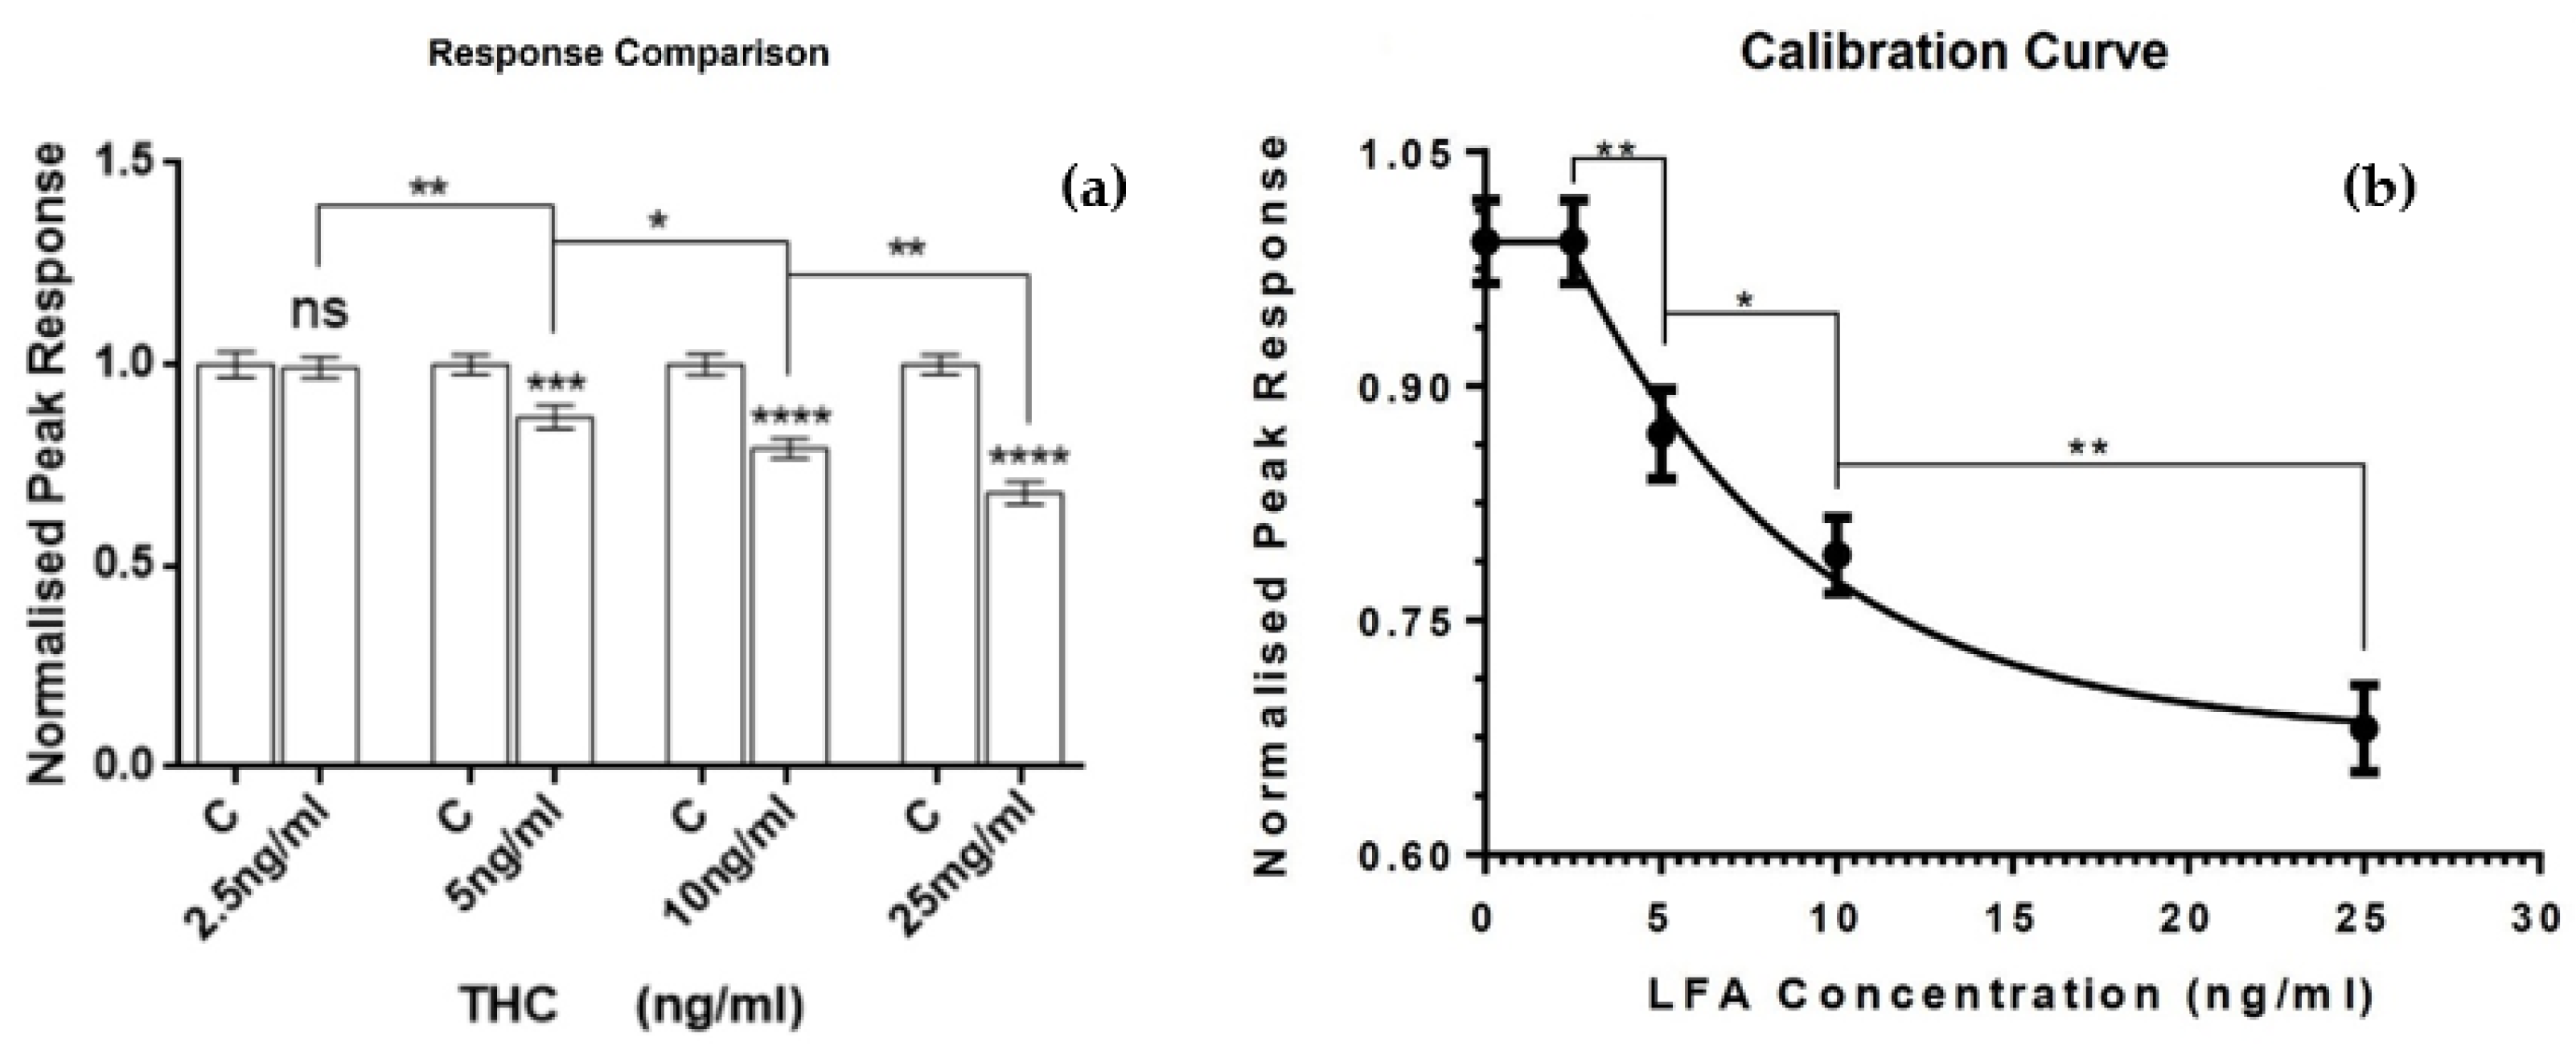
3. Results and Discussion
4. Conclusions
Author Contributions
Funding
Institutional Review Board Statement
Informed Consent Statement
Data Availability Statement
Acknowledgments
Conflicts of Interest
References
- Bahadır, E.B.; Sezgintürk, M.K. Lateral flow assays: Principles, designs and labels. TrAC Trends Anal. Chem. 2016, 82, 286–306. [Google Scholar] [CrossRef]
- Grothaus, G.D.; Bandla, M.; Currier, T.; Giroux, R.; Jenkins, G.R.; Lipp, M.; Shan, G.; Stave, J.W.; Pantella, V. Immunoassay as an Analytical Tool in Agricultural Biotechnology. J. AOAC Int. 2006, 89, 913–928. [Google Scholar] [CrossRef] [PubMed]
- López-Marzo, A.M.; Pons, J.; Blake, D.A.; Merkoçi, A. High sensitive gold-nanoparticle based lateral flow Immunodevice for Cd2+ detection in drinking waters. Biosens. Bioelectron. 2013, 47, 190–198. [Google Scholar] [CrossRef] [PubMed]
- Wang, K.; Qin, W.; Hou, Y.; Xiao, K.; Yan, W. The application of lateral flow immunoassay in point of care testing: A review. Nano Biomed. Eng. 2016, 8, 172–183. [Google Scholar] [CrossRef]
- Wu, J.-L.; Tseng, W.-P.; Lin, C.-H.; Lee, T.-F.; Chung, M.-Y.; Huang, C.-H.; Chen, S.-Y.; Hsueh, P.-R.; Chen, S.-C. Four point-of-care lateral flow immunoassays for diagnosis of COVID-19 and for assessing dynamics of antibody responses to SARS-CoV-2. J. Infect. 2020, 81, 435–442. [Google Scholar] [CrossRef] [PubMed]
- Lateral Flow Assays Market by Application—Global Forecast to (2022–2026). Available online: https://www.marketsandmarkets.com/Market-Reports/lateral-flow-assay-market-167205133.html (accessed on 8 September 2022).
- Logan, B.K.; Lowrie, K.J.; Turri, J.L.; Yeakel, J.K.; Limoges, J.F.; Miles, A.K.; Scarneo, C.E.; Kerrigan, S.; Farrell, L.J. Recommendations for Toxicological Investigation of Drug-Impaired Driving and Motor Vehicle Fatalities. J. Anal. Toxicol. 2013, 37, 552–558. [Google Scholar] [CrossRef] [PubMed]
- Plouffe, B.D.; Murthy, S.K. Fluorescence-based lateral flow assays for rapid oral fluid roadside detection of cannabis use. Electrophoresis 2017, 38, 501–506. [Google Scholar] [CrossRef] [PubMed]
- Thapa, D.; Samadi, N.; Patel, N.; Tabatabaei, N. Thermographic detection and quantification of THC in oral fluid at unprecedented low concentrations. Biomed. Opt. Express 2020, 11, 2178–2190. [Google Scholar] [CrossRef] [PubMed]
- Thapa, D.; Samadi, N.; Tabatabaei, N. Handheld Thermo-Photonic Device for Rapid, Low-Cost, and On-Site Detection and Quantification of Anti-SARS-CoV-2 Antibody. IEEE Sens. J. 2021, 21, 18504–18511. [Google Scholar] [CrossRef]
- Koczula, K.M.; Gallotta, A. Lateral flow assays. Essays Biochem. 2016, 60, 111–120. [Google Scholar] [CrossRef]
- Vollmer, M.; Möllmann, K.-P. Fundamentals of Infrared Thermal Imaging. In Infrared Thermal Imaging; Springer: Cham, Switzerland, 2017; pp. 1–106. [Google Scholar]
- Breitenstein, O.; Warta, W.; Langenkamp, M. Physical and Technical Basics. In Lock-in Thermography: Basics and Use for Evaluating Electronic Devices and Materials; Breitenstein, O., Warta, W., Langenkamp, M., Eds.; Springer: Berlin/Heidelberg, Germany, 2010; pp. 7–59. [Google Scholar]


| Component Category | Cost (USD) |
|---|---|
| Laser and electronics | $20 |
| IR Sensor | $9 |
| Arduino-based controller | $15 |
| Housing and motor | $7 |
| Total | $51 |
Publisher’s Note: MDPI stays neutral with regard to jurisdictional claims in published maps and institutional affiliations. |
© 2022 by the authors. Licensee MDPI, Basel, Switzerland. This article is an open access article distributed under the terms and conditions of the Creative Commons Attribution (CC BY) license (https://creativecommons.org/licenses/by/4.0/).
Share and Cite
Hayden, D.; Anacleto, S.; Archonta, D.-E.; Khalil, N.; Pennella, A.; Qureshi, S.; Séguin, A.; Tabatabaei, N. Arduino-Based Sensing Platform for Rapid, Low-Cost, and High-Sensitivity Detection and Quantification of Analytes in Fluidic Samples. Eng. Proc. 2022, 27, 69. https://doi.org/10.3390/ecsa-9-13277
Hayden D, Anacleto S, Archonta D-E, Khalil N, Pennella A, Qureshi S, Séguin A, Tabatabaei N. Arduino-Based Sensing Platform for Rapid, Low-Cost, and High-Sensitivity Detection and Quantification of Analytes in Fluidic Samples. Engineering Proceedings. 2022; 27(1):69. https://doi.org/10.3390/ecsa-9-13277
Chicago/Turabian StyleHayden, Derek, Sergio Anacleto, Daphne-Eleni Archonta, Nour Khalil, Antonia Pennella, Shadan Qureshi, Alexandre Séguin, and Nima Tabatabaei. 2022. "Arduino-Based Sensing Platform for Rapid, Low-Cost, and High-Sensitivity Detection and Quantification of Analytes in Fluidic Samples" Engineering Proceedings 27, no. 1: 69. https://doi.org/10.3390/ecsa-9-13277
APA StyleHayden, D., Anacleto, S., Archonta, D.-E., Khalil, N., Pennella, A., Qureshi, S., Séguin, A., & Tabatabaei, N. (2022). Arduino-Based Sensing Platform for Rapid, Low-Cost, and High-Sensitivity Detection and Quantification of Analytes in Fluidic Samples. Engineering Proceedings, 27(1), 69. https://doi.org/10.3390/ecsa-9-13277