Proceeding Paper

Land Use and Land Coverage Analysis with Google Earth Engine and Change Detection in the Sonipat District of the Haryana State in India †

1
Amity School of Natural Resources & Sustainable Development, Amity University Uttar Pradesh, Noida 201303, India
2
School of Environment and Sustainable Development, Central University of Gujarat, Gandhinagar 382030, India
*
Author to whom correspondence should be addressed.
Presented at the 9th International Electronic Conference on Sensors and Applications, 1–15 November 2022; Available online: https://ecsa-9.sciforum.net/.
Eng. Proc. 2022, 27(1), 85; https://doi.org/10.3390/ecsa-9-13366
Published: 1 November 2022

Abstract

:
The natural environment is of the utmost significance not only for a particular location but also for the entire world. This is because the natural environment provides essential environmental services to the human population. However, the environment is being negatively impacted by human activity as well as population growth. The most significant impact is felt in the national capital region. Using the Google Earth Engine (GEE) cloud platform and the QGIS desktop, the purpose of this research was to analyze the changes in land use and land cover (LULC) transformations that have taken place in the Sonipat district of India over the past ten years (2011–2021). Change detection (CD) of an LULC map is a method that examines shifts in LULC throughout time. Landsat 7 and the Sentinel 2 satellite image collections were utilized in this study. The study area was divided into four LULC categories using the most likely classified approach to quantify the changes over the aforementioned period. The results indicated that between 2011 and 2021, cropland in the study area decreased by about 11%. Built-up and urban areas increased by 3%. With the help of this study, decision-makers will be able to make choices that are appropriate in the given situation. The findings emphasize the value of satellite monitoring in reducing the rate of environmental degradation in the Sonipat district.

1. Introduction

Land use and land cover (LULC) are undergoing significant development in the vast majority of countries right now [1]. The majority of the blame for these LULC shifts should be placed on humans and the environment in which they live [2]. There will be detrimental effects on human health as well as ecosystems [3]. These changes have had a number of unfavorable effects on a global scale [4], including but not limited to the following: erosion, increased runoff, flooding, the depletion of water resources, and a decline in the quality of the water [5]. The term “land cover” refers to the natural covering that is present on the surface of the land, whereas the term “land use” refers to the activities that are carried out by humans on the land itself [6]. There is a distinction to be made between the two of these terms. The shift in LULC is a cause for concern, as it has the potential to have important repercussions for the environment [7] at all different scales (local, regional, national, and global) [8]. The urbanization that is taking place as a direct consequence of the quickening pace of development is having an effect on the changes that are taking place in LULC [9]. In the world we live in today, innovative technologies such as remote sensing (RS) [10] and geographic information systems (GIS) can provide helpful data and tools to assist in the resolution of issues such as these [11,12].
To assess the transformation in LULC between 2011 and 2021, this study examines the decade variation in the LULC and predicts the shift in LULC that will occur in 2031. This study was conducted on the GEE cloud platform and QGIS Desktop 2.18.0 software. With the aid of this study, policymakers will be able to monitor and mitigate the negative effects of LULC change while maintaining the production of essential resources.

2. Study Area

The Haryana district of Sonipat was chosen as the study area (Figure 1). The latitudes and longitudes of the Sonipat district are 280 48′15″ and 290 17′10″ north and 760 28′40″ and 770 12′45″ east, respectively. The Survey of India topo sheets 53C, 53D, 53G, and 53H cover an area of 2213.37 km2. Panipat is to the north of the district, Jind is to the west, Rohtak is to the south-southwest, and Delhi is to the south. In addition, the city is connected to Delhi and Chandigarh by broad-gauge railway. The district experiences intense heat in the summer and extreme cold in the winter. From late November to March, we experience the cold season. The southwest monsoon season occurs between July and September.

3. Methodology and Data Used

3.1. Land Use Land Cover Classification

The LULC studies made use of data from both Landsat 7 (2011) and Sentinel 2 (2021). The following major LULC classes were chosen for this research: urban and built-up areas, bodies of water, cropland, and barren/fallow areas (other). Using GEE script, LULC was categorised. This cloud-based platform implements the three major steps outlined below:
  • Image selection.
  • Collection of training samples.
  • Running the classifier.

3.2. Accuracy Assessment

The accuracy of both LULC classification maps was evaluated with the help of a confusion matrix that was built into GEE. This matrix does this by contrasting the LULC that is linked to the validation points with the classifications that are produced (2011, 2021). The overall accuracy can be calculated with the help of a confusion matrix.

3.3. Change Detection and Prediction

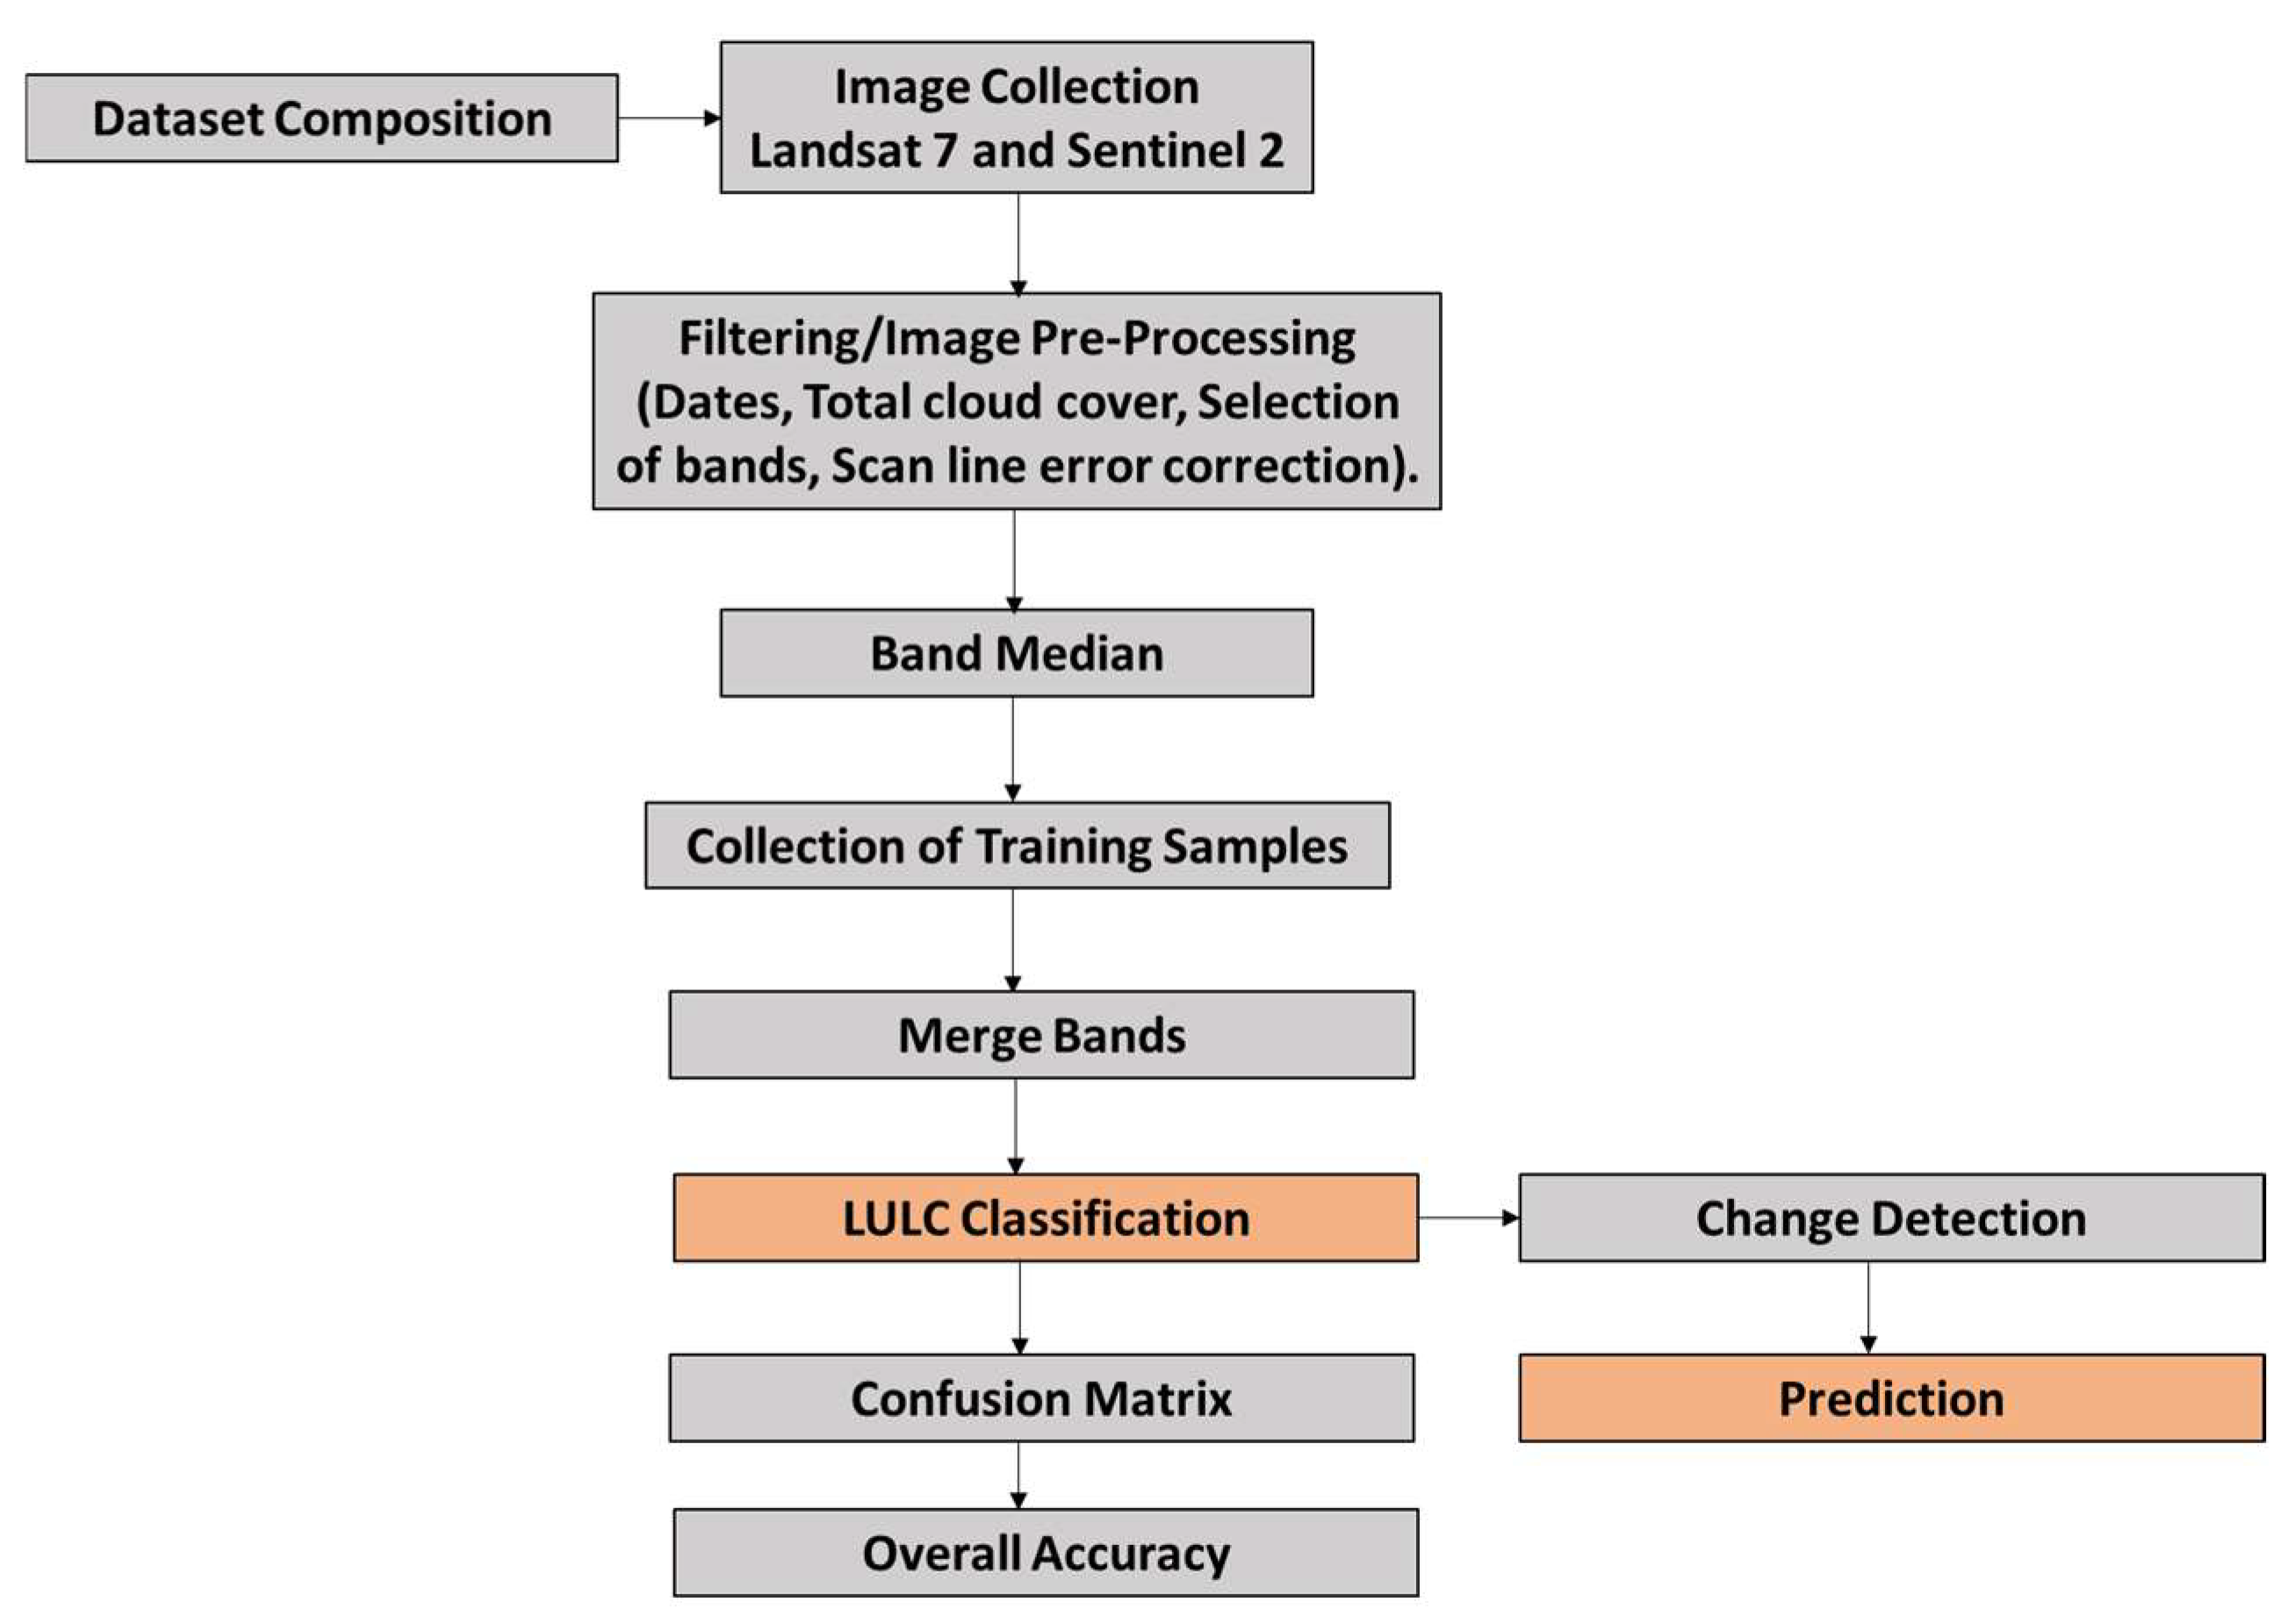
Using the cellular (MOLUSCE) plugin of Quantum 283 GIS 2.18.0 software, both the detection and prediction of LULC changes were identified. A change in area was computed between the initial year (2011) of the LULC and the final year (2021) of the LULC. Using the transition potential model, 2031 predictions were made. The steps that were taken for this study are shown in the methodology flow chart (Figure 2).

4. Results and Discussions

4.1. LULC Classification

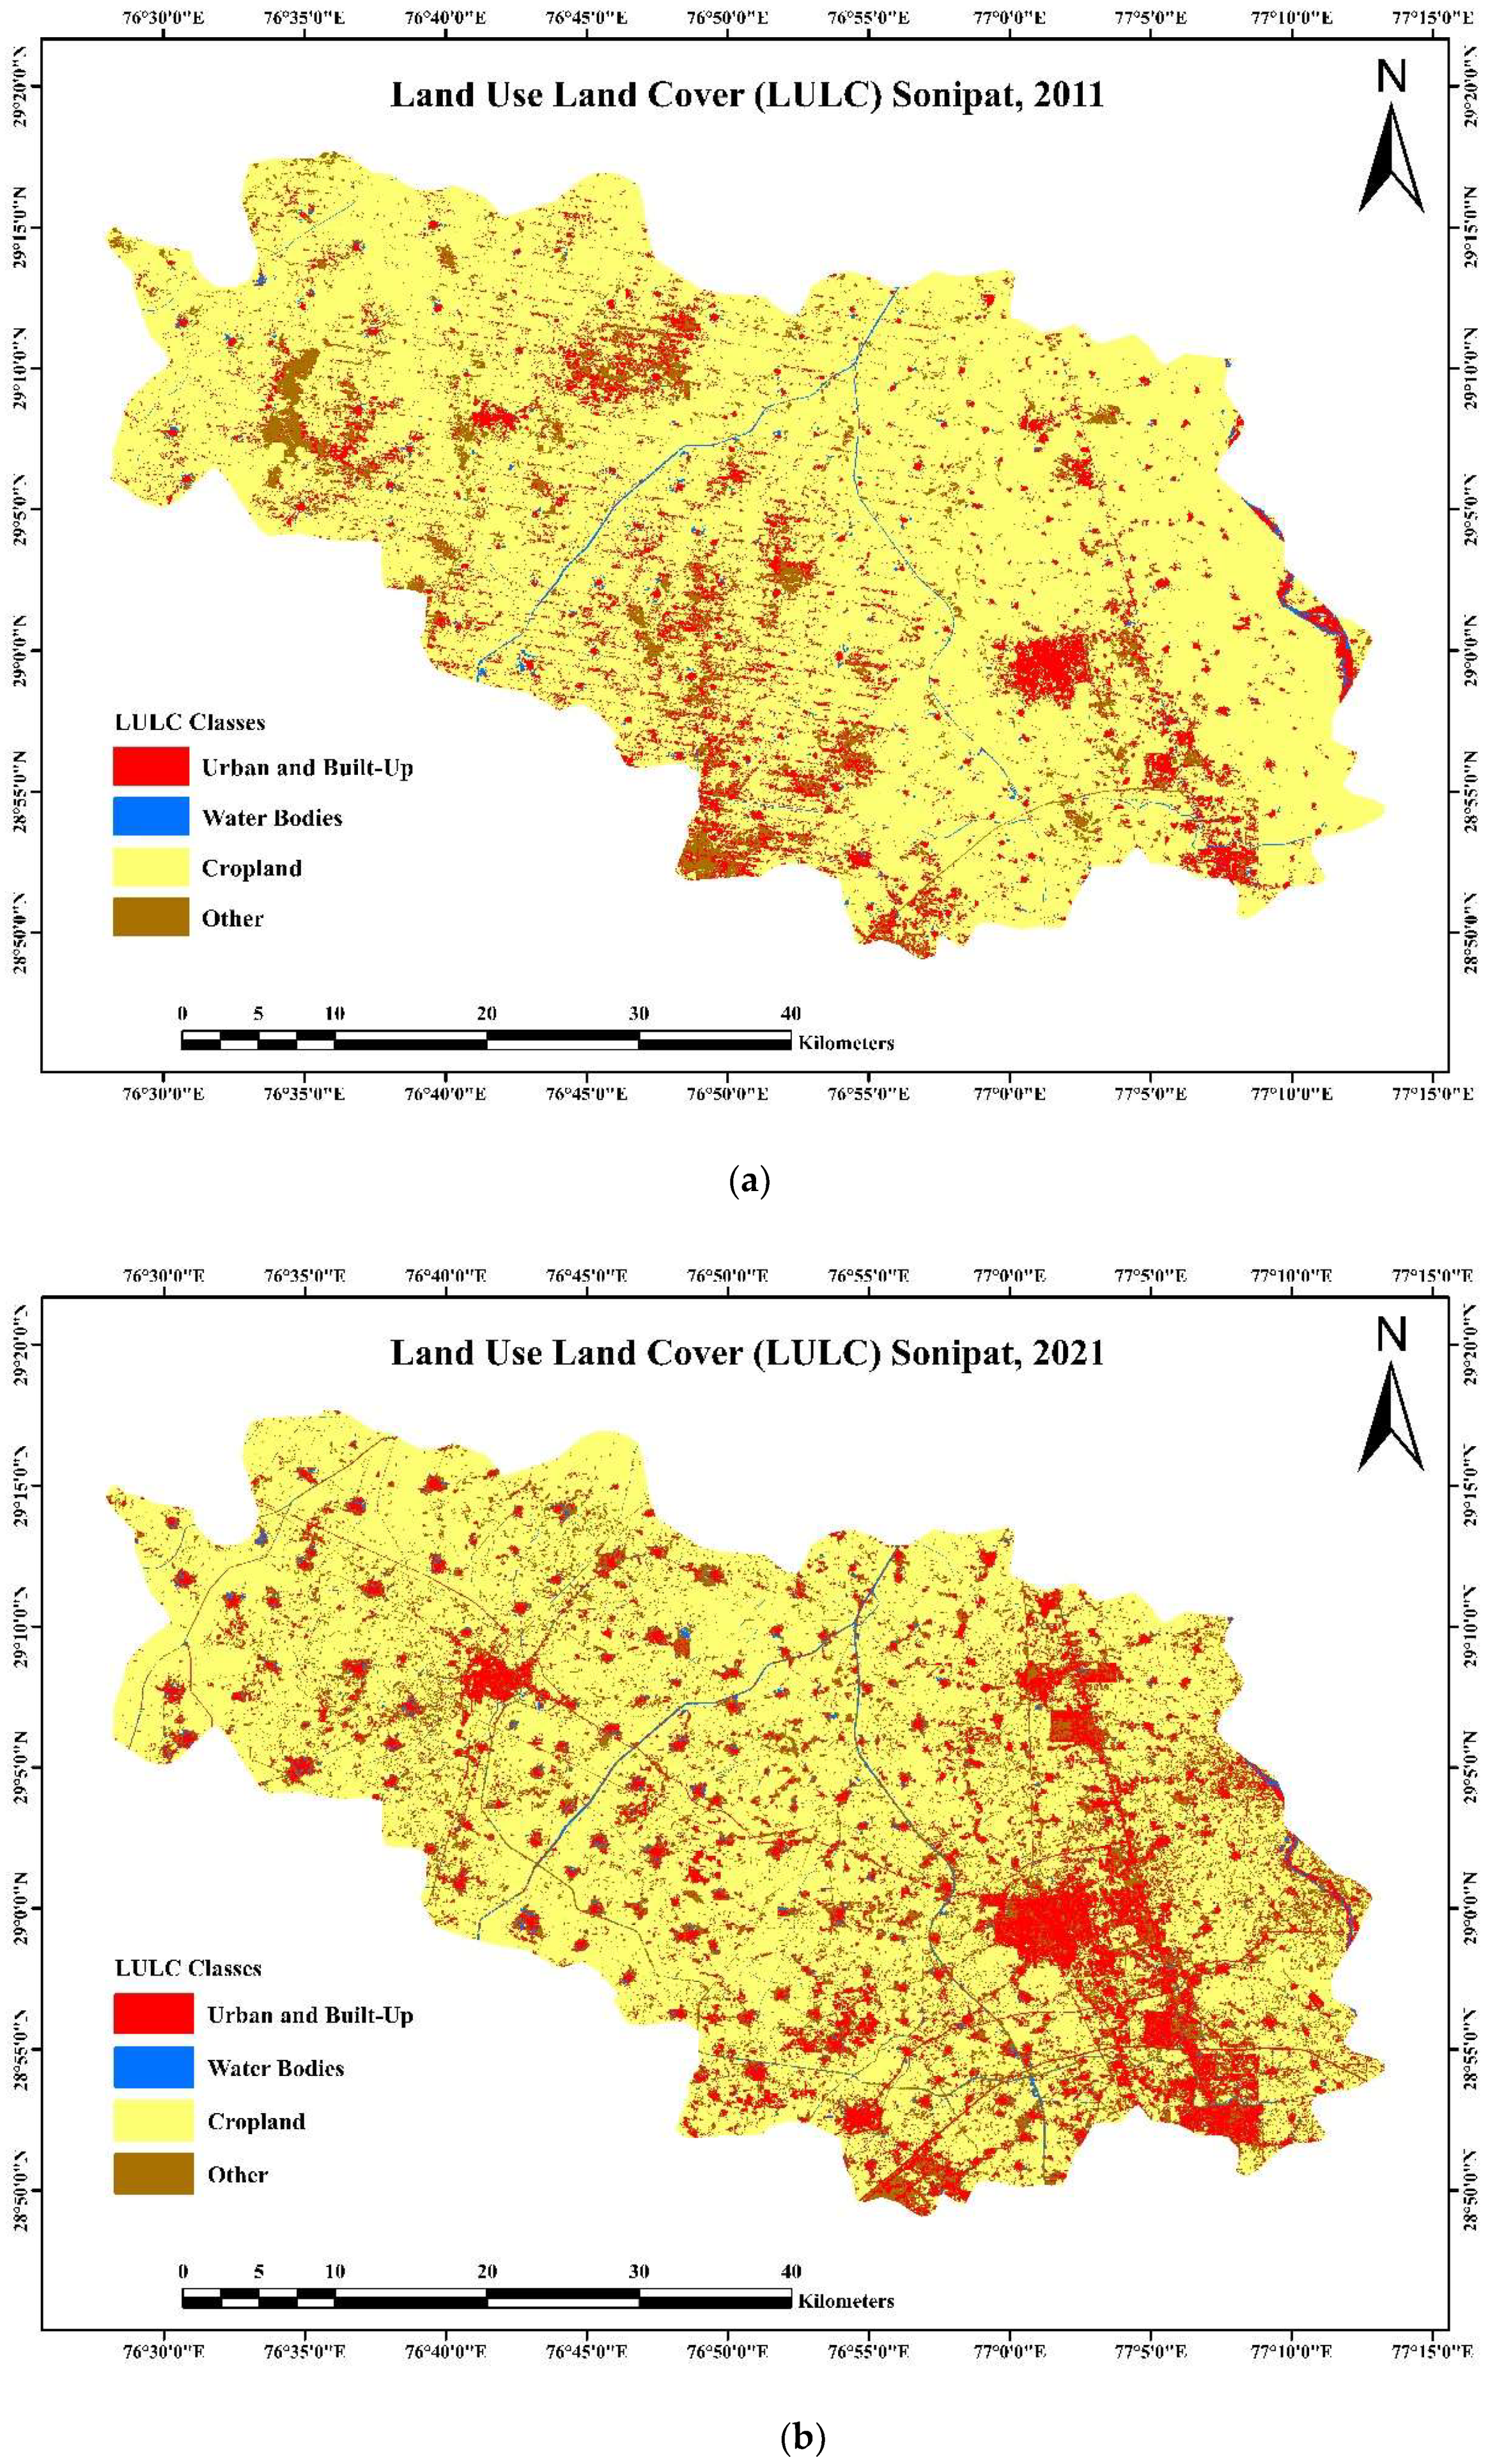
As was just stated, estimates for the LULC classification were carried out for the years 2011 and 2021. In 2011, the majority of the land was used for agricultural purposes; however, by 2021, large swaths of land had been developed into urban and built-up areas, particularly in the south and south east regions of the district (Figure 3).

4.2. Accuracy Assessment

The accuracy of the classification was analyzed with the help of a confusion matrix. The accuracy of the classification was 0.98 over the course of both years (Table 1 and Table 2). The same accuracy techniques were used by other researchers in their studies [13].

4.3. Change Detection

Changes in LULC are analyzed as a proportion of total land area. Positive values indicate improved categorizations, whereas negative values indicate categorizations that have deteriorated. Urban and built-up LULC class area was observed to increase by 3 percent in 2021, while other LULC classes, including fallow and barren land, were also observed to increase by 7 percent in 2021 (Table 3). These LULC changes were observed in the study area as a result of its incorporation into the national capital region, so these changes are the result of human activity and migration.
Where Δ is shows the change in area of two decades.
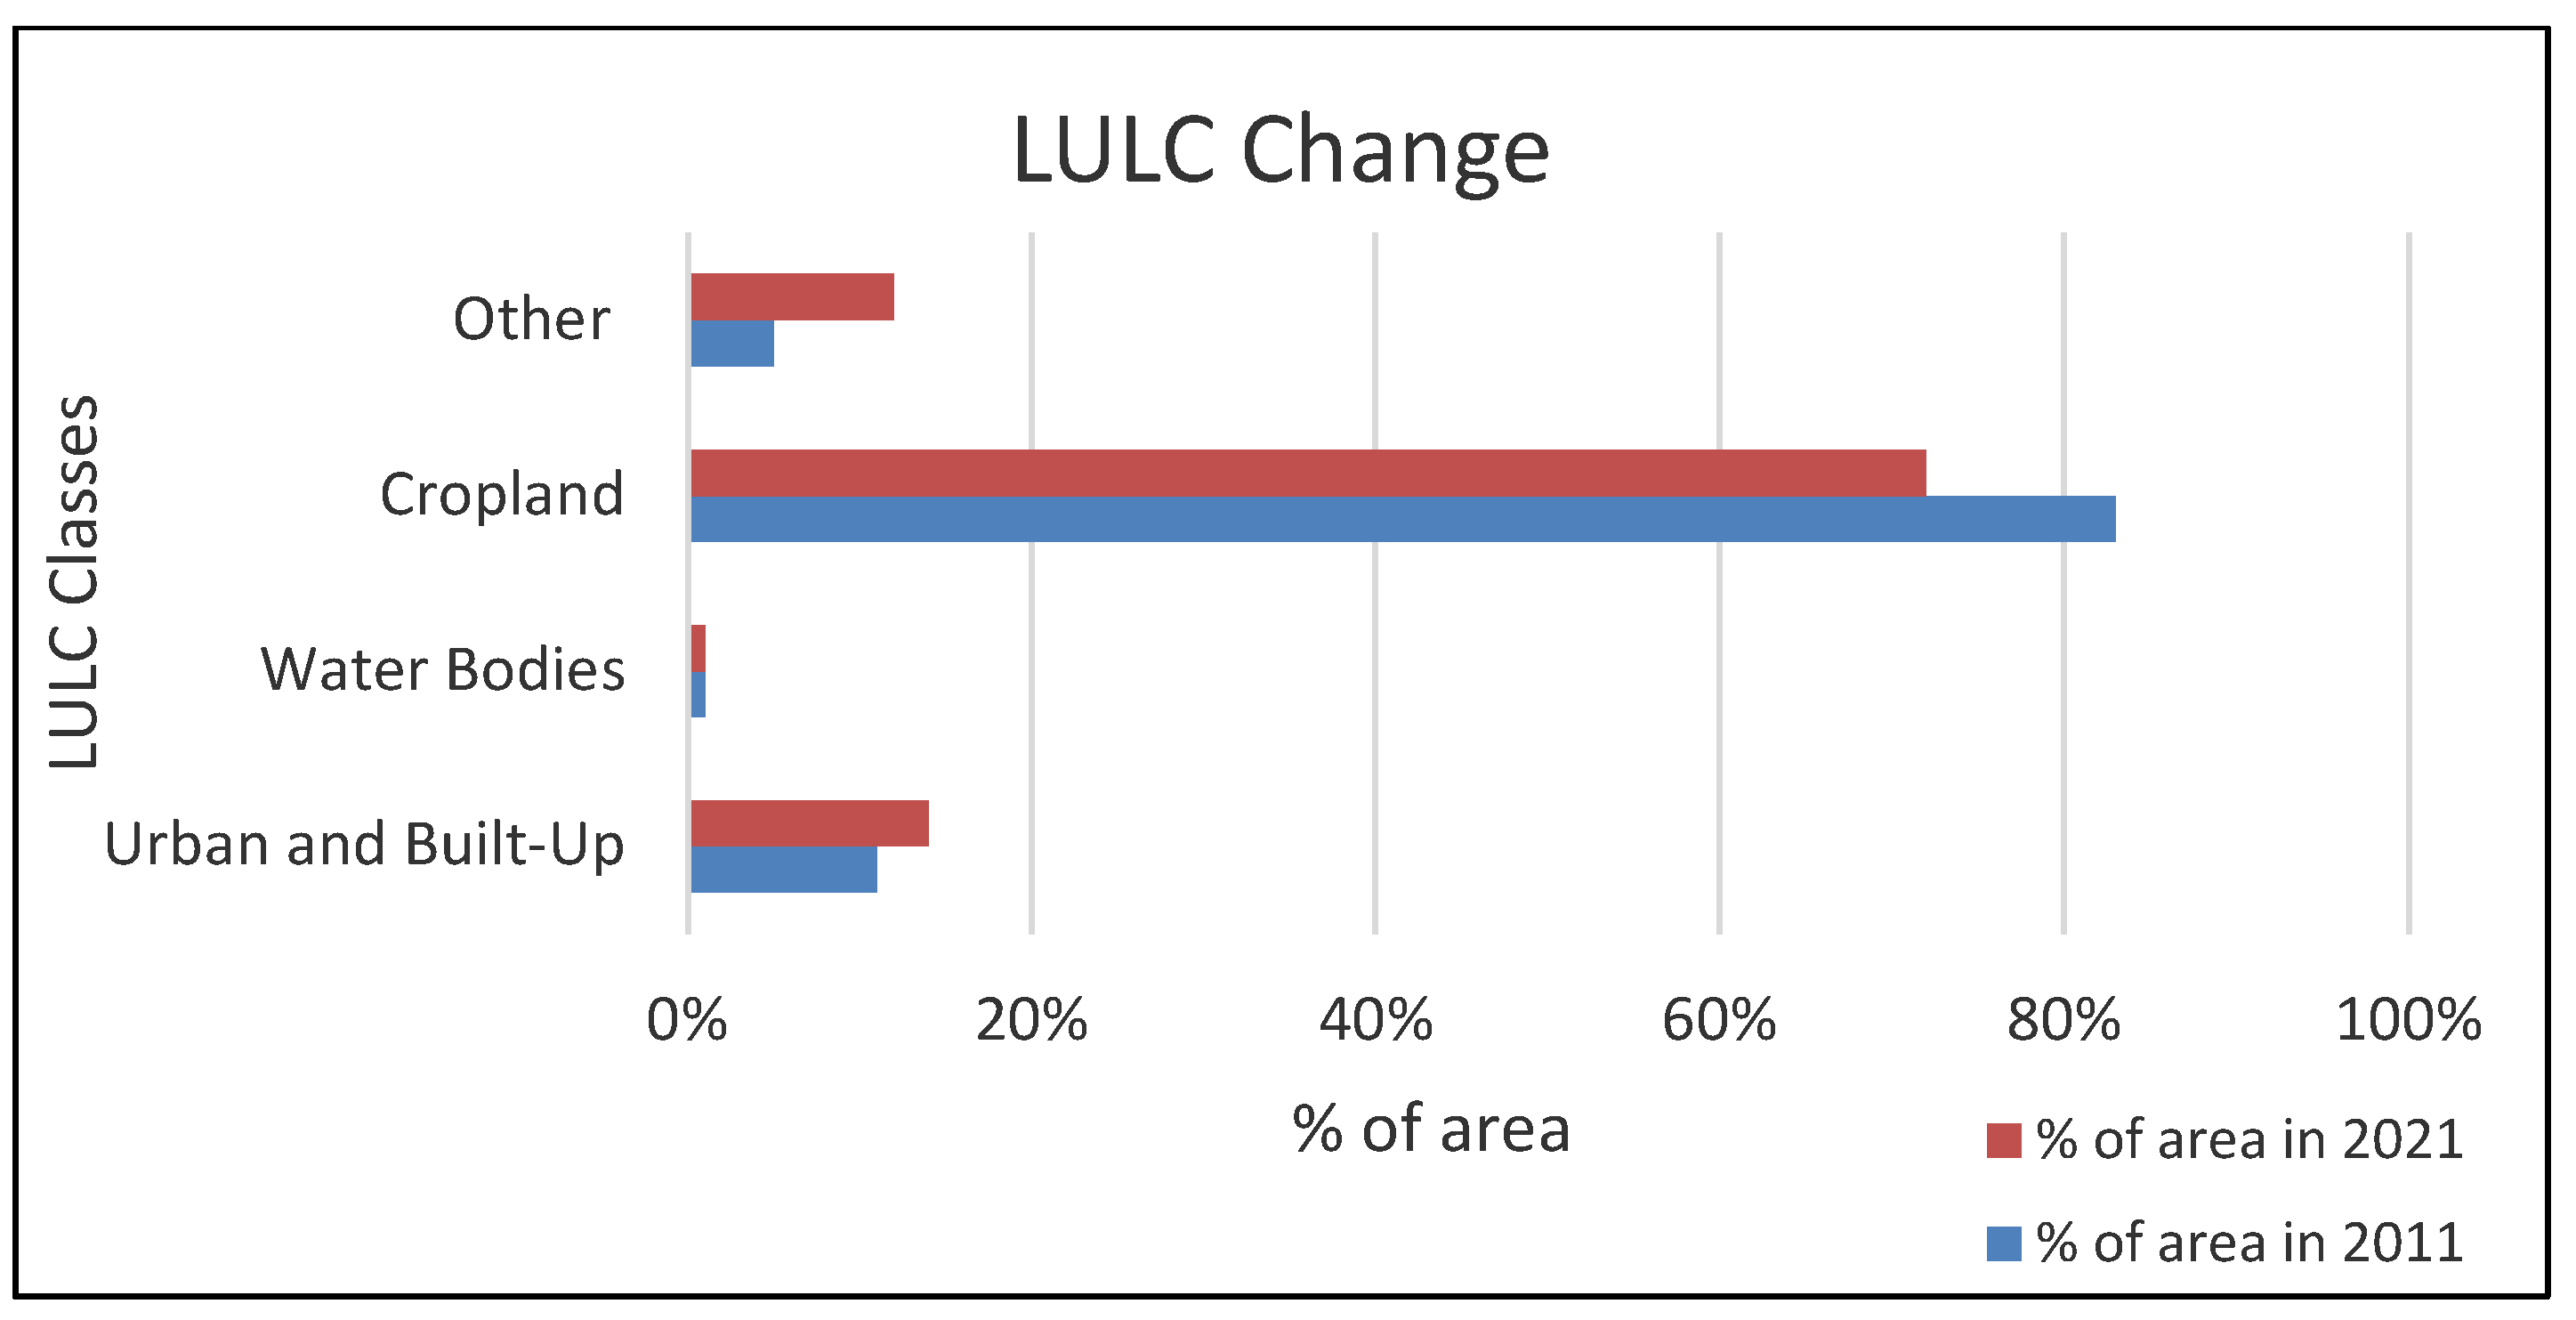
Figure 4 depicts the trends of the changes in LULC from 2011 to 2021. These trends indicate that the cropland land use class covered a greater proportion of the total land area in the study area, whereas the waterbody LULC class covered a smaller area. Agriculture is the primary source of income for the people who live in this district of Haryana, and the Khadar region and the upland plains of this district are ideal for the cultivation of rice and sugarcane, respectively.

4.4. Prediction

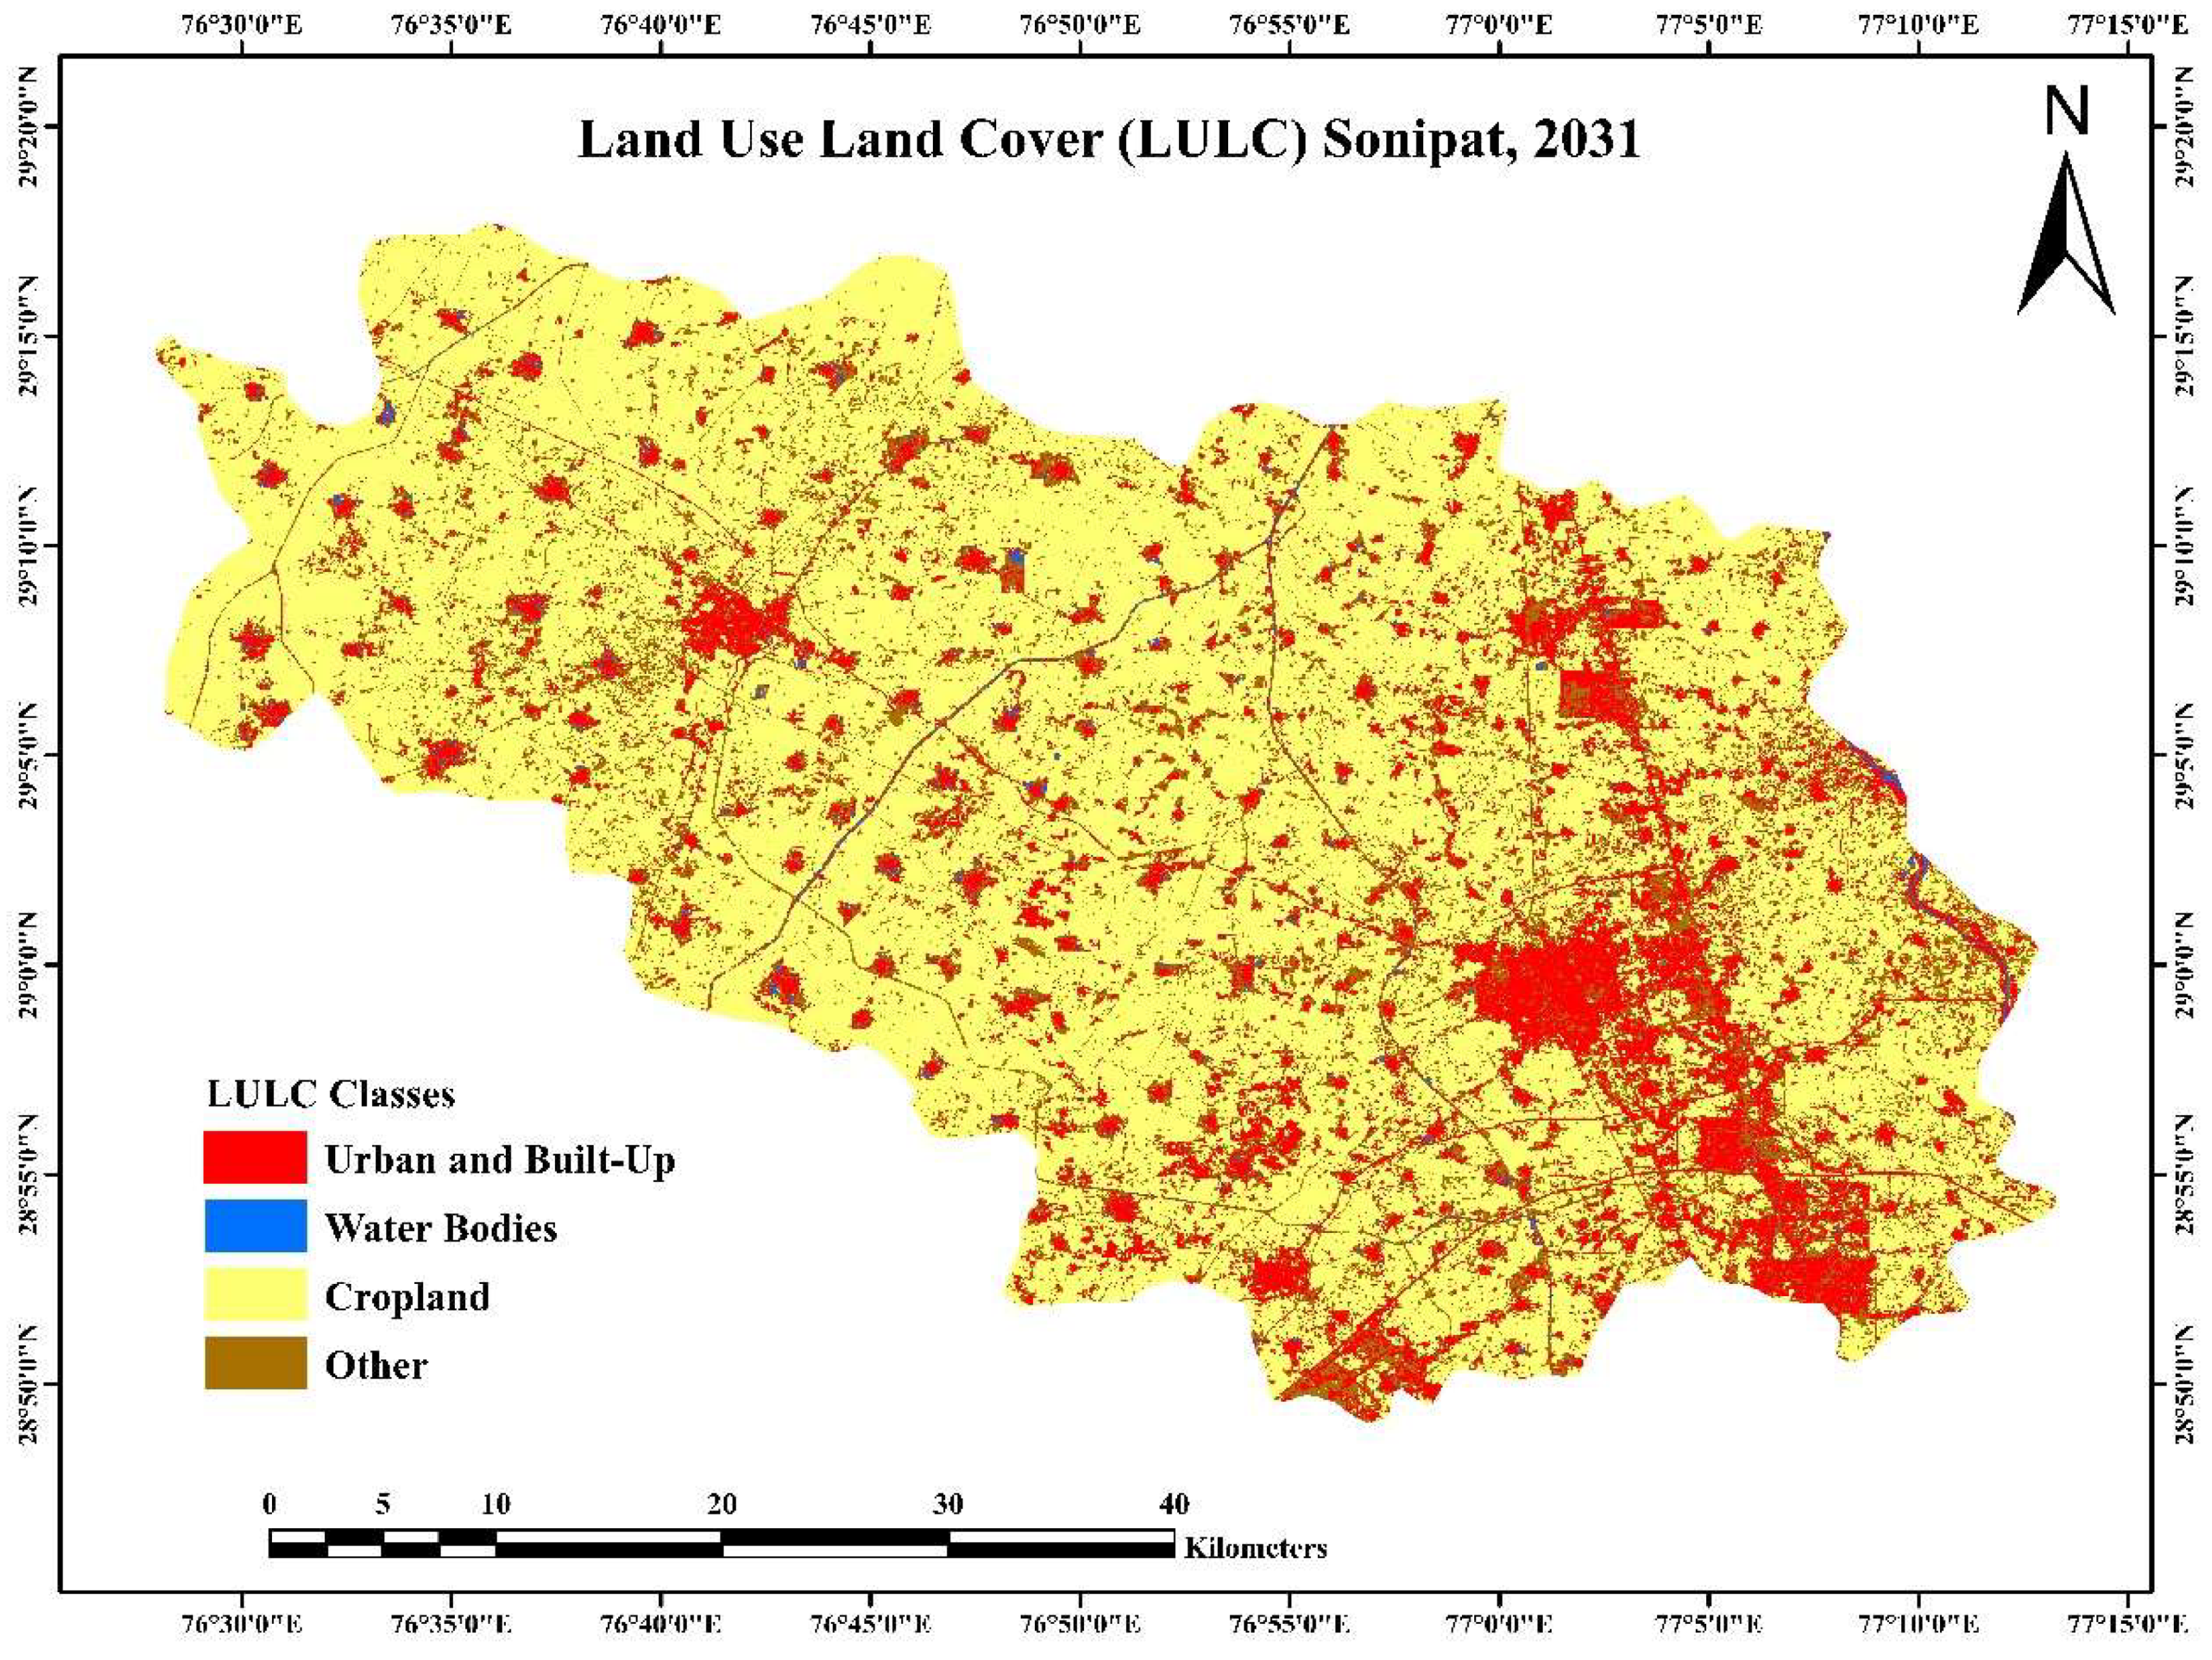
As mentioned earlier, a prediction was made for the year 2031 by using the QGIS MOLUSCE plugin. The results of this prediction are presented in Table 4 and Figure 5. Table 4 demonstrates how the LULC classes may evolve from 2021 to 2031. An increase in area can be seen in urban, built-up and other LULC class (5.04%, 3.87). Both the area of cropland and water bodies is expected to decline in the coming years. The extended LULC classes are represented by a variety of colors in Figure 5.

5. Conclusions

Predictions of LULC are absolutely necessary for the creation of plans that are capable of striking a balance between the efforts to conserve resources, competing user needs, and the pressures of development. To simulate and make predictions regarding the future LULC maps for the Sonipat district, the MOLUSCE plugin was utilized. Because of urbanization, the proportion of land that is classified as urban and built up within the LULC increased over the three decades (2011, 2021, and 2031) while the proportion of cropland decreased as a result of the influence of the capital region within the study area.

Author Contributions

M.K., D.R. and R.K. conceived and designed the study, and D.R. performed the research, and M.K. supervised the work. D.R. and M.K. analyzed the data. M.K., D.R. and R.K. also contributed to the editorial input. Conceptualization, methodology and formal analysis: D.R., M.K.; investigation: D.R., M.K.; visualization: R.K., D.R., M.K.; writing—original draft: D.R., M.K.; writing—review and editing: R.K. and M.K. All authors have read and agreed to the published version of the manuscript.

Funding

This research received no external funding.

Institutional Review Board Statement

Not applicable.

Informed Consent Statement

Not applicable.

Data Availability Statement

Not applicable.

Conflicts of Interest

The authors declare no conflict of interest.

References

  1. Lekha, S.L.S.; Kumar, S.S. Classification and Mapping of Land Use Land Cover Change in Kanyakumari District with Remote Sensing and GIS Techniques. Int. J. Appl. Eng. Res. 2018, 13, 158–166. Available online: http://www.ripublication.com (accessed on 10 September 2022).
  2. Kamaraj, M.; Rangarajan, S. Predicting the future land use and land cover changes for Bhavani basin, Tamil Nadu, India, using QGIS MOLUSCE plugin. Environ. Sci. Pollut. Res. 2022, 29, 86337–86348. [Google Scholar] [CrossRef] [PubMed]
  3. Twisa, S.; Buchroithner, M.F. Land-Use and Land-Cover (LULC) Change Detection in Wami River Basin, Tanzania. Land 2019, 8, 136. [Google Scholar] [CrossRef] [Green Version]
  4. Chamling, M.; Bera, B. Spatio-temporal Patterns of Land Use/Land Cover Change in the Bhutan–Bengal Foothill Region Between 1987 and 2019: Study Towards Geospatial Applications and Policy Making. Earth Syst. Environ. 2020, 4, 117–130. [Google Scholar] [CrossRef]
  5. Nedd, R.; Light, K.; Owens, M.; James, N.; Johnson, E.; Anandhi, A. A Synthesis of Land Use/Land Cover Studies: Definitions, Classification Systems, Meta-Studies, Challenges and Knowledge Gaps on a Global Landscape. Land 2021, 10, 994. [Google Scholar] [CrossRef]
  6. García-Álvarez, D.; Olmedo, M.T.C.; Mas, J.-F.; Paegelow, M. Land Use Cover Mapping, Modelling and Validation. A Background. In Land Use Cover Datasets and Validation Tools; Springer International Publishing: Cham, Swizerland, 2022; pp. 21–33. [Google Scholar] [CrossRef]
  7. Gondwe, J.F.; Lin, S.; Munthali, R.M. Analysis of Land Use and Land Cover Changes in Urban Areas Using Remote Sensing: Case of Blantyre City. Discrete Dyn. Nat. Soc. 2021, 2021, 8011565. [Google Scholar] [CrossRef]
  8. Taloor, A.K.; Kumar, V.; Kumar Singh, V.; Kumar Singh, A. Land Use Land Cover Dynamics Using Remote Sensing and GIS Techniques in Western Doon Valley, Uttarakhand, India; Springer: Singapore, 2020; pp. 37–51. [Google Scholar] [CrossRef]
  9. Megahed, Y.; Cabral, P.; Silva, J.; Caetano, M. Land Cover Mapping Analysis and Urban Growth Modelling Using Remote Sensing Techniques in Greater Cairo Region—Egypt. ISPRS Int. J. Geoinf. 2015, 4, 1750–1769. [Google Scholar] [CrossRef] [Green Version]
  10. Mohajane, M.; Essahlaoui, A.; Oudija, F.; Hafyani, M.E.; Hmaidi, A.E.; Ouali, A.E.; Randazzo, G.; Teodoro, A.C. Land Use/Land Cover (LULC) Using Landsat Data Series (MSS, TM, ETM+ and OLI) in Azrou Forest, in the Central Middle Atlas of Morocco. Environments 2018, 5, 131. [Google Scholar] [CrossRef] [Green Version]
  11. Singh, A.I.; Singh, K. Remote Sensing and GIS based Land Use Land Cover Analysis in Chandel District, Manipur, India. IOP Conf. Ser. Earth Environ. Sci. 2021, 889, 012046. [Google Scholar] [CrossRef]
  12. Alshari, E.A.; Gawali, B.W. Development of classification system for LULC using remote sensing and GIS. Glob. Transit. Proc. 2021, 2, 8–17. [Google Scholar] [CrossRef]
  13. Tassi, A.; Vizzari, M. Object-Oriented LULC Classification in Google Earth Engine Combining SNIC, GLCM, and Machine Learning Algorithms. Remote Sens. 2020, 12, 3776. [Google Scholar] [CrossRef]
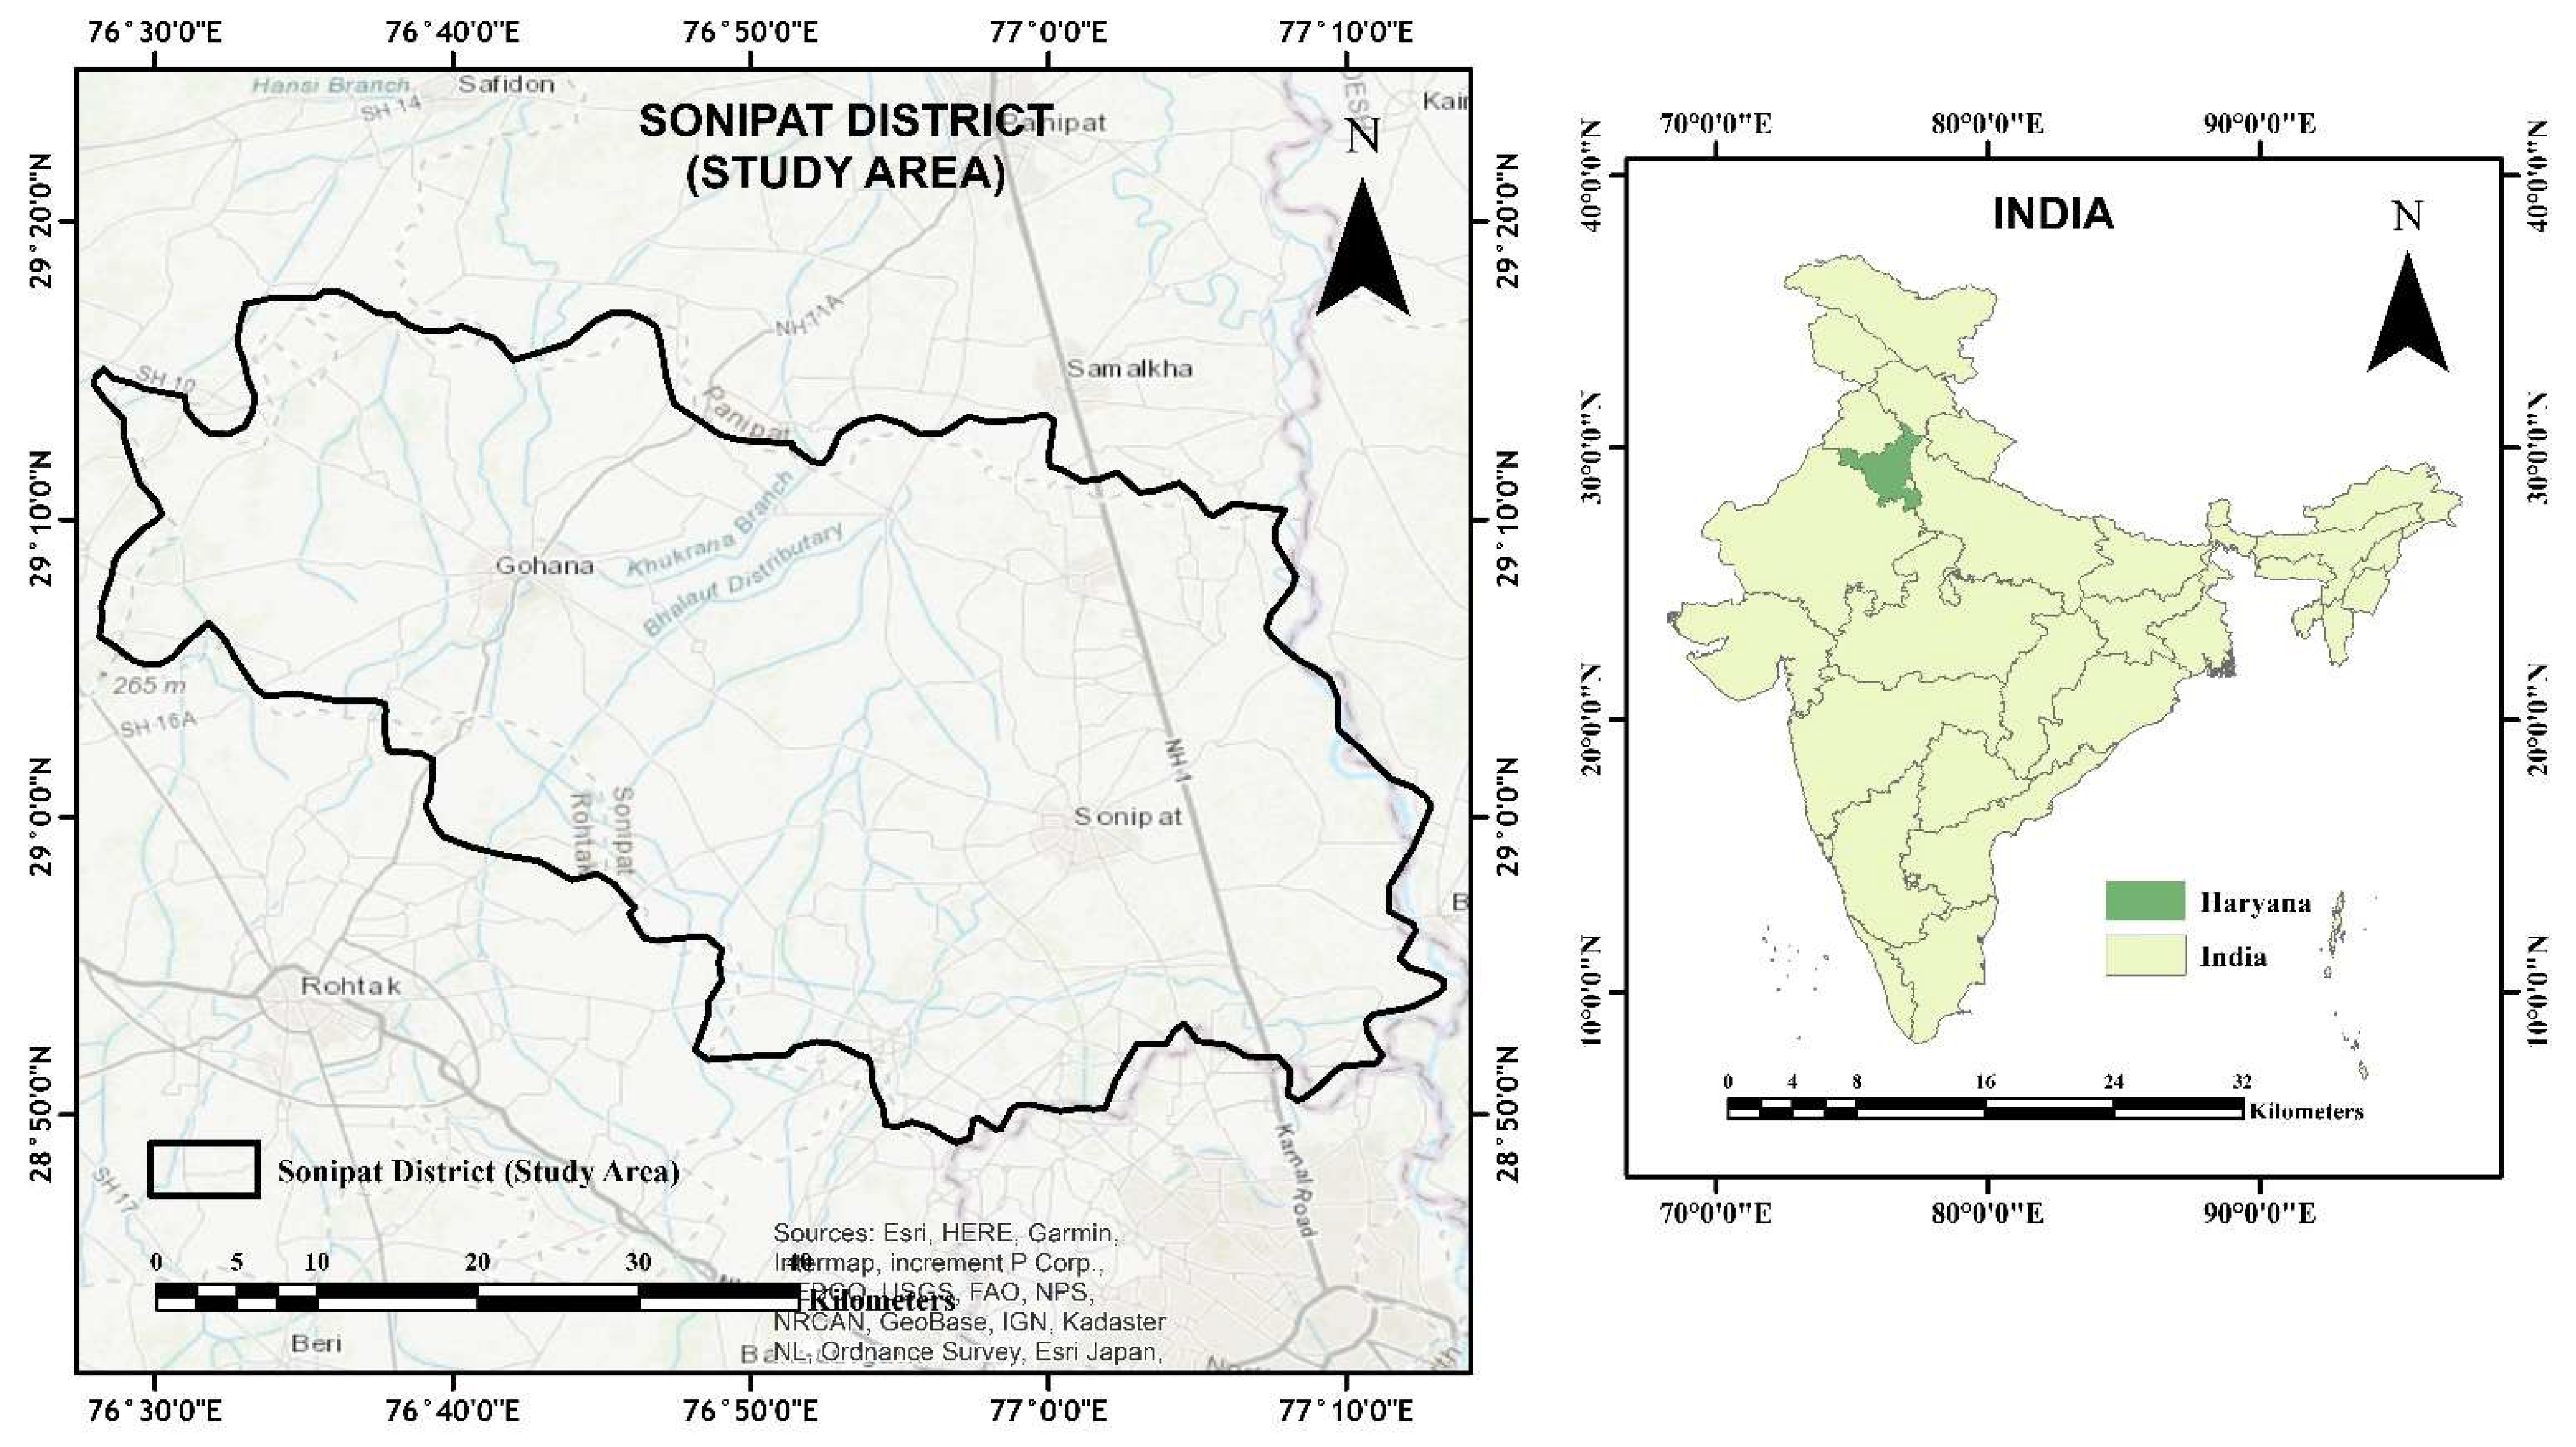
Figure 1. The geographic location of the area of study.
Engproc 27 00085 g001
Figure 2. Methodology flow chart.
Engproc 27 00085 g002
Figure 3. Sonipat district LULC classification: (a) 2011 classification; (b) 2021 classification.
Engproc 27 00085 g003
Figure 4. LULC change trends for 2011 and 2021.
Engproc 27 00085 g004
Figure 5. Forecast LULC map for the year 2031.
Engproc 27 00085 g005
Table 1. Evaluation of the accuracy assessment of the LULC classification for the year 2011.
Validation Error Matrix 2011
LULC Classes4 Elements
Urban and built-up16000
Water bodies01500
Cropland00140
Other (fallow land and barren land)10014
Validation overall accuracy0.98
Table 2. Evaluation of the accuracy assessment of the LULC classification for the year 2021.
Validation Error Matrix 2021
LULC Classes4 Elements
Urban and built-up30001
Water bodies01400
Cropland00180
Other (fallow land and barren land)00022
Validation overall accuracy0.98
Table 3. LULC change analysis for the years 2011 and 2021.
LULC Classes2011 Area km22021 Area km2Δ2011%2021%Δ %
Urban and built-up234.81319.8785.0610.6014.453
Water bodies30.5522.81−7.741.381.35−0.34
Cropland1843.611595.11−248.4983.2971.41−11
Other (fallow land and barren land)112.14267.84155.695.0612.797
Table 4. Analysis of the LULC forecast for 2031 based on the LULC maps of 2011 and 2021.
LULC Classes2021 Area km22031 Area km2Δ2021%2031%Δ %
Urban and built-up319.87431.54111.6714.4519.495.04
Water bodies22.8114.95−7.861.350.69−0.66
Cropland1595.111398.04−328.5271.4163.16−8.25
Other (fallow land and barren land)267.84368.8410112.7916.663.87
Publisher’s Note: MDPI stays neutral with regard to jurisdictional claims in published maps and institutional affiliations.