1. Introduction
Signature is a set of elements that makes it possible to characterize the presence, the type or the identity of an object by a sensor. Radar signature refers to radio-frequency scattering mechanisms on targets. In the military field, the lower the signature, the stealthier the aircraft. Radar cross section (RCS) of a target quantitatively represents the amount of energy scattered back to a radar, and depends on the aspect angle of the target as seen by the radar. In low resolution, the target is considered a single-point object, whereas high resolution allow target imaging and the localization of targets’ hot spots [
1]. Gathering a large amount of signature data inside a database is necessary for automatic target recognition using artificial intelligence or deep learning [
2,
3]. This database might also help to benchmark radar signature simulation software, since few measured signature data are available. In fact, indoor aircraft-signature measurements [
4] require either great dimension anechoic chambers (for scale 1 aircrafts) or measurements at very high frequencies (typically above 100 GHz for reduced scale aircraft models), which are challenging for model positioning.
We propose a method to build a database of aircraft radar signature from outdoor measurements, using a radar developped by ONERA in Palaiseau called HYCAM [
5] and ADS-B data from the OpenSky network [
6]. The database gathers both low-resolution and high-resolution measurement data; in this article, we only present low-resolution measurements. The radar works in designation mode: the tracking feature uses GPS position communicated by the aircraft via ADS-B (a set of information broadcasted by most commercial aircraft to indicate their position) in real time, thanks to the OpenSky Network real-time API (an API is a communication framework for to interface different comuters). Moreover, the retrieved data allow the database documentation and labeling (ICAO24 identification number, aircraft type, engine type, etc.). Finally, the ADS-B data provide information about the groundtruth of the target (time, speed, position, and heading), which is necessary for radar signature analysis. The method provides a manual operation mode and an automatic operation mode. In manual mode, radar operators carry out the measurements, i.e., they manually choose which plane to measure. In automatic mode, the software can select the targets according to various selection rules, which can help to enrich the database according to custom user goals (diversification or consolidation).
We validate the proposed methodology by comparing the ADS-B data with actual radar measurement and assess that the quality of speed and range data yielded by ADS-B is good enough to lift ambiguity and to automatically focus on the region of interest inside radar data. The steering of the radar and the inertial data of the aircraft allow assessing the aircraft attitude. We present the methodology for the automatic measurement and the building of the database, as well as several radar measurements of planes labeled by the OpenSky API.
2. Real-Time Radar Architecture
The HYCAM radar is an S-band radar with a center frequency around 3 GHz, designed in 2008 for radar signature measurements purposes and to carry out software-defined radar studies. The antennas are mounted on a 360° az / 45° elevation positioner, allowing target tracking within this field of regard. It has a full polarimetric capacity, and can use arbitrary waveforms (with either narrow and wide bandwidth). In this article, we use pulsed chirps, as described in
Section 3.2. Further information about HYCAM can be found in [
5]. The GPS coordinates of HYCAM are 48°42
47
N, 2°13
51
E, 175 m above sea level. The distances from the planes to the radar and the orientation of the turret use these coordinates as we detail in
Section 3.3.
2.1. Target Tracking and Radar Workflow
As aforementioned, OpenSky real-time data are treated to send instructions to the HYCAM positioner and track aircrafts. In this article, the tracking algorithm linearly extrapolates the ADS-B position of the planes to fill the gaps between successive packets of data. The turret receives azimuth and elevation instructions to orient toward the plane. A radar with an automatic tracking system may autonomously perform the pursuit of the target after this choice, but this is not the case in this work. As the aperture of the radar is relatively important (10° × 4°), the positioning errors should not impact the observation of the plane. A sanity check of the radar data and turret log can showcase whether there are missing data due to poor estimation of the position. The start time (GPS time) of radar acquisitions are recorded. Meanwhile, OpenSky data are also timestamped using Unix time. Both are synchronized during processing.
The data from the OpenSky API are used not only to perform tracking of the target but also for further processing of the data. In particular, they are recorded jointly with the acquisition and may be of use to estimate the aircraft position and to automatically document the entries of the database. In the following, “ADS-B quantity” refers to the value of a quantity given or computed from ADS-B data. It can be the distance from the target to the radar (ADS-B range) or the radial speed from the target to the radar (ADS-B speed). On the contrary, a “radar quantity” is estimated from the radar data.
2.2. Target Selection
The OpenSky API yields the current state of the aerial traffic, and this helps to choose the plane to be measured according to a set of criteria. Using both inertial properties (position, heading, etc.) and metadata (model, ICAO24 unique identification number of the airframe) of each plane, we build up a methodology to optimally choose a plane to be measured by the radar. We denote by respectively the inertial properties and the metadata about a plane p, and choose a utility function . We propose a basic algorithm to optimally choose the plane p to be measured:
At each time step, compute the utilities for all planes p in a given area around the radar.
If no plane is currently measured, then assess whether the maximum utility exceeds a certain threshold . If this is true, then the plane with the maximal utility becomes tracked by the radar.
If a plane is under observation and its utility goes lower than a threshold , the measurement is stopped. We introduce a hysteresis to avoid that the acquisition immediately stops in case of utility low stability.
If a plane with utility is under observation and the plane with utility has an utility which is substantially greater than , we allow for the system to switch from to . Typically , with to also introduce a hysteresis, to avoid that the system indefinitely switches between two planes with a close utility.
This algorithm is repeated until a stop command related to the size of the data gathered during the campaign is reached in order to avoid an overflow of the storage device.
This framework is very generic and can adapt to different sensor technologies. The utility function can implement exclusions criteria or hard constraints to match system limitations (turret mechanical stop). It can favor specific models or specific plane attitudes. This utility function can even depend on the state of the database: one can seek new plane models, or consolidate previous measurements by choosing similar conditions. For now on, the utility function we use is decreasing with distance to guarantee a good signal-to-noise ratio (SNR). The choices of the utility function and of the policy of selection can also add priority mechanisms, fuzzy logic or other advanced concepts such as those mentioned in [
7]. We use mechanical steering in our work; the utility and policy can be adapted to harness the assets of electronic beamsteering, such as the ability to dynamically switch between different areas.
3. Processing Workflow
The ADS-B data simplify the radar processing, and provide an estimation of the attitude of the measured aircraft to correlate it with the radar measurements.
3.1. Radar Equation
The radar equation [
8] gives the power of the electromagnetic wave, which is reflected back by a target and received by the radar:
The different terms of this equation represent all the phenomena from emission to reception of the electromagnetic wave:
is the received power, and the power emitted by the radar. This equation is a scattering equation and states that the power reflected is proportional to the power emitted,
R the distance between the target and the radar. The two factors are two spherical wave decays due to the two paths between the radar and the target (back and forth);
are the gains of the antenna in emission and reception. They can be different if the reception antenna is different from the emission antenna;
is called the radar cross section (RCS) of the target, and represents the effective area of the target as seen by the radar;
is the wavelength of the transmitted waveform.
The constants in this expression (gain, emitted power, and wavelength) can be compensated by a calibration procedure that we neither detail nor apply in the data shown in this work. In this paper, we focus on the time evolution of the RCS of the target and compare the ADS-B range and speed with the radar range and speed. We compensate for the
term to have consistent RCS values over a single acquisition, following the procedure detailed in
Section 3.3.
The radar equation actually applies to a single point target, whereas real targets are composed of several scattering centers with different radar range and radial speeds. Depending on the radar range and speed resolutions, the scattering centers might be separated by radar processing. We call aircraft range extension the maximum radar range difference between two scattering centers of the same target. The aircraft range extension is of the order of the largest dimension of the plane. Speed extension refers to the maximum radial speed difference scattered back from the aircraft to the radar.
3.2. Radar Parameters
In this work, the radar periodically sends chirp pulses [
9], with a period equal to the pulse repetition interval (PRI). Distance aliasing happens when the distance
D from the target to the radar is greater than the so-called ambiguous range
(where
c is the speed of light). The target is thought to be at a distance equal to
, without additional processing. When the radar records and simultaneously transmits its pulses, a portion of the transmitted power is received directly from the transmit antenna to the receive antenna and can corrupt the signature measurement so that the data in this time domain are often discarded. This is called coupling and is a blind spot of the radar and is related to the duration
of the pulse sent
. The distance resolution of the radar is given by the bandwidth
B of the waveform
.
The radial velocity of the target is measured by the Doppler effect experienced at the reflection of the pulse on the moving target. It is determined by a Fourier transform of the signal along the number of pulse axis. There is also a speed ambiguity due to a stroboscopic effect; the Doppler frequency is known modulo the pulse repetition frequency . The Doppler frequency, , relates to the velocity of the target v through , with , the central frequency of the signal. Thus the radial velocity of the target is known modulo the speed ambiguity .
In the following, we use , , and , giving a distance ambiguity of , a blind zone of , a range resolution of and an ambiguous speed .
3.3. Ambiguity Lifting
Knowing the actual radar range is necessary to estimate the RCS of aircraft in order to compensate the
term of Equation (
1). However, radar range and speed measurements can be ambiguous as it is sketched in
Section 3.2. Techniques based on the Chinese remainder theorem can lift range and speed ambiguities [
10], but they require specific waveform schemes. ADS-B positioning (latitude, longitude and altitude) and speed data (ground speed and vertical rate) allow the computation of ADS-B range and ADS-B speed to help lifting ambiguities. Let
O be the radar location, and
A the aircraft location. ADS-B range is equal to
. The track angle, ground speed and vertical rate provided by OpenSky data are used to estimate the speed vector
of the aircraft. Then, the ADS-B radial speed is given by
. A positive speed means that the aircraft flies away from the radar.
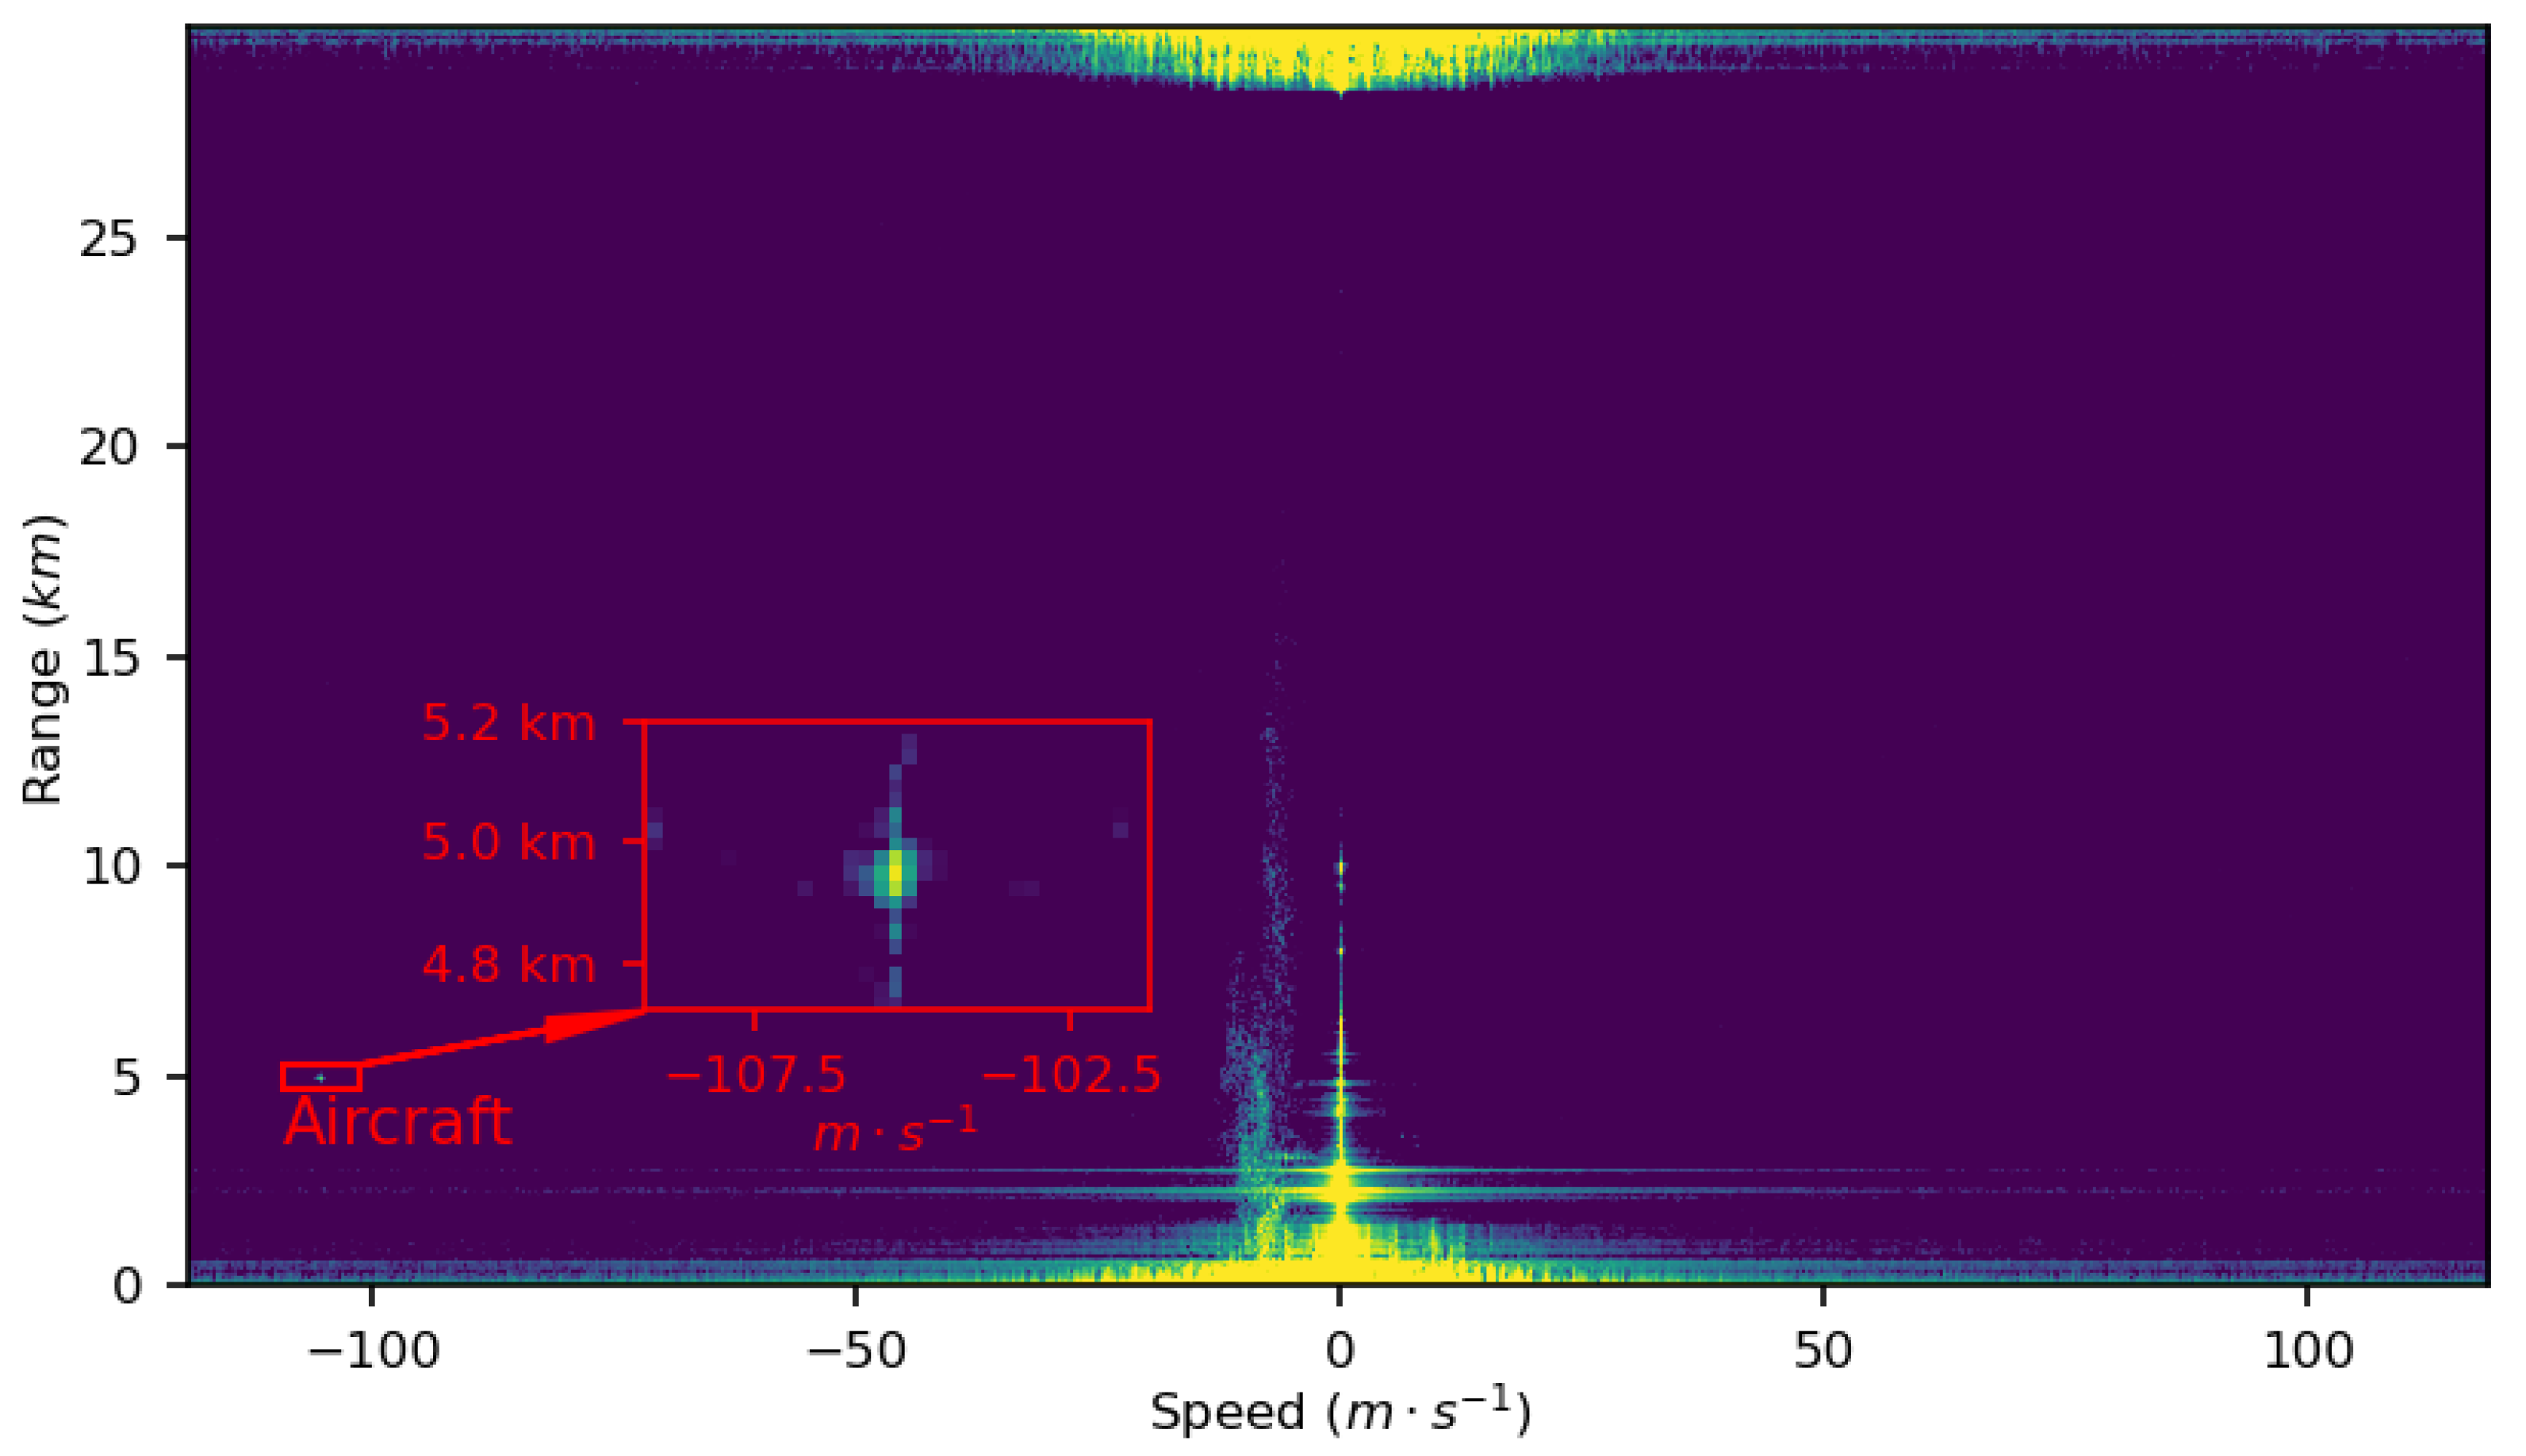
Figure 1 shows a Doppler–range map, representing the amplitude of the radar signal as a function of the radial velocity of the target along the
x-axis and the range of the target in the
y-axis. The horizontal line near the top and bottom of the figure are due to the coupling with the emission of the radar. The vertical line in the center of the
x-axis represents the return of the ground (clutter), which is indeed at zero speed. The cloud of nonzero data at around
speed and from 0 to 15 km range is the radar return of the rain captured during the measurement. If the signature of the target dwells in the coupling, the clutter or the rain cells, the data can be corrupted. In this map, the range and speed of the aircraft is ambiguous: the radar measurements state that the aircraft is located at 4.95 km from the radar, at a radar speed of
, whereas the ADS-B range is 35.0 km, and the ADS-B speed is 135
. ADS-B range and speed make ambiguity lifting straightforward.
3.4. Data Reduction
The radar continuously records data, of which the aircraft signature only occupies a fraction, which we call the region of interest of radar data, as shown by the inset in
Figure 1. The signature data are indeed located in a red area around the ADS-B position of the aircraft in Doppler–range maps, which is only a small portion of the total range swath (
km) and speed swath (
). Hence, the signature data are cropped thanks to OpenSky data. An interpolation step is performed around the maximum value in the region of interest to compute the radar range and speed with a sub-cell accuracy.
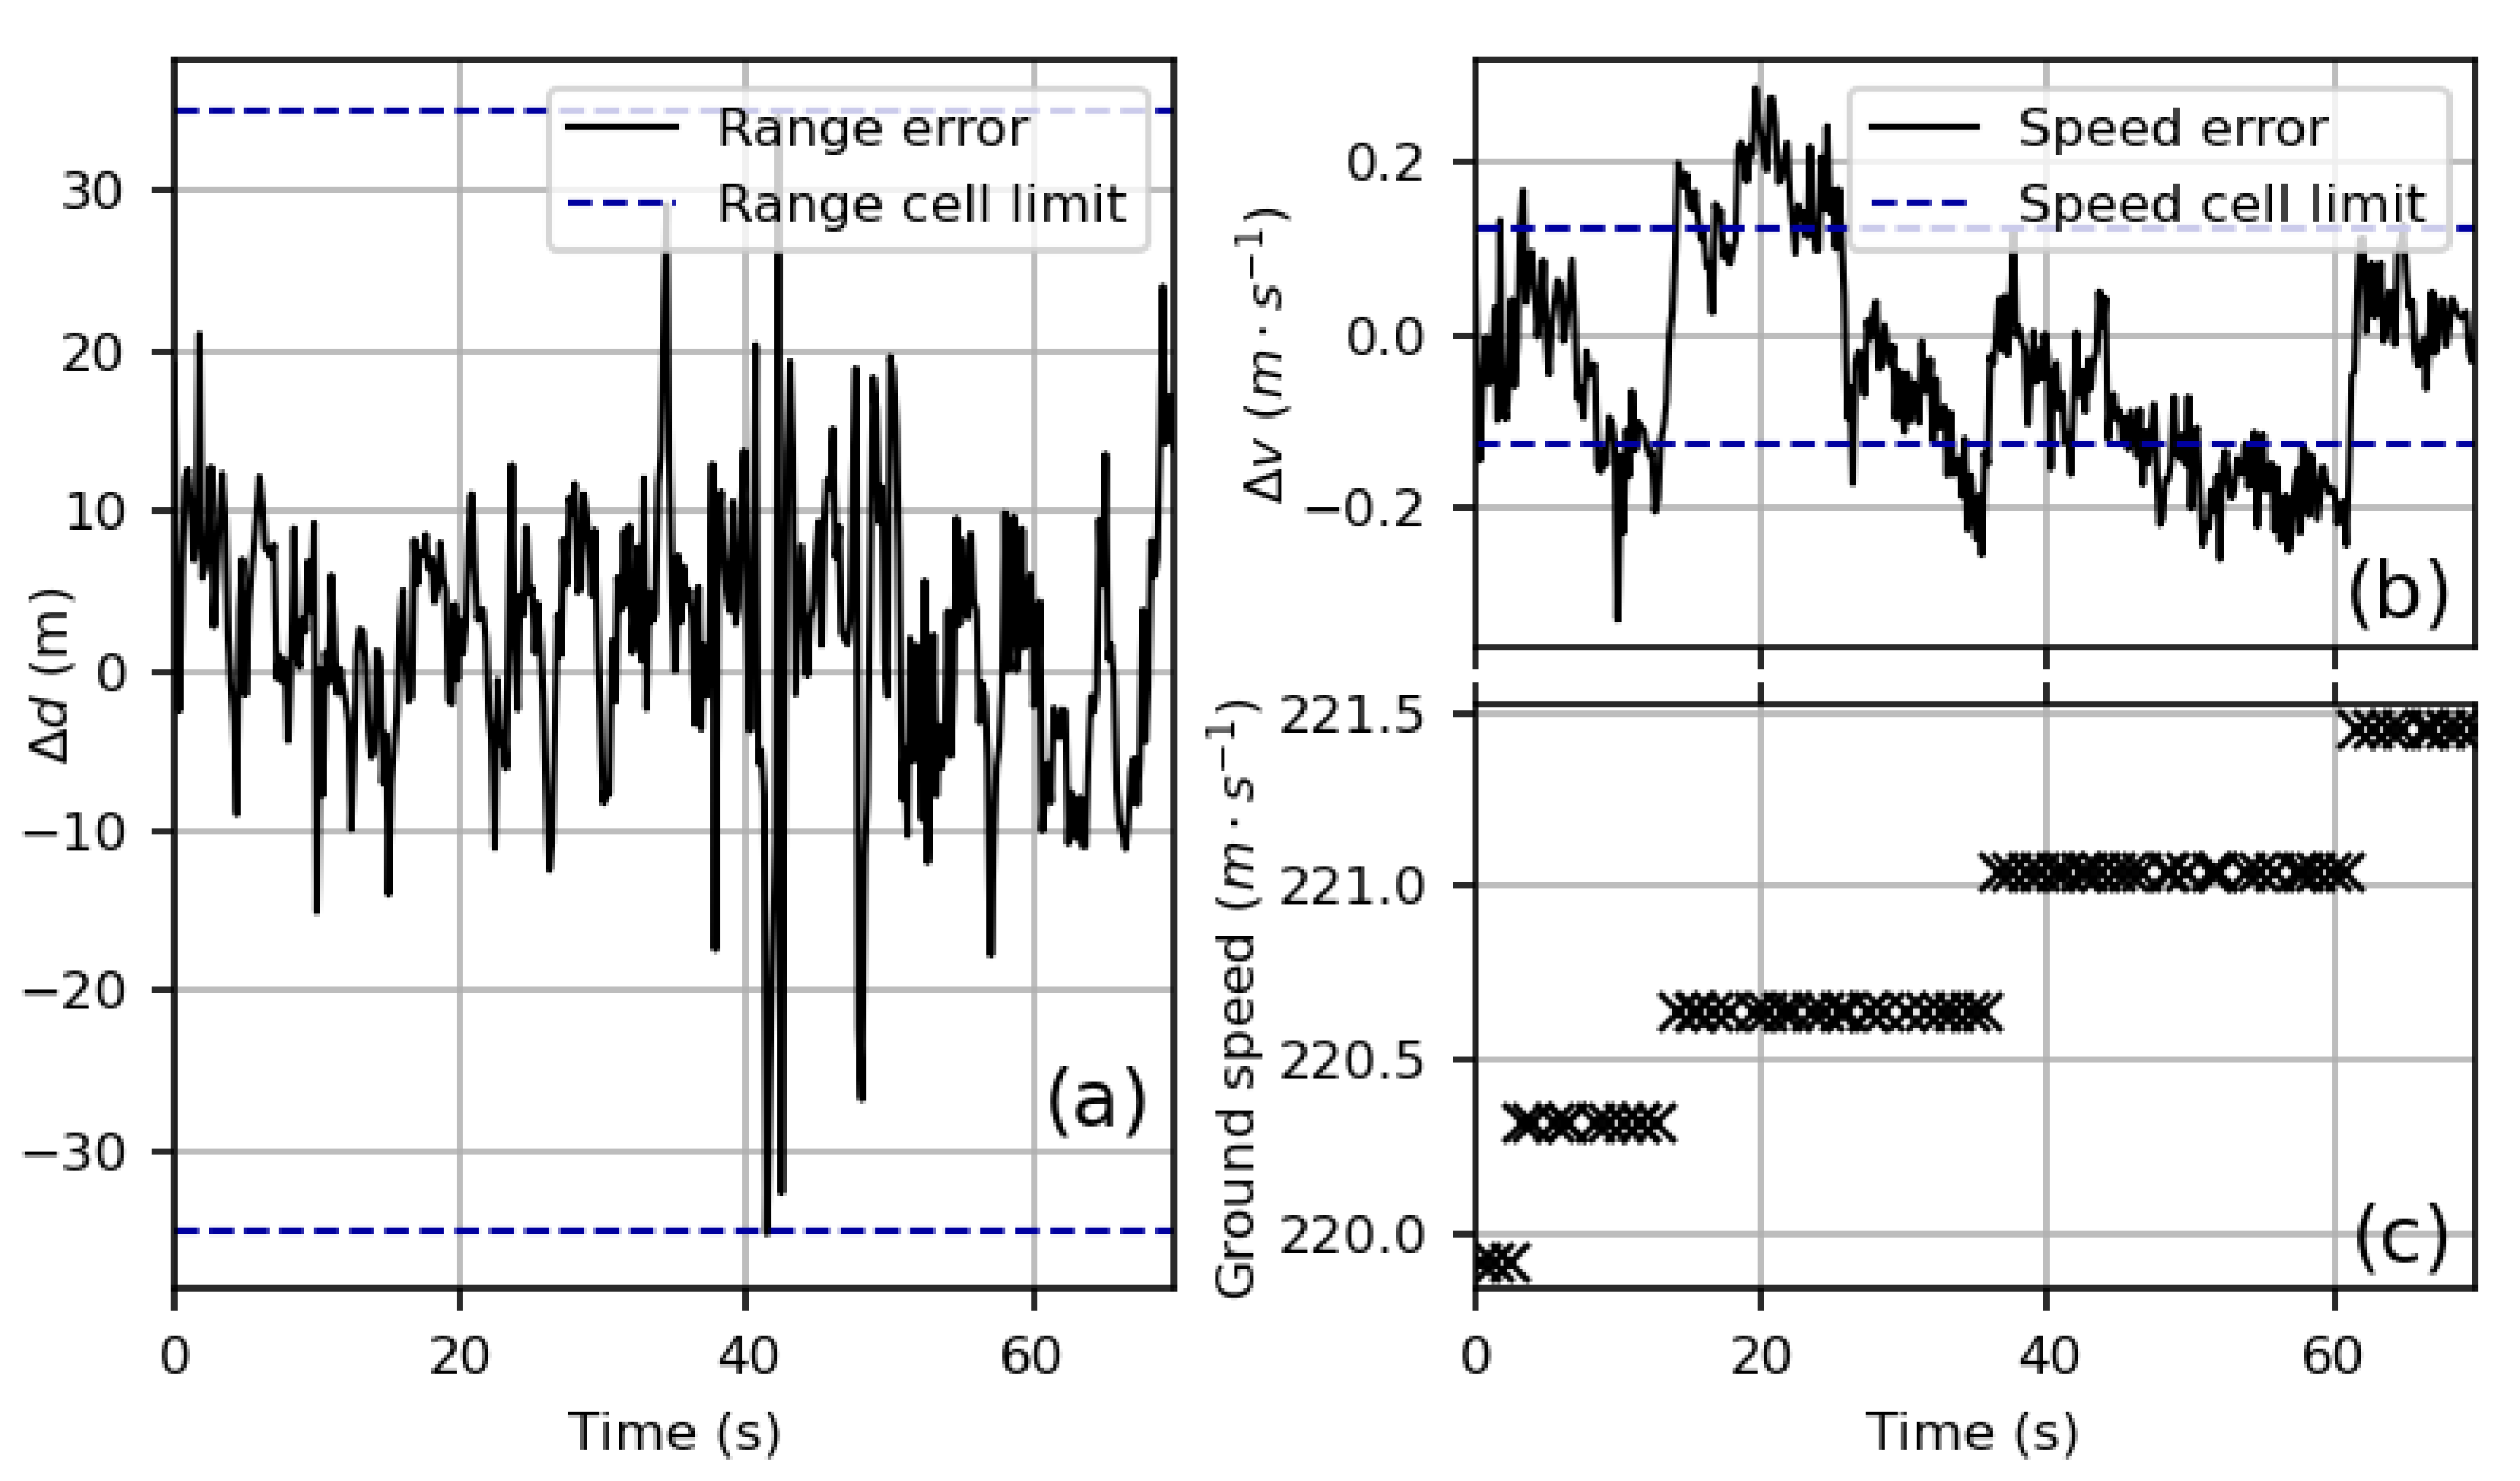
Figure 2a,b show the difference between radar and ADS-B range and speed, for the aircraft with ICAO24 4b1a2a flying the 7 October 2022 between 08:26:36 UTC and 08:27:46 UTC, computed with the method described in
Section 3.3. In this example, the standard deviation of the difference between radar and ADS-B range is 8.5 m. The difference between radar and ADS-B speed remains between
. We observe steps on the speed difference chart, which can be explained by the quantization of the ground speed (and vertical rate) data provided by OpenSky, as illustrated in
Figure 2b,c.
In addition to this quantization, the remaining differences in range and speed may be due to a limited accuracy of radar range and speed measurements in case of low SNR. Moreover, ADS-B provides the GPS position and speed of a fixed point of the aircraft, whereas the radar measures the range and speed of scattering centers whose location can vary with aspect and differ from the GPS point.
Yet, the remainder between radar measurement and OpenSky data is small, and makes it possible to automatically keep the relevant data for RCS measurement and analysis. To protect from the remaining errors, the method described in this article keeps a range swath of ±300 m around the ADS-B range, and a speed swath of ±4
around the ADS-B speed. In
Figure 1, the swath of interest is inside the red frame. This significantly reduces the amount of data stored in the database.
3.5. RCS Computation
During the data reduction step presented in
Section 3.4, the maximum amplitude in the signature data is measured, which is corrected by the unambiguous radar range (following Equation (
1)), leaving only constant factors multiplying the RCS. A calibration process remains mandatory to yield actual RCS values.
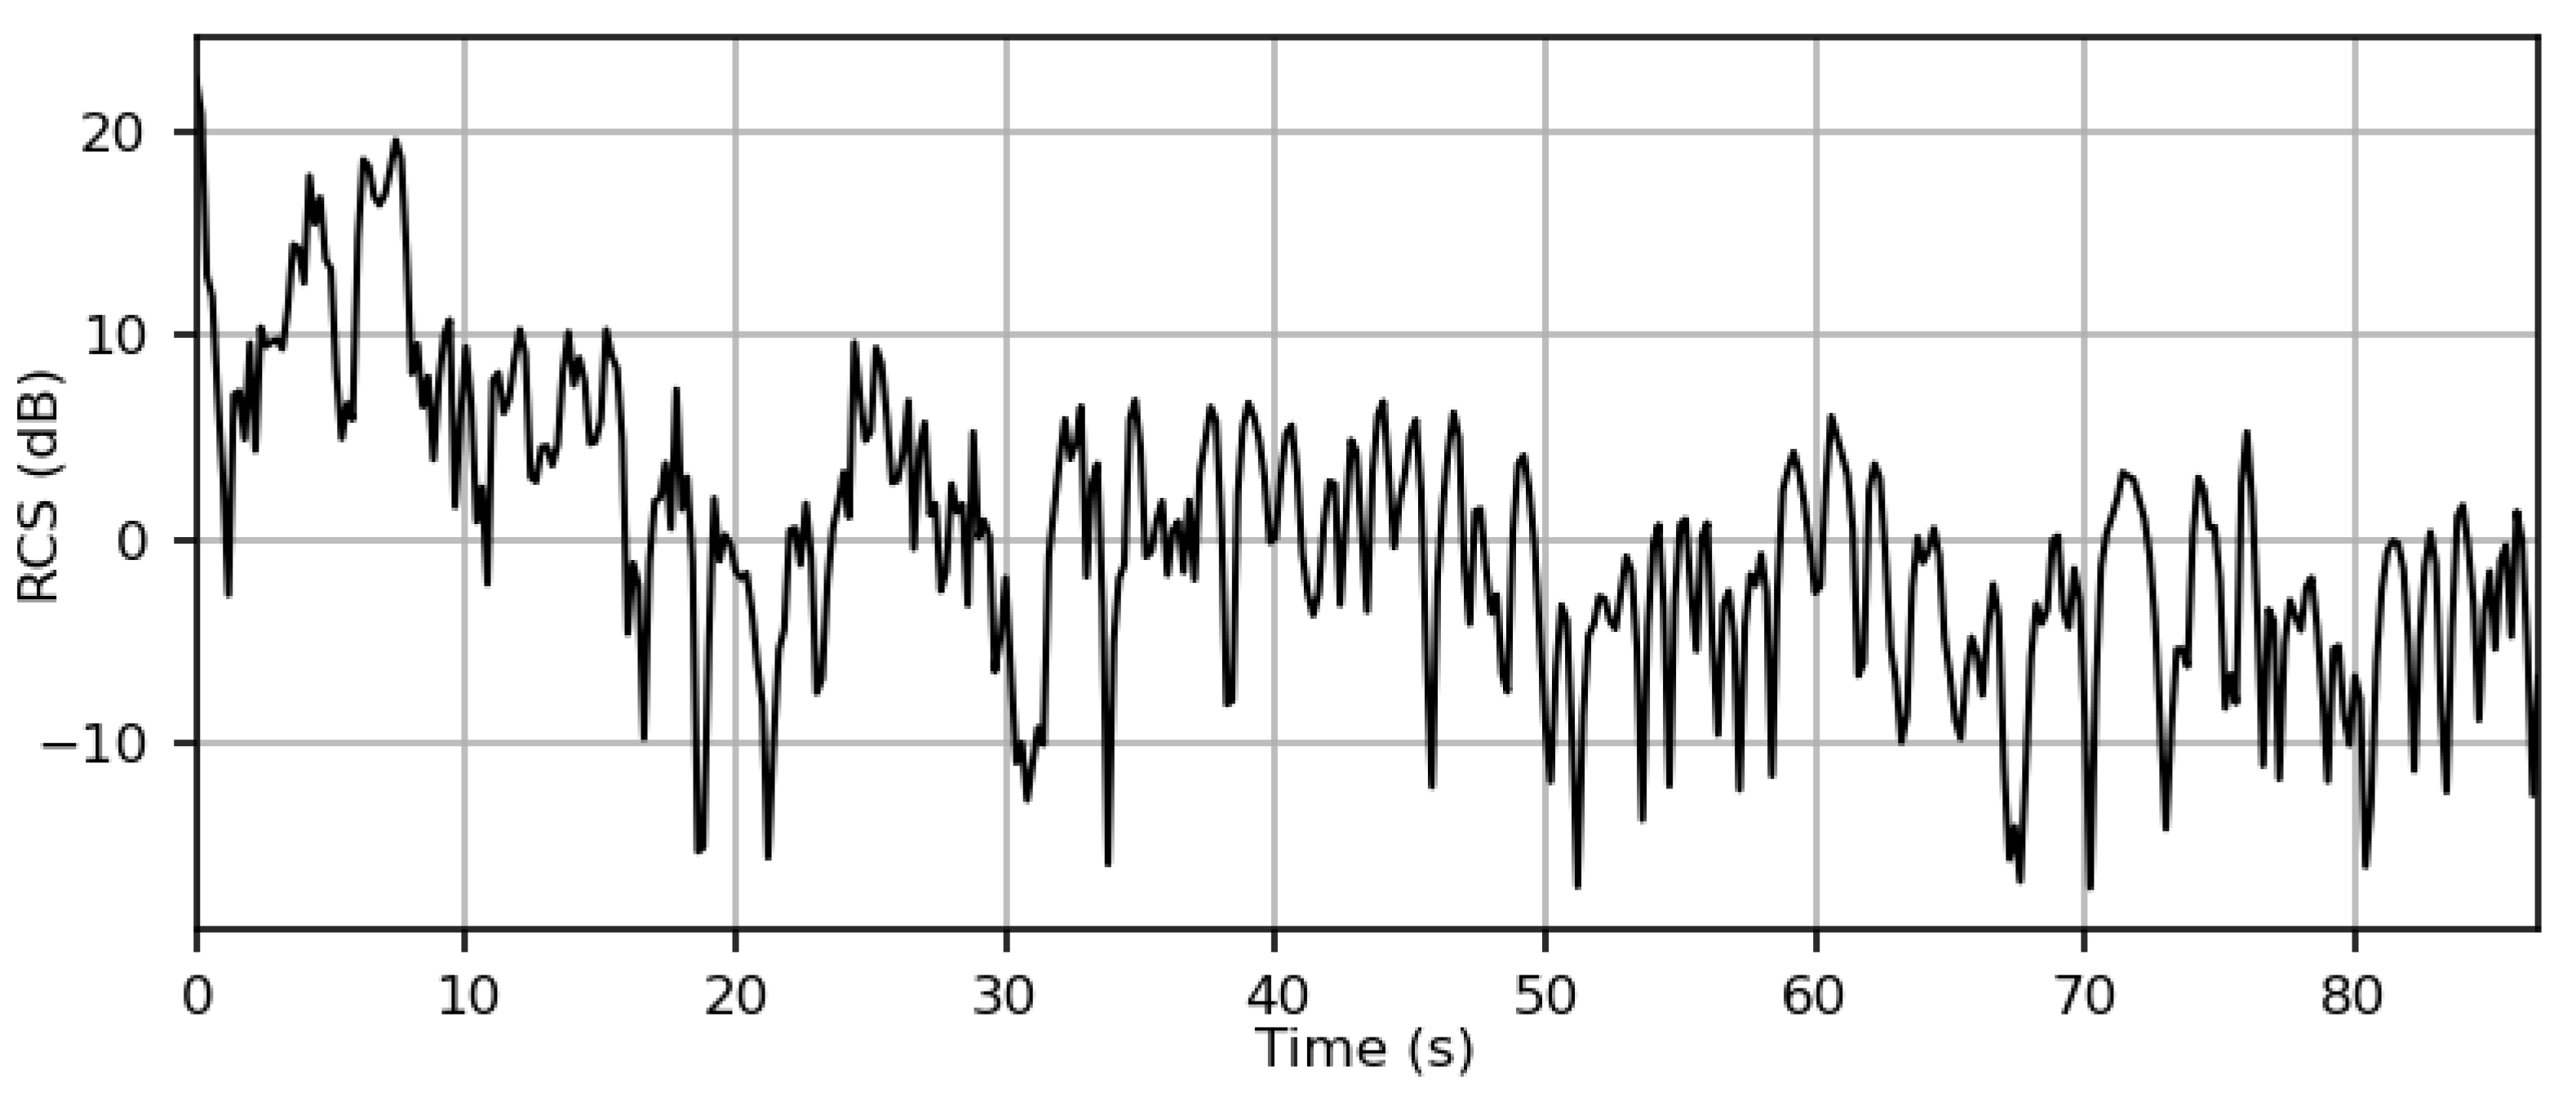
Figure 3 shows the computed RCS as a function of time for the plane with ICAO24 46316e flying the 12 October 2022 between 12:05:59 UTC and 12:07:26 UTC. As a reminder, the signatures shown in this article are not calibrated—here, the plotted RCS is centered around its mean value. The signature of the aircraft fluctuates over almost 35 dB, due to changes of the aspect angle of the aircraft. The RCS is maximal in the beginning, when the speed vector of the aircraft and the radar steering vector are almost orthogonal. Such measurements are of great interest to study and build radar signature statistical models.
3.6. Aspect Angle Computation
A surveillance radar shall detect aircraft regardless of their relative orientation to the radar, and this orientation continuously evolves along the trajectory. As the RCS of an aircraft strongly varies with aspect angles (see
Figure 3), the specifications of a radar must account for this fluctuation to guarantee performance of detection. Thus, signature analysis studies radar signatures as a function of aspect angle. Estimating the attitude of the aircraft via ADS-B data tags RCS data with aspect estimates in order to map the RCS vs. aspect angle function.
Figure 4 illustrates the two orthonormal bases we use in this work: one for the radar
,
,
and one for the aircraft
,
,
. We denote by
the transfer matrix corresponding to basis
. The coordinates of the vectors are computed in a common
basis using the GPS and ECEF (Earth Centered Earth Fixed, a cartesian coordinate system for locating objects) coordinates [
11].
is the radar steering vector,
the vector along the horizontal of the antenna and
the vector oriented along the vertical of the antenna. The aircraft is described by three principal axes, defining three rotation angles: roll, pitch and yaw. We compute the basis
using the position of the aircraft from ADS-B data and assuming that roll, pitch and yaw values are known. Any vector
in
can be written in
according to Equation (
2).
can be decomposed as the product of three rotation matrices defined by the three Euler angles, yaw (
), pitch (
) and roll (
):
, where · is the matrix product. These are the apparent aspect angles of the aircraft seen from the radar. Actually, the yaw, pitch and roll of the aircraft are not completely determined from OpenSky data. We assume that
is co-linear to the speed vector of the aircraft, meaning that the pitch is the steep of the trajectory, the yaw is the track of the trajectory and that the roll is zero. In fact, the three angles differ in windy conditions or during maneuvers. This estimation can be further refined by using external data from extended mode S as discussed in
Section 4.2. The estimated aspect angles are stored in the database for the sake of signature analysis.
4. Database Presentation
This part gives an overview of the two OpenSky Network databases that allows retrieving the flight data, and presents the data stored in our radar signature database.
4.1. ADS-B Sources
The methodology of this article relies on ADS-B data for real time tasks (aircraft selection, tracking, labels) and post-processing tasks (signal processing and RCS computation). Real-time ADS-B data are yielded by the real-time OpenSky API [
6], which is recorded live. It is compared with actual turret positions to assess whether the tracking feature worked correctly. If not, the data are not stored in the database.
The Impala state_vectors_data4 database [
12] is the source for the processing proposed in
Section 3. It provides aircraft positioning data sampled at around 1 Hz, ten times quicker than our requests to the real-time API. In the case of missing Impala data, positions from the real-time database remain available. These additional position data allow to estimate the error between the extrapolated and actual positions.
4.2. Mode-S Data
The OpenSky Network also provides access to the Impala rollcall_replies_data4 database, which contains the Mode-S messages. Some of these messages are known as Comm-B Data Selector (abbreviated as BDS) and contain information on the attitude of the aircraft. BDS 50 messages contain the roll information and BDS 60 messages contain the heading information, which allows for better knowledge of the attitude of the aircraft. The type of the message must be inferred and parsed accordingly to their type, with a method presented in [
13] implemented in the pyModeS python library [
14]. If present, these data improve the knowledge of the attitude of the plane.
4.3. Information Stored in the Database
The database contains measurement descriptors used to perform queries and to facilitate signature analysis. It provides direct aircraft signature information as well as Doppler–range maps so that users can build their own processing chain. Therefore, the database stores low level data:
Reduced Doppler ranges yielded by the technique described in
Section 3.4.
ADS-B data from OpenSky Impala state_vectors_data4 database.
Mode-S raw data from OpenSky Impala rollcall_replies_data4 database.
GPS start time, radar location and acquisition parameters (bandwidth, PRI, etc.).
Turret position and target designation as a function of time.
From this low-level data, custom treatments allow users to build signature data. This makes signature analysis as a function of time or aspect angle possible using the estimated attitude. The database can be queried by the ICAO24 identification number, aircraft type (when available) and date of the measurement.
4.4. Limitations Due to the Data Sources
ADS-B data can present several sources of errors and are not entirely reliable [
15]. In addition, the extrapolation algorithm used in this work poorly behaves when the plane is turning such that turret steering can be improved. Several sanity checks can be performed to gauge the quality of the gathered data. As sketched in
Section 4.1, the forecast plane position is compared with the consolidated ADS-B logs of the Impala database. This allows gauging the error in the extrapolating scheme, and can be useful to test tracking algorithms for planes. A bad steering of the turret toward the target induces a total loss of signal. Good signature data feature high SNR, which is impacted by the range and position inside the lobe.
Uncertainties on the inertial quantities also affect the estimation of the attitude of the plane. The true angle of observation can deviate from the angle of observation of the turret due to a bad estimation of the position. Yaw and pitch can only be approximated by the direction of the velocity of the plane as computed from ADS-B position data. Roll data and consolidated yaw data can be available a posteriori with the mode-S messages. In the absence of these data, uncertainty on the axis of the plane might be important, especially during turns, but can be bounded. A detailed computation of these uncertainties is beyond the scope of this work, but can entirely be performed offline.
5. Discussion
This article highlights the possibility to automatically build a labeled RCS database of commercial aircraft by using the OpenSky live API. Using the plane coordinates transmitted by ADS-B, an extrapolation of the trajectories allows tracking planes by the mechanical turret of the radar to measure their radar signature. The OpenSky data are also used to locate the region of interest inside the radar data and to deal with ambiguities and distance correction. The ADS-B data from OpenSky match the required accuracy to track planes with our radar, as shown by a comparison between ADS-B and radar quantities. The state of aerial traffic yielded by OpenSky is also of use to build an algorithm able to automatically choose a plane to be measured, using a framework of utility coupled to simple policies to choose planes matching an optimal criterion. This methodology is a first step for building a database of in situ radar signatures. An estimation of the attitude of the plane allows to map the signature with an estimation of the orientation of the plane with respect to the antenna.
This methodology is versatile and can adapt to other systems. The building blocks are a positioner (mechanical turret and beam steering) and a sensor (radar, infrared, optical, and camera). This framework allows automatically gathering measurements to build plane-related databases and can support the design of surveillance and tracking algorithms. For databases, automatic measurements with labels are necessary for many advanced data-processing applications (machine learning, recognition, and statistical analysis). Further work around the automatic decision framework might help to specifically tailor the measurements to put in the database in order to answer a specific question (focus on specific models or aspect angles…). A comparison of extrapolation algorithms can be based on the secondary data of trajectory yielded by OpenSky, and background checks of the difference between steering data and ADS-B data can help tuning parameters of a control process. A ground truth might help to design surveillance algorithms using a steering beam to optimize the share of sensor time between search and track. The offline plane trajectory database also helps to specify realist situations.
Author Contributions
Conceptualization, methodology and writing, M.R., N.G. and P.B.; software, A.R., M.R., P.B. and N.G. All authors have read and agreed to the published version of the manuscript.
Funding
This research was funded by ONERA.
Institutional Review Board Statement
Not applicable.
Informed Consent Statement
Not applicable.
Data Availability Statement
Conflicts of Interest
The authors declare no conflict of interest.
Abbreviations
| ADS-B | Automatic Dependent Surveillance Broadcast |
| API | Application Programming Interface |
| BDS | Comm-B Data Selector |
| ECEF | Earth-centered, Earth-fixed |
| GPS | Global Positioning System |
| ICAO | International Civil Aviation Organization |
| PRI | Pulse Repetition Interval |
| RCS | Radar Cross Section |
References
- Titin-Schnaider, C.; Brouard, P. Full-polarimetric analysis of MERIC air targets data. In Proceedings of the RTO Sensors and Electronics Technology Panel (SET) Symposium, Oslo, Norway, 11–13 October 2004. [Google Scholar]
- Oh, B.-S.; Guo, X.; Wan, F.; Toh, K.-A.; Lin, Z. Micro-Doppler Mini-UAV Classification Using Empirical-Mode Decomposition Features. IEEE Geosci. Remote. Sens. Lett. 2018, 15, 227–231. [Google Scholar] [CrossRef]
- Gusland, D.; Christiansen, J.M.; Torvik, B.; Fioranelli, F.; Gurbuz, S.Z.; Ritchie, M. Open Radar Initiative: Large Scale Dataset for Benchmarking of micro-Doppler Recognition Algorithms. In Proceedings of the 2021 IEEE Radar Conference (RadarConf21), Atlanta, GA, USA, 7–14 May 2021; pp. 1–6. [Google Scholar]
- Gürel, L.; Bağcı, H.; Castelli, J.C.; Cheraly, A.; Tardivel, F. Validation through comparison: Measurement and calculation of the bistatic radar cross section of a stealth target. Radio Sci. 2003, 38, 1046. [Google Scholar] [CrossRef]
- Brouard, P.; Constancias, L.; Brun, A.; Attia, S.; Peyret, J.; Dreuillet, P. Hycam: A new S band surface radar testbed. In Proceedings of the IET International Radar Conference 2013, Xi’an, China, 14–16 April 2013; pp. 1–4. [Google Scholar] [CrossRef]
- Schäfer, M.; Strohmeier, M.; Lenders, V.; Martinovic, I.; Wilhelm, M. Bringing Up OpenSky: A Large-scale ADS-B Sensor Network for Research. In Proceedings of the 13th IEEE/ACM International Symposium on Information Processing in Sensor Networks (IPSN), Berlin, Germany, 15–17 April 2014; pp. 83–94. [Google Scholar]
- Charlish, A.B. Autonomous Agents for Multi-Function Radar Resource Management. Ph.D. Thesis, University College London, London, UK, 2011. [Google Scholar]
- Skolnik, M.I. Radar Handbook. 1970. Available online: https://trid.trb.org/view/49654 (accessed on 2 February 2022).
- Klauder, J.R.; Price, A.C.; Darlington, S.; Albersheim, W.J. The theory and design of chirp radars. Bell Syst. Tech. J. 1960, 39, 745–808. [Google Scholar] [CrossRef]
- Li, X.; Xia, X.-G.; Liang, H. A robust Chinese remainder theorem with its applications in moving target Doppler estimation. In Proceedings of the 2010 IEEE Radar Conference, Arlington, VA, USA, 10–14 May 2010; pp. 1289–1294. [Google Scholar] [CrossRef]
- Zhou, Y.; Leung, H.; Blanchette, M. Sensor alignment with earth-centered earth-fixed (ECEF) coordinate system. IEEE Trans. Aerosp. Electron. Syst. 1999, 35, 410–418. [Google Scholar] [CrossRef]
- A Quick Guide To OpenSky’s Impala Shell. Available online: https://opensky-network.org/data/impala (accessed on 19 October 2022).
- Sun, J. The 1090 Megahertz Riddle: A Guide to Decoding Mode S and ADS-B Signals; TU Delft OPEN Publishing: Delft, Netherlands, 2021; ISBN 978-94-6366-402-8. [Google Scholar] [CrossRef]
- Sun, J.; Vû, H.; Ellerbroek, J.; Hoekstra, J.M. pymodes: Decoding mode-s surveillance data for open air transportation research. IEEE Trans. Intell. Transp. Syst. 2019, 21, 2777–2786. [Google Scholar] [CrossRef]
- Schäfer, M.; Strohmeicr, M.; Smith, M.; Fuchs, M.; Lenders, V.; Martinovic, I. OpenSky report 2018: Assessing the integrity of crowdsourced mode S and ADS-B data. In Proceedings of the 2018 IEEE/AIAA 37th Digital Avionics Systems Conference (DASC), London, UK, 23–27 September 2018. [Google Scholar]
| Publisher’s Note: MDPI stays neutral with regard to jurisdictional claims in published maps and institutional affiliations. |
© 2022 by the authors. Licensee MDPI, Basel, Switzerland. This article is an open access article distributed under the terms and conditions of the Creative Commons Attribution (CC BY) license (https://creativecommons.org/licenses/by/4.0/).


